Embed Size (px)
Citation preview
8662 Phys. Chem. Chem. Phys., 2013, 15, 8662--8671 This journal is c the Owner Societies 2013
Cite this: Phys. Chem.Chem.Phys.,2013,15, 8662
The fast Z-scan method for studying working catalyticreactors with high energy X-ray diffraction: ZSM-5 inthe methanol to gasoline process†
David S. Wragg,*a Francesca L. Bleken,a Matthew G. O’Brien,b Marco Di Michiel,c
Helmer Fjellvåga and Unni Olsbyea
The methanol to gasoline process over the zeolite catalyst ZSM-5 in a lab-sized reactor bed (4 mm diameter)
has been studied in operando with high energy synchrotron X-ray diffraction. The fast z-scan method was
used, scanning the reactor repeatedly and at speed through the X-ray beam. The X-ray diffraction data were
processed using high throughput parametric Rietveld refinement to obtain real structural parameters. The
diffraction data show only very subtle changes during the process and this allows us to demonstrate
the combination of very large data volumes with parametric Rietveld methods to study weak features of the
data. The different possible data treatment methodologies are discussed in detail and their effects on the
results obtained are demonstrated. The trends in unit cell volume, zeolite channel occupancy and crystallite
strain indicate that more or larger reaction intermediates are present close to the reactor outlet.
Introduction
Over the last decade X-ray diffraction studies of chemicalreactions have moved from being a relatively niche area ofscience providing limited information on areas such as zeolitesynthesis to a much more generally applicable method.1–21
Recent advances in high energy X-ray detectors22 and Rietveldprocessing methods23 now allow us to study reactions withexcellent time resolution and even space resolution, while obtainingreal crystal structure data.3–6,24–28 It is now even possible to obtainthree-dimensional tomographic data for working catalysts at a speedcomparable to that of some industrial catalytic reactions.29–32
One excellent method for obtaining useful data on reactionswhich take place in catalytic reactor beds is the Z-scanningapproach – scanning the reactor at speed through the X-raybeam. This allows us to observe variations in the compositionof the catalyst during the progress of the reaction, for example inthe molybdenum oxide oxidation catalyst system.33 Such analysis
is possible with relatively poor diffraction data, using singlecharacteristic peaks to identify the phases. This very basicanalysis of the X-ray data is very useful, indeed, it is probablythe most common application of X-ray diffraction in general,but more sophisticated analysis can yield many levels of extrainformation. It is now possible not only to collect powder XRDdata of suitable quality for Rietveld refinement, but also to carryout the structure refinements automatically on massive data-sets with high stability using modern Rietveld software such asTOPAS academic.34 An example of this is our recent study of thedevelopment of reaction intermediates and coke in a methanolto olefin (MTO) reactor.25 The variation in the unit cell para-meters of the catalyst (which vary significantly depending onthe organic molecules inside the cavities), obtained from fullprofile Rietveld refinement, was used as an indicator to trackthe development and movement of reaction intermediatesand coke through a tube reactor. The data obtained gavethe information required to develop a new kinetic model forthe process.25
In this paper we will fully describe the techniques foranalysing Z-scan data with high throughput Rietveld methods,verification of the results against high quality single pointsynchrotron image plate data, and the possible pitfalls inherentin studying data with very small variations. The example used isthe methanol to gasoline (MTG) conversion process over thehighly crystalline aluminosilicate zeolite catalyst ZSM-5.35 Thiscatalyst has been used for conversion of methanol to fuels since
a inGAP Centre for Research Based Innovation and Department of Chemistry,
University of Oslo, Postboks 1033, Blindern, Oslo, Norway.
E-mail: [email protected], [email protected],
[email protected], [email protected] Utrecht University, Inorganic Chemistry and Catalysis, Utrecht, Utrecht,
The Netherlands. E-mail: [email protected] ESRF, Grenoble Cedex 9, France. E-mail: [email protected]
† Electronic supplementary information (ESI) available. See DOI: 10.1039/c3cp44343d
Received 3rd December 2012,Accepted 14th March 2013
DOI: 10.1039/c3cp44343d
www.rsc.org/pccp
PCCP
PAPER
Ope
n A
cces
s A
rtic
le. P
ublis
hed
on 1
8 M
arch
201
3. D
ownl
oade
d on
12/
26/2
021
11:5
1:33
AM
. T
his
artic
le is
lice
nsed
und
er a
Cre
ativ
e C
omm
ons
Attr
ibut
ion
3.0
Unp
orte
d L
icen
ce.
View Article OnlineView Journal | View Issue

This journal is c the Owner Societies 2013 Phys. Chem. Chem. Phys., 2013, 15, 8662--8671 8663
the 1970’s and has been applied at an industrial scale.36 It hasa zeolite framework structure with two interlinked 10-T-atom(T = tetrahedrally coordinated Al or Si) ring channel systems;straight channels parallel to the (0 1 0) direction and sinusoidalor zigzag channels parallel to the (1 0 0) direction. The processand its zeolite catalyst have been extensively studied, particu-larly with respect to the mechanism of the MTG process.37–42
Computational methods,43,44 microscopy,45–48 isotopic labelling/switching,49–51 catalyst dissolution52 and spectroscopies53–59
have all been used. Of particular interest here are the numerouspowder and single crystal diffraction structural studies carriedout on adsorption of hydrocarbons into ZSM-5. The groups ofMentzen and van Koningsveld in particular studied the effects ofadsorbing a range of hydrocarbon and halogenated hydrocarbonmolecules and methanol with detailed and careful X-raydiffraction analysis.60–75 These studies showed that very smallvariations in ZSM-5 unit cell volume can be observed on theadsorption of various different molecules and that the filling ofthe pores by different molecules can change the symmetry ofthe crystal structure. The high crystallinity of the zeolite catalystand the large body of existing research on adsorption of organicmolecules makes X-ray diffraction a very suitable method forstudying the MTG process over ZSM-5.
It has been found that the MTG reaction is an autocatalyticreaction, the autocatalytic species being partly alkenes, partlyarenes, and, to a smaller extent, other cyclic hydrocarbons.40
The relative significance of each autocatalytic species dependson a variety of parameters, such as zeotype topology, acid sitedensity, acid strength and reaction conditions.40,76 Contacttime variation experiments using the ZSM-5 catalyst at between290 and 390 1C showed that at short contact times, methanolrapidly equilibrated with DME, and that the two molecules weresubsequently converted to light alkenes, which were againconverted to aromatic and paraffinic products via methylation,cyclisation and hydride transfer reactions.77
Experimental
The ZSM-5 CBV28014 catalyst (SiO2/Al2O3 molar ratio 280) fromZeolyst International was pressed and sieved to a particle rangeof 0.25 to 0.42 mm. 100 mg of the catalyst was packed into a4 mm internal diameter quartz tube with a quartz frit in thetube for the catalyst to rest upon. The resulting bed depth was16 mm. A special goniometer setup was constructed for theexperiment on beamline ID 15b of the European SynchrotronRadiation Facility (ESRF). The tube was fitted into an L shapedSwagelok bend mounted on a Huber goniometer head. Thegoniometer head was in turn mounted on an xyz-stage capableof very fast Z-translations over a range of 50 mm. Heat gunswere also mounted on the xyz-stage, in order that they could betranslated up and down with the reactor, maintaining thetemperature on the catalyst bed during the movement of thebed. The reaction gases (helium inert gas or helium bubbledthrough a flask of methanol at a temperature of 20 1C) wereflowed upwards through the L-bend into the reactor at a weighthourly space velocity of 5.7 g MeOH g�1 catalyst h�1, X-ray
diffraction data were collected on a Pixium area detector with awavelength of 0.1426 Å (89.965 KeV). The beam size was 500 mm.The set-up allowed us to move the catalyst bed up through theX-ray beam at a rate of 0.5 mm s�1 with PXRD patterns beingcollected at 1 second intervals. The product stream was analysedusing a European Spectrometry Systems ecoSys-P Man-Portablemass spectrometer with capillary inlet and heated inlet tubes.The data were scaled and reduced to 2D powder patterns usingthe program DATASQUEEZE. The instrumental peak functionwas characterised by a tan-2y broadening parameter asdescribed by O’Brien et al.26 using NIST SRM660 Lanthanumhexaboride. This dataset was also used to calculate the sample todetector distance (1472.5 mm) and flat plate detector geometricalcorrections used in data reduction.
Data for validation of the behaviour of the catalyst werecollected on beamline BM01A of the ESRF (The Swiss Norwegianbeamline) using the capillary reactor described by Norby et al.and used in numerous PXRD studies of catalysts and othersystems.3–5,18–21,78–80 Helium bubbled through methanol at20 1C was fed over the catalyst at a rate of 20 ml min�1.Diffraction data were collected at a wavelength of 0.6978 Å ona MAR345 image plate detector and integrated into 2D powderpatterns using FIT2D.81,82
The reaction was carried out at a temperature of 350 1C inboth the quartz tube and capillary reactors, with the catalystbeing activated prior to reaction by heating to 350 1C under aflow of helium gas. The temperature in the capillary setup wascalibrated using the thermal expansion of silver while the tubereactor temperature was calibrated using a thermocouple.
The data were analysed using TOPAS academic with aparametric Rietveld approach. Polarization of the X-ray beamwas corrected for in the Rietveld refinement. The specificmethods used for analysing the data and the variations betweendifferent analytical methodologies are discussed in more detailbelow. Data were input into text files for processing with MicrosoftExcel and OriginLab Origin 8.6. A typical TOPAS input file forthe parametric refinement is included as ESI.† Curve fitting wascarried out in Origin 8.6.
Results and discussionA. Analysis of the data
The data on the MTG were analysed by a parametric methodusing the structural model of as synthesised ZSM-5 reported byVan Koningsveld et al.83 The stability of the TOPAS Rietveldalgorithm allows us to use the occupancy factors of the atomsin the template as dummy atoms to quantify the electron densitybuilt up in the pores, a method used previously for in situ studiesof the MTO process.3 The occupancy of these sites refines to zerowhen there is no electron density present in the pores, and waslinked to a single refined parameter for each powder pattern.Each pattern has an independent 7-term Chebyshev polynomialbackground function with a broad Lorentzian peak used inaddition to model the amorphous bump in the backgroundcaused by the quartz reactor tube (fixed position, intensity refinedindependently for each pattern, broadening linked across all
Paper PCCP
Ope
n A
cces
s A
rtic
le. P
ublis
hed
on 1
8 M
arch
201
3. D
ownl
oade
d on
12/
26/2
021
11:5
1:33
AM
. T
his
artic
le is
lice
nsed
und
er a
Cre
ativ
e C
omm
ons
Attr
ibut
ion
3.0
Unp
orte
d L
icen
ce.
View Article Online

8664 Phys. Chem. Chem. Phys., 2013, 15, 8662--8671 This journal is c the Owner Societies 2013
patterns in the dataset, see below). The lattice parameters of thestructure were refined for each pattern as restricted by sym-metry (orthorhombic space group number 62, Pnma) and thebroadening of the peaks in each pattern was modelled with theTOPAS Lorentzian strain broadening macro, on the assumptionthat strain in the crystallites rather than particle size would beinfluenced by any changes caused by the build-up of reactionintermediates inside the zeolite catalyst during reaction as forSAPO-34 in the MTO process4,6 (sample related broadening ofpowder diffraction peaks being caused principally by crystallitesize and strain). The scale, adsorption correction and zero errorwere linked between the datasets and treated in different waysin order to test the effect of the different methods. The ability tolink parameters between multiple datasets which are refinedsimultaneously in a simple and intuitive way (they are simplygiven the same parameter name whenever they occur in theinput file) is a major advantage of the TOPAS Rietveld refine-ment program. This is a key part of the strategy for Rietveldanalysis of fast Z-scan high energy powder X-ray diffraction(HEPXRD) data – limiting the number of parameters in thelarge datasets and also increasing the precision in their deter-mination. In the analysis of the MTG data we experimentedwith linking of various parameters between the datasets. Themain linked parameters were zero point, scale factor, positionand broadening of the quartz background peak and adsorptioncorrection. For the main analysis of the complete dataset a2-theta range of 0.5 to 6.951 was used (min d-spacing = 1.176 Å).
When dealing with very large datasets it is necessary toseparate the data into batches due to memory limitations (theleast squares matrix must be held in the RAM of the processingcomputer). This means that it is important to know how certainparameters which should be the same in all cases vary betweenthe batches. We, therefore investigated the influence of the zeropoint on the datasets – studying the difference between refiningbatches with a fixed zero point or allowing the zero point torefine separately between the batches and hoping that itreaches the same value in all cases. Allowing different valuesof the zero point correction led to a significant oscillation inthis parameter between two values (�0.00062 and �0.00053)which influenced the lattice parameters to a very significantdegree (a cell volume average of 5355 Å3 for zero error =�0.00062 compared to 5368 Å3 for zero error = �0.00053).Because of these variations due to correlation of the latticeparameters and the zero point we decided to fix the zero pointfor all refinements. We note however that this effect does notchange the actual trends in the data: the same percentagevariations are observed in the unit cell volume regardless ofthe zero point chosen. This suggests that despite the correlationwith the zero point the lattice parameters are converging tovalues representative of the physical behaviour (Fig. 1). The dataused in the contour plots presented below were obtained with afixed zero point error correction of �0.00062.
The method used to refine the position of the quartz back-ground peak was also varied: free refinement for all powderpatterns, fixed position and linked refinement in each batchwere tested. The results showed very little variation in the unit
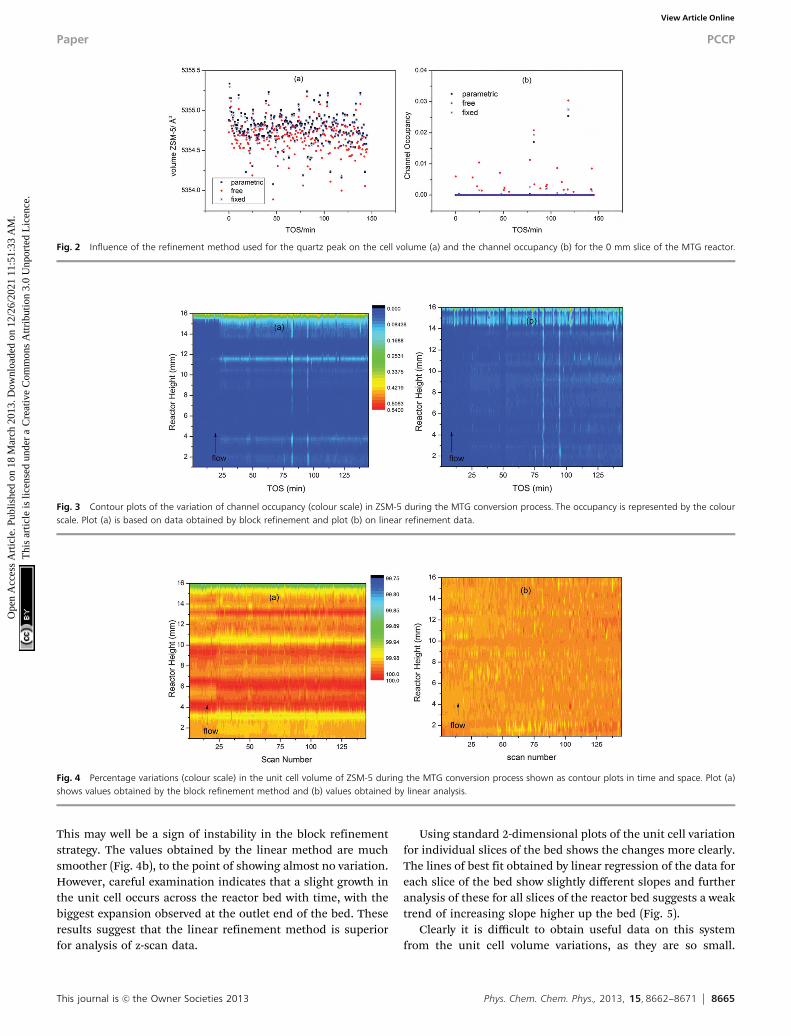
cell volume and channel occupancy for the different methods;however, the spread of values is noticeably greater for the freerefinement data (Fig. 2a) and slightly greater for the fixedposition method (note points at TOS = 24.6, 77.9 and 99 minutesin the channel occupancy plot, Fig. 2b). In view of this we usedthe parametric method to refine the quartz background peakposition in the main refinements.
B. Influence of the batch shape
The batches used in the analysis of z-scan data have a clearinfluence on the results (see Fig. 1 and 2a in ref. 10). Wetherefore carried out our analysis in two ways. In the ‘‘blockanalysis’’ the batches were formed of 10 complete scans of thereactor (each scan comprises data from all 32 slices of thereactor). The ‘‘linear’’ analysis used batches created from asingle slice of the reactor. The overall trends seen in both typesof refinement should be the same. When the data are plotted ascontour maps in time and space the results of the two methodsare clearly closely related for channel occupancy (Fig. 3a and b)where clear variations can be observed.
Several features of the channel occupancy plots are reproducedbetween the block and linear analyses, the most important beingthe onset of a significant increase in occupancy across the reactorbed at 25 minutes on stream; an area of increased occupancy atthe outlet end of the reactor (beginning at around 14 mm fromthe inlet) and two streaks of slightly increased occupancy runningvertically up the reactor bed at TOS = 82 and 95 minutes. Thesignificance of these features will be further discussed in SectionD below. The block method shows more periodic variations in thereactor height dimension.
In the case of unit cell variation the changes observed are sosmall that clear differences can be observed between the twobatching methods (Fig. 4a and b). In order to compare the smallvariations in all parts of the reactor on the same scale the cellvolumes are presented as percentage variations around the averagevalue of the cell volume for each slice of the reactor bed.
The plot in Fig. 4a shows clear evidence of periodic variationalong the reactor height dimension as for channel occupancy.
Fig. 1 Percentage change in the volume of ZSM-5 for two different final refinedvalues of the zero error correction in the parametric Rietveld refinement, duringthe MTG process in a slice of the reactor 3.5 mm from the inlet. TOS stands for‘‘time on stream’’: the time for which the catalyst bed has been exposed to themethanol reagent gas. Refinement was carried out along the reactor slice (seeSection B). Note the upward trend in the volume/average volume percentage.
PCCP Paper
Ope
n A
cces
s A
rtic
le. P
ublis
hed
on 1
8 M
arch
201
3. D
ownl
oade
d on
12/
26/2
021
11:5
1:33
AM
. T
his
artic
le is
lice
nsed
und
er a
Cre
ativ
e C
omm
ons
Attr
ibut
ion
3.0
Unp
orte
d L
icen
ce.
View Article Online
This journal is c the Owner Societies 2013 Phys. Chem. Chem. Phys., 2013, 15, 8662--8671 8665
This may well be a sign of instability in the block refinementstrategy. The values obtained by the linear method are muchsmoother (Fig. 4b), to the point of showing almost no variation.However, careful examination indicates that a slight growth inthe unit cell occurs across the reactor bed with time, with thebiggest expansion observed at the outlet end of the bed. Theseresults suggest that the linear refinement method is superiorfor analysis of z-scan data.
Using standard 2-dimensional plots of the unit cell variationfor individual slices of the bed shows the changes more clearly.The lines of best fit obtained by linear regression of the data foreach slice of the bed show slightly different slopes and furtheranalysis of these for all slices of the reactor bed suggests a weaktrend of increasing slope higher up the bed (Fig. 5).
Clearly it is difficult to obtain useful data on this systemfrom the unit cell volume variations, as they are so small.
Fig. 2 Influence of the refinement method used for the quartz peak on the cell volume (a) and the channel occupancy (b) for the 0 mm slice of the MTG reactor.
Fig. 3 Contour plots of the variation of channel occupancy (colour scale) in ZSM-5 during the MTG conversion process. The occupancy is represented by the colourscale. Plot (a) is based on data obtained by block refinement and plot (b) on linear refinement data.
Fig. 4 Percentage variations (colour scale) in the unit cell volume of ZSM-5 during the MTG conversion process shown as contour plots in time and space. Plot (a)shows values obtained by the block refinement method and (b) values obtained by linear analysis.
Paper PCCP
Ope
n A
cces
s A
rtic
le. P
ublis
hed
on 1
8 M
arch
201
3. D
ownl
oade
d on
12/
26/2
021
11:5
1:33
AM
. T
his
artic
le is
lice
nsed
und
er a
Cre
ativ
e C
omm
ons
Attr
ibut
ion
3.0
Unp
orte
d L
icen
ce.
View Article Online

8666 Phys. Chem. Chem. Phys., 2013, 15, 8662--8671 This journal is c the Owner Societies 2013
Furthermore, it was not possible to obtain good differenceFourier maps from the z-scan data, even when the range ofd-spacing was extended to 0.88 Å, however, using the dummyatom method the occupancy can be quantified, and this provesmuch more revealing than the unit cell volume. The trend inthe channel occupancy varies with height in the bed, as can beseen from the contour plot in Fig. 2. The variations are wellillustrated by 2-D plots of the reactor slices (Fig. 6). At the inletend of the reactor a linear growth in occupancy is observed(a); the mid-section plots show a similar maximum level ofoccupancy but the maximum point is reached faster, with arapid increase in occupancy until TOS = 20 minutes followed bya reduction in the slope (b); at the outlet end of the reactor a
similar curve shape is observed in the middle section, but witha higher final occupancy level (c).
These plots are easy to compare with the data from a singlepoint measurement in a capillary reactor (Fig. 7). The capillarygeometry gives better quality data than the large tube reactor asthe sample to detector distance and detector geometry are moreprecisely defined. The plots clearly display the same trendsseen in the z-scan experiment, validating the observations fromthe slightly lower quality data obtained for the bigger reactor.The trend in the channel occupancy from the single pointmeasurements is closer to that observed in the middle of thereactor bed, though some delay in the initiation of the growthin occupancy is observed in the single point measurement.
Fig. 5 (a) Volume change in ZSM-5 (expressed as a percentage of the average volume) for the 7.5 mm slice of the MTG reactor; (b) plot of slopes of the linearregression lines in the volume data for all slices of the reactor. Linear regression lines are shown to illustrate the trends in the data.
Fig. 6 2D Plots illustrating the different trends in ZSM-5 channel occupancy development during the MTG process for different slices of the reactor bed; (a) 3 mm upthe reactor, (b) 7 mm and (c) 13 mm. Linear (a) and 3rd order polynomial (b and c) fits are used to pick out the trends in the data. Note that the fit statistics for linearand polynomial fitting of (b) are similar.
PCCP Paper
Ope
n A
cces
s A
rtic
le. P
ublis
hed
on 1
8 M
arch
201
3. D
ownl
oade
d on
12/
26/2
021
11:5
1:33
AM
. T
his
artic
le is
lice
nsed
und
er a
Cre
ativ
e C
omm
ons
Attr
ibut
ion
3.0
Unp
orte
d L
icen
ce.
View Article Online

This journal is c the Owner Societies 2013 Phys. Chem. Chem. Phys., 2013, 15, 8662--8671 8667
The maximum occupancy value from the capillary reactor ishigher than that observed from the z-scan data, however, it isunwise to compare absolute values of channel occupancy producedby different experimental set ups, and we must content ourselves tonote the similarity of the curve shapes.
C. Calculation of errors
The normal method for determination of errors from Rietveldrefinement is through use of a covariance matrix. For the verylarge datasets involved in experiments of the type describedhere this is an exceptionally slow process. Fortunately TOPASsupports the ‘‘bootstrap’’ method of error determination whichis based on repeated resampling of limited areas of the datarange.84 Since the convergence of the Rietveld refinementsrequired is very fast (even for multiple datasets) this methodis highly recommended. The current version of TOPAS academicdoes not, unfortunately, support the output of bootstrap errorsto text files (a huge advantage when dealing with large datasets),but we believe this has been remedied in the new version (TOPAS 5)to be released in 2013.85
D. Catalytic activity and selectivity
Mass spectrometry (MS) responses characteristic for methanol(m/z 31), DME (m/z 46) and propene (m/z 42) versus timeon stream are shown in Fig. 8. Response characteristics forbutane (m/z 58), butene (m/z 56) and propane (m/z 44) werealso measured, but their time dependence did not deviate fromthat of propene, and they were therefore omitted from thefigure for clarity.
Two features are apparent from the data in Fig. 8: first,methanol and DME responses were both non-zero throughoutthe experiment, showing that the conversion level was less than100%. Furthermore, the relative fractions of methanol, DMEand propene (or any of the other measured products, see above)in the reactor effluent were stable during the experiment,showing that neither the conversion nor the product selectivitychanged with time on stream. This behaviour is distinctivelydifferent from that previously observed when feeding methanolover a SAPO-34 catalyst under similar conditions: In that experi-ment, the methanol conversion was seen to increase, then
reach a maximum value and subsequently decrease, duringthe z-scan experiment.4,25
The observed difference between the two zeotypes asMTO catalysts is in line with conventional tests of the twomaterials, with ZSM-5 gaining rapidly a steady-state activityand maintaining this stable activity level for several days, whileSAPO-34 generally goes to the zero conversion level after a fewhours on stream.40,86
E. Interpretation of the MTG data
X-ray diffraction structural studies of adsorbed molecules inZSM-5 have revealed a flexible structure with rather compli-cated behaviour with some adsorbed molecules able to changethe symmetry of the crystal structure.60–75 The symmetrychanges seem to be related to filling of the sinusoidal channelsof the zeolite framework. Filling of the channels also leads toexpansion of the unit cell compared to the activated, emptystructure. Larger molecules which occupy the intersections ofthe channels cause small or negative expansion (Table 1).
The small expansions (around 0.01%) we observe during theMTG process suggest that even during an experiment underflowing conditions there occurs some build-up of materialsinside the channels of the zeolite catalyst. Despite the fact thatit was not possible to obtain useful difference Fourier maps
Fig. 7 Plots of the unit cell volume (a) and channel occupancy (b) of ZSM-5 during the MTG process from single point measurements in a capillary reactor.
Fig. 8 Mass spectrometry data from the MTG process over ZSM-5 collectedfrom the outlet of the z-scanning reactor system. Propene is used as an indicatorof the hydrocarbon output; similar traces are observed for other producthydrocarbons.
Paper PCCP
Ope
n A
cces
s A
rtic
le. P
ublis
hed
on 1
8 M
arch
201
3. D
ownl
oade
d on
12/
26/2
021
11:5
1:33
AM
. T
his
artic
le is
lice
nsed
und
er a
Cre
ativ
e C
omm
ons
Attr
ibut
ion
3.0
Unp
orte
d L
icen
ce.
View Article Online

8668 Phys. Chem. Chem. Phys., 2013, 15, 8662--8671 This journal is c the Owner Societies 2013
from the data we suggest in view of the results summarisedin Table 1 that the intermediates are not limited to thechannel intersections. The increased rate of volume increaseat the outlet end of the reactor suggests that either (1) organicmolecules build up to high concentrations faster there or (2)larger organics which are not confined to the intersections arepresent there. Clearly the feed at the outlet end of the reactorbed has a longer contact time with the catalyst and so we expectthat larger molecules would be most likely to be found there asthey require more reaction steps to develop from methanol.
Due to the autocatalytic nature of the MTG reaction (seeIntroduction) the build-up of organic molecules is expected toproceed faster after a critical amount of autocatalytic specieshave been formed, the so-called critical contact time.76 Thedata reported in Fig. 6, which show an increasing slope ofthe channel occupancy versus time on stream curves withincreasing contact time, is in line with such a model. A similardistribution of autocatalytic species and coke was observed bySchulz as colour changes in microscopic examination of a largereactor bed88 and we observed a similar pattern of intermediateand coke distribution driven by the flow rate of a fixed bed MTOreactor.25 Bleken et al. have also shown that in some cases thesection of an MTG reactor bed closest to the inlet can be entirelyinert.76 The observation of a constant methanol conversion levelwith time on stream (Fig. 8), in spite of an increasing amount ofproduct molecules (which also act as autocatalytic species) in thecatalyst channels, is more surprising. This observation maysuggest that the quantity of such species is already sufficientfor a zero order reaction rate at the start of the experiment. Or,the added channel occupancy with time on stream may proceedin parts of the catalyst crystals which are less important foreffluent product formation. Previous ex situ analysis of retainedaromatic molecules in a ZSM-5 catalyst after MTG testing at350 1C showed no correlation between the amount of suchspecies and the methanol conversion level,89 in line with theresults of the present study. More studies, preferably underconditions with shorter contact time or lower temperatures,thus leading to a lower initial conversion and, possibly, more
rapid deactivation, would be required to confirm or disproveeither of the two hypotheses above.
F. Is the ZSM-5 catalyst under strain during the MTG process?
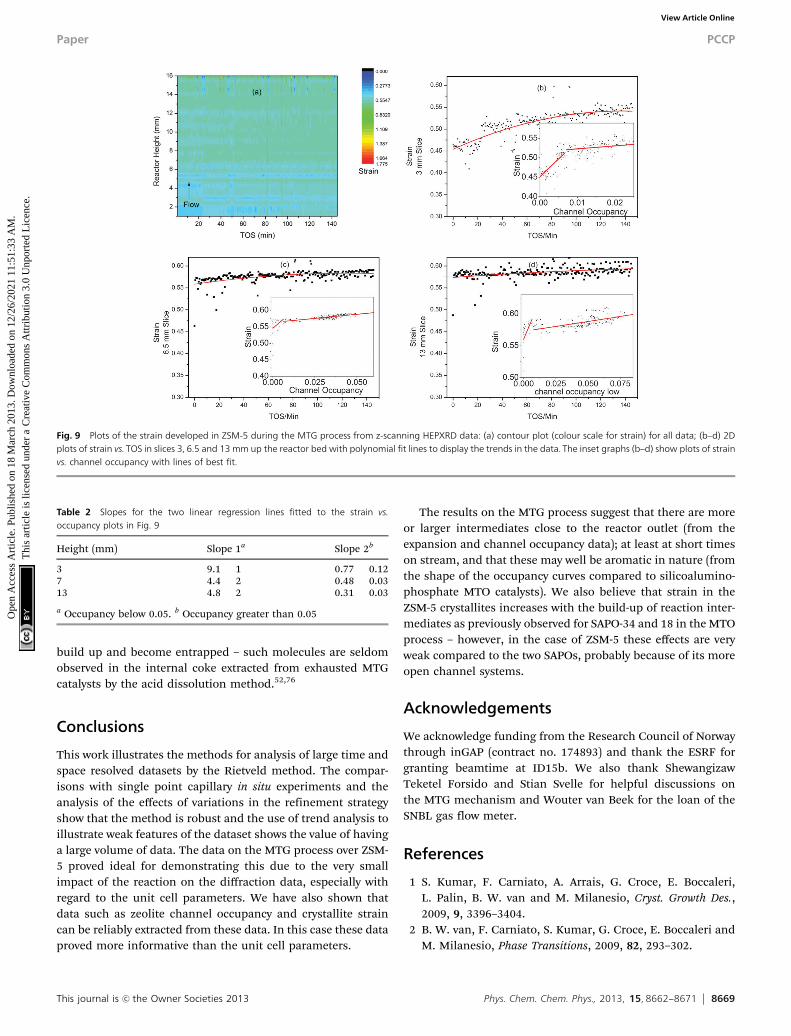
It has previously been shown that the build-up of reactionintermediates during the MTO process causes an increase instrain in the aluminophosphate framework catalysts SAPO-34and SAPO-18.3,4,6 Flexibility of the framework is actually necessaryto incorporate some of the intermediate/coke molecules found inthese structures after the MTO process,6 however it is suspectedthat the strain associated with the flexing of the structure maycontribute towards long term deactivation of the catalyst.90 Thecontour plot of the strain data from the MTG z-scan experimentshows little evidence of change and this is consistent with the verysmall changes in unit cell volume observed in the time-scale of thesynchrotron experiment (Fig. 9a).
Looking at the linear slices through the reactor at 3, 6.5 and13 mm, we see signs of increasing strain as the reactionprogresses (Fig. 9b–d). It is also possible to plot the channeloccupancy vs. strain for these slices (Fig. 9b–d, insets). Theseplots show possible correlation in two stages (underlining thelink between filling of the zeolite cavities during methanolconversion and increasing strain in the crystal structure, firstobserved in SAPO-344), with a steep gradient up to a channeloccupancy of 0.05 and a lower gradient above. The gradientsfound are shown in Table 2. The correlations suggest thatinitial formation of small amounts of organic compounds inthe channels causes a large increase in strain while the furtherdevelopment of larger species has less impact. Note that the6.5 and 13 mm slices have very few points with an occupancy ofbelow 0.05, suggesting that large intermediates form morequickly further from the inlet in agreement with our otherobservations. The large spread of these points also leads torather large standard deviations in the values of slope 1. Thelow levels of strain and also unit cell expansion in ZSM-5compared to the MTO catalysts SAPO-34 and 18 are probablydue to a more open channel system which does not containlarge internal cavities where large polyaromatic molecules can
Table 1 Unit cell dimensions and locations for ZSM-5 with adsorbed molecules. The sites are numbered according to the scheme used by Mentzen et al.: I = channelintersections, II = sinusoidal channels, III = straight channels. Volume changes are based on the calcined ZSM-5 structure reported by van Koningsveld87
Adsorbate a b c b Volume % Volume change Position Symmetry change?
None87 20.078 19.894 13.372 90 5341.20 0 None No4-Nitroaniline70 19.96 19.941 13.367 90 5320.37 �0.39 I NoBenzene71 19.996 19.935 13.427 90 5352.27 0.207 I, II YesHexane74 19.8247 20.1292 13.451 90.3 5367.63 0.495 II, III YesMethanol65 20.118 19.884 13.382 90.5 5352.94 0.220 I, II, III YesNaphthalene67 19.919 19.955 13.357 90 5309.19 �0.599 I NoNaphthalene63 19.948 19.98 13.37 90 5328.76 �0.233 I Nop-Chlorotoluene62 20.017 19.935 13.377 90 5337.94 �0.061 I Nop-Dibromobenzene62 20.032 19.93 13.379 90 5341.40 0.004 I Nop-Dichlorobenzene62 20.018 19.92 13.37 90 5331.40 �0.183 I Nop-Dichlorobenzene64 20.116 19.828 13.436 90 5359.08 0.335 I, II Yesp-Dichlorobenzene, high loading69 20.102 19.797 13.436 90 5346.98 0.108 I, II Yesp-Dichlorobenzene, low loading68 20.009 19.909 13.366 90 5324.47 �0.313 I Nop-Xylene62 20.025 19.91 13.374 90 5332.18 �0.169 I Nop-Xylene60 20.121 19.82 13.438 90 5359.05 0.334 I, II YesToluene75 20.099 19.844 13.424 90 5354.09 0.241 I, II YesXylene66 20.021 19.9331 13.3809 90 5340.05 �0.022 I No
PCCP Paper
Ope
n A
cces
s A
rtic
le. P
ublis
hed
on 1
8 M
arch
201
3. D
ownl
oade
d on
12/
26/2
021
11:5
1:33
AM
. T
his
artic
le is
lice
nsed
und
er a
Cre
ativ
e C
omm
ons
Attr
ibut
ion
3.0
Unp
orte
d L
icen
ce.
View Article Online
This journal is c the Owner Societies 2013 Phys. Chem. Chem. Phys., 2013, 15, 8662--8671 8669
build up and become entrapped – such molecules are seldomobserved in the internal coke extracted from exhausted MTGcatalysts by the acid dissolution method.52,76
Conclusions
This work illustrates the methods for analysis of large time andspace resolved datasets by the Rietveld method. The compar-isons with single point capillary in situ experiments and theanalysis of the effects of variations in the refinement strategyshow that the method is robust and the use of trend analysis toillustrate weak features of the dataset shows the value of havinga large volume of data. The data on the MTG process over ZSM-5 proved ideal for demonstrating this due to the very smallimpact of the reaction on the diffraction data, especially withregard to the unit cell parameters. We have also shown thatdata such as zeolite channel occupancy and crystallite straincan be reliably extracted from these data. In this case these dataproved more informative than the unit cell parameters.
The results on the MTG process suggest that there are moreor larger intermediates close to the reactor outlet (from theexpansion and channel occupancy data); at least at short timeson stream, and that these may well be aromatic in nature (fromthe shape of the occupancy curves compared to silicoalumino-phosphate MTO catalysts). We also believe that strain in theZSM-5 crystallites increases with the build-up of reaction inter-mediates as previously observed for SAPO-34 and 18 in the MTOprocess – however, in the case of ZSM-5 these effects are veryweak compared to the two SAPOs, probably because of its moreopen channel systems.
Acknowledgements
We acknowledge funding from the Research Council of Norwaythrough inGAP (contract no. 174893) and thank the ESRF forgranting beamtime at ID15b. We also thank ShewangizawTeketel Forsido and Stian Svelle for helpful discussions onthe MTG mechanism and Wouter van Beek for the loan of theSNBL gas flow meter.
References
1 S. Kumar, F. Carniato, A. Arrais, G. Croce, E. Boccaleri,L. Palin, B. W. van and M. Milanesio, Cryst. Growth Des.,2009, 9, 3396–3404.
2 B. W. van, F. Carniato, S. Kumar, G. Croce, E. Boccaleri andM. Milanesio, Phase Transitions, 2009, 82, 293–302.
Fig. 9 Plots of the strain developed in ZSM-5 during the MTG process from z-scanning HEPXRD data: (a) contour plot (colour scale for strain) for all data; (b–d) 2Dplots of strain vs. TOS in slices 3, 6.5 and 13 mm up the reactor bed with polynomial fit lines to display the trends in the data. The inset graphs (b–d) show plots of strainvs. channel occupancy with lines of best fit.
Table 2 Slopes for the two linear regression lines fitted to the strain vs.occupancy plots in Fig. 9
Height (mm) Slope 1a Slope 2b
3 9.1 � 1 0.77 � 0.127 4.4 � 2 0.48 � 0.0313 4.8 � 2 0.31 � 0.03
a Occupancy below 0.05. b Occupancy greater than 0.05
Paper PCCP
Ope
n A
cces
s A
rtic
le. P
ublis
hed
on 1
8 M
arch
201
3. D
ownl
oade
d on
12/
26/2
021
11:5
1:33
AM
. T
his
artic
le is
lice
nsed
und
er a
Cre
ativ
e C
omm
ons
Attr
ibut
ion
3.0
Unp
orte
d L
icen
ce.
View Article Online

8670 Phys. Chem. Chem. Phys., 2013, 15, 8662--8671 This journal is c the Owner Societies 2013
3 D. S. Wragg, D. Akporiaye and H. Fjellvåg, J. Catal., 2011,279, 397–402.
4 D. S. Wragg, R. E. Johnsen, M. Balasundaram, P. Norby,H. Fjellvåg, A. Grønvold, T. Fuglerud, J. Hafizovic, Ø.B. Vistad and D. Akporiaye, J. Catal., 2009, 268, 290–296.
5 D. S. Wragg, R. E. Johnsen, P. Norby and H. Fjellvåg,Microporous Mesoporous Mater., 2010, 134, 210–215.
6 M. Zokaie, D. S. Wragg, A. Grønvold, T. Fuglerud,J. H. Cavka, K. P. Lillerud and O. Swang, MicroporousMesoporous Mater., 2013, 165, 1–5.
7 R. J. Francis and D. O’Hare, J. Chem. Soc., Dalton Trans.,1998, 3133–3148.
8 P. Norby, Curr. Opin. Colloid Interface Sci., 2006, 11, 118.9 M. A. Newton and W. van Beek, Chem. Soc. Rev., 2010, 39,
4845–4863.10 M. G. O’Brien, A. M. Beale, S. D. M. Jacques, M. M. Di and
B. M. Weckhuysen, ChemCatChem, 2009, 1, 99–102.11 P. Norby, J. Am. Chem. Soc., 1997, 119, 5215–5221.12 G. Agostini, C. Lamberti, L. Palin, M. Milanesio,
N. Danilina, B. Xu, M. Janousch and B. J. A. van, J. Am.Chem. Soc., 2010, 132, 667–678.
13 M. Sanchez del Rio, E. Boccaleri, M. Milanesio, G. Croce,B. W. van, C. Tsiantos, G. D. Chyssikos, V. Gionis,G. H. Kacandes, M. Suarez and E. Garcia-Romero, J. Mater.Sci., 2009, 44, 5524–5536.
14 A. M. Beale, M. G. O’Brien, M. Kasunic, A. Golobic,M. Sanchez-Sanchez, A. J. W. Lobo, D. W. Lewis,D. S. Wragg, S. Nikitenko, W. Bras and B. M. Weckhuysen,J. Phys. Chem. C, 2011, 115, 6331–6340.
15 M. G. O’Brien, A. M. Beale and B. M. Weckhuysen, Chem.Soc. Rev., 2010, 39, 4767–4782.
16 M. Feyand, A. Huebner, A. Rothkirch, D. S. Wragg andN. Stock, Inorg. Chem., 2012, 51, 12540–12547.
17 D. S. Wragg, P. J. Byrne, G. Giriat, O. B. Le, R. Gyepes,A. Harrison, A. G. Whittaker and R. E. Morris, J. Phys. Chem.C, 2009, 113, 20553–20558.
18 P. D. C. Dietzel, R. E. Johnsen, R. Blom and H. Fjellvag,Chem.–Eur. J., 2008, 14, 2389–2397.
19 R. E. Johnsen, F. Krumeich and P. Norby, J. Appl. Crystallogr.,2010, 43, 434–447.
20 R. E. Johnsen and P. Norby, J. Appl. Crystallogr., 2008, 41,991–1002.
21 R. E. Johnsen and P. Norby, J. Phys. Chem. C, 2009, 113,19061–19066.
22 J. E. Daniels and M. Drakopoulos, J. Synchrotron Radiat.,2009, 16, 463–468.
23 G. W. Stinton and J. S. O. Evans, J. Appl. Crystallogr., 2007,40, 87–95.
24 A. M. Beale, S. D. M. Jacques and B. M. Weckhuysen, Chem.Soc. Rev., 39, 4656–4672.
25 D. S. Wragg, M. G. O’Brien, F. L. Bleken, M. Di Michiel, U. Olsbyeand H. Fjellvåg, Angew. Chem., Int. Ed., 2012, 51, 7956–7959.
26 M. G. O’Brien, A. M. Beale, S. D. M. Jacques, M. Di Michieland B. M. Weckhuysen, Appl. Catal., A., 2011, 391, 468–476.
27 F. Millange, C. Serre, N. Guillou, G. Ferey and R. I. Walton,Angew. Chem., Int. Ed., 2008, 47, 4100–4105.
28 F. Salles, G. Maurin, C. Serre, P. L. Llewellyn, C. Knofel,H. J. Choi, Y. Filinchuk, L. Oliviero, A. Vimont, J. R. Longand G. Ferey, J. Am. Chem. Soc., 2010, 132, 13782–13788.
29 L. Espinosa-Alonso, M. G. O’Brien, S. D. M. Jacques,A. M. Beale, J. de, P. Barnes and B. M. Weckhuysen, J. Am.Chem. Soc., 2009, 131, 16932–16938.
30 A. M. Beale, S. D. M. Jacques and B. M. Weckhuysen, Chem.Soc. Rev., 2010, 39, 4656–4672.
31 S. D. M. Jacques, M. M. Di, A. M. Beale, T. Sochi,M. G. O’Brien, L. Espinosa-Alonso, B. M. Weckhuysen andP. Barnes, Angew. Chem., Int. Ed., 2011, 50, 10148–10152.
32 M. G. O’Brien, S. D. M. Jacques, M. M. Di, P. Barnes,B. M. Weckhuysen and A. M. Beale, Chem. Sci., 2012, 3,509–523.
33 M. G. O’Brien, A. M. Beale, S. D. M. Jacques, T. Buslaps,V. Honkimaki and B. M. Weckhuysen, J. Phys. Chem. C,2009, 113, 4890–4897.
34 A. A. Coelho, TOPAS v4.2, Bruker AXS, 2006.35 G. T. Kokotailo, S. L. Lawton, D. H. Olson and W. M. Meier,
Nature, 1978, 272, 437–438.36 C. D. Chang, Catal. Rev., 1983, 25, 1–118.37 J. F. Haw, S. M. Auerbach, K. A. Carrado and P. K. Dutta,
Handbook of Zeolite Science and Technology, 2003.38 P. Barger, M. Guisnet and J.-P. Gilson, Zeolites for cleaner
technologies: catalytic science series, 2002.39 U. Olsbye, M. Bjørgen, S. Svelle, K.-P. Lillerud and S. Kolboe,
Catal. Today, 2005, 106, 108–111.40 U. Olsbye, S. Svelle, M. Bjørgen, P. Beato, T. V. W. Janssens,
F. Joensen, S. Bordiga and K. P. Lillerud, Angew. Chem., Int.Ed., 2012, 51, 5810–5831.
41 M. Stocker, Microporous Mesoporous Mater., 1999, 29, 3–48.42 C. D. Chang, Shape Selective Catalysis: Chemical Synthesis
and Hydrocarbon Processing, 2000.43 S. Svelle, C. Tuma, X. Rozanska, T. Kerber and J. Sauer,
J. Am. Chem. Soc., 2008, 131, 816–825.44 V. Van Speybroeck, J. Van der Mynsbrugge, M. Vandichel,
K. Hemelsoet, D. Lesthaeghe, A. Ghysels, G. B. Marin andM. Waroquier, J. Am. Chem. Soc., 2010, 133, 888–899.
45 D. Mores, E. Stavitski, M. H. F. Kox, J. Kornatowski,U. Olsbye and B. M. Weckhuysen, Chem.–Eur. J., 2008, 14,11320–11327.
46 D. Mores, J. Kornatowski, U. Olsbye and B. M. Weckhuysen,Chem.–Eur. J., 2011, 17, 2874–2884.
47 L. R. Aramburo, S. E. de, B. Arstad, S. M. M. van, L. Sommer,A. Juhin, T. Yokosawa, H. W. Zandbergen, U. Olsbye,G. F. M. F. de and B. M. Weckhuysen, Angew. Chem., Int.Ed., 2012, 51, 3616–3619.
48 L. Sommer, S. Svelle, K. P. Lillerud, M. Stocker,B. M. Weckhuysen and U. Olsbye, Langmuir, 2010, 26,16510–16516.
49 D. M. Marcus, M. J. Hayman, Y. M. Blau, D. R. Guenther,J. O. Ehresmann, P. W. Kletnieks and J. F. Haw, Angew.Chem., 2006, 118, 1967–1969.
50 D. M. Marcus, M. J. Hayman, Y. M. Blau, D. R. Guenther,J. O. Ehresmann, P. W. Kletnieks and J. F. Haw, Angew.Chem., Int. Ed., 2006, 45, 1933–1935.
PCCP Paper
Ope
n A
cces
s A
rtic
le. P
ublis
hed
on 1
8 M
arch
201
3. D
ownl
oade
d on
12/
26/2
021
11:5
1:33
AM
. T
his
artic
le is
lice
nsed
und
er a
Cre
ativ
e C
omm
ons
Attr
ibut
ion
3.0
Unp
orte
d L
icen
ce.
View Article Online

This journal is c the Owner Societies 2013 Phys. Chem. Chem. Phys., 2013, 15, 8662--8671 8671
51 F. Bleken, W. Skistad, K. Barbera, M. Kustova, S. Bordiga,P. Beato, K. P. Lillerud, S. Svelle and U. Olsbye, Phys. Chem.Chem. Phys., 2011, 13, 2539–2549.
52 P. Magnoux, P. Roger, C. Canaff, V. Fouche, N. S. Gnep andM. Guisnet, in Studies in Surface Science and Catalysis,ed. B. Delmon and G. F. Froment, Elsevier, 1987, vol. 34,pp. 317–330.
53 S. Svelle, L. Sommer, K. Barbera, P. N. R. Vennestrøm,U. Olsbye, K. P. Lillerud, S. Bordiga, Y.-H. Pan andP. Beato, Catal. Today, 2011, 168, 38–47.
54 K. Barbera, F. Bonino, S. Bordiga, T. V. W. Janssens andP. Beato, J. Catal., 2011, 280, 196–205.
55 P. M. Allotta and P. C. Stair, ACS Catal., 2012, 2, 2424–2432.56 Y. T. Chua and P. C. Stair, J. Catal., 2003, 213, 39–46.57 Y. T. Chua, P. C. Stair, J. B. Nicholas, W. Song and J. F. Haw,
J. Am. Chem. Soc., 2003, 125, 866–867.58 Y. T. Chua, P. C. Stair, J. B. Nicholas, W. Song and J. F. Haw,
J. Am. Chem. Soc., 2003, 125, 866–867.59 F. L. Bleken, S. Chavan, U. Olsbye, M. Boltz, F. Ocampo and
B. Louis, Appl. Catal., A, 2012, 447–448, 178–185.60 H. van Koningsveld, F. Tuinstra, H. van Bekkum and
J. C. Jansen, Acta Crystallogr., Sect. B: Struct. Sci., 1989, 45,423–431.
61 H. Gies, B. Marler, C. Fyfe, G. Kokotailo, Y. Feng andD. E. Cox, J. Phys. Chem. Solids, 1991, 52, 1235–1241.
62 B. F. Mentzen, Mater. Res. Bull., 1992, 27, 953–960.63 B. F. Mentzen, M. Sacerdote-Peronnet, J.-F. Berar and
F. Lefebvre, Zeolites, 1993, 13, 485–492.64 B. F. Mentzen and M. Sacerdote-peronnet, Mater. Res. Bull.,
1993, 28, 1161–1168.65 B. F. Mentzen, R. Favre and F. Cauwet, Mater. Res. Bull.,
1994, 29, 587–594.66 B. F. Mentzen and P. Gelin, Mater. Res. Bull., 1995, 30,
373–380.67 H. van Koningsveld and J. C. Jansen, Microporous Mater.,
1996, 6, 159–167.68 H. van Koningsveld, J. C. Jansen and A. J. M. d. Man, Acta
Crystallogr., Sect. B: Struct. Sci., 1996, 52, 131–139.69 H. van Koningsveld, J. C. Jansen and H. van Bekkum, Acta
Crystallogr., Sect. B: Struct. Sci., 1996, 52, 140–144.70 H. van Koningsveld and J. H. Koegler, Microporous Mater.,
1997, 9, 71–81.
71 B. F. Mentzen and F. Lefebvre, Mater. Res. Bull., 1997, 32,813–820.
72 B. Mentzen and F. Lefebvre, J. Chim. Phys., 1998, 95,1052–1067.
73 H. van Koningsveld, J. Mol. Catal. A: Chem., 1998, 134,89–95.
74 H. Morell, K. Angermund, A. R. Lewis, D. H. Brouwer,C. A. Fyfe and H. Gies, Chem. Mater., 2002, 14, 2192–2198.
75 K. Nishi, A. Hidaka and Y. Yokomori, Acta Crystallogr., Sect.B: Struct. Sci., 2005, 61, 160–163.
76 F. L. Bleken, T. V. W. Janssens, S. Svelle and U. Olsbye,Microporous Mesoporous Mater., 2012, 164, 190–198.
77 C. D. Chang and A. J. Silvestri, J. Catal., 1977, 47, 249–259.78 M. Ronning, N. E. Tsakoumis, A. Voronov, R. E. Johnsen,
P. Norby, B. W. van, O. Borg, E. Rytter and A. Holmen, Catal.Today, 2010, 155, 289–295.
79 N. E. Tsakoumis, R. Dehghan, R. E. Johnsen, A. Voronov,B. W. van, J. C. Walmsley, O. Borg, E. Rytter, D. Chen,M. Roenning and A. Holmen, Catal. Today, 2013, 205,86–93.
80 N. E. Tsakoumis, A. Voronov, M. Ronning, B. W. van,O. Borg, E. Rytter and A. Holmen, J. Catal., 2012, 291,138–148.
81 A. P. Hammersley, http://www.esrf.eu/computing/scientific/FIT2D/.
82 A. P. Hammersley, S. O. Svensson, M. Hanfland, A. N. Fitchand D. Hausermann, High Pressure Res., 1996, 14, 235–248.
83 H. van Koningsveld, H. van Bekkum and J. C. Jansen, ActaCrystallogr., Sect. B: Struct. Sci., 1987, 43, 127–132.
84 T. J. DiCiccio and B. Efron, Stat. Sci., 1996, 11, 189–212.85 M. R. Rowles, personal communication.86 F. Bleken, M. Bjørgen, L. Palumbo, S. Bordiga, S. Svelle,
K.-P. Lillerud and U. Olsbye, Top. Catal., 2009, 52, 218–228.87 H. van Koningsveld, Acta Crystallogr., Sect. B: Struct. Sci.,
1990, 46, 731–735.88 H. Schulz, Catal. Today, 2010, 154, 183–194.89 M. Bjørgen, S. Svelle, F. Joensen, J. Nerlov, S. Kolboe,
F. Bonino, L. Palumbo, S. Bordiga and U. Olsbye, J. Catal.,2007, 249, 195–207.
90 P. Barger, in Zeolite for Cleaner Technologies, ed. M. Guisnetand J.-P. Gilson, Imperial College Press, London, 2002,vol. 3, ch. 12, pp. 239–260.
Paper PCCP
Ope
n A
cces
s A
rtic
le. P
ublis
hed
on 1
8 M
arch
201
3. D
ownl
oade
d on
12/
26/2
021
11:5
1:33
AM
. T
his
artic
le is
lice
nsed
und
er a
Cre
ativ
e C
omm
ons
Attr
ibut
ion
3.0
Unp
orte
d L
icen
ce.
View Article Online