Embed Size (px)
Citation preview
This journal is c the Owner Societies 2013 Phys. Chem. Chem. Phys., 2013, 15, 15163--15171 15163
Cite this: Phys. Chem.Chem.Phys.,2013,15, 15163
Hydrogen bond network topology in liquid water andmethanol: a graph theory approach†
Imre Bako,*a Akos Bencsura,a Kersti Hermannson,b Szabolcs Balint,a Tamas Grosz,a
Viorel Chihaiacd and Julianna Olahe
Networks are increasingly recognized as important building blocks of various systems in nature and
society. Water is known to possess an extended hydrogen bond network, in which the individual bonds
are broken in the sub-picosecond range and still the network structure remains intact. We investigated
and compared the topological properties of liquid water and methanol at various temperatures using
concepts derived within the framework of graph and network theory (neighbour number and cycle size
distribution, the distribution of local cyclic and local bonding coefficients, Laplacian spectra of the
network, inverse participation ratio distribution of the eigenvalues and average localization distribution
of a node) and compared them to small world and Erd +os–Renyi random networks. Various characteristic
properties (e.g. the local cyclic and bonding coefficients) of the network in liquid water could be repro-
duced by small world and/or Erd +os–Renyi networks, but the ring size distribution of water is unique
and none of the studied graph models could describe it. Using the inverse participation ratio of the
Laplacian eigenvectors we characterized the network inhomogeneities found in water and showed that
similar phenomena can be observed in Erd +os–Renyi and small world graphs. We demonstrated that the
topological properties of the hydrogen bond network found in liquid water systematically change with
the temperature and that increasing temperature leads to a broader ring size distribution. We applied
the studied topological indices to the network of water molecules with four hydrogen bonds, and
showed that at low temperature (250 K) these molecules form a percolated or nearly-percolated net-
work, while at ambient or high temperatures only small clusters of four-hydrogen bonded water
molecules exist.
Introduction
Network structures arise in a wide variety of different contexts,e.g. large communication systems, transportation related logisticproblems, social phenomena including networking sites, and in
biological systems.1 Graph and complex network theories allowus to map the large number of interactions into graphs, in whichusually just vertices and edges are used as the primary buildingblocks. Recently, various properties, including the degree dis-tribution, path length, clustering, and the spectral density of thegraph, have been introduced for the classification of networkstructures and to give insight into their interconnectivity andfine structure. Furthermore, the topology of real networks hasvery often been modeled and compared to the Erd+os–Renyi (ER)random graph2 or to the more complex Watts and Strogatzsmall-world (SW)3 graphs or scale free networks. These networksalso show the small world3 effect implying that although mostnodes are not neighbors of each other, they can still be reachedfrom every other one by a small number of hops or steps.
Hydrogen bonded (HB) networks play an important role indetermining the physical properties of many molecular liquidsand solids, and play a crucial role in the structure and functionof most biomolecules. Among these, water is the most exten-sively studied material, due to its simple molecular constitutionand high biological and chemical importance. The popularity
a Institute of Organic Chemistry, Research Centre for Natural Science,
Hungarian Academy of Sciences, Pusztaszeri ut 59-67, H-1025 Budapest, Hungary.
E-mail: [email protected]; Tel: +36 1-4381100/132b Ångstromlaboratoriet, Lagerhyddsv. 1, SE-751 21 Uppsala, Swedenc Institute of Physical Chemistry of Romanian Academy, Spl. Independentei 202,
Bucharest 77208, Romaniad Julich Supercomputing Centre, Wilhelm-Johnen-Straße, 52425 Julich, Germanye Department of Inorganic and Analytical Chemistry and Materials Structure and
Modeling Research Group of the Hungarian Academy of Sciences, Budapest
University of Technology and Economics, Gellert ter 4, H-1521 Budapest, Hungary
† Electronic supplementary information (ESI) available: Table S1: the fraction ofbonds between molecules with different numbers of hydrogen bonds; Fig. S1: thehistogram of the local bonding coefficient (rb) for the investigated systems;Fig. S2: spectral density of the Laplace matrix for the investigated systems;Fig. S3: the histogram of the local cyclic coefficient (rc) for the low-density patchof water at various temperatures (in K). See DOI: 10.1039/c3cp52271g
Received 30th May 2013,Accepted 9th July 2013
DOI: 10.1039/c3cp52271g
www.rsc.org/pccp
PCCP
PAPER
Ope
n A
cces
s A
rtic
le. P
ublis
hed
on 0
8 A
ugus
t 201
3. D
ownl
oade
d on
10/
4/20
21 9
:18:
55 P
M.
Thi
s ar
ticle
is li
cens
ed u
nder
a C
reat
ive
Com
mon
s A
ttrib
utio
n-N
onC
omm
erci
al 3
.0 U
npor
ted
Lic
ence
.
View Article OnlineView Journal | View Issue

15164 Phys. Chem. Chem. Phys., 2013, 15, 15163--15171 This journal is c the Owner Societies 2013
of liquid water as a solvent and many of its unusual properties4–8
are often attributed to its ability to form a strong and extensiveHB network.
Although using the toolbars of complex network theory thestructure of networks can be characterized, very little is knownabout the topologies of HB clusters found in various media.Recently, we investigated the topology of H bonded aggrega-tions in water9,10 (an example is shown in Fig. 1), water–methanol mixtures,11 formamide and acetic acid,12 and foundthat water molecules favour ring structures in contrast tomethanol molecules, which prefer to form non-cyclic entitiesin the bulk phase. We also showed that this behaviour can beinterpreted as the signature of the microscopic configurationalinhomogeneities in water–methanol mixtures. da Silva et al.arrived at the same conclusion using the spectral density ofadjacency matrices and the local clustering coefficients of thenetwork.13
In this article we give a comprehensive overview of thetopological properties of the hydrogen bond network in liquidwater and methanol focussing mainly on the cyclic topologyand the Laplacian spectra. In order to achieve our goal wecarried out molecular dynamics simulations on liquid waterand methanol, and at the same time generated a representativeset of ER and SW graphs. We analyzed the HB network alongthe MD trajectories and in the generated ER and SW graphs andprovide a statistical analysis of the obtained results. We showedthat the HB network in water is substantially different from thatfound in methanol, in agreement with earlier results obtainedby different methods, and that various properties of the water
network can be described by ER or SW graphs. In the secondpart of the paper we show how the introduced topologicalproperties can be applied to obtain further information onliquid structure. First, we describe the changes in the topolo-gical properties of water as a function of temperature. Then, wediscuss how the sub-network of low density patches14 (networkof four-hydrogen bonded water molecules) could be modelledand how their structures change with the temperature. Thislatter application is especially interesting as it is generallythought that the enhancement of the anomalies of the thermo-dynamic properties of water in the supercooled region is due tothe extensive formation of these hydrogen bonded tetrahedralstructures. We anticipate that the method presented here willgive insight into the fine-structure of various HB liquids andmixtures. It could also be useful in uncovering how solutesperturb the HB network of aqueous solutions and what kind ofchanges occur with increasing solute concentration or withchanges in temperature. It might also contribute to the excitingfield of HB networks formed on the surface of metals,15 whichalso play an important role in redox reactions.16
Methodology
Molecular dynamics (MD) simulations in the NVT ensemblewere performed using the DL_POLY 2.2017 program. Eachsystem (methanol, water) consisted of 2048 molecules in acubic box at an average temperature of 300 K. Periodic bound-ary conditions were employed and the Ewald summation wasused to handle the long-range Coulombic interactions. The sidelengths of the cubes were chosen to correspond to the experi-mental densities. In the case of water, further simulations werecarried out at 250 K and 350 K.
The MD trajectories were generated using the SPC/E18 andOPLS19 all site intermolecular potential model for water andmethanol, respectively. Although, in recent years a few short-comings of the SPC/E model have been shown in describing theproperties (e.g. phase diagram) of liquid water,20 due to itssimplicity it is still commonly used in the literature, andtherefore it was used for the present study. The freezing pointof water is around 215.5 K when modeled with the SPC/E modelunder normal conditions,20 for this reason all simulationswere carried out above this temperature. Application of themethod presented herein to simulations using more accuratewater models like TIP4P/2005,21 and BK322 is in progress in ourlaboratory.
After 600 000 equilibration steps, another 5 000 000 stepswere simulated leading to a simulation time of 5.00 ns for eachsystem. Every 0.1 ps a snapshot has been taken and the HBtopology has been analyzed. The cumulative data have beenused for the statistical analysis of the H bond network topolo-gies. As the best definition of a hydrogen bond has been longdebated,23 here two molecules were regarded as H-bonded ifthe O� � �H distance was shorter than 2.5 Å, and the interactionenergy smaller than �3.0 kcal mol�1. We also tested the effectof using another definition of hydrogen bonds (O� � �H distanceshorter than 2.5 Å, and the H–O� � �O angles less than 301), but
Fig. 1 Schematic view of a typical H-bond network in simulated water (a) andmethanol (b).
Paper PCCP
Ope
n A
cces
s A
rtic
le. P
ublis
hed
on 0
8 A
ugus
t 201
3. D
ownl
oade
d on
10/
4/20
21 9
:18:
55 P
M.
Thi
s ar
ticle
is li
cens
ed u
nder
a C
reat
ive
Com
mon
s A
ttrib
utio
n-N
onC
omm
erci
al 3
.0 U
npor
ted
Lic
ence
.View Article Online

This journal is c the Owner Societies 2013 Phys. Chem. Chem. Phys., 2013, 15, 15163--15171 15165
as the conclusions based on both definitions qualitativelyagreed, only results based upon the first definition will bepresented here.
The Erd +os–Renyi (ER) random graph model generates agraph that has a fixed number of nodes (equal to the numberof molecules in the simulation box, N = 2048 in our case) whichare connected randomly by bonds at edges. The average neigh-bor number of the generated random configurations was set tobe 2.95 (ER2.95) or 4 (ER4.0). The first number was chosen as itagrees well with the average coordination number of themolecules in pure water, and the second number (4) waschosen as a representation of four-coordinated molecules andthis number can be easily used to generate the small worldgraphs. In the first case the probability of the occurrence of abond between two nodes is log(N)/N = pc, and in this case arandom graph almost certainly becomes a percolated network.
In the case of the small-world graph of Strogatz and Watts(SW) we built on the ring lattice C(2048,2). In this caseeach node is connected to exactly four neighbors. The smallworld model is then created by moving, with rewiring prob-abilities of 0.1 (SW1), 0.2 (SW2) and 0.4 (SW3), one end ofeach bond to a new location chosen uniformly in the ring lattice.In both network models we generated 1000 independentconfigurations.
Results and discussionTopological properties of water, methanol, ER and SW graphs
We analyzed the average number of HBs per molecule or node(for simplicity later we will only refer to them as node) andobtained for water hki = 2.95, for methanol hki = 1.77, for the ERgraphs: ER2.95: hki = 2.95, ER4.0: hki = 4, and hki = 4 for all SWgraphs independent of the rewiring probability. The value forwater l is in accordance with their well-known structure, whilethe values for the ER and SW graphs originate from thegenerating algorithm.
Various studies have been published recently on the struc-ture of liquid methanol. Classical simulations suggested thatthe major cluster present in the liquid is that of branchedchains, and that the number of ring structures is negligiblysmall.24,25 However, when reverse Monte Carlo simulationswere used, the occurrence of rings increased significantly.25
In Table 1, we have collected the statistical properties of liquid
methanol obtained from our study. Furthermore, we investi-gated the effect of branches on the overall liquid structure bydeleting the hydrogen bonds to branch points from the struc-ture. Using the latter method, branch points became monomers,thus increasing the f0 fraction of the clusters, and moleculesoriginally hydrogen bonded to branch points became either endpoints, increasing the f1 fraction, or monomers increasing the f0
fraction. As originally about 2% of molecules belonged to thecluster of monomers, and 7% to the cluster of branch points, thefact that the ratio of the f0 fraction increased to 14% instead of9% indicates that in the case of 5% of the chains there is abranch point at the last but one molecule of the chain. Theaverage gel cluster (all clusters with the exception of monomers)size of liquid methanol is 10, which decreases to 4.8 whenhydrogen bonds to branch points are deleted from the structure.We performed further analyses of the fraction of bonds betweenmolecules with different numbers of hydrogen bonds (Table S1,ESI†). The data demonstrate that the majority of the moleculesare bonded to molecules with two hydrogen bonds, in completeaccordance with the previously suggested chain-like structure ofliquid methanol.
The fraction of nodes with exactly j bonds is shown in Fig. 2.The shape and the width of the bonded neighbor numberdistributions exhibit significant differences in the studiedsystems. The distribution function of methanol is narrow,and most molecules have only two bonded neighbors in accor-dance with the chain-like structure suggested earlier. Thisdistribution is best modelled by the SW1 graph, but it iscentered on k = 4. The distribution function of SW graphsbecomes wider and flatter with increasing rewiring probability,but maintains their peak position at k = 4. The ER networkdistributions have long tails indicating that a small number ofnodes have many bonded neighbors in contrast to the SWnetworks or to physically existing water and methanol systemswhere steric constraints impede the formation of such nodes.There is an apparent similarity between the degree distributionof water and SW3, with the main difference being a small shiftof the center of the peak.
Table 1 Statistical properties of the molecular clusters in liquid methanol asresulted from molecular dynamics simulation. fi indicates fraction of moleculeswith exactly i hydrogen bonds, nHB is the average number of hydrogen bondsand ng average gel size
f0 f1 f2 f3 nHB ng
Alla 0.02 0.246 0.653 0.072 1.77 10.68Wobpb 0.148 0.350 0.501 — 1.35 4.82
a All molecules were considered. b Wobp stands for without branchpoints. Methanol molecules with three hydrogen bonds (branch points)were converted to monomers in the statistical analysis. Hydrogenbonds to these molecules were omitted.
Fig. 2 Fraction of bonded neighbours (P(k)) as a function of the number of HBneighbours (k).
PCCP Paper
Ope
n A
cces
s A
rtic
le. P
ublis
hed
on 0
8 A
ugus
t 201
3. D
ownl
oade
d on
10/
4/20
21 9
:18:
55 P
M.
Thi
s ar
ticle
is li
cens
ed u
nder
a C
reat
ive
Com
mon
s A
ttrib
utio
n-N
onC
omm
erci
al 3
.0 U
npor
ted
Lic
ence
.View Article Online

15166 Phys. Chem. Chem. Phys., 2013, 15, 15163--15171 This journal is c the Owner Societies 2013
Earlier, we have shown that liquid water contains severalcyclic structures.9 In order to estimate the cycle to open chainratio in the systems, ring search algorithms26 were used to findprimitive rings, which cannot be decomposed into smallerrings, of oxygen atoms and hydrogen bonds.
The ring size distribution of methanol or water has a well-defined maximum around 5 and 6, and is substantially differ-ent from that of the graph models (see Fig. 3). In the case ofmethanol this number agrees with the methanol hexamerstructures observed on the surface of Au(111).27 However, inmethanol we found approximately three orders of magnitudesmaller number of cyclic entities than in water or in the graphmodels, which has to be taken into account when the data areinterpreted for methanol. A further breakdown of the ring-sizedistribution of methanol shows that 97.7% of the molecules arefound in non-cyclic structural elements (as monomers ormembers of a linear chain), 2.3% belong to primitive rings,and only about 0.01% of the molecules belong to compositerings, indicating a statistically insignificant contribution to theoverall structure. A molecule is said to be part of a compositering, if it belongs to two or more primitive rings. The obtainedvalues are in good agreement with the results of earlier classicalsimulations,24,25 and with the structure that can be envisagedbased upon Fig. 1.
In SW networks many small-sized structural entities existcompared to the other systems, but their number decreaseswith increasing rewiring probability giving place to the forma-tion of larger rings. The ring size of 3 corresponds to a clique,which is a maximal complete subgraph of three or more nodes.In the case of water we did not find such a motif, which isprobably due to the steric constraint that would destabilizesuch a small ring. The lack of 6-membered rings in all SWgraphs is in sharp contrast to the water and methanol systems.The ER networks contain only rings with more than 5 nodes inconsiderable amounts, and the probability of the occurrence ofthe rings rises sharply with the ring size. Therefore it seemsthat the network structure of water is quite peculiar that is notimitated by the graph models used in this study.
The local cyclic coefficient (rci) of a node i (eqn (1)) and thelocal bonding coefficient of a bond (rb, eqn (2)) characterize thedegree of circulation in complex networks:28
rci ¼2
ki ki � 1ð ÞX
j
1
Slmi(1)
rb ¼1
Nc
X
c
1
nc(2)
where ki is the number of bonded neighbors of the ith nodeand Slmi is the smallest sized closest path that passes throughi and its two neighbor sites, l and m, and Nc is the numberof primitive rings, which contain the bond, and nc is the sizeof the cycles. From these, the value of rci can vary from zero,when the network has perfect tree-like structure, to the max-imum of 1/3. Larger values of rci imply more rings, and rci
becomes equal to 1/3 when all the neighbor pairs of the nodehave direct links to each other. The value of rb is proportionalto 1/Nc and if there are no rings in the system, the value ofrb diverges to infinity. Therefore, in eqn (2) we investigatedonly those edges (bonds), which are incorporated at least inone cyclic structure. The smallest cyclic size was 3 (nc). If thereare only three-membered cycles in the system, the value ofrb reaches its maximum, it is equal to 1/3. However, when thereare larger rings in the system, the value of rb decreases,similarly to the value of rci. The probability distribution ofrc (Fig. 4) and rb (Fig. S1 in the ESI†) exhibits similar features.The P(rc) distribution of ER and water networks shows Poisson-like shapes with a peak around 0.10 and 0.12, respectively.The distribution of the SW1 network has a strong peak at 0.21,due to the presence of many small, three-membered ringsdiscussed above. With increasing rewiring probability theshape of the distribution function changes significantly indi-cating the formation of new, larger structural elements, and inthe case of SW3 a larger wide peak appears between 0.1–0.15similar to that found in water.
The structure of the networks can be completely describedby the associated adjacency (A), combinatorial Laplace (L) or
Fig. 3 Size distribution of cyclic entities as a function of nc, number of nodesforming the cycle.
Fig. 4 Histograms of the local cyclic coefficients (rc).
Paper PCCP
Ope
n A
cces
s A
rtic
le. P
ublis
hed
on 0
8 A
ugus
t 201
3. D
ownl
oade
d on
10/
4/20
21 9
:18:
55 P
M.
Thi
s ar
ticle
is li
cens
ed u
nder
a C
reat
ive
Com
mon
s A
ttrib
utio
n-N
onC
omm
erci
al 3
.0 U
npor
ted
Lic
ence
.View Article Online
This journal is c the Owner Societies 2013 Phys. Chem. Chem. Phys., 2013, 15, 15163--15171 15167
normalized Laplace matrices (L3).29–32 The adjacency matrix isdefined as Aij = 1 if a bond exists between the nodes i and j andAij = 0 otherwise. The combinatorial Laplace matrix is definedaccording to eqn (3) as:
Lij = kidij � Aij (3)
where ki is the number of bonded neighbors of node i.The spectrum of a graph is the set of eigenvalues of its
corresponding matrices (A, L). Properties of the eigenvalues andthe eigenvectors of these matrices are characteristic of thenetwork structure. The solutions to diffusion and flow pro-blems related to liquids forming complex networks (spreadingdiseases, random walks) were earlier shown to be closelyrelated to the combinatorial Laplacian spectra.29
The Laplacian spectra of water, SW and ER networks arecontinuous like (see Fig. S2, ESI†), but that of methanol hasseveral well-defined peaks (l = 1, 1.5, 2, 3. . .). Laplacian spectraof these continuous like graphs are skewed with the main bulkpointing towards the small eigenvalues. It has already beenshown that with increasing average neighbor number (ERgraph) or rewiring probability (SW graph) the bulk part of thespectrum becomes bell-shaped.31 In the uncorrelated graph thespectral density converges to a semicircular distribution asdescribed by Wigner’s-law.
The smallest positive eigenvalue of a Laplacian or Fiedlereigenvalue31 is a measure of how strongly the network isconnected. In the case of water (see Fig. 5) we detected a peakat 0.05 indicating the existence of strong network communities.An increase in the clustering coefficients of ER graphs results ina group of eigenvalues close to 0.0.
Another prominent feature of the eigenvalue problem ofthe L matrices is revealed by the structure and localization ofthe components of the eigenvectors. We can characterize theseeigenvectors (lj) using the inverse participation ratio (I) as
Ij ¼X
i
Vji4 (4)
where Vji is the ith element of jth eigenvector. I ranges from theminimal value of 1/N corresponding to the eigenvector distrib-uted equally on all nodes to a maximum of 1 for a vector with
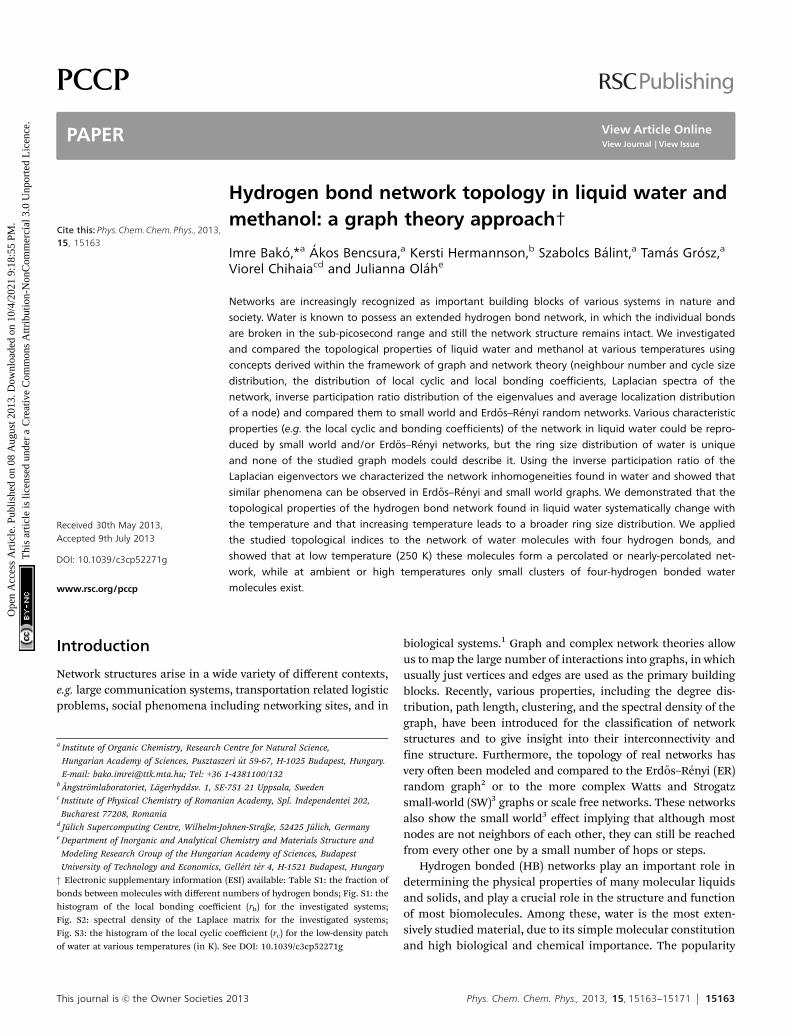
only one nonzero component.29c,32 Similarly, we can characterizethe average localization of the ith node as
Di ¼X
j
Vji4 (5)
where the summation goes over the ith components of the eigen-values. It has to be noted here that Ij should not be mixed up with Di
in eqn (5). The index i stands for a node and j stands for theeigenvectors of Laplacian. Hence Ij is characterized by the localiza-tion of the j eigenvectors and Di is characterized by the i nodes.
Fig. 6 depicts the localization of the eigenvectors andimplies that the degree of localization is significantly higherat larger eigenvalues in the case of ER, SW and water networks,while remains almost constant for methanol. The large peaksoccurring for water at eigenvalues 1, 2 and 3 indicate thepresence of monomers, dimers and trimers.
The localization function of the nodes changes significantlywith the neighbor number, and for low neighbor numbers ithas a power-tail like distribution for water, ER and SW graphsimplying the homogeneity of the system (see Fig. 7). As the
Fig. 5 Spectral density of the Laplace matrix at small eigenvalues.
Fig. 6 Inverse participation ratio of Laplacian eigenvectors plotted against thecorresponding eigenvalues.
Fig. 7 Histograms of the average localization of a node decomposed accordingto the neighboring number. Symbols corresponding to nodes with variousneighbor numbers are shown in the figure of methanol, but for all systems thesame symbols are used.
PCCP Paper
Ope
n A
cces
s A
rtic
le. P
ublis
hed
on 0
8 A
ugus
t 201
3. D
ownl
oade
d on
10/
4/20
21 9
:18:
55 P
M.
Thi
s ar
ticle
is li
cens
ed u
nder
a C
reat
ive
Com
mon
s A
ttrib
utio
n-N
onC
omm
erci
al 3
.0 U
npor
ted
Lic
ence
.View Article Online

15168 Phys. Chem. Chem. Phys., 2013, 15, 15163--15171 This journal is c the Owner Societies 2013
neighbor number increases the shape of the P(Id) functionchanges and becomes tree-like indicating inhomogeneities.The most eye-catching change occurs at Id = 5 for water, Id = 6–7for the ER2.95 and SW3 graphs, while it was present at almostall Id values for methanol. From the tree-like structure ofmethanol we can clearly detect the existence of the differentlocalization of 1, 2 or 3 H-bonded methanol molecules. Thisresult is consistent with the known differences between thenetwork structure of water and methanol, and it also showsthat from this aspect ER and SW graphs can be tuned to behavelike water or methanol.
Changes in the topological properties of water as a function oftemperature
Our findings on the topological properties of water, methanoland small world graphs suggest that these properties maycapture some of the intrinsic properties of liquid structure.For this reason, we decided to apply them to liquid water atvarious temperatures (250 K, 300 K and 350 K) and investigatewhether any systematic differences could be detected in the HBstructure of water at low, ambient and high temperatures.
First, we have analyzed the intermolecular pair correlationfunction of the O� � �O distances (see Fig. 8). With increasingtemperature we observe that (1) the second peak at 4.8 Ådisappears and (2) the minimum (at the O� � �O distance of3.4 Å) is filled up. Both of these phenomena indicate thedisappearance of the second solvation shell of water at highertemperatures, which is also due to the appearance of interstitialwater molecules, which, although they are close to the centralwater molecule, do not form hydrogen bonds with it. Theirappearance may also contribute to the decrease of the densityof water.
The collected values in Table 2 show that the average hydro-gen bond number (hki and hk4i) and the number of cycles(Nc and Nc,4) significantly decrease with increasing temperature.
Analysis of the changes in the cycle size distribution of wateras a function of temperature (Fig. 9a) also indicates thedisappearance of the second solvation shell. While at low
temperature 5 and 6 membered ring structures dominate thenetwork structure, at higher temperatures the contribution oflarger rings to the liquid structure is also significant. The sameconclusion can also be drawn from Fig. S3 (ESI†), where thedistribution of local cyclic coefficients (rci) is shown. As men-tioned above, the value of rci = 0 implies a perfect tree-likestructure of the network, while the maximum value of rci is 1/3.We can observe that with increasing temperature the distribu-tion function becomes wider while the peak height of thelargest peak decreases, indicating that the uniformity of thenetwork structure observed at low temperature (i.e. that 5 and 6membered rings dominate the network structure as concludedfrom Fig. 9a) changes as the temperature increases and new
Fig. 8 O� � �O partial radial distribution functions of water at various tempera-tures (in K).
Table 2 Average neighbor number (hki), number of primitive rings (Nc) in waterat various temperatures. Average neighbor number (hk4i), fraction of watermolecules with four hydrogen bonded neighbors (F4), number of primitive rings(Nc,4) in the low density patch of water at various temperatures
T (K) hki Nc hk4i F4 Nc,4
250 3.18 2978.1 1.41 0.566 309.2300 2.95 2197.3 0.85 0.423 81.9350 2.68 1530.1 0.52 0.323 25.8
Fig. 9 (a) Cycle size distribution in water as a function of temperature. (b) Cyclesize distribution of the low density patch (neighbouring hydrogen bond number(k) is 4).
Paper PCCP
Ope
n A
cces
s A
rtic
le. P
ublis
hed
on 0
8 A
ugus
t 201
3. D
ownl
oade
d on
10/
4/20
21 9
:18:
55 P
M.
Thi
s ar
ticle
is li
cens
ed u
nder
a C
reat
ive
Com
mon
s A
ttrib
utio
n-N
onC
omm
erci
al 3
.0 U
npor
ted
Lic
ence
.View Article Online
This journal is c the Owner Societies 2013 Phys. Chem. Chem. Phys., 2013, 15, 15163--15171 15169
topological elements with larger rings make the network struc-ture more versatile.
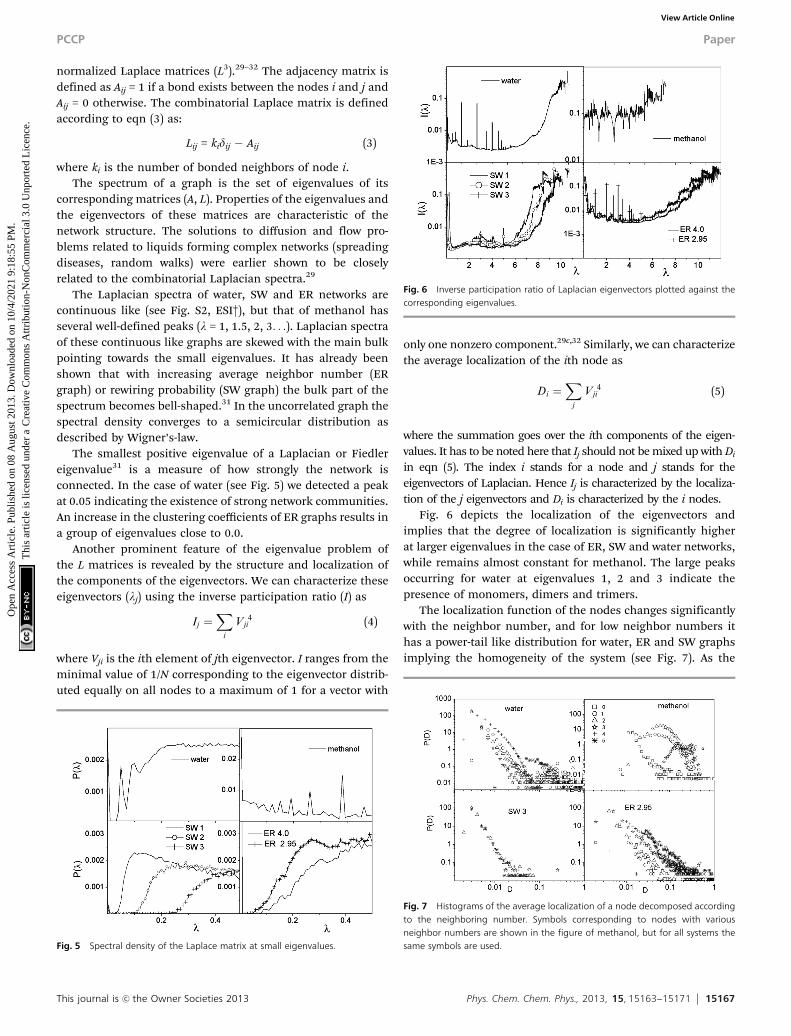
Finally, we compared the spectral densities of the Laplacematrices as a function of temperature (Fig. 10a). Significantchanges in the spectra occur primarily at low l values. Onthe one hand the first peak gets closer to 0, and on the otherhand the second peak becomes much less pronounced asthe temperature increases (see the inset in Fig. 10a). Theseimply that fundamental changes occur in the network struc-ture as the temperature increases. Furthermore, the increase ofthe peaks at l = 1 and 2 also indicates that there are moreand more monomers and dimers in the system as the temper-ature increases in accordance with earlier results indicatingthe increasing presence of interstitial water molecules.
Topological properties of water molecules with four hydrogenbonds
Stanley et al. suggested that water molecules with four hydro-gen bonds form small ramified patches whose density is lowerthan that of water (low density patches).14,33,34 As these
tetrahedral structures are thought to play a major role in theenhancement of the anomalies in the thermodynamic proper-ties of water in the supercooled state we decided to compare thetopological properties of the low density patches at varioustemperatures. We used the same procedure presented above,but the adjacency matrix of the low density patches was definedas Aij,4 = 1 if a bond exists between the nodes i and j, and bothki = 4 and kj = 4, otherwise Aij = 0.
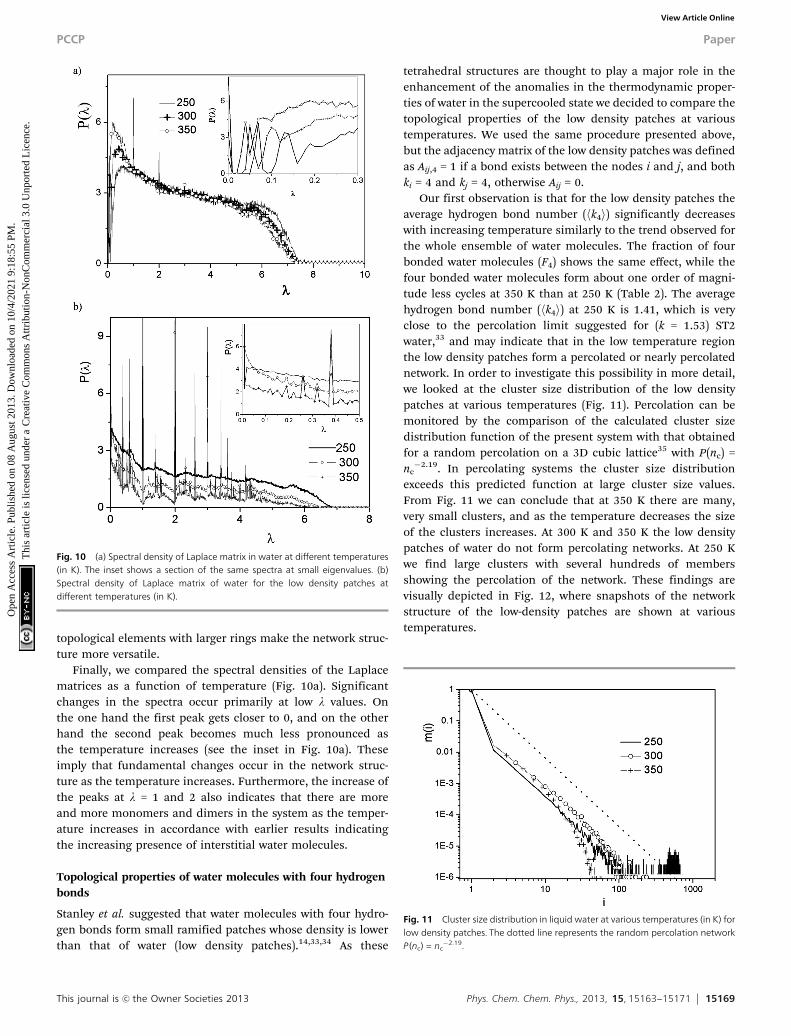
Our first observation is that for the low density patches theaverage hydrogen bond number (hk4i) significantly decreaseswith increasing temperature similarly to the trend observed forthe whole ensemble of water molecules. The fraction of fourbonded water molecules (F4) shows the same effect, while thefour bonded water molecules form about one order of magni-tude less cycles at 350 K than at 250 K (Table 2). The averagehydrogen bond number (hk4i) at 250 K is 1.41, which is veryclose to the percolation limit suggested for (k = 1.53) ST2water,33 and may indicate that in the low temperature regionthe low density patches form a percolated or nearly percolatednetwork. In order to investigate this possibility in more detail,we looked at the cluster size distribution of the low densitypatches at various temperatures (Fig. 11). Percolation can bemonitored by the comparison of the calculated cluster sizedistribution function of the present system with that obtainedfor a random percolation on a 3D cubic lattice35 with P(nc) =nc�2.19. In percolating systems the cluster size distribution
exceeds this predicted function at large cluster size values.From Fig. 11 we can conclude that at 350 K there are many,very small clusters, and as the temperature decreases the sizeof the clusters increases. At 300 K and 350 K the low densitypatches of water do not form percolating networks. At 250 Kwe find large clusters with several hundreds of membersshowing the percolation of the network. These findings arevisually depicted in Fig. 12, where snapshots of the networkstructure of the low-density patches are shown at varioustemperatures.
Fig. 10 (a) Spectral density of Laplace matrix in water at different temperatures(in K). The inset shows a section of the same spectra at small eigenvalues. (b)Spectral density of Laplace matrix of water for the low density patches atdifferent temperatures (in K).
Fig. 11 Cluster size distribution in liquid water at various temperatures (in K) forlow density patches. The dotted line represents the random percolation networkP(nc) = nc
�2.19.
PCCP Paper
Ope
n A
cces
s A
rtic
le. P
ublis
hed
on 0
8 A
ugus
t 201
3. D
ownl
oade
d on
10/
4/20
21 9
:18:
55 P
M.
Thi
s ar
ticle
is li
cens
ed u
nder
a C
reat
ive
Com
mon
s A
ttrib
utio
n-N
onC
omm
erci
al 3
.0 U
npor
ted
Lic
ence
.View Article Online

15170 Phys. Chem. Chem. Phys., 2013, 15, 15163--15171 This journal is c the Owner Societies 2013
We compared the cycle size distribution of the low densitypatches (Fig. 9b) to the overall HB network in water. At 350 Kfour-membered cycles dominate the network structure of thelow-density patches, but with decreasing temperature cyclesizes of mainly 5 (and 6) become dominant. This observationis interesting because it shows that at 250 K the low densitypatches begin to have a similar cycle size distribution that ischaracteristic of the overall HB structure of water at ambienttemperatures.
Finally, we studied the Laplace spectra of the low densitypatches (Fig. 10b). At 350 K there are many more peaks close tozero than at 250 K, which, as mentioned above, indicate thepresence of disconnected components (i.e. in our case clusters).This result is in very good agreement with the conclusionsdrawn from Fig. 11 or 12: at 350 K there are many small clustersof four-hydrogen bonded molecules, which do not form a singlepercolated network. The network structure continuouslychanges as the temperature decreases and at 250 K, thereare more molecules with 4-hydrogen bonds and they form apercolated network.
Conclusions
We studied and compared the topological properties of liquidwater, methanol, small world and Erd +os–Renyi random net-works. We used various descriptors to characterize them: theneighbour number distribution, cycle size distribution, thedistribution of local cyclic and local bonding coefficients,Laplacian spectra of the network, inverse participation ratio
distribution of the eigenvalues and average localization distri-bution of a node. We demonstrated that several properties (e.g.the local cyclic and bonding coefficients) of the network inwater resemble the SW and/or ER networks. However, ourresults also indicate that the ring size distribution of water isvery characteristic and none of the studied graph models couldbe used to describe it. Using the inverse participation ratio ofthe Laplacian eigenvectors, we found that network inhomo-geneities occur in water at neighboring numbers larger than 4and showed that similar phenomena can be observed in ER andSW graphs.
We also tested the predicting power of the topologicalproperties in two applications. First, we studied the tempera-ture dependence of the topological properties of the hydrogenbond network in liquid water and showed that (1) at lowtemperatures 5 and 6 membered rings dominate the networkstructure of water and (2) with increasing temperature thetopological properties indicate the disappearance of the secondsolvation shell of water and the appearance of larger ringstructures together with the increasing presence of interstitialwater molecules. The latter findings are in accordance withprevious experimental and theoretical findings. We also inves-tigated the network structure of low density patches (of watermolecules with four hydrogen bonds) at low temperature (250 K)and found that these patches form an extended, percolatednetwork, that is not present at 300 K or 350 K.
We hope that our results could open up new ways for theapplication of the tools of network theory to HB networks andthat they could contribute to our understanding of the staticand dynamical network structure of hydrogen bonded sub-stances. They could also provide a means for the study ofinhomogeneities in the hydrogen bond network of aqueoussolutions and mixtures or even on metal surfaces playing a rolein redox reactions.
Acknowledgements
The authors thank Hungarian OTKA for grant number:K108721. J.O. is thankful for the financial support of theEuropean Commission under a Marie Curie Fellowship (project‘‘Oestrometab’’) and of the New Szechenyi Plan (TAMOP-4.2.2/B-10/1-2010-0009). K.H. acknowledges support from the Swedishnational strategic research program in e-science eSSENCE. Weare grateful to the Hungarian NIIF computer resource centre andJuellich Supercomputer Center.
Notes and references
1 R. Albert and A.-L. Barabasi, Rev. Mod. Phys., 2002, 74, 47;S. N. Dorogovtsev and F. F. Mendes, Adv. Phys., 2002,51, 1079; H. Jeong, S. Mason, R. Albert, A.-L. Barabasi andZ. N. Oltvai, Nature, 2001, 411, 41; A.-L. Barabasi andR. Albert, Science, 1999, 286, 509; M. E. J. Newmann,S. H. Strogatz and D. J. Watts, Phys. Rev. E: Stat., Nonlinear,Soft Matter Phys., 2001, 64, 026118; S. Boccaletti, V. Latora,Y. Moreno, M. Chavez and D.-U. Hwang, Phys. Rep., 2006,
Fig. 12 Selected examples of the low density patches found in water at 250 K(a) and 350 K (b). HB network of water at ambient temperature is depicted inFig. 1 for comparison.
Paper PCCP
Ope
n A
cces
s A
rtic
le. P
ublis
hed
on 0
8 A
ugus
t 201
3. D
ownl
oade
d on
10/
4/20
21 9
:18:
55 P
M.
Thi
s ar
ticle
is li
cens
ed u
nder
a C
reat
ive
Com
mon
s A
ttrib
utio
n-N
onC
omm
erci
al 3
.0 U
npor
ted
Lic
ence
.View Article Online
This journal is c the Owner Societies 2013 Phys. Chem. Chem. Phys., 2013, 15, 15163--15171 15171
424, 175; J. Onnela, J. Saramaki, J. Hyvonen, G. Szabo,M. A. de Menezes, K. Kaski, A.-L. Barabasi and J. Kertesz,New J. Phys., 2007, 9, 179.
2 P. Erd +os and A. Renyi, Publ. Math., 1959, 6, 290; P. Erd +osand A. Renyi, Acta Math. Acad. Sci. Hung., 1961, 12, 261;B. Bollobas, Random graph, Academic London, 1985.
3 D. J. Watts and S. H. Strogatz, Nature, 1999, 393, 440.4 Homepage of M. Chaplin, http://www.lsbu.ac.uk/water/.5 F. Sciortiono and S. L. Fornili, J. Chem. Phys., 1989, 90, 2786;
P. Kumar, G. Franzese, S. V. Buldyrev and H. E. Stanley,Phys. Rev. E: Stat., Nonlinear, Soft Matter Phys., 2006,73, 041505; H. E. Stanley, Z. Phys. Chem., 2009, 223, 939;J. Holzmann, A. Appelhagen and R. Ludwig, Z. Phys. Chem.,2009, 223, 1001; D. A. Schmidt and K. Miki, J. Phys. Chem. A,2007, 111, 10119; D. A. Schmidt and K. Miki, ChemPhysChem,2008, 9, 1914.
6 A. Luzar, Chem. Phys., 2000, 258, 267; A. Luzar andD. Chandler, Nature, 1996, 379, 55.
7 J. R. Errington and P. G. Debenedetti, Nature, 2001, 409, 318;J. R. Errington, P. G. Debenedetti and S. Torquato, Phys. Rev.Lett., 2002, 89, 215503.
8 M. Matsumoto, A. Baba and I. Ohmine, J. Chem. Phys., 2007,127, 134504; M. Matsumoto, AIP Conf. Proc., 2008,982, 21854.
9 I. Bako, T. Megyes, S. Balint and V. Chihaia, Phys. Chem.Chem. Phys., 2008, 32, 5004.
10 G. Palinkas and I. Bako, Z. Naturforsch., A: Phys. Sci., 1990,46, 95.
11 I. Bako, T. Megyes, S. Balint, T. Grosz and M.-C. Bellisent-Funel, J. Chem. Phys., 2010, 132, 014506.
12 T. Megyes, S. Balint, T. Grosz, L. Kotai and I. Bako, J. Mol.Liq., 2008, 143, 23.
13 J. A. B. da Silva, F. G. B. Moreira, V. M. L. dos Santos andR. L. Longo, Phys. Chem. Chem. Phys., 2011, 13, 6452;A. B. da Silva, F. G. B. Moreira, V. M. L. dos Santos andR. L. Longo, Phys. Chem. Chem. Phys., 2011, 13, 593; V. M. L.dos Santos, F. G. B. Moreira and R. L. Longo, Chem. Phys.Lett., 2004, 390, 157.
14 A. Geiger and H. E. Stanley, Phys. Rev. Lett., 1982, 49, 1749.15 M. Mura, F. Silly, V. Burlakov, M. R. Castell, G. Andrew,
D. Briggs and L. N. Kantorovich, Phys. Rev. Lett., 2012,108, 176103.
16 M. Forster, R. Raval, A. Hodgson, J. Carrasco andA. Michaelides, Phys. Rev. Lett., 2011, 106, 046103.
17 DL_POLY is a package of molecular simulation routineswritten by W. Smith and T. Forester, CCLRC, DaresburyLaboratory, Daresbury, Nr. Warrington, 1996.
18 H. J. C. Berendsen, J. R. Grigera and T. P. Straatsma, J. Phys.Chem., 1987, 91, 6269.
19 W. L. Jorgensen, D. S. Maxwell and J. Tirado-Rives, J. Am.Chem. Soc., 1996, 118, 11225; W. L. Jorgensen, Encyclopediaof Computational Chemistry, Wiley, New York, 1998, vol. 3,Chap. OPLS Force Fields.
20 P. T. Kiss and A. Baranyai, J. Chem. Phys., 2011, 134, 054106.21 J. L. F. Abascal and C. Vega, J. Chem. Phys., 2005,
123, 234505.22 P. T. Kiss and A. Baranyai, J. Chem. Phys., 2013, 138, 204507.23 R. Kumar, J. R. Schmidt and J. L. Skinner, J. Chem. Phys.,
2007, 126, 204107 and references therein.24 P. Gomez-Alvarez, L. Romanı and D. Gonzalez-Salgado,
J. Chem. Phys., 2013, 138, 044509; J. Lehota, M. Hakalaand K. Hamalainen, J. Phys. Chem. B, 2010, 114, 6426.
25 A. Vrhovsek, O. Gereben, A. Jamnik and L. Pusztai, J. Phys.Chem. B, 2011, 115, 13473.
26 V. Chihaia, S. Adams and W. F. Kuhs, Chem. Phys., 2005,317, 208.
27 J. L. Timothy, J. Carrasco, A. E. Baber, A. Michaelides,E. Charles and H. Sykes, Phys. Rev. Lett., 2011, 107, 256101.
28 H.-J. Kim and J.-M. Kim, Phys. Rev. E: Stat., Nonlinear, SoftMatter Phys., 2005, 72, 036109; H.-J. Kim and Y.-M. Choi,J. Phys. Soc. Jpn., 2007, 76, 044801.
29 (a) S. N. Dorogovtsev, A. V. Goltsev, J. F. F. Mendes andA. N. Samuhkin, Phys. Rev. E: Stat., Nonlinear, Soft MatterPhys., 2003, 68, 046109; (b) I. J. Farkas, I. Derenyi,A.-L. Barabasi and T. Vicsek, Phys. Rev. E: Stat., Nonlinear,Soft Matter Phys., 2001, 64, 026704; (c) P. N. Mcgraw andM. Menzinger, Phys. Rev. E: Stat., Nonlinear, Soft MatterPhys., 2008, 77, 031102; (d) F. Chung, L. Liu and V. Vu, Proc.Natl. Acad. Sci. U. S. A., 2003, 100, 6313; (e) A. N. Samuhkin,S. N. Dorogovtsev and J. F. F. Mendes, Phys. Rev. E: Stat.,Nonlinear, Soft Matter Phys., 2008, 77, 036115; ( f ) E. P.Wigner, Ann. Math., 1955, 62, 548; (g) E. P. Wigner, Ann.Math., 1957, 65, 203; (h) E. P. Wigner, Ann. Math., 1958,67, 325.
30 M. Barahona and L. M. Pecora, Phys. Rev. Lett., 2002,89, 054101; R. Kuhn and J. van Mourik, J. Phys. A: Math.Theor., 2011, 44, 165205; X. Ma, L. Huang, Y. C. Lai andZ. Zheng, Phys. Rev. E: Stat., Nonlinear, Soft Matter Phys.,2009, 79, 056106.
31 M. Fiedler, Czech. Math. J., 1973, 23, 298.32 M. Mitrowic and B. Tadic, Phys. Rev. E: Stat., Nonlinear, Soft
Matter Phys., 2009, 80, 026123.33 R. L. Blumberg, H. E. Stanley, A. Geiger and P. Mausbach,
J. Chem. Phys., 1984, 80, 5230.34 H. E. Stanley and J. Teixeira, J. Chem. Phys., 1980, 73, 3404.35 A. Oleinikova, I. Brovchenko, A. Geiger and B. Guillot,
J. Chem. Phys., 2002, 117, 3296; N. Jan, Physica A, 1999,266, 72.
PCCP Paper
Ope
n A
cces
s A
rtic
le. P
ublis
hed
on 0
8 A
ugus
t 201
3. D
ownl
oade
d on
10/
4/20
21 9
:18:
55 P
M.
Thi
s ar
ticle
is li
cens
ed u
nder
a C
reat
ive
Com
mon
s A
ttrib
utio
n-N
onC
omm
erci
al 3
.0 U
npor
ted
Lic
ence
.View Article Online