Embed Size (px)
Citation preview
This journal is© the Owner Societies 2014 Phys. Chem. Chem. Phys., 2014, 16, 7881--7886 | 7881
Cite this:Phys.Chem.Chem.Phys.,
2014, 16, 7881
A near ambient pressure XPS study of Auoxidation†
Alexander Yu. Klyushin,*a Tulio C. R. Rocha,a Michael Havecker,ab
Axel Knop-Gerickea and Robert Schlogla
The surface of a gold foil under ozone oxidation was examined by near ambient pressure X-ray
photoelectron spectroscopy (NAP-XPS) and scanning electron microscopy (SEM). Our in situ
observations show that a surface oxide phase is formed during the exposure to ozone; however this
phase decomposes under vacuum and even in the presence of ozone at temperatures higher than
300 1C. Assuming that an oxide overlayer completely covers the Au surface, the thickness of the oxide
phase was estimated to be between 0.29 and 0.58 nm by energy-dependent XPS depth profiling. The
surface oxidation led to structural modifications of the gold surface. These morphological changes do
not disappear even under vacuum. In the Au 4f spectra, an additional component at low binding energy
(83.3 eV), which appears during/after O3 treatment, is assigned to the presence of low-coordinated
atoms which appear on the Au surface as a result of surface restructuring under oxidation. Ex situ SEM
images demonstrate that only the region of the sample that was exposed to O3 shows the presence of
ridges on the Au surface.
Introduction
The noble character of bulk Au has been well known forcenturies. Corrosion and oxidation resistance are the hallmarksof Au, with these properties being exploited in many technologicaland everyday applications, such as dentistry, jewelry and electronics.However, gold’s noble characteristics spectacularly vanish as thedimensions of the material are reduced to the nanometer scale.Experiments have shown that isolated Au atoms are readily oxidizedin air.1 Radiolysis experiments have demonstrated that Au atomshave a redox potential similar to sodium borohydride, one of themost potent reductants in chemistry. Impressive demonstrations ofthis phenomenon were provided by Haruta and co-workers,2 whofound Au nanoparticles (supported on transition metal oxides) tohave a high catalytic activity in CO and H2 oxidation, even at lowtemperatures. This pioneering work has prompted Au catalysis tobecome a very active research field in recent years.3–5
Presently, the catalytic applications of Au concern not onlylow-temperature CO oxidation,6 but also epoxidation of olefins,7,8
water–gas-shift reactions,9 C–C coupling reactions,10 and liquid-phase oxidation of alcohols,11 among others. Nano-structured Au,
supported on transition metal oxides, is a highly efficientoxidation catalyst; however, the mechanism of these reactionsis still the focus of intense debate in the literature. For instance,edge sites and changes in the electronic structure of Au, due toits interaction with the support, have been suggested to beimportant factors in establishing activity.12 Several studies haveclearly shown that CO can be readily oxidized to CO2, at anykind of Au surface, if a source of atomic oxygen is present.12
Ozone (O3), N2O, and O2 plasma have been used as sources ofatomic oxygen to show that even extended surfaces of Au single-crystals can be catalytically active towards CO oxidation.13
Based on DFT calculations,14 N. Lopez and J. Nørskov proposedthat low-coordinated atoms on Au clusters play a central role inmolecular oxygen activation. Contrary to the case of extendedAu surfaces, adsorbed O on Au clusters is stable relative to O2 inthe gas phase. In turn, recent theoretical and experimentalinvestigations show that Au perimeter atoms can be active sitesin CO oxidation reaction.15–18 The interpretation of the resultscombines the role of low coordinated Au atoms and theirinteraction with the support.19
In this study we investigate the interaction of extended Ausurfaces with O3, using a combination of in situ XPS and ex situSEM. NAP-XPS measurements allow us to characterize the electronicstructure of surface oxide, while SEM provides information aboutmorphological changes after oxidation. The combination of thesetechniques may shed light on understanding the nature of the Au–Ophase and clarify issues discussed in some recent surface sciencereports.
a Fritz-Haber-Institut der Max-Planck-Gesellschaft, Faradayweg 4-6, 14195, Berlin,
Germany. E-mail: [email protected] Division Solar Energy Research, Helmholtz-Zentrum Berlin fur Materialien und
Energie GmbH, Albert-Einstein-Str. 15, 12489 Berlin, Germany
† Electronic supplementary information (ESI) available. See DOI: 10.1039/c4cp00308j
Received 20th January 2014,Accepted 27th February 2014
DOI: 10.1039/c4cp00308j
www.rsc.org/pccp
PCCP
PAPER
Ope
n A
cces
s A
rtic
le. P
ublis
hed
on 2
7 Fe
brua
ry 2
014.
Dow
nloa
ded
on 1
2/2/
2021
7:3
2:22
AM
. T
his
artic
le is
lice
nsed
und
er a
Cre
ativ
e C
omm
ons
Attr
ibut
ion
3.0
Unp
orte
d L
icen
ce.
View Article OnlineView Journal | View Issue
7882 | Phys. Chem. Chem. Phys., 2014, 16, 7881--7886 This journal is© the Owner Societies 2014
Experimental
The experiments were performed at ISISS beamline at BESSY II/HZB(Berlin, Germany). All measurements were carried out in a stainlesssteel NAP-XPS chamber described in detail elsewhere.20,21 Thesample was a polycrystalline gold foil (499.95% purity) mountedon a sapphire sample holder between a stainless steel back-plate anda lid with 8 mm hole, shown in the Fig. S1 in the ESI.† The samplewas heated from behind by an infrared laser and the temperaturewas measured by a type-K thermocouple positioned at the sample’ssurface. The overall spectral resolution was 0.3 eV in O 1s and 0.2 eVAu 4f regions. The spectral intensity was normalized by the incidentphoton flux, which was measured using Au reference foil. Thebinding energies (BE) were calibrated using both the Fermi edgeand the Au 4f7/2 second-order peak. The accuracy of BE calibrationwas estimated to be around 0.05 eV.
The gold foil was cleaned by standard surface scienceprocedures, with Ar+ sputtering (2 � 10�4 mbar, 1.5 kV) for30 min at room temperature and subsequent annealing to400 1C under vacuum. Cycles of cleaning were repeated untilcarbon was no longer detected by C 1s XPS.
O3 was produced using a commercial ozone generatorTC-1KC. Oxygen was passed at a rate of 1 L min�1 through Teflontubing to the ozone generator. The effluent gas from the generatorcontained a mixture of approximately 1% ozone and 99% un-reactedoxygen. The O3–O2 mix was dosed through Teflon tubing into theexperimental cell using a leak valve with the sample kept at100 1C. The total pressure in the experimental cell was 0.3 mbar.
We recorded Au 4f7/2 and O 1s spectra at four different kineticenergies: 175 eV, 350 eV, 600 eV and 1000 eV, using a specialcombination of exit slit width of the monochromator and pass
energy of the electron analyzer, which keeps the total resolutionalmost the same over the relevant interval of kinetic energies. Thesekinetic energies correspond to inelastic mean free paths (IMFP) of0.49 nm, 0.67 nm, 0.91 nm and 1.29 nm (assuming predominantlygold in the near-surface region).22 All X-ray photoemission spectrawere collected in normal photoemission mode. For quantitative XPSanalysis least-squares fitting of the Au 4f7/2 spectra was performedusing the commercially available CasaXPS software (www.casa xps.com). A Doniach–Sunjic line shape was used to obtain the best fit. Allfitting parameters are given in Table S1 in the ESI.†
ResultsThe clean Au surface
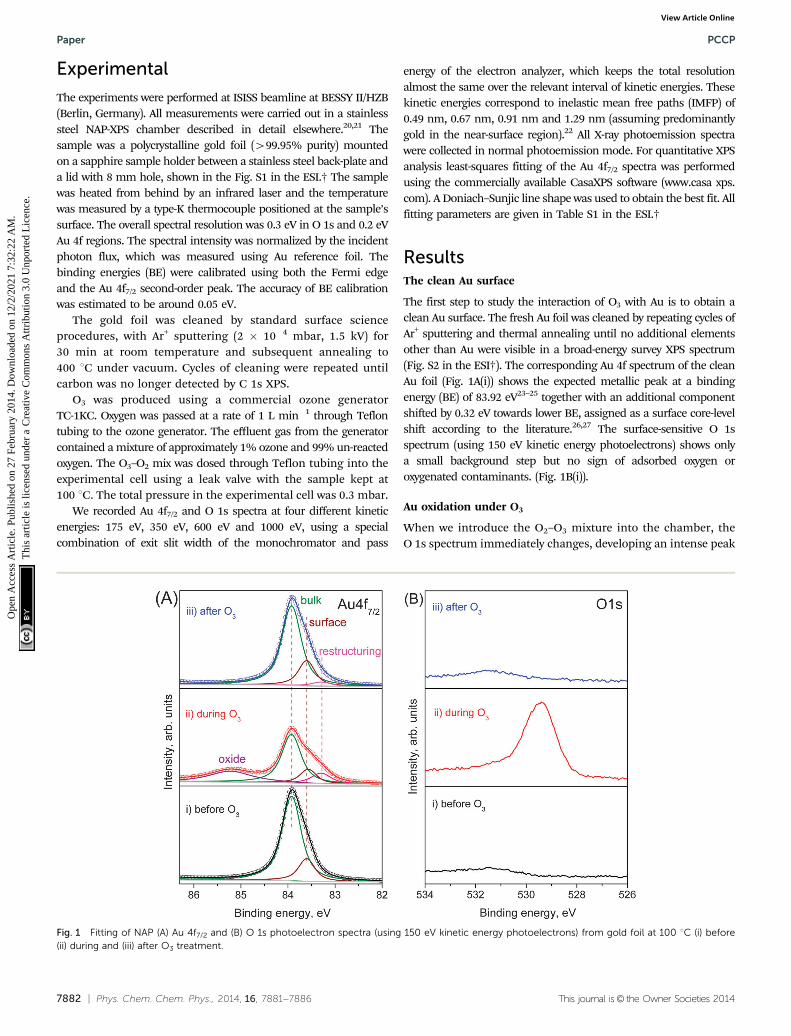
The first step to study the interaction of O3 with Au is to obtain aclean Au surface. The fresh Au foil was cleaned by repeating cycles ofAr+ sputtering and thermal annealing until no additional elementsother than Au were visible in a broad-energy survey XPS spectrum(Fig. S2 in the ESI†). The corresponding Au 4f spectrum of the cleanAu foil (Fig. 1A(i)) shows the expected metallic peak at a bindingenergy (BE) of 83.92 eV23–25 together with an additional componentshifted by 0.32 eV towards lower BE, assigned as a surface core-levelshift according to the literature.26,27 The surface-sensitive O 1sspectrum (using 150 eV kinetic energy photoelectrons) shows onlya small background step but no sign of adsorbed oxygen oroxygenated contaminants. (Fig. 1B(i)).
Au oxidation under O3
When we introduce the O2–O3 mixture into the chamber, theO 1s spectrum immediately changes, developing an intense peak
Fig. 1 Fitting of NAP (A) Au 4f7/2 and (B) O 1s photoelectron spectra (using 150 eV kinetic energy photoelectrons) from gold foil at 100 1C (i) before(ii) during and (iii) after O3 treatment.
Paper PCCP
Ope
n A
cces
s A
rtic
le. P
ublis
hed
on 2
7 Fe
brua
ry 2
014.
Dow
nloa
ded
on 1
2/2/
2021
7:3
2:22
AM
. T
his
artic
le is
lice
nsed
und
er a
Cre
ativ
e C
omm
ons
Attr
ibut
ion
3.0
Unp
orte
d L
icen
ce.
View Article Online

This journal is© the Owner Societies 2014 Phys. Chem. Chem. Phys., 2014, 16, 7881--7886 | 7883
at 529.4 eV (Fig. 1B(ii)). The atomic element ratio is O : Au =0.84 � 0.05 within a depth of 0.49 nm. Since no contaminants,within the detection limits of XPS, appear on the Au surfaceduring oxidation, this peak can be assigned as oxygen bonded togold. The corresponding Au 4f spectrum during O3 exposure(Fig. 1A(ii)) shows new features in comparison with the clean Ausurface. A well-defined peak appears at 85.22 eV, which isassigned to ionic Au species (Aud+),25,28 together with an additionalfeature at low BE (83.29 eV). This additional component isassigned to the presence of low-coordinated atoms that appearon the Au surface as a result of surface restructuring duringoxidation.29 This assignment is further discussed below.
Stability of the oxide phase
Both the Aud+ component and the O 1s peak disappear whenthe O2–O3 mixture is removed and the chamber reaches highvacuum (HV) conditions, as shown in the top spectra of Fig. 1Aand B. Even the higher chemical potential of 0.3 mbar of O2 at100 1C instead of HV does not prevent the decomposition of thesurface oxide. The same behavior is also observed if O3 isreplaced by O2. Under O3, the Au oxide is stable from roomtemperature up to 250 1C. At higher temperatures the Aud+
component vanishes even in the presence of O3 as shown inFig. 2. However, as the sample is cooled from 400 1C to roomtemperature, the oxide forms on the surface again at temperaturesbelow 300 1C (see Fig. S3 in the ESI†).
Interestingly, although the oxide phase totally vanishes afterO3 is removed, the Au 4f spectral shape is not exactly the sameas before O3 treatment. The Au 4f7/2 peak is slightly broader(FWHM changes from 0.59 eV before O3 to 0.64 eV after) with a
more pronounced tail to low BE (Fig. S4 in the ESI†). Thedifference spectrum before and after ozone oxidation (Fig. S4in the ESI†) clearly shows the existence of an additionalcomponent at 83.29 eV assigned to restructuring. At 100 1C,the initial spectrum is recovered only after 8 h, but at 350 1C theadditional low BE features disappear after 10 min (not shown).The persistence of the additional low-BE component even afterthe decomposition of the oxide phase and its removal bythermal annealing reinforces the assignment as an additionalsurface core-level shift related to restructuring.
Surface restructuring
The structural modifications of the Au foil after O3 exposure, assuggested by the XPS results, were further confirmed by ex situSEM characterization. Fig. 3 shows an image of a particularregion of the Au surface that was partially covered by thesample holder lid. The nearly vertical line marks the positionwhere the edge of the steel lid was pressed against the Au foil.The region of the sample that was exposed to O3 (region A inFig. 3) shows pronounced contrast variations that are consistentwith the presence of ridges on the Au surface. Conversely, theregion that was shadowed by the lid shows a rather uniformcontrast suggesting a less-structured surface on this length scale(region B in Fig. 3).
Extent of oxidation
We exploited the energy tunability of synchrotron radiation tomeasure the depth profile of the sample. By generating photo-electrons with different kinetic energies of the photoelectrons,the sample could be probed at various depths. Fig. 4 shows Au4f and O 1s spectra measured using kinetic energies of 175,350, 600 and 1000 eV. The O 1s spectra intensity is normalizedto the area of the corresponding metallic component Au0 inorder to emphasize the variations in the total amount ofoxygen. It can be clearly seen that the Aud+ feature and theO 1s peak are consistently less-pronounced for higher-KEphotoelectrons, which originates from deeper layers of the Au foil.Moreover, the main peak at 83.95 eV in the Au4f is more symmetricat higher kinetic energies, which confirms the assignment of thelow-BE components to surface related features. These measure-ments suggest that only the near-surface region of the Au foil is
Fig. 2 Au 4f7/2 photoelectron spectra (hn = 270 eV) from gold foil duringheating at various temperatures.
Fig. 3 Ex situ SEM image after O3 (0.3 mbar) treatment at 100 1C showingridges in the gold foil only in areas that were exposed to O3 (region B). Onthe left side, where the surface was covered by the sample holder lid, noridges are observed (region A).
PCCP Paper
Ope
n A
cces
s A
rtic
le. P
ublis
hed
on 2
7 Fe
brua
ry 2
014.
Dow
nloa
ded
on 1
2/2/
2021
7:3
2:22
AM
. T
his
artic
le is
lice
nsed
und
er a
Cre
ativ
e C
omm
ons
Attr
ibut
ion
3.0
Unp
orte
d L
icen
ce.
View Article Online

7884 | Phys. Chem. Chem. Phys., 2014, 16, 7881--7886 This journal is© the Owner Societies 2014
oxidized by O3 at mbar pressures; however, quantification of thedepth-dependent measurements is required for a better assessmentof the thickness of the oxide phase.
Thickness of the oxide phase
The mean escape depth for each measurement at differentkinetic energies can be approximated using known values ofthe inelastic mean free path‡ (IMFP) for Au.22 Depth profilesare constructed from the integrated XPS areas. Fig. 5 shows theintegrated peak areas of the O 1s and Aud+ divided by the Au0
area as a function of the average escape depth. The normal-ization by Au0 is necessary to remove the influence of elasticscattering in the gas phase that is also energy dependent. Thethickness of the oxide phase can be estimated by quantification ofthe depth profile using a simplified structural model consistingof a uniform oxide layer of thickness t over a semi-infinitesubstrate.30,31 Using known atomic densities and assuming thesame IMFP for the metal and oxide, the unknown thickness tcan be obtained by fitting the experimental data. Details aboutthe procedure are given in the ESI.† By assuming that the oxideover-layer completely covers the Au surface, a good fit wasobtained (solid line in Fig. 5) and gave a value of t = 0.29 �0.02 nm. However, similar models with incomplete coverage ofthe surface by the oxide phase (patches) also result in reason-able fittings within the experimental errors, resulting in largervalues for the thickness. In the extreme case of 60% coverage(dash-dot line in the Fig. 5), the derived over-layer thicknessincreases to 0.58 nm (lower coverages do not result in reason-able fittings). Comparing these values to the shortest Au–Odistance of 0.201 nm in the Au2O3 structure (most stable bulkAu–oxide) or the smaller axis of its unit cell of 0.404 nm,32 it is
reasonable to conclude the formation of a surface oxide phaseduring the oxidation of a Au surface with O3 at mbar pressures.
Oxygen overlayer
The area ratio in both depth profile curves in Fig. 5 decaysexponentially with escape depth; however, the oxygen curve(blue squares) decays much faster than the Aud+ when probingdeeper into the sample. This observation suggests the presenceof an additional adsorbed oxygen over-layer that totally orpartially covers the surface oxide layer/patches.
Discussion
The limiting step in the oxidation of Au seems to be theproduction of atomic oxygen.12 Since the dissociation probabilityof O2 is very small on Au surfaces,33 atomic oxygen must be suppliedby other methods. Recent studies have clearly shown that Au can bereadily oxidized when exposed to strong oxidative environments,such as O2-plasma and UV/ozone.24,34 The formation of Au oxidehas been reported, not only for nanoparticles,1,6 but also forextended Au surfaces, such as single-crystals35 and polycrystallinethin films.25,28,36 In our case, the ozone treatment at 100 1C resultedin the formation of a surface oxide phase with a thickness of a fewatomic layers, instead of the 3–4 nm thick plasma-oxidized thinfilms reported by others.25,28,37
This Au surface oxide is unstable under UHV conditions andin an O2 atmosphere at 100 1C, leaving a clean Au surface whenO3 is removed (Fig. 1A and B(iii)), in agreement with a previousstudy.25 However, under constant O3 exposure, the surfaceoxide is stable up to 250 1C. In contrast, based on resistivitymeasurements, Tsai et al.28 reported a decomposition half-lifetime of approximately 10 min for 4 nm Au–oxide films (Au2O3)at 100 1C in air. The stability of the surface oxide under anO3-containing atmosphere suggests that the surface oxide is indynamic equilibrium with the gas environment. The constantsupply of atomic oxygen, provided in this case by O3 dissociation,counteracts the spontaneous decomposition and the surface
Fig. 4 NAP-XPS depth profile (A) Au 4f7/2 and (B) O 1s as obtained from agold foil during O3 (0.3 mbar) treatment at 100 1C for increasing kineticenergies of photoelectrons, i.e. decreasing surface sensitivity. Spectrawere measured at 175 eV (cyan line), 350 eV (magenta line), 600 eV (darkyellow line) and 1000 eV (purple line) kinetic energy of photoelectrons.
Fig. 5 The area ratios between Aud+ 4f7/2 and Au0 4f7/2 (red dots), O 1sand Au0 4f7/2 (blue squares) XPS peak as a function of inelastic mean freepath (IMPF). Fitting results, assuming an oxide over-layer completely (solidline) and 60% (dash-dot line) covering the Au surface.
‡ The IMFP is defined as the distance a photoelectron beam can travel inside thesolid before its intensity decays to 1/e of its initial value.
Paper PCCP
Ope
n A
cces
s A
rtic
le. P
ublis
hed
on 2
7 Fe
brua
ry 2
014.
Dow
nloa
ded
on 1
2/2/
2021
7:3
2:22
AM
. T
his
artic
le is
lice
nsed
und
er a
Cre
ativ
e C
omm
ons
Attr
ibut
ion
3.0
Unp
orte
d L
icen
ce.
View Article Online

This journal is© the Owner Societies 2014 Phys. Chem. Chem. Phys., 2014, 16, 7881--7886 | 7885
oxide that prevails at higher temperatures. The surface-limitedoxidation, observed under our conditions, might be related tothis competition between oxidation and reduction/decomposition,and would kinetically limit the oxide growth. This model systemunder dynamic equilibrium is more representative of a practicalcatalytic system than static phases under UHV. In the real catalyst,atomic O might be supplied by the oxide support or by directdissociation of O2 at the kinks or steps of nanoparticles. It is worthmentioning that we did not observe any X-ray-induced oxidation ofAu, as has been previously reported by P. Jiang et al.,38 most likelydue to the lower photon flux density in our case that limits beam-induced chemistry. The broad O 1s and Aud+ peaks suggest that thesurface oxide is most likely not a single, long-range, ordered phase,but might consist of multiple phases. For example, in the Ag–Osystem, multi-phase co-existence has been predicted theoretically39
and experimentally verified.40,41 Similar conclusions – i.e. thatseveral Au–O species can be generated by kinetic control of theoxidation conditions – were drawn by Ming and Friend afterreviewing several studies about the oxidation of Au.12
One of the most controversial aspects of the mechanism ofCO oxidation on nano-structured Au catalysts is the sourceof atomic oxygen. While some authors suggest that a spilloverof lattice oxygen from reducible oxide supports is the source ofatomic oxygen, others point to the direct dissociation of O2 atlow-coordination sites on the surface of Au nano-particles.6,12,41
The additional surface core-level shift component, related tothe restructuring that is observed during ozone treatment inour XPS spectra, (Fig. 1A(ii)) indicate the formation of low-coordinated atoms on the Au surface during oxidation. Similarspectral features were previously observed for stepped single-crystalsurfaces29 with a clear correlation between the coordinationnumber of atoms at steps and terraces with the measuredsurface core-level shift for Au(321) and Au(310) crystals. Thesurface roughening observed by SEM after the O3 treatment(Fig. 2) indicates extensive surface restructuring during oxida-tion, and might have generated the low-coordinated atoms thatwe had inferred from the XPS analysis. Surface restructuringinduced the formation of Au ad-atoms and clusters on a Au(111)surface were directly observed by STM after atomic oxygenexposure, generated by electron-induced NO2 dissociation.42
Our combined spectroscopy and microscopy results can beinterpreted by the restructuring of the Au surface as reported byothers, suggesting the presence of low-coordinated atoms onthe surface of the Au foil after ozone treatment. However, itshould be stressed that the presence of such proposed activesites for molecular oxygen dissociation does not prevent thedisappearance of the Au–oxide when O3 is removed at 100 1C.Although the low-coordinated atoms may have an enhancedinteraction strength with surrounding molecules, and stillmight play a role in O2 adsorption at room temperature, ourresults do not show that they enhance O2 dissociation. Thisobservation suggests that low-coordinated Au sites alone mightnot dissociate molecular oxygen as efficiently as at roomtemperature11,42 or the number of active sites was not sufficientto compensate for the thermal decomposition of the oxide,unlike the case of O3 dissociation.
Conclusions
From the results presented we suggest the following picture ofthe system gold–ozone under a constant chemical potential ofO3. The surface consists of an overlayer of atomic oxygen beingchemisorbed on a surface oxide by a thickness of 0.29 nm. Thislayer may be presented as a tri-layer oxygen–gold–oxygen with aregion of oxygen atoms diffusing in deeper layers with decreasingprobability. The formation of the surface oxide mobilized goldatoms leads to a significant restructuring of the surface and thefrequent formation of coordinatively undersaturated species,which leads to shape changes in the Au 4f spectra. These speciesmay be responsible for holding the atomic oxygen at the surface.Whereas the restructuring remains upon lowering the chemicalpotential of oxygen to vacuum levels, the absorbed oxygen speciesand also the surface oxide vanish even at 100 1C indicating thatthe heat of adsorption and heat of formation, respectively, aresmall even in the presence of the massive restructuring. Thissheds light on the energetic consequences of the formation ofcoordinatively undersaturated gold species.
We prefer such a picture of a laterally homogeneous multi-layerarchitecture over the alternative of laterally inhomogeneous patchesof different surface oxide species as the SEM image does not revealindications for extensive lateral inhomogeneity.
Acknowledgements
We thank HZB for the allocation of synchrotron radiationbeamtime and Gisela Weinberg (Fritz Haber Institute, Berlin)for the SEM characterization.
References
1 J. T. Miller, A. J. Kropf, Y. Zha, J. R. Regalbuto, L. Delannoy,C. Louis, E. Bus and J. A. van Bokhoven, J. Catal., 2006,240(2), 222–234.
2 M. Haruta, N. Yamada, T. Kobayashi and S. Iijima, J. Catal.,1989, 115(2), 301–309.
3 T. Hayashi, T. Inagaki, N. Itayama and H. Baba, Catal.Today, 2006, 117(1–3), 210–213.
4 B. N. Zope, D. D. Hibbitts, M. Neurock and R. J. Davis,Science, 2010, 330, 74–78.
5 E. E. Stangland, K. B. Stavens, R. P. Andres andW. N. Delgass, J. Catal., 2000, 191(2), 332–347.
6 M. C. Kung, R. J. Davis and H. H. Kung, J. Phys. Chem. C,2007, 111, 11767–11775.
7 T. Hayashi, K. Tanaka and M. Haruta, J. Catal., 1998, 178(2),566–575.
8 A. K. Sinha, S. Seelan, S. Tsubota and M. Haruta, Top. Catal.,2004, 29(3–4), 95–102.
9 I. Andreeva, T. Tabakova and A. Andreev, J. Catal., 1996,158(1), 354–355.
10 C. Gonzalez-Arellano, A. Corma, M. Iglesias and F. Sanchez,Chem. Commun., 2005, 3451–3453.
11 N. Dimitratos, J. A. Lopez-Sanchez and G. J. Hutchings,Chem. Sci., 2012, 3, 20–44.
PCCP Paper
Ope
n A
cces
s A
rtic
le. P
ublis
hed
on 2
7 Fe
brua
ry 2
014.
Dow
nloa
ded
on 1
2/2/
2021
7:3
2:22
AM
. T
his
artic
le is
lice
nsed
und
er a
Cre
ativ
e C
omm
ons
Attr
ibut
ion
3.0
Unp
orte
d L
icen
ce.
View Article Online

7886 | Phys. Chem. Chem. Phys., 2014, 16, 7881--7886 This journal is© the Owner Societies 2014
12 B. K. Min and C. M. Friend, Chem. Rev., 2007, 107(6), 2709–2724.13 B. K. Min, A. R. Alemozafar, D. Pinnaduwage, X. Deng and
C. M. Friend, J. Phys. Chem. B, 2006, 110(40), 19833–19838.14 N. Lopez and J. Nørskov, J. Am. Chem. Soc., 2002, 124(38),
11262–11263.15 Y. Iizuka, T. Tode, T. Takao, K. Yatsu, T. Takeuchi,
S. Tsubota and M. Haruta, J. Catal., 1999, 187(1), 50–58.16 L. M. Molina and B. Hammer, Phys. Rev. B: Condens. Matter
Mater. Phys., 2004, 69(15), 155424.17 M. M. Schubert, S. Hackenberg, A. C. van Veen, M. Muhler,
V. Plzak and R. J. Behm, J. Catal., 2001, 197(1), 113–122.18 M. Okumura, S. Nakamura, S. Tsubota, T. Nakamura,
M. Azuma and M. Haruta, Catal. Lett., 1998, 51(1), 53–58.19 S. Chretien, S. K. Buratto and H. Metiu, Curr. Opin. Solid
State Mater. Sci., 2007, 11(3), 62–75.20 A. Knop-Gericke, E. Kleimenov, M. Havecker, R. Blume,
D. Teschner, S. Zafeiratos, R. Schlogl, V. I. Bukhtiyarov, V. V.Kaichev, I. P. Prosvirin, A. I. Nizovskii, H. Bluhm, A. Barinov,P. Dudin and M. Kiskinova, Adv. Catal., 2009, 52, 213–272.
21 H. Bluhm, M. Havecker, A. Knop-Gericke, E. Kleimenov,R. Schlogl, D. Teschner, V. I. Bukhtiyarov, D. F. Ogletree andM. Salmeron, J. Phys. Chem. B, 2004, 108, 14340–14347.
22 S. Tanuma, C. J. Powell and D. R. Penn, Surf. Interface Anal.,1991, 17, 911–926.
23 N. D. S. Canning, D. Outka and R. J. Madix, Surf. Sci., 1984,141, 240–254.
24 D. E. King, J. Vac. Sci. Technol., A, 1995, 13(3), 1247–1253.25 B. Koslowski, H.-G. Boyen, C. Wilderotter, G. Kastle,
P. Ziemann, R. Wahrenberg and P. Oelhafen, Surf. Sci.,2001, 475(1–3), 1–10.
26 P. H. Citrin, G. K. Wertheim and Y. Baer, Phys. Rev. Lett.,1978, 41, 1425–1428.
27 P. Heimann, J. F. van der Veen and D. E. Eastman, SolidState Commun., 1981, 38, 595–598.
28 H. Tsai, E. Hu, K. Perng, M. Chen, J.-C. Wu and Y.-S. Chang,Surf. Sci., 2003, 537(1–3), L447–L450.
29 C. J. Weststrate, E. Lundgren, J. N. Andersen, E. D. L.Rienks, A. C. Gluhoi, J. W. Bakker, I. M. N. Groot andB. E. Nieuwenhuys, Surf. Sci., 2009, 603(13), 2152–2157.
30 A. Cimino, D. Gazzoli and M. Valigi, J. Electron Spectrosc.Relat. Phenom., 1999, 104(1–3), 1–29.
31 C. S. Fadley, in Electron Spectroscopy: Theory, Techniques andApplications, ed. C. R. Brundle and A. D. Baker, AcademicPress, New York, 1978, ch. 1, vol. 2, pp. 2–157.
32 H. Shi, R. Asahi and C. Stampfl, Phys. Rev. B: Condens.Matter Mater. Phys., 2007, 75(20), 205125.
33 X. Deng, B. K. Min, A. Guloy and C. M. Friend, J. Am. Chem.Soc., 2005, 127(25), 9267–9270.
34 A. Krozer and M. Rodalh, J. Vac. Sci. Technol., A, 1997, 15(3),1704–1709.
35 B. K. Min, A. R. Alemozafar, M. M. Biener, J. Biener andC. M. Friend, Top. Catal., 2005, 36(1–4), 77–90.
36 K. Juodkazis, J. Juodkazyte, V. Jasulaitiene, A. Lukinskas andB. Sebeka, Electrochem. Commun., 2000, 2(7), 503–507.
37 H. Ron and I. Rubinstein, Langmuir, 1994, 10(12),4566–4573.
38 P. Jiang, S. Porsgaard, F. Borondics, M. Kober, A. Caballero,H. Bluhm, F. Besenbacher and M. Salmeron, J. Am. Chem.Soc., 2010, 132(9), 2858–2859.
39 W. X. Li, C. Stampfl and M. Scheffler, Phys. Rev. B: Condens.Matter Mater. Phys., 2003, 67(4), 045408.
40 J. Schnadt, J. Knudsen, X. L. Hu, A. Michaelides, R. T. Vang,K. Reuter, Z. Li, E. Lægsgaard, M. Scheffler andF. Besenbacher, Phys. Rev. B: Condens. Matter Mater. Phys.,2009, 80(7), 075424.
41 T. C. R. Rocha, A. Oestereich, D. V. Demidov, M. Havecker,S. Zafeiratos, G. Weinberg, V. I. Bukhtiyarov, A. Knop-Gericke and R. Schlogl, Phys. Chem. Chem. Phys., 2012,14(13), 4554–4564.
42 B. K. Min, X. Deng, D. Pinnaduwage, R. Schalek andC. M. Friend, Phys. Rev. B: Condens. Matter Mater. Phys.,2005, 72(12), 121410.
Paper PCCP
Ope
n A
cces
s A
rtic
le. P
ublis
hed
on 2
7 Fe
brua
ry 2
014.
Dow
nloa
ded
on 1
2/2/
2021
7:3
2:22
AM
. T
his
artic
le is
lice
nsed
und
er a
Cre
ativ
e C
omm
ons
Attr
ibut
ion
3.0
Unp
orte
d L
icen
ce.
View Article Online