Embed Size (px)
Citation preview

9620 Phys. Chem. Chem. Phys., 2013, 15, 9620--9625 This journal is c the Owner Societies 2013
Cite this: Phys. Chem.Chem.Phys.,2013,15, 9620
Sorption enhanced CO2 methanation
Andreas Borgschulte,*a Noris Gallandat,a Benjamin Probst,a Riccardo Suter,a
Elsa Callini,a Davide Ferri,b Yadira Arroyo,c Rolf Erni,c Hans Geerlingsd andAndreas Zuttela
The transformation from the fatuous consumption of fossil energy towards a sustainable energy circle
is most easily marketable by not changing the underlying energy carrier but generating it from
renewable energy. Hydrocarbons can be principally produced from renewable hydrogen and carbon
dioxide collected by biomass. However, research is needed to increase the energetic and economic
efficiency of the process. We demonstrate the enhancement of CO2 methanation by sorption enhanced
catalysis. The preparation and catalytic activity of sorption catalysts based on Ni particles in zeolites is
reported. The functioning of the sorption catalysis is discussed together with the determination of the
reaction mechanism, providing implications for new ways in catalysis.
Introduction
The negative consequences of our actual energy economy(scarcity of fuels, climate change etc.) originate from an opencycle of materials carrying the energy, e.g. mining of crude oiland release of CO2 into the atmosphere. It is, however, possibleto close the cycle of materials for energy harvesting, transport,storage and utilization by the production of renewable chemicalenergy carriers.1 The natural cycles in the atmosphere are ableto transport only a few compounds, namely oxygen, nitrogen,water and carbon dioxide. Therefore, the combustion productof any kind of renewable fuel may only be water, carbon dioxideor nitrogen. Mimicking the natural carbon cycle has thepotential of closing the energy circle by producing synthetichydrocarbons. Their combustion products are water and CO2,which hitherto are starting compounds for the renewablesynthesis of the desired high energy density fuels. The requiredenergy might be directly introduced during synthesis, or originatefrom hydrogen, which can be produced from renewable energyvia water electrolysis or directly from photoelectrolysis.2 Possiblesynthetic fuels are methane, methanol, dimethyl ether, andliquid hydrocarbons (CnH2n+2 with n 4 6).3 The main advantageof methanol from CO2 and H2 is the rather simple and nearly
energy-neutral synthesis process. However, its gravimetricenergy density is half of that of methane and octane. Fortransportation, octane is the ultimate fuel – being liquid andcomprising an energy density as high as 44 MJ kg�1 (13 kWh kg�1).Its disadvantage is the intricate synthesis process – usually viareversed water gas shift reaction combined with Fischer–Tropschsynthesis.4 Thus, from a practical point of view, methane is theeasiest to synthesize chemical energy carrier with the potential ofusing the fully developed natural gas infrastructure but replacingthe natural gas by environmentally friendly, renewable methane.
Recently, this concept has been realized by replacing fossilnatural gas with biogas,5 i.e. methane produced from biologicalfeedstock, using natural photosynthesis. Before feeding thenatural gas grid, the raw biogas has to be purified.6 The CO2
separation process is particularly energy consuming (up to 10%of the heating value of the biogas).7 A further obstacle forbiogas as a renewable energy carrier is the limited biologicfeedstock.8 An improvement of the process has been proposed:the biogas upgrade9 converts the CO2 in the raw biogas tomethane using hydrogen from renewable energy sources. Thefundamental of the biogas upgrade process is the Sabatierreaction:
4H2 + CO2 - H2O + CO + 3H2 - 2 H2O + CH4.
DH = �165 kJ mol�1 (1)
The heat release of approximately 17% of the heating valuehas to be considered the main efficiency loss of the Sabatierprocess. The strongly exothermic heat of formation allowstheoretically a thermodynamically high reaction yield, in parti-cular at low temperatures. However, this is not found practically,
a Laboratory for Hydrogen & Energy, Uberlandstrasse 129, CH-8600 Dubendorf,
Switzerland. E-mail: [email protected] Laboratory for Solid State Chemistry and Catalysis, Uberlandstrasse 129,
CH-8600 Dubendorf, Switzerlandc Electron Microscopy Center, Empa, Swiss Federal Laboratories for Materials
Science and Technology, Uberlandstrasse 129, CH-8600 Dubendorf, Switzerlandd Chemical Engineering, Delft University of Technology, Julianalaan 136,
2628 BL Delft, The Netherlands
Received 5th April 2013,Accepted 10th April 2013
DOI: 10.1039/c3cp51408k
www.rsc.org/pccp
PCCP
PAPER
Ope
n A
cces
s A
rtic
le. P
ublis
hed
on 1
5 A
pril
2013
. Dow
nloa
ded
on 1
2/24
/202
1 7:
29:5
1 A
M.
Thi
s ar
ticle
is li
cens
ed u
nder
a C
reat
ive
Com
mon
s A
ttrib
utio
n 3.
0 U
npor
ted
Lic
ence
.
View Article OnlineView Journal | View Issue

This journal is c the Owner Societies 2013 Phys. Chem. Chem. Phys., 2013, 15, 9620--9625 9621
because the Sabatier reaction is a complex surface reaction, andis kinetically limited. This kinetic barrier can be overcome usingcatalysts. Commercial catalysts reach a conversion of more than90%, however only above 250 1C.10 Besides a high activity, thecatalyst should exhibit high selectivity for methane. However,toxic carbon monoxide is also formed at high temperatures.A further improvement of the catalytic activity is thus difficultand requires new concepts.
In this paper we demonstrate the utilization of the LeChatelier principle to improve the reaction kinetics and yieldby local absorption of water at the reaction centres.11,12 Theso-called sorption enhanced catalysis implies that the reactionconditions can be controlled to modify directly the concen-tration of reactants and products at the reaction centres andthereby increase the reaction yield. The idea is depicted inFig. 1: the kinetics of a normal catalyst depend on the adsorp-tion and desorption of reactants and products, respectively.This is mainly determined by gas–solid thermodynamics, i.e.the binding strengths of the species to the surface.13 Using acatalyst that has a sorption function, we are able to tailorcoverage of the reactions sites by removing water through asorbent. The sorbent has a high affinity to water (see energydiagram in Fig. 1), and thereby actively removes the productfrom the reaction centres. The idea is experimentally realizedby Ni particles on zeolites. We demonstrate the proof-of-principleof the water sorption enhanced CO2 methanation reaction, andshed light on the reaction mechanism by kinetic modelling andin situ spectroscopy.
Materials and methods
Nickel nitrate (Ni(NO3)2�6H2O) (Sigma Aldrich) and molecularsieves (zeolite 5A) with pore sizes of 5 Å (pellets, 1.6 mm, Sigma-Aldrich) with linear formulae CanNa12�2n[(AlO2)12(SiO2)12]�xH2O, were used in the preparation of nickel sorption catalysts.The alkaline/earth alkaline zeolite was exchanged using nickelnitrate aqueous solution with different concentrations at roomtemperature for 24 h. Then, the zeolite was washed withdeionized water and dried under an air stream at 100 1C fortwo days. Subsequently, the sample was reduced in a hydrogen
flow at 650 1C for two hours. For comparison, a commercialNi catalyst (Ni on silica/alumina, Sigma Aldrich) has beeninvestigated.
The measurement of the catalytic activity was performed usinga stainless steel tubular flow reactor with a length of 450 mm anda diameter of 18 mm. The typical catalyst mass was 13 g (total)with a volume of 25 ml. The gas flows were controlled bythermal mass flow meters from MKS Instruments connected toa Labview interface. Typical flow rates were 50 ml min�1 CO2, and400 ml min�1 H2 corresponding to a space velocity of 1000 h�1.The pressure was 1.2 bar. The exhaust gases were analysed by aFourier transform infrared (FT-IR) spectrometer (Bruker Alphaequipped with an 8 cm gas cell). The exhaust gas was diluted withN2 to avoid saturation of the infrared spectrum and the condensa-tion of water. Two measurement procedures were applied: for ageneral characterization of catalyst the temperature dependenceof the conversion at constant reactants’ flows was monitored. Fortransient measurements at isothermal conditions, the catalyst wasdried in hydrogen at high temperature. After equilibration to thedesired measurement temperature, the CO2 flow was switched on.
The catalysts were characterized for their specific surfacearea (BET method) and Ni content, metal area and crystallite size.The BET surface area of the sample was extracted from nitrogenadsorption isotherms at 77 K measured with a BELSORPmax(BEL, Japan).
For microstructural characterization at the mm-scale,secondary electron SEM imaging was carried out with an FEIESEM XL30 at an acceleration voltage of 20 kV. The SEM isequipped with an energy-dispersive X-ray spectroscopy (EDX) forelemental analysis. The structure at the nano-scale was examinedby scanning transmission electron microscopy (STEM) with aJEOL 2200FS TEM.
Diffusive reflectance IR Fourier transform spectroscopy(DRIFTS) combined with mass spectrometry has been usedto probe the surface species (reactants, intermediates andproducts) during reaction. The DRIFT spectra were collectedusing a Vertex 70 infrared spectrometer (Bruker Optics)equipped with a DRIFT unit (Praying Mantis, Harrick) andliquid nitrogen cooled MCT detector. The commercial Harrickcell (HVC-DRP-3) was attached to a gas manifold system. Gasexiting the cell was analysed online using a mass spectrometer(Pfeiffer, Omnistar).
ResultsCatalyst characterization
There is a maximum load of Ni in zeolites, if prepared by ionexchange from 5 M Ni nitrate hexahydrate, corresponding toapproximately 2.5 at% (6 wt%). Such catalysts show the bestperformance. Mapping the Ni-content over a cut through acatalyst pellet indicates a very homogenous distribution of Niwithin the pellet. The Ni-ions partly exchange Ca/Na ions in thezeolite. With reduction and formation of Ni particles, thecorresponding sites are re-occupied by hydrogen. These acidicsites may have an influence on the catalytic properties of theNi–zeolite catalyst.14 Indeed, repeating the infiltration procedure
Fig. 1 Left: structure model of a sorption catalyst based on Ni particles onzeolites; right: sketch of the free energy of reactants and products of the Sabatierreaction on the conventional metal catalyst (orange) and a sorption catalyst(blue), respectively, depicting the water-absorption-enhanced methanation ofCO2 due to an additional driving force (exothermic water adsorption) both forreaction step 1 and 2.
Paper PCCP
Ope
n A
cces
s A
rtic
le. P
ublis
hed
on 1
5 A
pril
2013
. Dow
nloa
ded
on 1
2/24
/202
1 7:
29:5
1 A
M.
Thi
s ar
ticle
is li
cens
ed u
nder
a C
reat
ive
Com
mon
s A
ttrib
utio
n 3.
0 U
npor
ted
Lic
ence
.View Article Online
9622 Phys. Chem. Chem. Phys., 2013, 15, 9620--9625 This journal is c the Owner Societies 2013
twice leads to catalysts with diminished performance – stressingthe importance of the surface structure of the zeolite. Furtherinvestigations are needed to clarify this effect. In this paper; werestrict the discussion to the system exhibiting the best catalyticperformance. The surface area of the zeolite 5A is 440 m2 g�1 andthe pore volume is 0.22 cm3 g�1. After ion exchange and calcination,the BET-surface and pore volume are only slightly reduced to360 m2 g�1 and 0.21 cm3 g�1, respectively. This indicates thatthe Ni particles do not block the pores, and the overall structureof the zeolite remains unchanged.
The SEM pictures display 5–10 mm large zeolite crystals, butdo not resolve the fine structure of the catalysts (see Fig. 2).TEM shows Ni particles of the size of about 20 nm with a broadsize distribution.
Performance of catalyst
The standard analysis to reveal catalytic performance is themeasurement of the temperature dependence of the methanationrate at a given space velocity. To minimize the influence ofsystematic errors, such measurements were performed on thesorption catalyst and a commercial Ni catalyst. The latter hassimilar physical and chemical properties except that it is able toabsorb water in large quantities. The measurements as shownin Fig. 3 were conducted after long term equilibration, therebyeliminating the sorption function of the zeolite. Indeed the
catalytic properties of the sorption catalyst are only slightly improved,i.e. reaching maximum conversion at slightly lower temperaturesand lower CO release than that of the commercial one.
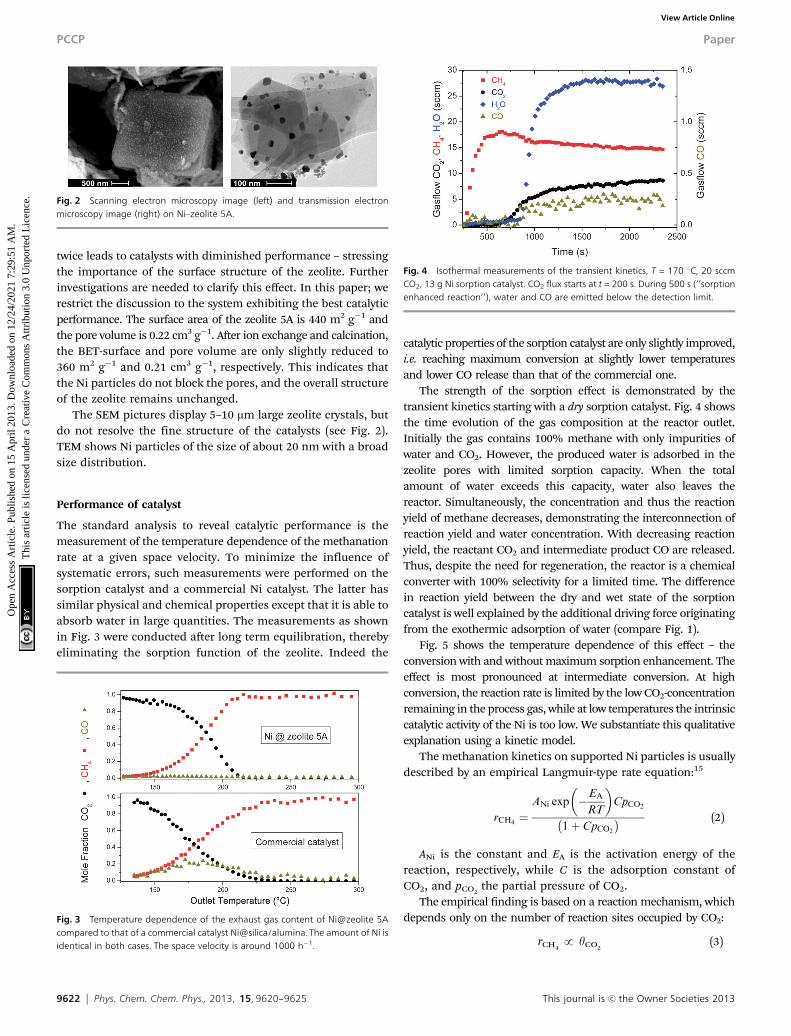
The strength of the sorption effect is demonstrated by thetransient kinetics starting with a dry sorption catalyst. Fig. 4 showsthe time evolution of the gas composition at the reactor outlet.Initially the gas contains 100% methane with only impurities ofwater and CO2. However, the produced water is adsorbed in thezeolite pores with limited sorption capacity. When the totalamount of water exceeds this capacity, water also leaves thereactor. Simultaneously, the concentration and thus the reactionyield of methane decreases, demonstrating the interconnection ofreaction yield and water concentration. With decreasing reactionyield, the reactant CO2 and intermediate product CO are released.Thus, despite the need for regeneration, the reactor is a chemicalconverter with 100% selectivity for a limited time. The differencein reaction yield between the dry and wet state of the sorptioncatalyst is well explained by the additional driving force originatingfrom the exothermic adsorption of water (compare Fig. 1).
Fig. 5 shows the temperature dependence of this effect – theconversion with and without maximum sorption enhancement. Theeffect is most pronounced at intermediate conversion. At highconversion, the reaction rate is limited by the low CO2-concentrationremaining in the process gas, while at low temperatures the intrinsiccatalytic activity of the Ni is too low. We substantiate this qualitativeexplanation using a kinetic model.
The methanation kinetics on supported Ni particles is usuallydescribed by an empirical Langmuir-type rate equation:15
rCH4¼
ANi exp �EA
RT
� �CpCO2
1þ CpCO2
� � (2)
ANi is the constant and EA is the activation energy of thereaction, respectively, while C is the adsorption constant ofCO2, and pCO2
the partial pressure of CO2.The empirical finding is based on a reaction mechanism, which
depends only on the number of reaction sites occupied by CO2:
rCH4p yCO2
(3)
Fig. 2 Scanning electron microscopy image (left) and transmission electronmicroscopy image (right) on Ni–zeolite 5A.
Fig. 3 Temperature dependence of the exhaust gas content of Ni@zeolite 5Acompared to that of a commercial catalyst Ni@silica/alumina. The amount of Ni isidentical in both cases. The space velocity is around 1000 h�1.
Fig. 4 Isothermal measurements of the transient kinetics, T = 170 1C, 20 sccmCO2, 13 g Ni sorption catalyst. CO2 flux starts at t = 200 s. During 500 s (‘‘sorptionenhanced reaction’’), water and CO are emitted below the detection limit.
PCCP Paper
Ope
n A
cces
s A
rtic
le. P
ublis
hed
on 1
5 A
pril
2013
. Dow
nloa
ded
on 1
2/24
/202
1 7:
29:5
1 A
M.
Thi
s ar
ticle
is li
cens
ed u
nder
a C
reat
ive
Com
mon
s A
ttrib
utio
n 3.
0 U
npor
ted
Lic
ence
.View Article Online

This journal is c the Owner Societies 2013 Phys. Chem. Chem. Phys., 2013, 15, 9620--9625 9623
If we include competitive adsorption of two water moleculesand CO2:
rCH4p yCO2
(1 � yH2O) (4)
we obtain
rCH4¼
ANi exp �EA
RT
� �CpCO2
1þ 2BpH2O þ CpCO2
� � (5)
For fitting data, we have to consider that the CO2 partialpressure in the reactor depends on the reaction rate, particu-larly as the conversion yield reaches nearly 100%.
The corresponding implicit function is estimated by
rCH4¼
A exp �EA
RT
� �
1þ B0 þ C0 exp �EA
RT
� �� � (6)
The data in Fig. 5 is fitted by this eqn (6). The importantparameter, which is extracted from the fit, is B0, which describesthe effect of occupied sites on the reaction yield. All other para-meters (activation energy EA and A, C) are kept constant whenfitting the CH4 reaction yield with and without maximum sorptionenhancement. The good fit indicates that the temperaturebehaviour is solely explained by the number of sites occupiedby water or CO. Furthermore, a simulation of the function withB0 = 0 (i.e. all water respective to CO is instantaneously removedfrom the reaction centre, Fig. 5) gives the maximum enhance-ment theoretically possible by the water sorption effect. Themeasured sorption enhancement does not reach the ideal curve;because the kinetics of mass transport from the reaction centresto the zeolite are limited (see discussion later).
Investigation of the reaction mechanism
The modelling of the performance data by a quantitative modelgives clear indication for a mechanism of the sorption based onthe removal of adsorbates from the reaction centres. Further
details are found by probing the reaction using in situ spectro-scopy, more specifically diffusive reflectance IR transformspectroscopy (DRIFTS) combined with mass spectrometry. Byutilizing this technique it is possible to identify active adsor-bates and follow the surface site occupancy the during reaction.In a typical experiment, after equilibration of the catalyst in anAr–H2 mixture a DRIFT spectrum is taken, and the reactants areintroduced. The first spectrum is considered to be the referencespectrum and is subtracted from all following spectra, henceonly showing changes due to evolution of adsorbed species onthe surface of the catalyst. The thus measured DRIFT spectrumof Ni on zeolite 5A after long-term exposure to a H2–CO2–Ar-mixture at 693 K (‘‘kinetic equilibrium’’) is shown in Fig. 6.
The spectrum shows four main peaks between 1500 and2500 cm�1. Additional structures are visible at higher and lowerenergies, which can be attributed to the same species asindicated in Fig. 6: 2353 cm�1 corresponds to the n3 stretchingvibrations of physisorbed CO2 on zeolites;16 2018 cm�1 and1855 cm�1 (and 1918 cm�1) are vibrations of strongly adsorbedCO on Ni, and the region around 1626 cm�1 is water adsorbedon the zeolite. Surnev et al. studied17 the CO adsorption onNi(111) by the use of infrared reflection absorption spectro-scopy. By a comparison with their study we assign the peakat 2018 cm�1 to linear CO species and the ones at 1855 cm�1
and 1918 cm�1 to two-fold bridged CO species. Additionalintermediates/side products have been proposed for theCO2 methanation:18,19 carbonate species (strong band at1420–1470 cm�1)20 and formate species (giving bands at 2996,2901, 1592 and 1395 cm�1).21 As none of the bands occurs,these species are either not formed or their concentration isbelow the detection limit. The observed shift of the n3 stretchingvibrations of physisorbed CO2 corroborates that adsorption ofCO2 on zeolites is enhanced when compared to CO2 on Ni assketched in Fig. 1. The greyscale plot shows the time evolution ofthe spectra. No new peaks develop, but strong intensity changesare evident.
Fig. 5 Temperature dependence of the outlet concentrations of CO2 and CH4 –with (‘‘initial’’) and without (‘‘equilibrium’’) maximum sorption enhancement.50 sccm CO2, 11 g Ni@zeolite5A. The dots are measurement data, black lines area guide to the eye. The red lines are fits to the measured CH4 yields using eqn (6),the fine dotted curve is a simulation with B0 = 0.
Fig. 6 Transient kinetics of methanation on sorption catalysts measured bytime-resolved DRIFTS measurements. The right panel shows a DRIFTS spectrumafter reaching kinetic equilibrium. The 1st differentials of the measurements areassembled as a grey-scale plot to highlight the changes taking place afterexposing the sample to hydrogen and CO2 (after scan #2).
Paper PCCP
Ope
n A
cces
s A
rtic
le. P
ublis
hed
on 1
5 A
pril
2013
. Dow
nloa
ded
on 1
2/24
/202
1 7:
29:5
1 A
M.
Thi
s ar
ticle
is li
cens
ed u
nder
a C
reat
ive
Com
mon
s A
ttrib
utio
n 3.
0 U
npor
ted
Lic
ence
.View Article Online
9624 Phys. Chem. Chem. Phys., 2013, 15, 9620--9625 This journal is c the Owner Societies 2013
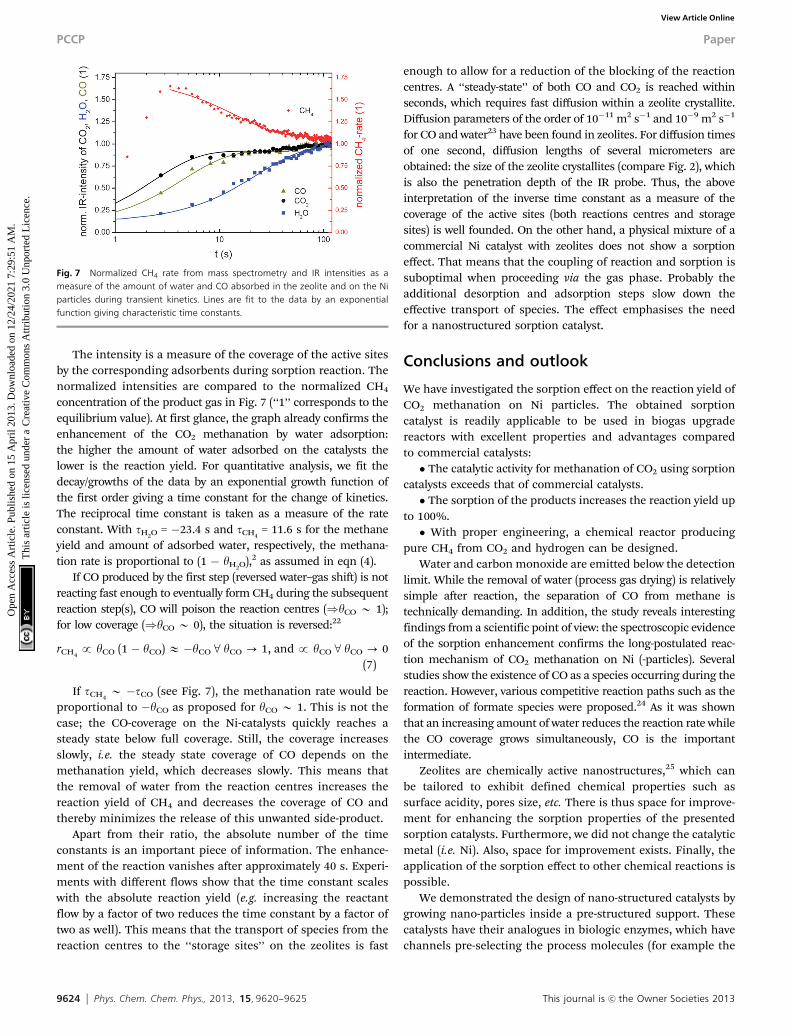
The intensity is a measure of the coverage of the active sitesby the corresponding adsorbents during sorption reaction. Thenormalized intensities are compared to the normalized CH4
concentration of the product gas in Fig. 7 (‘‘1’’ corresponds to theequilibrium value). At first glance, the graph already confirms theenhancement of the CO2 methanation by water adsorption:the higher the amount of water adsorbed on the catalysts thelower is the reaction yield. For quantitative analysis, we fit thedecay/growths of the data by an exponential growth function ofthe first order giving a time constant for the change of kinetics.The reciprocal time constant is taken as a measure of the rateconstant. With tH2O = �23.4 s and tCH4
= 11.6 s for the methaneyield and amount of adsorbed water, respectively, the methana-tion rate is proportional to (1 � yH2O),2 as assumed in eqn (4).
If CO produced by the first step (reversed water–gas shift) is notreacting fast enough to eventually form CH4 during the subsequentreaction step(s), CO will poison the reaction centres ()yCO B 1);for low coverage ()yCO B 0), the situation is reversed:22
rCH4p yCO (1 � yCO) E �yCO 8 yCO - 1, and p yCO 8 yCO - 0
(7)
If tCH4B �tCO (see Fig. 7), the methanation rate would be
proportional to �yCO as proposed for yCO B 1. This is not thecase; the CO-coverage on the Ni-catalysts quickly reaches asteady state below full coverage. Still, the coverage increasesslowly, i.e. the steady state coverage of CO depends on themethanation yield, which decreases slowly. This means thatthe removal of water from the reaction centres increases thereaction yield of CH4 and decreases the coverage of CO andthereby minimizes the release of this unwanted side-product.
Apart from their ratio, the absolute number of the timeconstants is an important piece of information. The enhance-ment of the reaction vanishes after approximately 40 s. Experi-ments with different flows show that the time constant scaleswith the absolute reaction yield (e.g. increasing the reactantflow by a factor of two reduces the time constant by a factor oftwo as well). This means that the transport of species from thereaction centres to the ‘‘storage sites’’ on the zeolites is fast
enough to allow for a reduction of the blocking of the reactioncentres. A ‘‘steady-state’’ of both CO and CO2 is reached withinseconds, which requires fast diffusion within a zeolite crystallite.Diffusion parameters of the order of 10�11 m2 s�1 and 10�9 m2 s�1
for CO and water23 have been found in zeolites. For diffusion timesof one second, diffusion lengths of several micrometers areobtained: the size of the zeolite crystallites (compare Fig. 2), whichis also the penetration depth of the IR probe. Thus, the aboveinterpretation of the inverse time constant as a measure of thecoverage of the active sites (both reactions centres and storagesites) is well founded. On the other hand, a physical mixture of acommercial Ni catalyst with zeolites does not show a sorptioneffect. That means that the coupling of reaction and sorption issuboptimal when proceeding via the gas phase. Probably theadditional desorption and adsorption steps slow down theeffective transport of species. The effect emphasises the needfor a nanostructured sorption catalyst.
Conclusions and outlook
We have investigated the sorption effect on the reaction yield ofCO2 methanation on Ni particles. The obtained sorptioncatalyst is readily applicable to be used in biogas upgradereactors with excellent properties and advantages comparedto commercial catalysts:� The catalytic activity for methanation of CO2 using sorption
catalysts exceeds that of commercial catalysts.� The sorption of the products increases the reaction yield up
to 100%.� With proper engineering, a chemical reactor producing
pure CH4 from CO2 and hydrogen can be designed.Water and carbon monoxide are emitted below the detection
limit. While the removal of water (process gas drying) is relativelysimple after reaction, the separation of CO from methane istechnically demanding. In addition, the study reveals interestingfindings from a scientific point of view: the spectroscopic evidenceof the sorption enhancement confirms the long-postulated reac-tion mechanism of CO2 methanation on Ni (-particles). Severalstudies show the existence of CO as a species occurring during thereaction. However, various competitive reaction paths such as theformation of formate species were proposed.24 As it was shownthat an increasing amount of water reduces the reaction rate whilethe CO coverage grows simultaneously, CO is the importantintermediate.
Zeolites are chemically active nanostructures,25 which canbe tailored to exhibit defined chemical properties such assurface acidity, pores size, etc. There is thus space for improve-ment for enhancing the sorption properties of the presentedsorption catalysts. Furthermore, we did not change the catalyticmetal (i.e. Ni). Also, space for improvement exists. Finally, theapplication of the sorption effect to other chemical reactions ispossible.
We demonstrated the design of nano-structured catalysts bygrowing nano-particles inside a pre-structured support. Thesecatalysts have their analogues in biologic enzymes, which havechannels pre-selecting the process molecules (for example the
Fig. 7 Normalized CH4 rate from mass spectrometry and IR intensities as ameasure of the amount of water and CO absorbed in the zeolite and on the Niparticles during transient kinetics. Lines are fit to the data by an exponentialfunction giving characteristic time constants.
PCCP Paper
Ope
n A
cces
s A
rtic
le. P
ublis
hed
on 1
5 A
pril
2013
. Dow
nloa
ded
on 1
2/24
/202
1 7:
29:5
1 A
M.
Thi
s ar
ticle
is li
cens
ed u
nder
a C
reat
ive
Com
mon
s A
ttrib
utio
n 3.
0 U
npor
ted
Lic
ence
.View Article Online

This journal is c the Owner Societies 2013 Phys. Chem. Chem. Phys., 2013, 15, 9620--9625 9625
hydrogenase enzyme26). We want to further develop this line ofthought: such enzymes are usually implemented in mem-branes, which separate reactants and products on macroscopicscale. Such a setup may be realized by designing nano-structured membranes made of zeolite membranes.27
Acknowledgements
This work was financially supported by CCEM and Swisselectricresearch through the HyTech project. The authors are gratefulto M. Gorbar for technical support.
Notes and references
1 A. Zuttel, A. Remhof, A. Borgschulte and O. Friedrichs,Hydrogen: the future energy carrier, Philos. Trans. R. Soc.London, Ser. A, 2010, 368, 3329–3342.
2 C. Graves, S. D. Ebbesen, M. Mogensen and K. S. Lackner,Sustainable hydrocarbon fuels by recycling CO2 and H2Owith renewable or nuclear energy, Renewable SustainableEnergy Rev., 2011, 15, 1–23.
3 G. Centi and S. Perathoner, Opportunities and prospects inthe chemical recycling of carbon dioxide to fuels, Catal.Today, 2009, 148, 191–205.
4 See, e.g., www.fischer-tropsch.org/.5 J. D. Murphy, E. McKeogh and G. Kiely, Technical/eco-
nomic/environmental analysis of biogas utilization, Appl.Energy, 2004, 77, 407–427.
6 B. K. Richards, F. G. Herndon, W. J. Jewell, R. J. Cummingsand T. E. White, In situ methane enrichment in methanogenicenergy crop digesters, Biomass Bioenergy, 1994, 6, 275–282.
7 M. Persson, Evaluation of upgrading techniques for biogas(http://www.sgc.se/dokument/Evaluation.pdf), 2003; theelectric energy consumption is 3–6% of the heating value,in addition there is a methane loss up to 10%.
8 A. D. Cuellar and M. E. Webber, Cow power: the energy andemissions benefits of converting manure to biogas, Environ.Res. Lett., 2008, 3, 034002–034010.
9 M. Specht, et al., Storage of renewable energy in the naturalgas grid, Erdoel, Erdgas, Kohle, 2010, 126, 342–346.
10 S. K. Hoekman, A. Broch, C. Robbins and R. Purcell, CO2
Recycling by reaction with renewably-generated hydrogen,Int. J. Greenhouse Gas Control, 2010, 4, 44–50.
11 B. T. Carvill, J. R. Hufton, M. Anand and S. Sircar, Sorption-enhanced reaction process, AIChE J., 1996, 42, 2765–2772.
12 H. Habazaki, M. Yamasaki, P.-B. Zhang, A. Kawashima,S. Kohno, T. Takai and K. Hashimoto, Co-methanation of
carbon monoxide and carbon dioxide on supported nickeland cobalt catalysts prepared from amorphous alloys, Appl.Catal., A, 1998, 172, 131–140.
13 J. K Nørskov, T. Bligaard, J. Rossmeisl andC. H. Christensen, Towards the computational design ofsolid catalysts, Nat. Chem., 2009, 1, 37–46.
14 C. V. McDaniel and P. K. Maher, in Zeolite Chemistry andCatalysis, ed. J. A. Rabo, ACS Monogr., 1976, p. 171.
15 T. van Herwijnen, H. van Doesburg and W. A. de Jong,Kinetics of the methanation of CO and CO2 on a nickelcatalyst, J. Catal., 1973, 28, 391–402.
16 V. B. Kazansky, V. Y. Borovkov, A. I. Serykh and M. Bulow,First observation of the broad-range DRIFT spectra ofcarbon dioxide adsorbed on NaX zeolite, Phys. Chem. Chem.Phys., 1999, 1, 3701–3702.
17 L. Surnev, Z. Xu and J. T. Yates, Jr., IRAS Study of the adsorptionof CO on Ni(111) – interrelation between various bondingmodes of chemisorbed CO, Surf. Sci., 1988, 201, 1–13.
18 S. I. Fujita, M. Nakamura, T. Doi and N. Takezawa, Mechanismsof methanation of carbon dioxide and carbon monoxide overnickel/alumina catalysts, Appl. Catal., A, 1993, 104, 87–100.
19 D. J. Darensbourg, C. G. Bauch and C. Ovalles, Mechanisticaspects of catalytic carbon dioxide methanation, Rev. Inorg.Chem., 1985, 7, 315–339.
20 L. H. Little, Infrared Spectra of Adsorbed Species, AcademicPress, New York, 1966.
21 Y. Amenomiya, Active-sites of solid acidic catalysts. 3.Infrared study of the water gas conversion reaction onalumina, J. Catal., 1979, 57, 64–71.
22 M. Agnelli, H. M. Swaan, C. Marquez-Alvarez, G. A. Martinand C. Mirodatos, CO hydrogenation on a nickel catalyst,J. Catal., 1998, 175, 117–128.
23 C. Parravano, J. D. Baldeschwieler and M. Boudart, Diffusionof water in zeolites, Science, 1967, 155, 1535–1536.
24 E. Vesselli, et al., Hydrogen-assisted transformation of CO2
on nickel: The role of formate and carbon monoxide, J. Phys.Chem. Lett., 2010, 1, 402–406.
25 B. Smit and T. L. M. Maesen, Towards a molecularunderstanding of shape selectivity, Nature, 2008, 451,671–678.
26 W. Lubitz, E. J. Reijerse and J. Messinger, Solar water-splitting into H2 and O2: design principles of photosystemII and hydrogenases, Energy Environ. Sci., 2008, 1, 15–31.
27 F. Gallucci, A. Basile and F. I. Hai, Introduction – A Review ofMembrane Reactors, in Membranes for Membrane Reactors:Preparation, Optimization and Selection, ed. A. Basile andF. Gallucci, John Wiley & Sons, 2011.
Paper PCCP
Ope
n A
cces
s A
rtic
le. P
ublis
hed
on 1
5 A
pril
2013
. Dow
nloa
ded
on 1
2/24
/202
1 7:
29:5
1 A
M.
Thi
s ar
ticle
is li
cens
ed u
nder
a C
reat
ive
Com
mon
s A
ttrib
utio
n 3.
0 U
npor
ted
Lic
ence
.View Article Online