Embed Size (px)
Citation preview
1894 | Phys. Chem. Chem. Phys., 2014, 16, 1894--1901 This journal is© the Owner Societies 2014
Cite this:Phys.Chem.Chem.Phys.,
2014, 16, 1894
Li ion dynamics in TiO2 anode materials with anordered hierarchical pore structure – insightsfrom ex situ NMR
Patrick Bottke,*a Yu Ren,b Ilie Hanzu,a Peter G. Bruceb and Martin Wilkeninga
Ex situ Nuclear Magnetic Resonance (NMR) measurements were carried out to study lithium ion dynamics
in lithium intercalated mesoporous anatase (LixTiO2) serving as an anode material for rechargeable lithium-
ion batteries. As has been shown recently, hierarchically ordered TiO2 shows excellent cycling performance
and ensures a high lithium storage capacity. 7Li spin–lattice relaxation NMR and stimulated echo NMR serve
as a powerful combination to shed light on the Li hopping processes from an atomic-scale point of view.
To determine atomic Li jump rates and microscopic activation energies temperature-variable SLR NMR
measurements, in both the laboratory and rotating frame of reference, as well as mixing-time dependent
spin-alignment echo NMR measurements were carried out. The results point to moderate Li diffusivities;
however, in a lithium-ion cell this is compensated for by taking advantage of nm-structured materials with
greatly reduced diffusion lengths. Importantly, although a phase transition from tetragonal symmetry to
orthorhombic symmetry takes place at increased states of charge, the diffusion parameters and activation
energies probed (0.4 to 0.5 eV) do depend weaker on Li content x than expected. Thus, despite the
increased value of x, the evolution of the orthorhombic phase seems to support Li diffusivity rather than
to affect the transport properties in a negative way. This interesting feature might be highly beneficial for
the excellent cycling behavior observed recently.
1 Introduction
The development of new electrode materials for lithium-ionbatteries is a vital topic in materials science.1–6 Currently,materials with nm-sized dimensions,7 i.e., those being charac-terized by large surface areas, are strongly considered to act aspowerful anode and cathode materials significantly improvingthe performance of today’s lithium ion batteries.1,8–13 Combinedwith an ordered 3D pore structure14 such materials ensure highstorage capacities and facile Li insertion and removal. This isinter alia related to short diffusion lengths of the nm-sizedmaterials1 as well as to the involvement of Li surface storage8
(or even pseudo-capacitive faradaic processes15,16) due to thelarge volume fraction of interfacial regions.
Quite recently, excellent cycling behavior of a lithium-ionbattery was achieved when mesoporous TiO2 with a 3D hier-archical pore structure served as an anode material.14 Even afterextensive charging and discharging of the battery, the hierarchical
pore structure is preserved throughout clearly illustrating thehigh stability of the anode material.14 Initially, TiO2 crystallizeswith tetragonal symmetry. However, upon Li insertion thecrystal structure transforms into an orthorhombic one,14 seealso analogous studies where NMR has been used to monitorthese changes.17–19 Besides kinetic effects also Li diffusionproperties are anticipated to govern the insertion and removalrates. So far, only a few studies can be found in the literaturebeing concerned with the atomic-scale measurement of Liself-diffusion parameters of TiO2-based anode materials withdifferent states of charges.17,20–23 The present study aims at thequestion if and to which extent Li self-diffusion changes as afunction of Li content x in LixTiO2. Since LixTiO2 is a mixedconductor, that is, electrons and lithium ions contribute to theoverall conductivity, those methods which are able to solely probeLi ion dynamics, such as NMR, represent favorable techniquesfor this purpose.17,20,22
Therefore, we used complementary 7Li NMR techniques20,24,25
to study the Li+ self-diffusion parameters such as microscopicactivation energies and jump rates. The techniques applied aresensitive to Li motional processes on quite different time scales.26
In particular, while 7Li spin-alignment echo (SAE) NMR27–30 isuseful to probe rather slow Li motions with correlation rateslower than 104 Hz, 7Li NMR spin–lattice relaxation (SLR)
a DFG Research Unit 1277 ‘‘Mobility of Lithium Ions in Solids’’ (TP 7), and Institute
for Chemistry and Technology of Materials, Graz University of Technology
Stremayrgasse 9, A-8010, Graz, Osterreich. E-mail: [email protected] School of Chemistry, University of St Andrews The Purdie Building, North Haugh,
St Andrews, Fife KY16 9ST, UK
Received 31st October 2013,Accepted 18th November 2013
DOI: 10.1039/c3cp54586e
www.rsc.org/pccp
PCCP
PAPER
Ope
n A
cces
s A
rtic
le. P
ublis
hed
on 1
1 D
ecem
ber
2013
. Dow
nloa
ded
on 3
/18/
2022
6:4
3:53
PM
. T
his
artic
le is
lice
nsed
und
er a
Cre
ativ
e C
omm
ons
Attr
ibut
ion
3.0
Unp
orte
d L
icen
ce.
View Article OnlineView Journal | View Issue
This journal is© the Owner Societies 2014 Phys. Chem. Chem. Phys., 2014, 16, 1894--1901 | 1895
measurements, in both the laboratory (SLRL) and rotating frame ofreference (SLRr),26,31,32 are applicable to detect hopping processeswith rates ranging from 105 Hz to 109 Hz. Interestingly, consideringx and the reversible phase transformation mentioned above, thedynamic parameters deduced from NMR, if identified with bulkprocesses, turned out to be less influenced by the Li content thanexpected,33 see also ref. 34. In contrast, the orthorhombic structureseems to facilitate Li migration which seems to be beneficial for theperformance of the battery.
2 Experimental
Synthesis and characterization of mesoporous anatase aredescribed elsewhere in detail, see ref. 14. Mesoporous anatasewas prepared using the silica KIT-6 as a hard template14 andlithium intercalation was carried out electrochemically at a rateof 10 mA g�1. Electrochemical cells were constructed by mixingthe active material and Super S carbon (MMM) in the weight ratioof 8 : 1 and pressed into a pellet. After drying at 80 1C undervacuum for 8 hours, the electrodes were assembled into cells witha Li anode and an LP 30 electrolyte (Merck; 1 M LiPF6 in 1 : 1 v/vethylene carbonate/dimethyl carbonate).
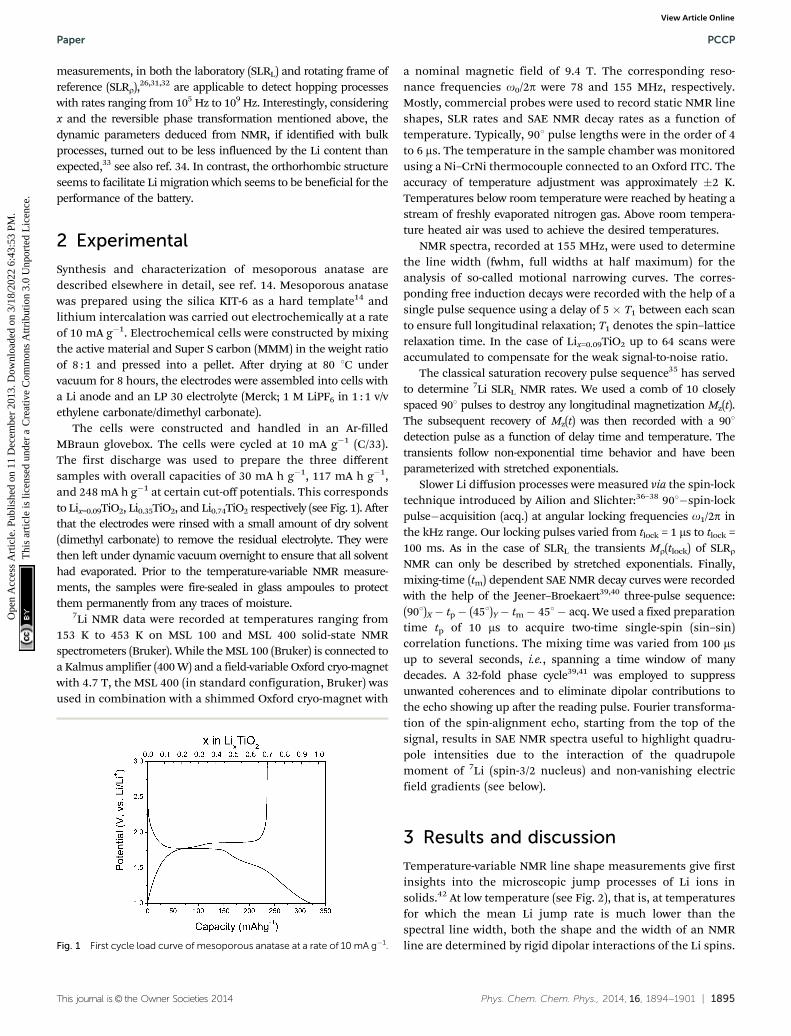
The cells were constructed and handled in an Ar-filledMBraun glovebox. The cells were cycled at 10 mA g�1 (C/33).The first discharge was used to prepare the three differentsamples with overall capacities of 30 mA h g�1, 117 mA h g�1,and 248 mA h g�1 at certain cut-off potentials. This correspondsto Lix=0.09TiO2, Li0.35TiO2, and Li0.74TiO2 respectively (see Fig. 1). Afterthat the electrodes were rinsed with a small amount of dry solvent(dimethyl carbonate) to remove the residual electrolyte. They werethen left under dynamic vacuum overnight to ensure that all solventhad evaporated. Prior to the temperature-variable NMR measure-ments, the samples were fire-sealed in glass ampoules to protectthem permanently from any traces of moisture.
7Li NMR data were recorded at temperatures ranging from153 K to 453 K on MSL 100 and MSL 400 solid-state NMRspectrometers (Bruker). While the MSL 100 (Bruker) is connected toa Kalmus amplifier (400 W) and a field-variable Oxford cryo-magnetwith 4.7 T, the MSL 400 (in standard configuration, Bruker) wasused in combination with a shimmed Oxford cryo-magnet with
a nominal magnetic field of 9.4 T. The corresponding reso-nance frequencies o0/2p were 78 and 155 MHz, respectively.Mostly, commercial probes were used to record static NMR lineshapes, SLR rates and SAE NMR decay rates as a function oftemperature. Typically, 901 pulse lengths were in the order of 4to 6 ms. The temperature in the sample chamber was monitoredusing a Ni–CrNi thermocouple connected to an Oxford ITC. Theaccuracy of temperature adjustment was approximately �2 K.Temperatures below room temperature were reached by heating astream of freshly evaporated nitrogen gas. Above room tempera-ture heated air was used to achieve the desired temperatures.
NMR spectra, recorded at 155 MHz, were used to determinethe line width (fwhm, full widths at half maximum) for theanalysis of so-called motional narrowing curves. The corres-ponding free induction decays were recorded with the help of asingle pulse sequence using a delay of 5 � T1 between each scanto ensure full longitudinal relaxation; T1 denotes the spin–latticerelaxation time. In the case of Lix=0.09TiO2 up to 64 scans wereaccumulated to compensate for the weak signal-to-noise ratio.
The classical saturation recovery pulse sequence35 has servedto determine 7Li SLRL NMR rates. We used a comb of 10 closelyspaced 901 pulses to destroy any longitudinal magnetization Mz(t).The subsequent recovery of Mz(t) was then recorded with a 901detection pulse as a function of delay time and temperature. Thetransients follow non-exponential time behavior and have beenparameterized with stretched exponentials.
Slower Li diffusion processes were measured via the spin-locktechnique introduced by Ailion and Slichter:36–38 901�spin-lockpulse�acquisition (acq.) at angular locking frequencies o1/2p inthe kHz range. Our locking pulses varied from tlock = 1 ms to tlock =100 ms. As in the case of SLRL the transients Mr(tlock) of SLRr
NMR can only be described by stretched exponentials. Finally,mixing-time (tm) dependent SAE NMR decay curves were recordedwith the help of the Jeener–Broekaert39,40 three-pulse sequence:(901)X� tp� (451)Y� tm� 451� acq. We used a fixed preparationtime tp of 10 ms to acquire two-time single-spin (sin–sin)correlation functions. The mixing time was varied from 100 msup to several seconds, i.e., spanning a time window of manydecades. A 32-fold phase cycle39,41 was employed to suppressunwanted coherences and to eliminate dipolar contributions tothe echo showing up after the reading pulse. Fourier transforma-tion of the spin-alignment echo, starting from the top of thesignal, results in SAE NMR spectra useful to highlight quadru-pole intensities due to the interaction of the quadrupolemoment of 7Li (spin-3/2 nucleus) and non-vanishing electricfield gradients (see below).
3 Results and discussion
Temperature-variable NMR line shape measurements give firstinsights into the microscopic jump processes of Li ions insolids.42 At low temperature (see Fig. 2), that is, at temperaturesfor which the mean Li jump rate is much lower than thespectral line width, both the shape and the width of an NMRline are determined by rigid dipolar interactions of the Li spins.Fig. 1 First cycle load curve of mesoporous anatase at a rate of 10 mA g�1.
Paper PCCP
Ope
n A
cces
s A
rtic
le. P
ublis
hed
on 1
1 D
ecem
ber
2013
. Dow
nloa
ded
on 3
/18/
2022
6:4
3:53
PM
. T
his
artic
le is
lice
nsed
und
er a
Cre
ativ
e C
omm
ons
Attr
ibut
ion
3.0
Unp
orte
d L
icen
ce.
View Article Online
1896 | Phys. Chem. Chem. Phys., 2014, 16, 1894--1901 This journal is© the Owner Societies 2014
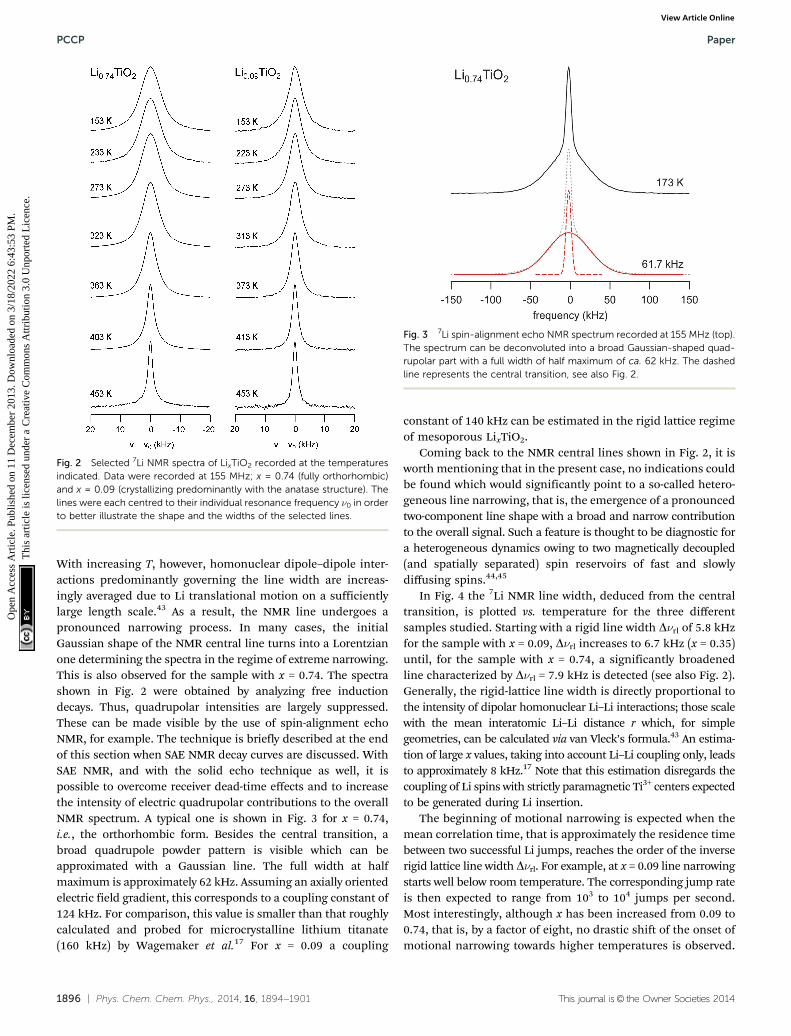
With increasing T, however, homonuclear dipole–dipole inter-actions predominantly governing the line width are increas-ingly averaged due to Li translational motion on a sufficientlylarge length scale.43 As a result, the NMR line undergoes apronounced narrowing process. In many cases, the initialGaussian shape of the NMR central line turns into a Lorentzianone determining the spectra in the regime of extreme narrowing.This is also observed for the sample with x = 0.74. The spectrashown in Fig. 2 were obtained by analyzing free inductiondecays. Thus, quadrupolar intensities are largely suppressed.These can be made visible by the use of spin-alignment echoNMR, for example. The technique is briefly described at the endof this section when SAE NMR decay curves are discussed. WithSAE NMR, and with the solid echo technique as well, it ispossible to overcome receiver dead-time effects and to increasethe intensity of electric quadrupolar contributions to the overallNMR spectrum. A typical one is shown in Fig. 3 for x = 0.74,i.e., the orthorhombic form. Besides the central transition, abroad quadrupole powder pattern is visible which can beapproximated with a Gaussian line. The full width at halfmaximum is approximately 62 kHz. Assuming an axially orientedelectric field gradient, this corresponds to a coupling constant of124 kHz. For comparison, this value is smaller than that roughlycalculated and probed for microcrystalline lithium titanate(160 kHz) by Wagemaker et al.17 For x = 0.09 a coupling
constant of 140 kHz can be estimated in the rigid lattice regimeof mesoporous LixTiO2.
Coming back to the NMR central lines shown in Fig. 2, it isworth mentioning that in the present case, no indications couldbe found which would significantly point to a so-called hetero-geneous line narrowing, that is, the emergence of a pronouncedtwo-component line shape with a broad and narrow contributionto the overall signal. Such a feature is thought to be diagnostic fora heterogeneous dynamics owing to two magnetically decoupled(and spatially separated) spin reservoirs of fast and slowlydiffusing spins.44,45
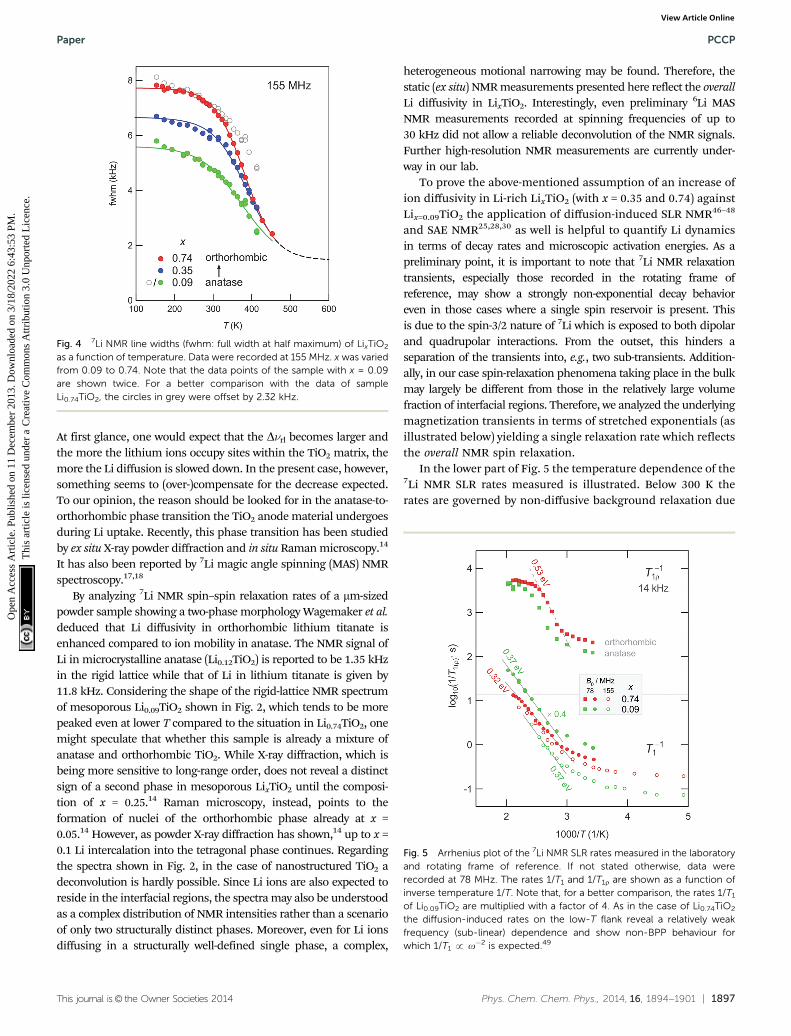
In Fig. 4 the 7Li NMR line width, deduced from the centraltransition, is plotted vs. temperature for the three differentsamples studied. Starting with a rigid line width Dnrl of 5.8 kHzfor the sample with x = 0.09, Dnrl increases to 6.7 kHz (x = 0.35)until, for the sample with x = 0.74, a significantly broadenedline characterized by Dnrl = 7.9 kHz is detected (see also Fig. 2).Generally, the rigid-lattice line width is directly proportional tothe intensity of dipolar homonuclear Li–Li interactions; those scalewith the mean interatomic Li–Li distance r which, for simplegeometries, can be calculated via van Vleck’s formula.43 An estima-tion of large x values, taking into account Li–Li coupling only, leadsto approximately 8 kHz.17 Note that this estimation disregards thecoupling of Li spins with strictly paramagnetic Ti3+ centers expectedto be generated during Li insertion.
The beginning of motional narrowing is expected when themean correlation time, that is approximately the residence timebetween two successful Li jumps, reaches the order of the inverserigid lattice line width Dnrl. For example, at x = 0.09 line narrowingstarts well below room temperature. The corresponding jump rateis then expected to range from 103 to 104 jumps per second.Most interestingly, although x has been increased from 0.09 to0.74, that is, by a factor of eight, no drastic shift of the onset ofmotional narrowing towards higher temperatures is observed.
Fig. 2 Selected 7Li NMR spectra of LixTiO2 recorded at the temperaturesindicated. Data were recorded at 155 MHz; x = 0.74 (fully orthorhombic)and x = 0.09 (crystallizing predominantly with the anatase structure). Thelines were each centred to their individual resonance frequency n0 in orderto better illustrate the shape and the widths of the selected lines.
Fig. 3 7Li spin-alignment echo NMR spectrum recorded at 155 MHz (top).The spectrum can be deconvoluted into a broad Gaussian-shaped quad-rupolar part with a full width of half maximum of ca. 62 kHz. The dashedline represents the central transition, see also Fig. 2.
PCCP Paper
Ope
n A
cces
s A
rtic
le. P
ublis
hed
on 1
1 D
ecem
ber
2013
. Dow
nloa
ded
on 3
/18/
2022
6:4
3:53
PM
. T
his
artic
le is
lice
nsed
und
er a
Cre
ativ
e C
omm
ons
Attr
ibut
ion
3.0
Unp
orte
d L
icen
ce.
View Article Online
This journal is© the Owner Societies 2014 Phys. Chem. Chem. Phys., 2014, 16, 1894--1901 | 1897
At first glance, one would expect that the Dnrl becomes larger andthe more the lithium ions occupy sites within the TiO2 matrix, themore the Li diffusion is slowed down. In the present case, however,something seems to (over-)compensate for the decrease expected.To our opinion, the reason should be looked for in the anatase-to-orthorhombic phase transition the TiO2 anode material undergoesduring Li uptake. Recently, this phase transition has been studiedby ex situ X-ray powder diffraction and in situ Raman microscopy.14
It has also been reported by 7Li magic angle spinning (MAS) NMRspectroscopy.17,18
By analyzing 7Li NMR spin–spin relaxation rates of a mm-sizedpowder sample showing a two-phase morphology Wagemaker et al.deduced that Li diffusivity in orthorhombic lithium titanate isenhanced compared to ion mobility in anatase. The NMR signal ofLi in microcrystalline anatase (Li0.12TiO2) is reported to be 1.35 kHzin the rigid lattice while that of Li in lithium titanate is given by11.8 kHz. Considering the shape of the rigid-lattice NMR spectrumof mesoporous Li0.09TiO2 shown in Fig. 2, which tends to be morepeaked even at lower T compared to the situation in Li0.74TiO2, onemight speculate that whether this sample is already a mixture ofanatase and orthorhombic TiO2. While X-ray diffraction, which isbeing more sensitive to long-range order, does not reveal a distinctsign of a second phase in mesoporous LixTiO2 until the composi-tion of x = 0.25.14 Raman microscopy, instead, points to theformation of nuclei of the orthorhombic phase already at x =0.05.14 However, as powder X-ray diffraction has shown,14 up to x =0.1 Li intercalation into the tetragonal phase continues. Regardingthe spectra shown in Fig. 2, in the case of nanostructured TiO2 adeconvolution is hardly possible. Since Li ions are also expected toreside in the interfacial regions, the spectra may also be understoodas a complex distribution of NMR intensities rather than a scenarioof only two structurally distinct phases. Moreover, even for Li ionsdiffusing in a structurally well-defined single phase, a complex,
heterogeneous motional narrowing may be found. Therefore, thestatic (ex situ) NMR measurements presented here reflect the overallLi diffusivity in LixTiO2. Interestingly, even preliminary 6Li MASNMR measurements recorded at spinning frequencies of up to30 kHz did not allow a reliable deconvolution of the NMR signals.Further high-resolution NMR measurements are currently under-way in our lab.
To prove the above-mentioned assumption of an increase ofion diffusivity in Li-rich LixTiO2 (with x = 0.35 and 0.74) againstLix=0.09TiO2 the application of diffusion-induced SLR NMR46–48
and SAE NMR25,28,30 as well is helpful to quantify Li dynamicsin terms of decay rates and microscopic activation energies. As apreliminary point, it is important to note that 7Li NMR relaxationtransients, especially those recorded in the rotating frame ofreference, may show a strongly non-exponential decay behavioreven in those cases where a single spin reservoir is present. Thisis due to the spin-3/2 nature of 7Li which is exposed to both dipolarand quadrupolar interactions. From the outset, this hinders aseparation of the transients into, e.g., two sub-transients. Addition-ally, in our case spin-relaxation phenomena taking place in the bulkmay largely be different from those in the relatively large volumefraction of interfacial regions. Therefore, we analyzed the underlyingmagnetization transients in terms of stretched exponentials (asillustrated below) yielding a single relaxation rate which reflectsthe overall NMR spin relaxation.
In the lower part of Fig. 5 the temperature dependence of the7Li NMR SLR rates measured is illustrated. Below 300 K therates are governed by non-diffusive background relaxation due
Fig. 4 7Li NMR line widths (fwhm: full width at half maximum) of LixTiO2
as a function of temperature. Data were recorded at 155 MHz. x was variedfrom 0.09 to 0.74. Note that the data points of the sample with x = 0.09are shown twice. For a better comparison with the data of sampleLi0.74TiO2, the circles in grey were offset by 2.32 kHz.
Fig. 5 Arrhenius plot of the 7Li NMR SLR rates measured in the laboratoryand rotating frame of reference. If not stated otherwise, data wererecorded at 78 MHz. The rates 1/T1 and 1/T1r are shown as a function ofinverse temperature 1/T. Note that, for a better comparison, the rates 1/T1
of Li0.09TiO2 are multiplied with a factor of 4. As in the case of Li0.74TiO2
the diffusion-induced rates on the low-T flank reveal a relatively weakfrequency (sub-linear) dependence and show non-BPP behaviour forwhich 1/T1 p o�2 is expected.49
Paper PCCP
Ope
n A
cces
s A
rtic
le. P
ublis
hed
on 1
1 D
ecem
ber
2013
. Dow
nloa
ded
on 3
/18/
2022
6:4
3:53
PM
. T
his
artic
le is
lice
nsed
und
er a
Cre
ativ
e C
omm
ons
Attr
ibut
ion
3.0
Unp
orte
d L
icen
ce.
View Article Online
1898 | Phys. Chem. Chem. Phys., 2014, 16, 1894--1901 This journal is© the Owner Societies 2014
to coupling of the Li spins with the Ti3+ centers, lattice vibra-tions and/or other paramagnetic impurities. Expectedly, theabsolute value of the background rates increases with increas-ing x pointing, e.g., to a larger number of Ti3+centers generatedor to an increased coupling of Li spins with electrons in theconduction band, see the rates measured at a Larmor frequencyof 155 MHz (Fig. 5). Sometimes these interactions can beextremely large hindering the detection of diffusion-inducedcontributions. In such cases other NMR techniques, as for instancemixing-time dependent SAE NMR (see below), can alternativelybe used to study Li dynamics in solids.
Fortunately, above room temperature the 1/T1 NMR ratesshown in Fig. 5 are increasingly influenced by diffusive Li+
hopping. This is in contrast to the study reported by Wage-maker et al., who did not observe a dependence of 1/T1 ontemperature for mm-sized crystallites up to ca. 500 K.17 Here,the rates increase with temperature and follow the low-T flankof a diffusion-induced NMR relaxation rate peak. At even highertemperatures the rates are expected to pass through the maximumon a log(1/T1) vs. 1/T plot. However, to prevent grain growth and toconserve the nanostructure of the materials, we restricted ourmeasurements to 500 K. Therefore, the analysis of SLR NMR datais limited to the low-temperature limit characterized by o0t c 1,which means that the mean correlation rate accessible is smallerthan the Larmor frequency applied. In the case of Li0.74TiO2
the rates recorded at 78 MHz and at the highest temperaturealready indicate the appearance of a relatively broad 1/T1 peak.Note that at the rate maximum of such a peak the correlationtime is expected to be in the order of the inverse Larmorfrequency, i.e., the relation o0t E 1 holds. This corresponds toLi jump rates with values in the MHz range. In the present casethis is expected to be fulfilled at ca. 500 K.
The solid lines in the lower part of Fig. 5 represent fits withan Arrhenius law. The fits include only those data pointsrecorded well above 330 K. From the slope the activation energyfor short-range Li hopping can be deduced. As in the case of linenarrowing, very similar activation energies are found. Interest-ingly, for x = 0.74 the value of Ea = 0.32(2) eV is somewhat smaller(0.37(2) eV) than that found for the sample with x = 0.09. Thisunderpins the results from motional narrowing presented above.It is worth noting that correction procedures, taking into accountthe non-diffusive background rates, do not change those resultsmuch since the background rates turn out to be almost inde-pendent of temperature below T = 220 K (see also Fig. 5). Let usnote that the activation energies probed here are much largerthan those reported by Wagemaker et al. (0.2 eV and 0.09 eV)17
for Li diffusion in anatase and lithium titanate on the basis ofspin–spin-relaxation NMR measurements.
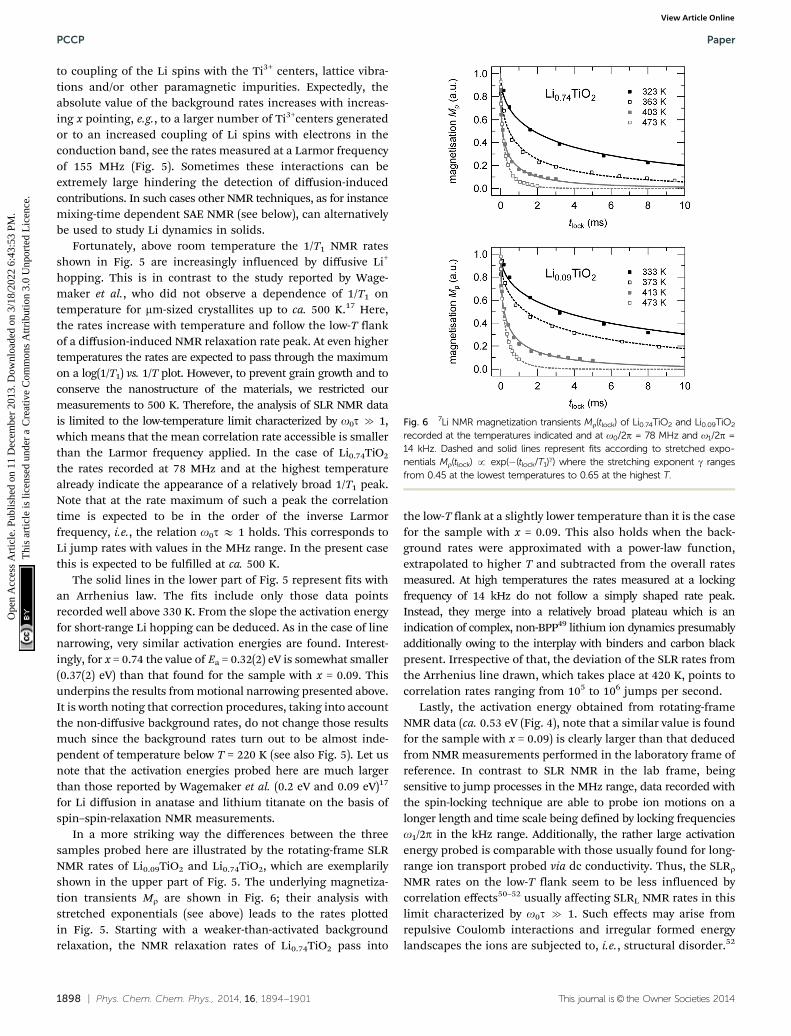
In a more striking way the differences between the threesamples probed here are illustrated by the rotating-frame SLRNMR rates of Li0.09TiO2 and Li0.74TiO2, which are exemplarilyshown in the upper part of Fig. 5. The underlying magnetiza-tion transients Mr are shown in Fig. 6; their analysis withstretched exponentials (see above) leads to the rates plottedin Fig. 5. Starting with a weaker-than-activated backgroundrelaxation, the NMR relaxation rates of Li0.74TiO2 pass into
the low-T flank at a slightly lower temperature than it is the casefor the sample with x = 0.09. This also holds when the back-ground rates were approximated with a power-law function,extrapolated to higher T and subtracted from the overall ratesmeasured. At high temperatures the rates measured at a lockingfrequency of 14 kHz do not follow a simply shaped rate peak.Instead, they merge into a relatively broad plateau which is anindication of complex, non-BPP49 lithium ion dynamics presumablyadditionally owing to the interplay with binders and carbon blackpresent. Irrespective of that, the deviation of the SLR rates fromthe Arrhenius line drawn, which takes place at 420 K, points tocorrelation rates ranging from 105 to 106 jumps per second.
Lastly, the activation energy obtained from rotating-frameNMR data (ca. 0.53 eV (Fig. 4), note that a similar value is foundfor the sample with x = 0.09) is clearly larger than that deducedfrom NMR measurements performed in the laboratory frame ofreference. In contrast to SLR NMR in the lab frame, beingsensitive to jump processes in the MHz range, data recorded withthe spin-locking technique are able to probe ion motions on alonger length and time scale being defined by locking frequencieso1/2p in the kHz range. Additionally, the rather large activationenergy probed is comparable with those usually found for long-range ion transport probed via dc conductivity. Thus, the SLRr
NMR rates on the low-T flank seem to be less influenced bycorrelation effects50–52 usually affecting SLRL NMR rates in thislimit characterized by o0t c 1. Such effects may arise fromrepulsive Coulomb interactions and irregular formed energylandscapes the ions are subjected to, i.e., structural disorder.52
Fig. 6 7Li NMR magnetization transients Mr(tlock) of Li0.74TiO2 and Li0.09TiO2
recorded at the temperatures indicated and at o0/2p = 78 MHz and o1/2p =14 kHz. Dashed and solid lines represent fits according to stretched expo-nentials Mr(tlock) p exp(�(tlock/T1)
g) where the stretching exponent g rangesfrom 0.45 at the lowest temperatures to 0.65 at the highest T.
PCCP Paper
Ope
n A
cces
s A
rtic
le. P
ublis
hed
on 1
1 D
ecem
ber
2013
. Dow
nloa
ded
on 3
/18/
2022
6:4
3:53
PM
. T
his
artic
le is
lice
nsed
und
er a
Cre
ativ
e C
omm
ons
Attr
ibut
ion
3.0
Unp
orte
d L
icen
ce.
View Article Online
This journal is© the Owner Societies 2014 Phys. Chem. Chem. Phys., 2014, 16, 1894--1901 | 1899
They are known to reduce the slope on the low-T flank of SLRNMR rate peaks.
Since the maxima of the SLRr NMR rate peaks could not beresolved, we used Jeener–Broekaert40 echoes to study spin-alignment echo (SAE) decay rates by recording single-spinmotional correlation functions. Such measurements turned outto be useful to confirm the long-range nature of the activationenergies probed via SLRr NMR. Echo damping was recorded byusing a three-pulse sequence; echo amplitudes were measuredas a function of mixing time tm but fixed preparation time of10 ms. The principle of SAE NMR is very similar to that ofexchange NMR.25,30,53 The intensity of the echo generated afterthe first two pulses decreases if the jumping ions visit sitescharacterized by different electric field gradients (EFGs); othereffects caused by (quadrupolar) spin–lattice relaxation or spin-diffusion may also contribute to the damping. A non-vanishingEFG is produced by the electric charge distribution in the directneighborhood of the nucleus under investigation.43 The inter-action of the quadrupole moment of the nucleus with an EFGalters the Zeeman levels by a certain amount of energy which isdetermined by the quadrupole frequency oq. Thus, in the idealcase SAE NMR is directly sensitive to temporal changes of thesite-specific quadrupole frequencies oq,i (i = 1. . .n) the ions senseduring hopping. Then, the decay curve represents a correlationfunction reflecting the probability to find an ion initially markedby oq,1 at a site with the same oq,1 at a later time.
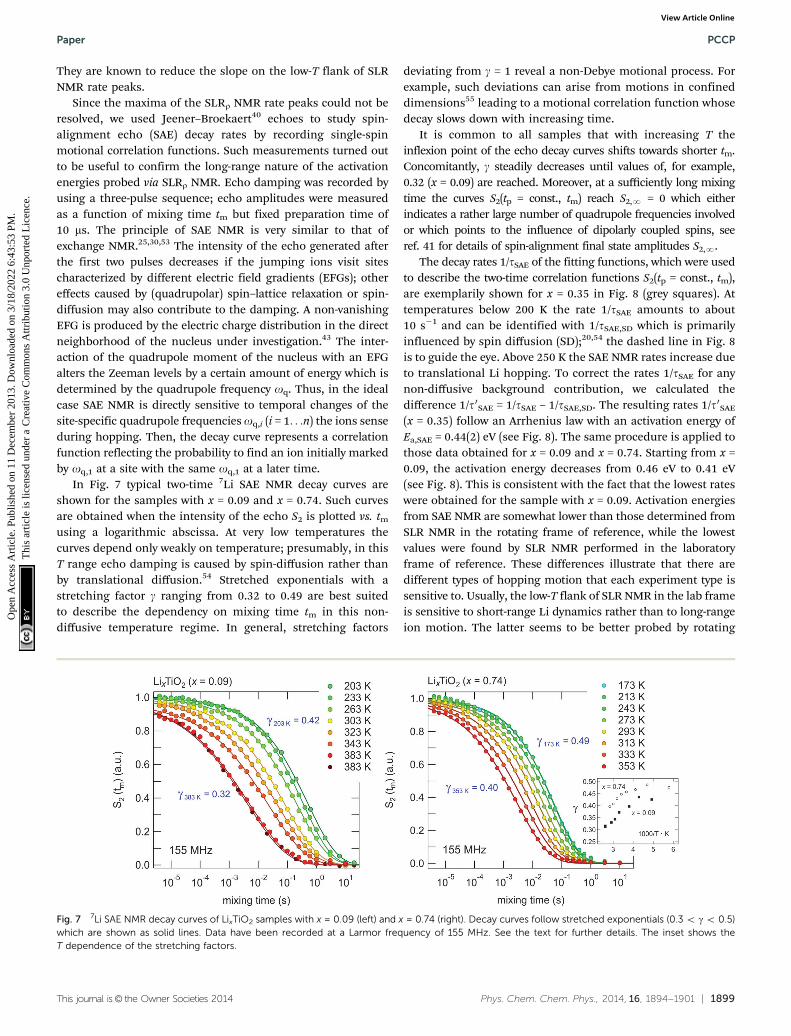
In Fig. 7 typical two-time 7Li SAE NMR decay curves areshown for the samples with x = 0.09 and x = 0.74. Such curvesare obtained when the intensity of the echo S2 is plotted vs. tm
using a logarithmic abscissa. At very low temperatures thecurves depend only weakly on temperature; presumably, in thisT range echo damping is caused by spin-diffusion rather thanby translational diffusion.54 Stretched exponentials with astretching factor g ranging from 0.32 to 0.49 are best suitedto describe the dependency on mixing time tm in this non-diffusive temperature regime. In general, stretching factors
deviating from g = 1 reveal a non-Debye motional process. Forexample, such deviations can arise from motions in confineddimensions55 leading to a motional correlation function whosedecay slows down with increasing time.
It is common to all samples that with increasing T theinflexion point of the echo decay curves shifts towards shorter tm.Concomitantly, g steadily decreases until values of, for example,0.32 (x = 0.09) are reached. Moreover, at a sufficiently long mixingtime the curves S2(tp = const., tm) reach S2,N = 0 which eitherindicates a rather large number of quadrupole frequencies involvedor which points to the influence of dipolarly coupled spins, seeref. 41 for details of spin-alignment final state amplitudes S2,N.
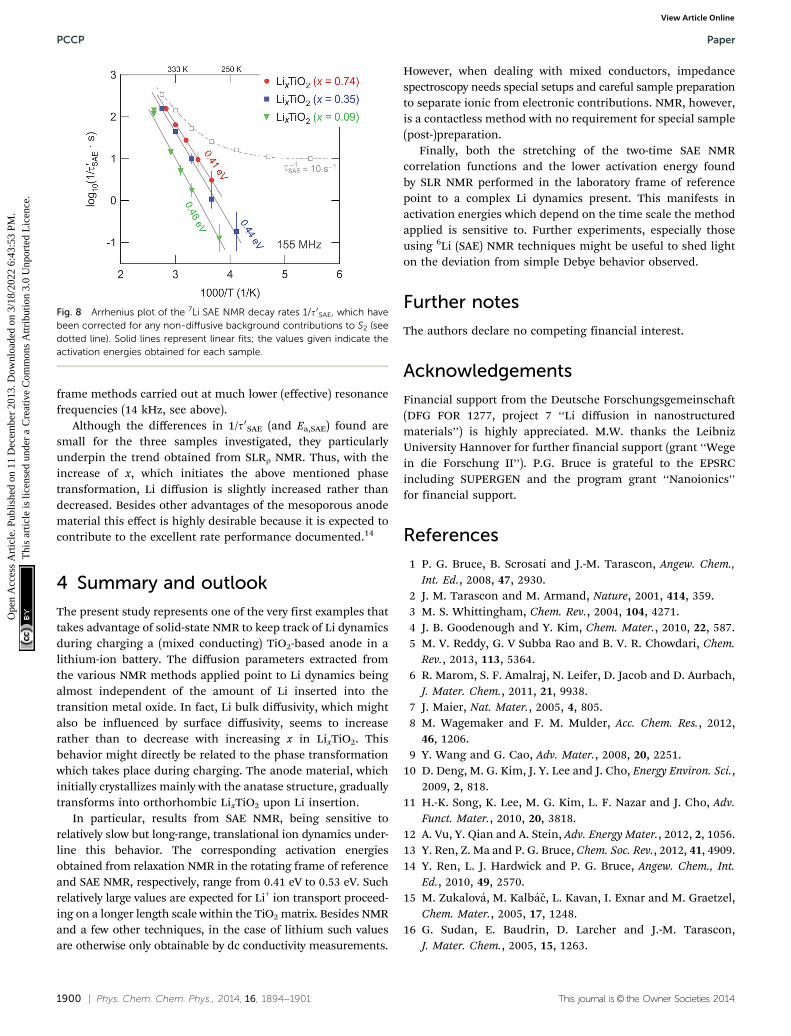
The decay rates 1/tSAE of the fitting functions, which were usedto describe the two-time correlation functions S2(tp = const., tm),are exemplarily shown for x = 0.35 in Fig. 8 (grey squares). Attemperatures below 200 K the rate 1/tSAE amounts to about10 s�1 and can be identified with 1/tSAE,SD which is primarilyinfluenced by spin diffusion (SD);20,54 the dashed line in Fig. 8is to guide the eye. Above 250 K the SAE NMR rates increase dueto translational Li hopping. To correct the rates 1/tSAE for anynon-diffusive background contribution, we calculated thedifference 1/t0SAE = 1/tSAE – 1/tSAE,SD. The resulting rates 1/t0SAE
(x = 0.35) follow an Arrhenius law with an activation energy ofEa,SAE = 0.44(2) eV (see Fig. 8). The same procedure is applied tothose data obtained for x = 0.09 and x = 0.74. Starting from x =0.09, the activation energy decreases from 0.46 eV to 0.41 eV(see Fig. 8). This is consistent with the fact that the lowest rateswere obtained for the sample with x = 0.09. Activation energiesfrom SAE NMR are somewhat lower than those determined fromSLR NMR in the rotating frame of reference, while the lowestvalues were found by SLR NMR performed in the laboratoryframe of reference. These differences illustrate that there aredifferent types of hopping motion that each experiment type issensitive to. Usually, the low-T flank of SLR NMR in the lab frameis sensitive to short-range Li dynamics rather than to long-rangeion motion. The latter seems to be better probed by rotating
Fig. 7 7Li SAE NMR decay curves of LixTiO2 samples with x = 0.09 (left) and x = 0.74 (right). Decay curves follow stretched exponentials (0.3 o g o 0.5)which are shown as solid lines. Data have been recorded at a Larmor frequency of 155 MHz. See the text for further details. The inset shows theT dependence of the stretching factors.
Paper PCCP
Ope
n A
cces
s A
rtic
le. P
ublis
hed
on 1
1 D
ecem
ber
2013
. Dow
nloa
ded
on 3
/18/
2022
6:4
3:53
PM
. T
his
artic
le is
lice
nsed
und
er a
Cre
ativ
e C
omm
ons
Attr
ibut
ion
3.0
Unp
orte
d L
icen
ce.
View Article Online
1900 | Phys. Chem. Chem. Phys., 2014, 16, 1894--1901 This journal is© the Owner Societies 2014
frame methods carried out at much lower (effective) resonancefrequencies (14 kHz, see above).
Although the differences in 1/t0SAE (and Ea,SAE) found aresmall for the three samples investigated, they particularlyunderpin the trend obtained from SLRr NMR. Thus, with theincrease of x, which initiates the above mentioned phasetransformation, Li diffusion is slightly increased rather thandecreased. Besides other advantages of the mesoporous anodematerial this effect is highly desirable because it is expected tocontribute to the excellent rate performance documented.14
4 Summary and outlook
The present study represents one of the very first examples thattakes advantage of solid-state NMR to keep track of Li dynamicsduring charging a (mixed conducting) TiO2-based anode in alithium-ion battery. The diffusion parameters extracted fromthe various NMR methods applied point to Li dynamics beingalmost independent of the amount of Li inserted into thetransition metal oxide. In fact, Li bulk diffusivity, which mightalso be influenced by surface diffusivity, seems to increaserather than to decrease with increasing x in LixTiO2. Thisbehavior might directly be related to the phase transformationwhich takes place during charging. The anode material, whichinitially crystallizes mainly with the anatase structure, graduallytransforms into orthorhombic LixTiO2 upon Li insertion.
In particular, results from SAE NMR, being sensitive torelatively slow but long-range, translational ion dynamics under-line this behavior. The corresponding activation energiesobtained from relaxation NMR in the rotating frame of referenceand SAE NMR, respectively, range from 0.41 eV to 0.53 eV. Suchrelatively large values are expected for Li+ ion transport proceed-ing on a longer length scale within the TiO2 matrix. Besides NMRand a few other techniques, in the case of lithium such valuesare otherwise only obtainable by dc conductivity measurements.
However, when dealing with mixed conductors, impedancespectroscopy needs special setups and careful sample preparationto separate ionic from electronic contributions. NMR, however,is a contactless method with no requirement for special sample(post-)preparation.
Finally, both the stretching of the two-time SAE NMRcorrelation functions and the lower activation energy foundby SLR NMR performed in the laboratory frame of referencepoint to a complex Li dynamics present. This manifests inactivation energies which depend on the time scale the methodapplied is sensitive to. Further experiments, especially thoseusing 6Li (SAE) NMR techniques might be useful to shed lighton the deviation from simple Debye behavior observed.
Further notes
The authors declare no competing financial interest.
Acknowledgements
Financial support from the Deutsche Forschungsgemeinschaft(DFG FOR 1277, project 7 ‘‘Li diffusion in nanostructuredmaterials’’) is highly appreciated. M.W. thanks the LeibnizUniversity Hannover for further financial support (grant ‘‘Wegein die Forschung II’’). P.G. Bruce is grateful to the EPSRCincluding SUPERGEN and the program grant ‘‘Nanoionics’’for financial support.
References
1 P. G. Bruce, B. Scrosati and J.-M. Tarascon, Angew. Chem.,Int. Ed., 2008, 47, 2930.
2 J. M. Tarascon and M. Armand, Nature, 2001, 414, 359.3 M. S. Whittingham, Chem. Rev., 2004, 104, 4271.4 J. B. Goodenough and Y. Kim, Chem. Mater., 2010, 22, 587.5 M. V. Reddy, G. V Subba Rao and B. V. R. Chowdari, Chem.
Rev., 2013, 113, 5364.6 R. Marom, S. F. Amalraj, N. Leifer, D. Jacob and D. Aurbach,
J. Mater. Chem., 2011, 21, 9938.7 J. Maier, Nat. Mater., 2005, 4, 805.8 M. Wagemaker and F. M. Mulder, Acc. Chem. Res., 2012,
46, 1206.9 Y. Wang and G. Cao, Adv. Mater., 2008, 20, 2251.
10 D. Deng, M. G. Kim, J. Y. Lee and J. Cho, Energy Environ. Sci.,2009, 2, 818.
11 H.-K. Song, K. Lee, M. G. Kim, L. F. Nazar and J. Cho, Adv.Funct. Mater., 2010, 20, 3818.
12 A. Vu, Y. Qian and A. Stein, Adv. Energy Mater., 2012, 2, 1056.13 Y. Ren, Z. Ma and P. G. Bruce, Chem. Soc. Rev., 2012, 41, 4909.14 Y. Ren, L. J. Hardwick and P. G. Bruce, Angew. Chem., Int.
Ed., 2010, 49, 2570.15 M. Zukalova, M. Kalbac, L. Kavan, I. Exnar and M. Graetzel,
Chem. Mater., 2005, 17, 1248.16 G. Sudan, E. Baudrin, D. Larcher and J.-M. Tarascon,
J. Mater. Chem., 2005, 15, 1263.
Fig. 8 Arrhenius plot of the 7Li SAE NMR decay rates 1/t0SAE, which havebeen corrected for any non-diffusive background contributions to S2 (seedotted line). Solid lines represent linear fits; the values given indicate theactivation energies obtained for each sample.
PCCP Paper
Ope
n A
cces
s A
rtic
le. P
ublis
hed
on 1
1 D
ecem
ber
2013
. Dow
nloa
ded
on 3
/18/
2022
6:4
3:53
PM
. T
his
artic
le is
lice
nsed
und
er a
Cre
ativ
e C
omm
ons
Attr
ibut
ion
3.0
Unp
orte
d L
icen
ce.
View Article Online
This journal is© the Owner Societies 2014 Phys. Chem. Chem. Phys., 2014, 16, 1894--1901 | 1901
17 M. Wagemaker, R. van de Krol, A. P. M. Ken gens, A. A. vanWell and F. M. Mulder, J. Am. Chem. Soc., 2001, 123, 11454.
18 V. Luca, L. Hanley, N. K. Robers and R. F. Howe, Chem.Mater., 1999, 11, 2089.
19 M. Vijayakumar, S. Kerisi, C. Wang, Z. Nie, K. M. Rosso,Z. Yang, G. Graff, J. Liu and J. Hu, J. Phys. Chem. C, 2009,113, 14567.
20 M. Wilkening, C. Lyness, A. R. Armstrong and P. G. Bruce,J. Phys. Chem. C, 2009, 113, 4741.
21 M. Wilkening, R. Amade, W. Iwaniak and P. Heitjans, Phys.Chem. Chem. Phys., 2007, 9, 1239.
22 M. Wagemaker, A. P. M. Kentgens and F. M. Mulder, Nature,2002, 418, 397.
23 M. Wagemaker, W. J. H. Borghols, E. R. H. van Eck,A. P. M. Kentgens, G. J. Kearley and F. M. Mulder,Chem.–Eur. J., 2007, 13, 2023.
24 M. Wilkening, W. Kuchler and P. Heitjans, Phys. Rev. Lett.,2006, 97, 065901.
25 M. Wilkening and P. Heitjans, ChemPhysChem, 2012, 13, 53.26 M. Wilkening, A. Kuhn and P. Heitjans, Phys. Rev. B:
Condens. Matter Mater. Phys., 2008, 78, 054303.27 F. Qi, G. Hinze, R. Bohmer, H. Sillescu and H. Zimmermann,
Chem. Phys. Lett., 2000, 328, 257.28 R. Bohmer and F. Qi, Solid State Nucl. Magn. Reson., 2007,
31, 28.29 M. Wilkening and P. Heitjans, J. Phys.: Condens. Matter,
2006, 18, 9849.30 R. Bohmer, K. Jeffrey and M. Vogel, Prog. Nucl. Magn. Reson.
Spectrosc., 2007, 50, 87.31 M. Wilkening, W. Iwaniak, J. Heine, V. Epp, A. Kleiner,
M. Behrens, G. Nuspl, W. Bensch and P. Heitjans, Phys.Chem. Chem. Phys., 2007, 9, 6199.
32 V. Epp, S. Nakhal, M. Lerch and M. Wilkening, J. Phys.:Condens. Matter, 2013, 25, 195402.
33 A. Van der Ven, J. Bhattacharya and A. A. Belak, Acc. Chem.Res., 2013, 46, 1216.
34 M. Wilkening, J. Heine, C. Lyness, A. Armstrong andP. Bruce, Phys. Rev. B: Condens. Matter Mater. Phys., 2009,80, 064302.
35 E. Fukushima and S. B. W. Roeder, Experimental Pulse NMR: ANuts and Bolts Approach, New Ed., Westview Press, Boulder, 1993.
36 D. Ailion and C. Slichter, Phys. Rev. Lett., 1964, 12, 168.37 C. Slichter and D. Ailion, Phys. Rev. A: At., Mol., Opt. Phys.,
1964, 135, 1099.38 D. Ailion and C. Slichter, Phys. Rev. A: At., Mol., Opt. Phys.,
1965, 137, 235.39 R. Bohmer, J. Magn. Reson., 2000, 147, 78.40 J. Jeener and P. Broekaert, Phys. Rev., 1967, 157, 232.41 F. Qi, G. Diezemann, H. Bohm, J. Lamber and R. Bohmer,
J. Magn. Reson., 2004, 169, 225.42 M. Wilkening, V. Epp, A. Feldhoff and P. Heitjans, J. Phys.
Chem. C, 2008, 112, 9291.43 A. Abragam, The Principles of Nuclear Magnetism, Clarendon,
Oxford, 1961.44 S. Indris and P. Heitjans, J. Non-Cryst. Solids, 2002,
307–310, 555.45 M. Wilkening, S. Indris and P. Heitjans, Phys. Chem. Chem.
Phys., 2003, 5, 2225.46 H. Buschmann, J. Dolle, S. Berendts, A. Kuhn, P. Bottke,
M. Wilkening, P. Heitjans, A. Senyshyn, H. Ehrenberg,A. Lotnyk, V. Duppel, L. Kienle and J. Janek, Phys. Chem.Chem. Phys., 2011, 13, 19378.
47 A. Kuhn, M. Kunze, P. Sreeraj, H. D. Wiemhofer,V. Thangadurai, M. Wilkening and P. Heitjans, Solid StateNucl. Magn. Reson., 2012, 42, 2.
48 A. Kuhn, P. Sreeraj, R. Pottgen, H.-D. Wiemhofer,M. Wilkening and P. Heitjans, J. Am. Chem. Soc., 2011,133, 11018.
49 N. Bloembergen, E. M. Purcell and R. V. Pound, Phys. Rev.,1948, 73, 679.
50 K. Funke, Prog. Solid State Chem., 1993, 22, 111.51 M. Meyer, P. Maass and A. Bunde, Phys. Rev. Lett., 1993,
71, 573.52 A. Bunde, W. Dieterich, P. Maass and M. Meyer, in Diffus.
Condens. Matter – Methods, Mater. Model, ed. P. Heitjans andJ. Karger, Springer, Berlin, 2005, p. 813.
53 B. Koch and M. Vogel, Solid State Nucl. Magn. Reson., 2008,34, 37.
54 C. Brinkmann, S. Faske, B. Koch and M. Vogel, Z. Phys.Chem., 2010, 224, 1535.
55 M. Wilkening and P. Heitjans, Phys. Rev. B: Condens. MatterMater. Phys., 2008, 77, 24311.
Paper PCCP
Ope
n A
cces
s A
rtic
le. P
ublis
hed
on 1
1 D
ecem
ber
2013
. Dow
nloa
ded
on 3
/18/
2022
6:4
3:53
PM
. T
his
artic
le is
lice
nsed
und
er a
Cre
ativ
e C
omm
ons
Attr
ibut
ion
3.0
Unp
orte
d L
icen
ce.
View Article Online