Embed Size (px)
Citation preview
4984 Phys. Chem. Chem. Phys., 2013, 15, 4984--4994 This journal is c the Owner Societies 2013
Cite this: Phys. Chem.Chem.Phys.,2013,15, 4984
Quantum yields for the photolysis of glyoxal below350 nm and parameterisations for its photolysis ratein the troposphere
Robert J. Salter, Mark A. Blitz,* Dwayne E. Heard, Tamas Kovacs, Michael J. Pilling,Andrew R. Rickard and Paul W. Seakins
The formation of HCO and of H in the photolysis of glyoxal have been investigated over the
wavelength ranges 310–335 nm for HCO and 193–340 nm for H. Dye laser photolysis was coupled with
cavity ring-down spectroscopy for HCO, and with laser induced fluorescence spectroscopy for H.
Absolute quantum yields were determined using actinometers based on (a) Cl2 photolysis and the
Cl + HCHO reaction for HCO and (b) N2O photolysis (and O1D + H2) and CH2CO photolysis (and CH2 + O2)
for H. The quantum yields were found to be pressure independent in this wavelength region. Quantum
yields for all product channels under atmospheric conditions were calculated and compared with
literature values. Differences between this work and previously published work and their atmospheric
implications are discussed.
1. Introduction
In our companion paper1 we discussed the photolysis mechanismof glyoxal (HCO)2 in the wavelength region 355–414 nm showingthat above 395 nm, photolysis can occur through two electronicstates. In this paper we report data from shorter wavelength(193–355 nm) photolysis, detecting both H and HCO products,and focus on the atmospheric implications of the measurements.
Glyoxal, is the smallest a-dicarbonyl and is ubiquitous within theglobal troposphere with a wide range of sources sources.2 It isformed through the photo-oxidation of many volatile organiccompounds (VOCs) including alkenes,3 acetylene,4–6 glycolaldehyde7
and aromatics in the presence of NOx.8–10 Most importantly, glyoxalis a minor product (B6%)2 of isoprene photo-oxidation, which isglobally the most abundant biogenic non-methane hydrocarbon(B500 TgC y�1 released to the atmosphere).11 These secondarysources, along with primary emissions from combustion (e.g. carexhausts12,13), make glyoxal highly relevant for study, especially inthe contexts of tropical forests, urban air pollution and plumes frombiomass burning.2,14 Glyoxal has been observed throughout thetroposphere. Elevated concentrations (up to 1–1.2 ppbv at midday inMexico City)15 have also been measured in urban areas.16 Glyoxalreacts relatively slowly with OH (k296K = 8.8� 10�12 cm3 mol�1 s�1),17
giving it an atmospheric lifetime with respect to removal by OH,
tOH, of B1 day for [OH] B 1� 106 mol cm�3.18 The major removalprocess for glyoxal in the troposphere is photolysis, with tPhot B2–3 hours.18,19 Photolysis of glyoxal can take place at wavelengthsthat are available within the troposphere. Glyoxal is not only photo-lysed in the UV region where other carbonyl species absorb, but alsoin the blue region of the visible spectrum where the atmospheric fluxis much greater. Photolysis can lead to the production of the formylradical, HCO, which plays an important atmospheric role as it reactsquickly with O2 to form HO2 radicals:20,21
HCO + O2 - CO + HO2 (R1)
In turn, HO2 can be converted to OH, for example by reactionwith NO, and hence glyoxal photolysis may influence the oxidisingcapacity of the atmosphere. Glyoxal may also play a role in theformation of secondary organic aerosol22–24 affecting surfaceprocesses, the Earth’s radiative balance and human health. It istherefore important to have accurate data concerning the rateof removal of glyoxal and production of HCO via its photolysis.
Both radical and molecular channels occur in the tropo-spherically significant wavelength range:
(HCO)2 + hn - 2HCO l r 413 nm (P1a)
- HCO + H + CO l r 342 nm (P1b)
- CH2O + CO Exothermic, all l (P1c)
- H2 + 2CO Exothermic, all l (P1d)School of Chemistry, University of Leeds, Leeds, LS2 9JT, UK.
E-mail: [email protected]; Fax: +44-(0)-113-343-6565
Received 11th October 2012,Accepted 28th January 2013
DOI: 10.1039/c3cp43597k
www.rsc.org/pccp
PCCP
PAPER
Ope
n A
cces
s A
rtic
le. P
ublis
hed
on 3
1 Ja
nuar
y 20
13. D
ownl
oade
d on
3/1
8/20
22 9
:04:
08 P
M.
Thi
s ar
ticle
is li
cens
ed u
nder
a C
reat
ive
Com
mon
s A
ttrib
utio
n 3.
0 U
npor
ted
Lic
ence
.
View Article OnlineView Journal | View Issue
This journal is c the Owner Societies 2013 Phys. Chem. Chem. Phys., 2013, 15, 4984--4994 4985
- HCOH + CO Exothermic, all l (P1e)
- 2H + 2CO l r 291 nm (P1g)†
In the atmosphere, the radical channels all lead to for-mation of 2HO2, via H + O2 + M, or reaction R1 so that glyoxalphotolysis provides photolysis routes to HOx radicals.
Experimental studies of glyoxal photolysis using lamps25 andlaser techniques26 have been designed to determine productsunder atmospheric conditions; they show that (P1a) is the major,but not exclusive, channel under atmospheric conditions.Chen and Zhu,26 using cavity ring-down spectroscopy (CRDS)to monitor HCO, determined the quantum yield as a functionof pressure and wavelength (290–420 nm) following dye laserphotolysis of glyoxal. Feierabend et al.27 used the same experi-mental technique, over a similar wavelength range, but at amuch more extensive number of wavelengths and with betterHCO sensitivity due to greater overlap of the CRDS and photo-lysis beams. Tadic et al.25 used a range of lamps as photolysissources and FTIR to monitor the removal of glyoxal and identifythe photolysis products; their results were substantiated bycomparison with glyoxal loss experiments in an atmosphericchamber. In the companion paper we used the same techniqueas Chen and Zhu and Feierabend et al. at wavelengths above350 nm to investigate the photolysis mechanism of glyoxal,showing that at l > 395 nm, two electronic states appear to beinvolved in the dissociation.1 All these studies indicate that, forl > 350 nm, channel (P1a) is dominant and that the HCO yieldis pressure dependent. At shorter wavelengths other channels,and particularly (P1c) becomes important and it has also beensuggested that (P1d) is also significant.
The present paper examines the photolysis of glyoxal for lr350 nm using detection of HCO and of H. We show that themajor photolysis channels in this wavelength region are (P1a),(P1b) and (P1c) and that the yield of (P1d) is less than 0.1. Thedata from this and the previous paper have been parameterisedto a functional form that predicts the quantum yield for glyoxalphotolysis as a function of wavelength, pressure and tempera-ture for each of the main product channels. This parameterisa-tion is then used to calculate atmospheric photolysis rates,which are compared with those from previous studies, and theatmospheric implications are considered.
2. Experimental
The methods used for detecting HCO (via cavity ring downspectroscopy (CRDS)) and for calibrating the quantum yieldwere described in the companion paper.1 In addition to thoseCRDS studies, a series of pulsed laser photolysis (PLP) experi-ments were carried out at room temperature at photolysiswavelengths 193, 308, 316.7 and 339.7 nm detecting the H atomproducts via vacuum ultraviolet laser induced fluorescence (VUVLIF) spectroscopy. The details of the PLP – VUV LIF apparatushave been described before;28 briefly H atoms were generatedfrom the pulsed photolysis of glyoxal in a metal, slow flow cell
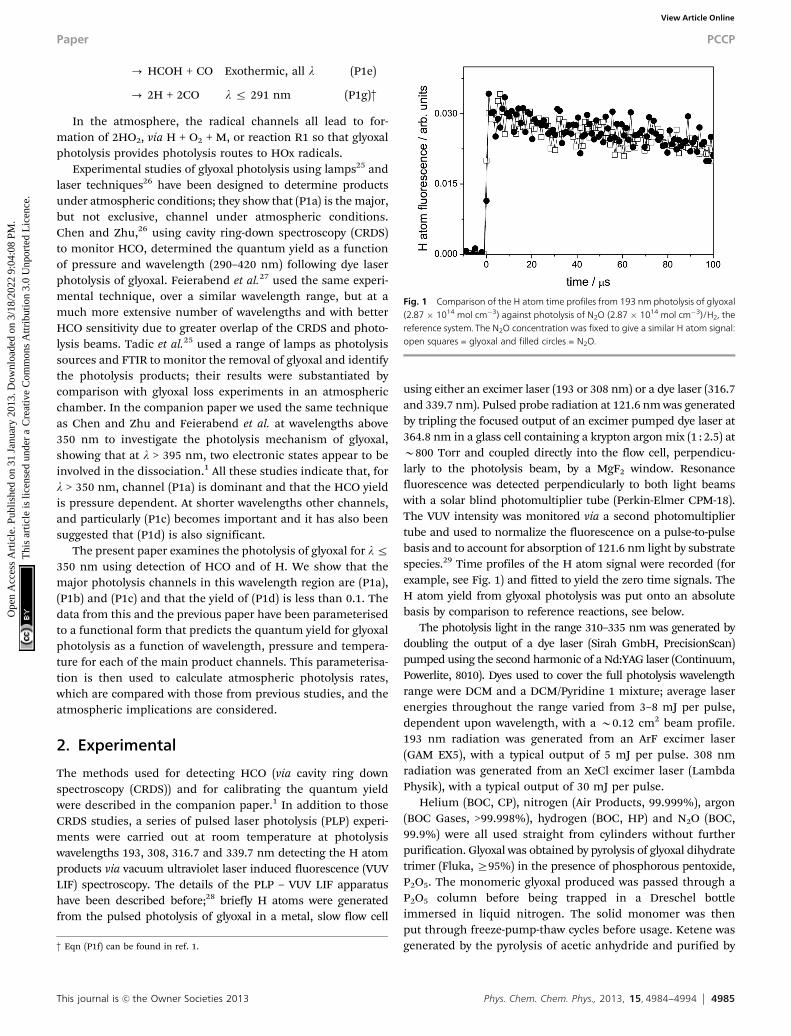
using either an excimer laser (193 or 308 nm) or a dye laser (316.7and 339.7 nm). Pulsed probe radiation at 121.6 nm was generatedby tripling the focused output of an excimer pumped dye laser at364.8 nm in a glass cell containing a krypton argon mix (1 : 2.5) atB800 Torr and coupled directly into the flow cell, perpendicu-larly to the photolysis beam, by a MgF2 window. Resonancefluorescence was detected perpendicularly to both light beamswith a solar blind photomultiplier tube (Perkin-Elmer CPM-18).The VUV intensity was monitored via a second photomultipliertube and used to normalize the fluorescence on a pulse-to-pulsebasis and to account for absorption of 121.6 nm light by substratespecies.29 Time profiles of the H atom signal were recorded (forexample, see Fig. 1) and fitted to yield the zero time signals. TheH atom yield from glyoxal photolysis was put onto an absolutebasis by comparison to reference reactions, see below.
The photolysis light in the range 310–335 nm was generated bydoubling the output of a dye laser (Sirah GmbH, PrecisionScan)pumped using the second harmonic of a Nd:YAG laser (Continuum,Powerlite, 8010). Dyes used to cover the full photolysis wavelengthrange were DCM and a DCM/Pyridine 1 mixture; average laserenergies throughout the range varied from 3–8 mJ per pulse,dependent upon wavelength, with a B0.12 cm2 beam profile.193 nm radiation was generated from an ArF excimer laser(GAM EX5), with a typical output of 5 mJ per pulse. 308 nmradiation was generated from an XeCl excimer laser (LambdaPhysik), with a typical output of 30 mJ per pulse.
Helium (BOC, CP), nitrogen (Air Products, 99.999%), argon(BOC Gases, >99.998%), hydrogen (BOC, HP) and N2O (BOC,99.9%) were all used straight from cylinders without furtherpurification. Glyoxal was obtained by pyrolysis of glyoxal dihydratetrimer (Fluka, Z95%) in the presence of phosphorous pentoxide,P2O5. The monomeric glyoxal produced was passed through aP2O5 column before being trapped in a Dreschel bottleimmersed in liquid nitrogen. The solid monomer was thenput through freeze-pump-thaw cycles before usage. Ketene wasgenerated by the pyrolysis of acetic anhydride and purified by
Fig. 1 Comparison of the H atom time profiles from 193 nm photolysis of glyoxal(2.87 � 1014 mol cm�3) against photolysis of N2O (2.87 � 1014 mol cm�3)/H2, thereference system. The N2O concentration was fixed to give a similar H atom signal:open squares = glyoxal and filled circles = N2O.
† Eqn (P1f) can be found in ref. 1.
Paper PCCP
Ope
n A
cces
s A
rtic
le. P
ublis
hed
on 3
1 Ja
nuar
y 20
13. D
ownl
oade
d on
3/1
8/20
22 9
:04:
08 P
M.
Thi
s ar
ticle
is li
cens
ed u
nder
a C
reat
ive
Com
mon
s A
ttrib
utio
n 3.
0 U
npor
ted
Lic
ence
.View Article Online
4986 Phys. Chem. Chem. Phys., 2013, 15, 4984--4994 This journal is c the Owner Societies 2013
trap-to-trap distillation.30 Ketene and glyoxal were stored indarkened Pyrex bulbs and diluted with nitrogen before usage.The purity of glyoxal samples was checked by UV/visible spectro-scopy on a high resolution spectrometer (Perkin-Elmer, Lambda900, resolution = 0.05 Å) and daily on a lower, resolutionspectrometer which could be attached to the gas line (OceanOptics, HR4000CG-UV-NIR with DH-2000-BAL light source).16
This spectrometric assignment for the glyoxal concentrationwas used for the present study but it is noted that the concen-tration based on pressure readings was in agreement.
3. Results
The methodology for determining the absolute quantum yield forHCO formation using a chlorine/HCHO actinometer was describedin the companion paper.1 The approach for constructing Stern–Volmer (SV) plots of the reciprocal HCO quantum yield, FHCO,versus the concentration of the diluent gas was also discussed there.The analysis depends on the assumption that a competition occursin the initially excited singlet state, S1*, between collisional stabi-lisation and dissociation. The relationship used is:
1
FHCO¼ 1
F0;HCO1þ kq
kd½M�
� �(E1)
where kq/kd is the ratio of the quenching to the dissociation ratecoefficients, where dissociation refers to all operative photolysischannels. F0,HCO = 2kda/kd, where kda is the rate coefficient fordissociation of S1* via channel (P1a), is the HCO yield at zeropressure and kq/kd is the slope/intercept ratio of the Stern–Volmerplot. The zero-pressure quantum yield for photolysis via allchannels is unity within this model and the lifetime of S1* is 1/kd.
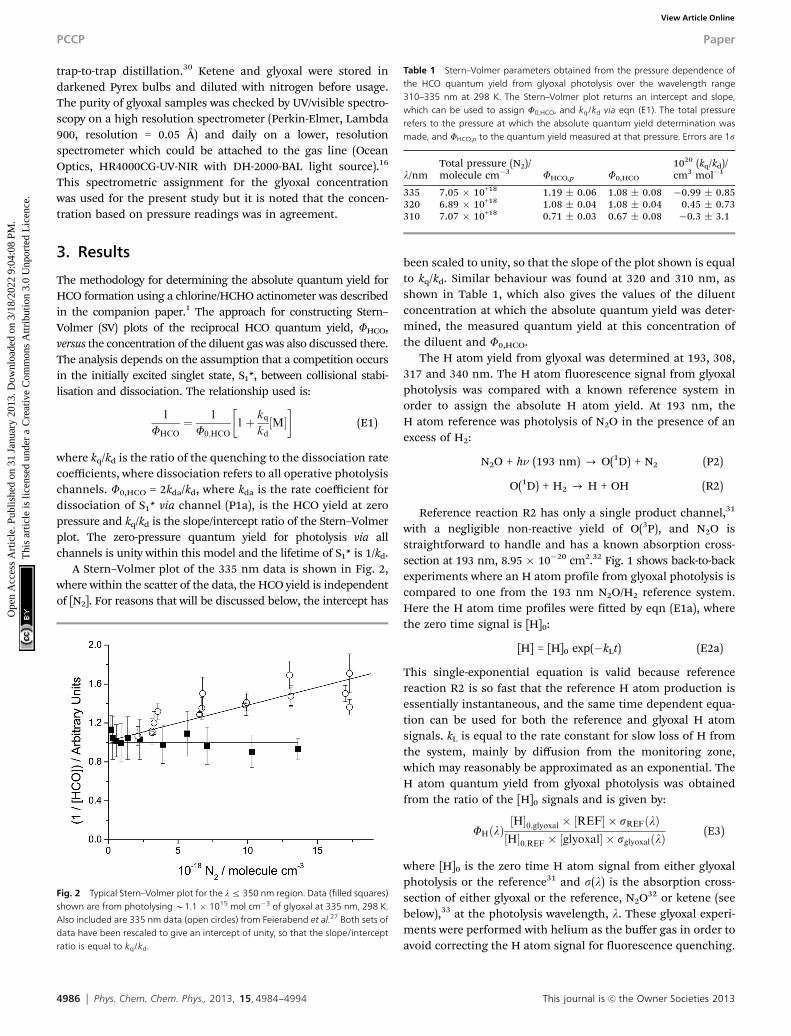
A Stern–Volmer plot of the 335 nm data is shown in Fig. 2,where within the scatter of the data, the HCO yield is independentof [N2]. For reasons that will be discussed below, the intercept has
been scaled to unity, so that the slope of the plot shown is equalto kq/kd. Similar behaviour was found at 320 and 310 nm, asshown in Table 1, which also gives the values of the diluentconcentration at which the absolute quantum yield was deter-mined, the measured quantum yield at this concentration ofthe diluent and F0,HCO.
The H atom yield from glyoxal was determined at 193, 308,317 and 340 nm. The H atom fluorescence signal from glyoxalphotolysis was compared with a known reference system inorder to assign the absolute H atom yield. At 193 nm, theH atom reference was photolysis of N2O in the presence of anexcess of H2:
N2O + hn (193 nm) - O(1D) + N2 (P2)
O(1D) + H2 - H + OH (R2)
Reference reaction R2 has only a single product channel,31
with a negligible non-reactive yield of O(3P), and N2O isstraightforward to handle and has a known absorption cross-section at 193 nm, 8.95 � 10�20 cm2.32 Fig. 1 shows back-to-backexperiments where an H atom profile from glyoxal photolysis iscompared to one from the 193 nm N2O/H2 reference system.Here the H atom time profiles were fitted by eqn (E1a), wherethe zero time signal is [H]0:
[H] = [H]0 exp(�kLt) (E2a)
This single-exponential equation is valid because referencereaction R2 is so fast that the reference H atom production isessentially instantaneous, and the same time dependent equa-tion can be used for both the reference and glyoxal H atomsignals. kL is equal to the rate constant for slow loss of H fromthe system, mainly by diffusion from the monitoring zone,which may reasonably be approximated as an exponential. TheH atom quantum yield from glyoxal photolysis was obtainedfrom the ratio of the [H]0 signals and is given by:
FHðlÞ½H�0;glyoxal � ½REF� � sREFðlÞ½H�0;REF � ½glyoxal� � sglyoxalðlÞ
(E3)
where [H]0 is the zero time H atom signal from either glyoxalphotolysis or the reference31 and s(l) is the absorption cross-section of either glyoxal or the reference, N2O32 or ketene (seebelow),33 at the photolysis wavelength, l. These glyoxal experi-ments were performed with helium as the buffer gas in order toavoid correcting the H atom signal for fluorescence quenching.
Fig. 2 Typical Stern–Volmer plot for the lr 350 nm region. Data (filled squares)shown are from photolysing B1.1 � 1015 mol cm�3 of glyoxal at 335 nm, 298 K.Also included are 335 nm data (open circles) from Feierabend et al.27 Both sets ofdata have been rescaled to give an intercept of unity, so that the slope/interceptratio is equal to kq/kd.
Table 1 Stern–Volmer parameters obtained from the pressure dependence ofthe HCO quantum yield from glyoxal photolysis over the wavelength range310–335 nm at 298 K. The Stern–Volmer plot returns an intercept and slope,which can be used to assign F0,HCO, and kq/kd via eqn (E1). The total pressurerefers to the pressure at which the absolute quantum yield determination wasmade, and FHCO,p to the quantum yield measured at that pressure. Errors are 1s
l/nmTotal pressure (N2)/molecule cm�3 FHCO,p F0,HCO
1020 (kq/kd)/cm3 mol�1
335 7.05 � 10+18 1.19 � 0.06 1.08 � 0.08 �0.99 � 0.85320 6.89 � 10+18 1.08 � 0.04 1.08 � 0.04 0.45 � 0.73310 7.07 � 10+18 0.71 � 0.03 0.67 � 0.08 �0.3 � 3.1
PCCP Paper
Ope
n A
cces
s A
rtic
le. P
ublis
hed
on 3
1 Ja
nuar
y 20
13. D
ownl
oade
d on
3/1
8/20
22 9
:04:
08 P
M.
Thi
s ar
ticle
is li
cens
ed u
nder
a C
reat
ive
Com
mon
s A
ttrib
utio
n 3.
0 U
npor
ted
Lic
ence
.View Article Online
This journal is c the Owner Societies 2013 Phys. Chem. Chem. Phys., 2013, 15, 4984--4994 4987
Since the photolysis yield is independent of pressure (seeabove) these yields do not depend on the diluents used.
At the longer wavelengths, 308, 316.7 and 339.7 nm, theH atom reference was the photolysis of ketene in the presenceof O2:
CH2CO + hn (308–340 nm) - CH2 + CO (P3)
CH2 + O2 - H + products (R3)
While the photolysis of ketene produces both singlet and tripletCH2, all singlet CH2 is rapidly deactivated to the triplet byO2,34,35 so that all the observed H from reaction R3 is via tripletCH2. The H atom yield from this reaction is known, 0.8 � 0.2.34
The H atom traces at these longer wavelengths for the referencereaction were fitted using eqn (E2b), a modification of (E2a),where the photolytic concentration was set to zero:
½H� ¼ CH2½ �0kH;FkH;F � kH;L
exp �kH;Lt� �
� exp �kH;Ft� �� �
(E2b)
and kH,F and kH,L are the first order rate coefficients for theformation and loss of H, respectively. FH at these longerwavelengths was obtained from eqn (E2b), where the deno-minator also included 0.8 in order to take account of theH atom yield from the reference. The results for all thewavelengths are given in Table 2.
4. Discussion4.1 Pressure dependence of the HCO quantum yield
The most notable feature of the HCO yield data is the absence ofa pressure dependence over the wavelength range 310–355 nm.This observation differs significantly from the observations ofFeierabend et al.,27 who found that quenching persisted down to290 nm. In the companion paper,1 we showed that the pressuredependent quantum yield for HCO formation is given byeqn (E1). This equation differs from that used by Feierabendet al., who reported values of kq/kda (in our notation). This ratiois less directly related to the lifetime of S1* than is ours and wehave rescaled their values by a factor of F0,HCO in order tocompare the two sets of values of kq/kd.
Fig. 2 shows a Stern–Volmer plot at 335 nm from our presentmeasurements and from those Feierabend et al.27 Both sets ofdata have been rescaled to give an intercept of unity, so that the
slope/intercept ratio is equal to kq/kd, thus allowing aclearer comparison of the slopes derived under these condi-tions in the two investigations. It is clear that the two datasetsdiffer and cannot be reconciled via the uncertainty limits. Onedataset or the other is subject to an unrecognised systematicerror.
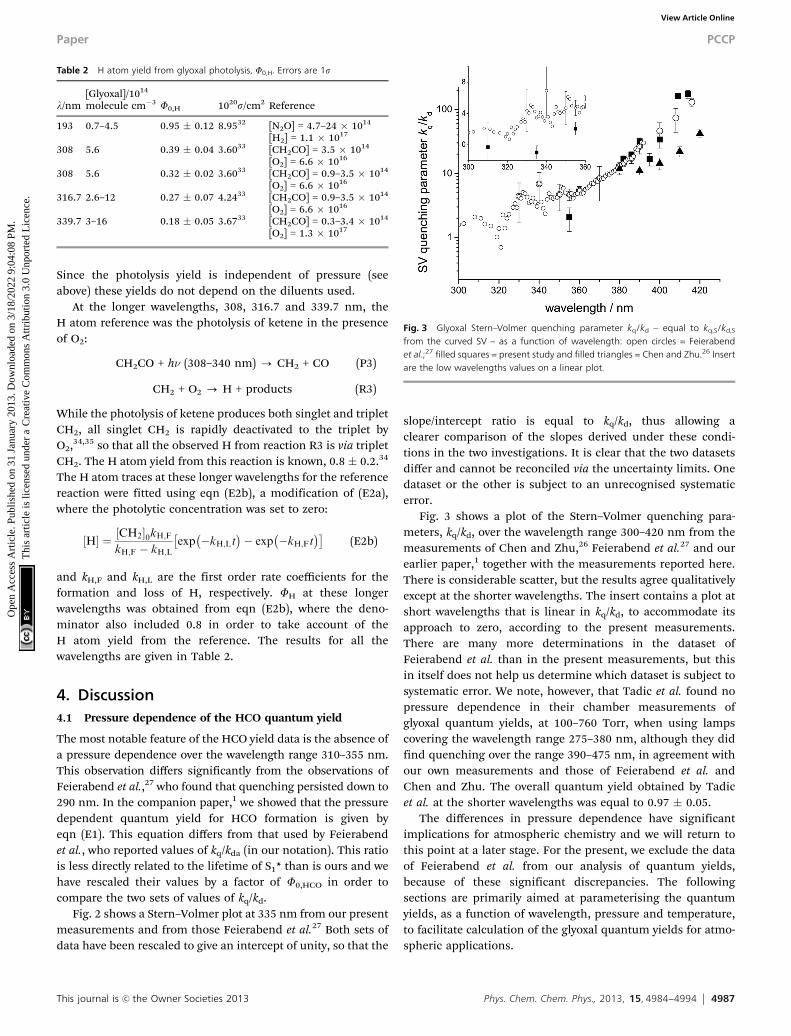
Fig. 3 shows a plot of the Stern–Volmer quenching para-meters, kq/kd, over the wavelength range 300–420 nm from themeasurements of Chen and Zhu,26 Feierabend et al.27 and ourearlier paper,1 together with the measurements reported here.There is considerable scatter, but the results agree qualitativelyexcept at the shorter wavelengths. The insert contains a plot atshort wavelengths that is linear in kq/kd, to accommodate itsapproach to zero, according to the present measurements.There are many more determinations in the dataset ofFeierabend et al. than in the present measurements, but thisin itself does not help us determine which dataset is subject tosystematic error. We note, however, that Tadic et al. found nopressure dependence in their chamber measurements ofglyoxal quantum yields, at 100–760 Torr, when using lampscovering the wavelength range 275–380 nm, although they didfind quenching over the range 390–475 nm, in agreement withour own measurements and those of Feierabend et al. andChen and Zhu. The overall quantum yield obtained by Tadicet al. at the shorter wavelengths was equal to 0.97 � 0.05.
The differences in pressure dependence have significantimplications for atmospheric chemistry and we will return tothis point at a later stage. For the present, we exclude the dataof Feierabend et al. from our analysis of quantum yields,because of these significant discrepancies. The followingsections are primarily aimed at parameterising the quantumyields, as a function of wavelength, pressure and temperature,to facilitate calculation of the glyoxal quantum yields for atmo-spheric applications.
Fig. 3 Glyoxal Stern–Volmer quenching parameter kq/kd – equal to kq,S/kd,S
from the curved SV – as a function of wavelength: open circles = Feierabendet al.;27 filled squares = present study and filled triangles = Chen and Zhu.26 Insertare the low wavelengths values on a linear plot.
Table 2 H atom yield from glyoxal photolysis, F0,H. Errors are 1s
l/nm[Glyoxal]/1014
molecule cm�3 F0,H 1020s/cm2 Reference
193 0.7–4.5 0.95 � 0.12 8.9532 [N2O] = 4.7–24 � 1014
[H2] = 1.1 � 1017
308 5.6 0.39 � 0.04 3.6033 [CH2CO] = 3.5 � 1014
[O2] = 6.6 � 1016
308 5.6 0.32 � 0.02 3.6033 [CH2CO] = 0.9–3.5 � 1014
[O2] = 6.6 � 1016
316.7 2.6–12 0.27 � 0.07 4.2433 [CH2CO] = 0.9–3.5 � 1014
[O2] = 6.6 � 1016
339.7 3–16 0.18 � 0.05 3.6733 [CH2CO] = 0.3–3.4 � 1014
[O2] = 1.3 � 1017
Paper PCCP
Ope
n A
cces
s A
rtic
le. P
ublis
hed
on 3
1 Ja
nuar
y 20
13. D
ownl
oade
d on
3/1
8/20
22 9
:04:
08 P
M.
Thi
s ar
ticle
is li
cens
ed u
nder
a C
reat
ive
Com
mon
s A
ttrib
utio
n 3.
0 U
npor
ted
Lic
ence
.View Article Online
4988 Phys. Chem. Chem. Phys., 2013, 15, 4984--4994 This journal is c the Owner Societies 2013
4.2 Zero pressure product yields
At wavelengthso355 nm, according to our measurements, theyield of products from glyoxal photolysis is independent ofpressure, so that the HCO and H quantum yield measurementsare equal to the zero pressure quantum yields for HCO, F0,HCO,and H, F0,H. At longer wavelengths, where the yields of HCO arepressure dependent, F0,HCO was determined in the previouspaper by extrapolating the linear/non-linear Stern–Volmer plotsto zero pressure.
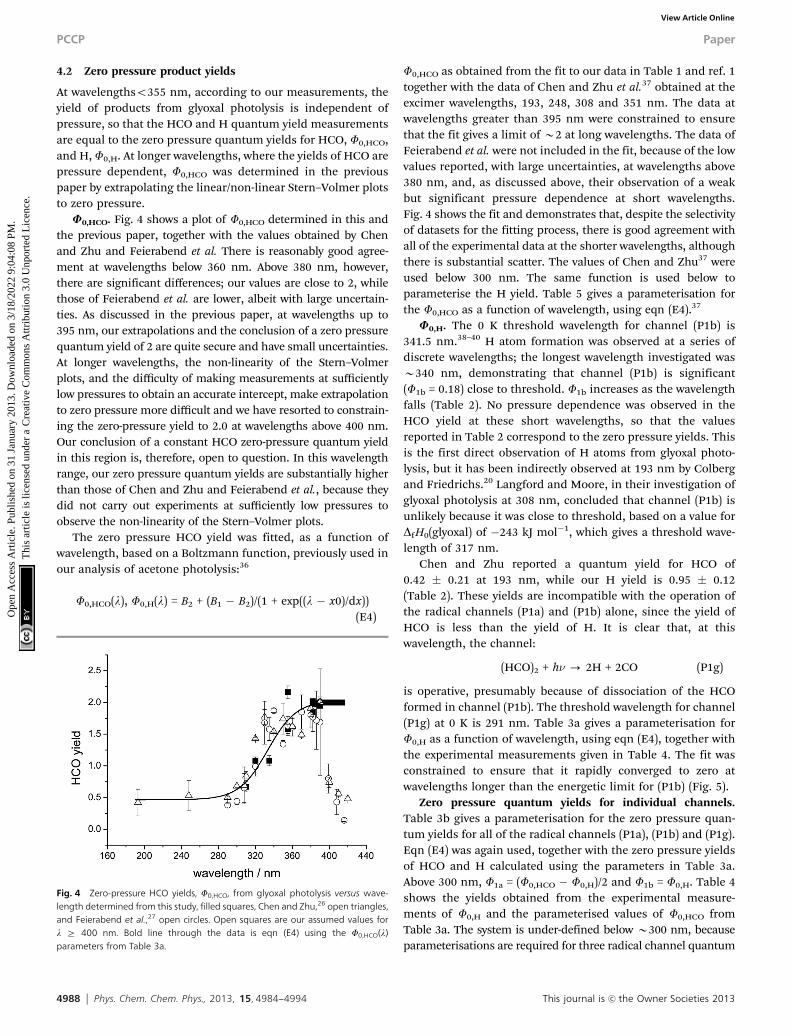
U0,HCO. Fig. 4 shows a plot of F0,HCO determined in this andthe previous paper, together with the values obtained by Chenand Zhu and Feierabend et al. There is reasonably good agree-ment at wavelengths below 360 nm. Above 380 nm, however,there are significant differences; our values are close to 2, whilethose of Feierabend et al. are lower, albeit with large uncertain-ties. As discussed in the previous paper, at wavelengths up to395 nm, our extrapolations and the conclusion of a zero pressurequantum yield of 2 are quite secure and have small uncertainties.At longer wavelengths, the non-linearity of the Stern–Volmerplots, and the difficulty of making measurements at sufficientlylow pressures to obtain an accurate intercept, make extrapolationto zero pressure more difficult and we have resorted to constrain-ing the zero-pressure yield to 2.0 at wavelengths above 400 nm.Our conclusion of a constant HCO zero-pressure quantum yieldin this region is, therefore, open to question. In this wavelengthrange, our zero pressure quantum yields are substantially higherthan those of Chen and Zhu and Feierabend et al., because theydid not carry out experiments at sufficiently low pressures toobserve the non-linearity of the Stern–Volmer plots.
The zero pressure HCO yield was fitted, as a function ofwavelength, based on a Boltzmann function, previously used inour analysis of acetone photolysis:36
F0,HCO(l), F0,H(l) = B2 + (B1 � B2)/(1 + exp((l � x0)/dx))(E4)
F0,HCO as obtained from the fit to our data in Table 1 and ref. 1together with the data of Chen and Zhu et al.37 obtained at theexcimer wavelengths, 193, 248, 308 and 351 nm. The data atwavelengths greater than 395 nm were constrained to ensurethat the fit gives a limit of B2 at long wavelengths. The data ofFeierabend et al. were not included in the fit, because of the lowvalues reported, with large uncertainties, at wavelengths above380 nm, and, as discussed above, their observation of a weakbut significant pressure dependence at short wavelengths.Fig. 4 shows the fit and demonstrates that, despite the selectivityof datasets for the fitting process, there is good agreement withall of the experimental data at the shorter wavelengths, althoughthere is substantial scatter. The values of Chen and Zhu37 wereused below 300 nm. The same function is used below toparameterise the H yield. Table 5 gives a parameterisation forthe F0,HCO as a function of wavelength, using eqn (E4).37
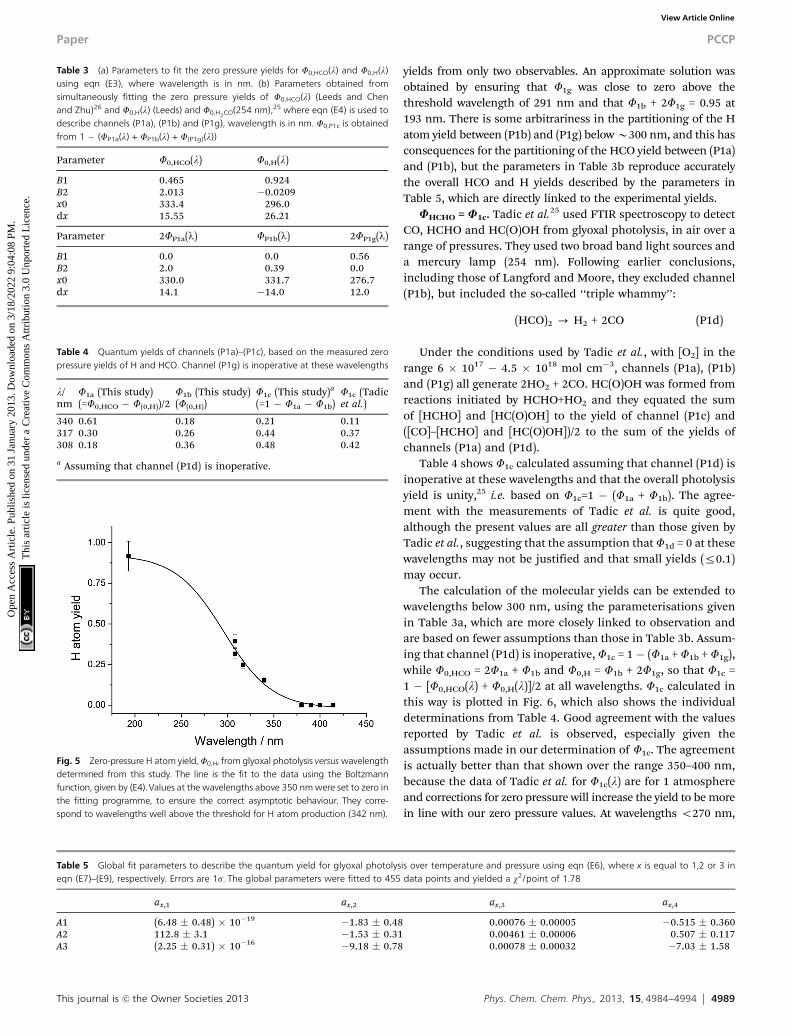
U0,H. The 0 K threshold wavelength for channel (P1b) is341.5 nm.38–40 H atom formation was observed at a series ofdiscrete wavelengths; the longest wavelength investigated wasB340 nm, demonstrating that channel (P1b) is significant(F1b = 0.18) close to threshold. F1b increases as the wavelengthfalls (Table 2). No pressure dependence was observed in theHCO yield at these short wavelengths, so that the valuesreported in Table 2 correspond to the zero pressure yields. Thisis the first direct observation of H atoms from glyoxal photo-lysis, but it has been indirectly observed at 193 nm by Colbergand Friedrichs.20 Langford and Moore, in their investigation ofglyoxal photolysis at 308 nm, concluded that channel (P1b) isunlikely because it was close to threshold, based on a value forDfH0(glyoxal) of �243 kJ mol�1, which gives a threshold wave-length of 317 nm.
Chen and Zhu reported a quantum yield for HCO of0.42 � 0.21 at 193 nm, while our H yield is 0.95 � 0.12(Table 2). These yields are incompatible with the operation ofthe radical channels (P1a) and (P1b) alone, since the yield ofHCO is less than the yield of H. It is clear that, at thiswavelength, the channel:
(HCO)2 + hn - 2H + 2CO (P1g)
is operative, presumably because of dissociation of the HCOformed in channel (P1b). The threshold wavelength for channel(P1g) at 0 K is 291 nm. Table 3a gives a parameterisation forF0,H as a function of wavelength, using eqn (E4), together withthe experimental measurements given in Table 4. The fit wasconstrained to ensure that it rapidly converged to zero atwavelengths longer than the energetic limit for (P1b) (Fig. 5).
Zero pressure quantum yields for individual channels.Table 3b gives a parameterisation for the zero pressure quan-tum yields for all of the radical channels (P1a), (P1b) and (P1g).Eqn (E4) was again used, together with the zero pressure yieldsof HCO and H calculated using the parameters in Table 3a.Above 300 nm, F1a = (F0,HCO � F0,H)/2 and F1b = F0,H. Table 4shows the yields obtained from the experimental measure-ments of F0,H and the parameterised values of F0,HCO fromTable 3a. The system is under-defined below B300 nm, becauseparameterisations are required for three radical channel quantum
Fig. 4 Zero-pressure HCO yields, F0,HCO, from glyoxal photolysis versus wave-length determined from this study, filled squares, Chen and Zhu,26 open triangles,and Feierabend et al.,27 open circles. Open squares are our assumed values forl Z 400 nm. Bold line through the data is eqn (E4) using the F0,HCO(l)parameters from Table 3a.
PCCP Paper
Ope
n A
cces
s A
rtic
le. P
ublis
hed
on 3
1 Ja
nuar
y 20
13. D
ownl
oade
d on
3/1
8/20
22 9
:04:
08 P
M.
Thi
s ar
ticle
is li
cens
ed u
nder
a C
reat
ive
Com
mon
s A
ttrib
utio
n 3.
0 U
npor
ted
Lic
ence
.View Article Online
This journal is c the Owner Societies 2013 Phys. Chem. Chem. Phys., 2013, 15, 4984--4994 4989
yields from only two observables. An approximate solution wasobtained by ensuring that F1g was close to zero above thethreshold wavelength of 291 nm and that F1b + 2F1g = 0.95 at193 nm. There is some arbitrariness in the partitioning of the Hatom yield between (P1b) and (P1g) below B300 nm, and this hasconsequences for the partitioning of the HCO yield between (P1a)and (P1b), but the parameters in Table 3b reproduce accuratelythe overall HCO and H yields described by the parameters inTable 5, which are directly linked to the experimental yields.
UHCHO = U1c. Tadic et al.25 used FTIR spectroscopy to detectCO, HCHO and HC(O)OH from glyoxal photolysis, in air over arange of pressures. They used two broad band light sources anda mercury lamp (254 nm). Following earlier conclusions,including those of Langford and Moore, they excluded channel(P1b), but included the so-called ‘‘triple whammy’’:
(HCO)2 - H2 + 2CO (P1d)
Under the conditions used by Tadic et al., with [O2] in therange 6 � 1017 � 4.5 � 1018 mol cm�3, channels (P1a), (P1b)and (P1g) all generate 2HO2 + 2CO. HC(O)OH was formed fromreactions initiated by HCHO+HO2 and they equated the sumof [HCHO] and [HC(O)OH] to the yield of channel (P1c) and([CO]–[HCHO] and [HC(O)OH])/2 to the sum of the yields ofchannels (P1a) and (P1d).
Table 4 shows F1c calculated assuming that channel (P1d) isinoperative at these wavelengths and that the overall photolysisyield is unity,25 i.e. based on F1c=1 � (F1a + F1b). The agree-ment with the measurements of Tadic et al. is quite good,although the present values are all greater than those given byTadic et al., suggesting that the assumption that F1d = 0 at thesewavelengths may not be justified and that small yields (r0.1)may occur.
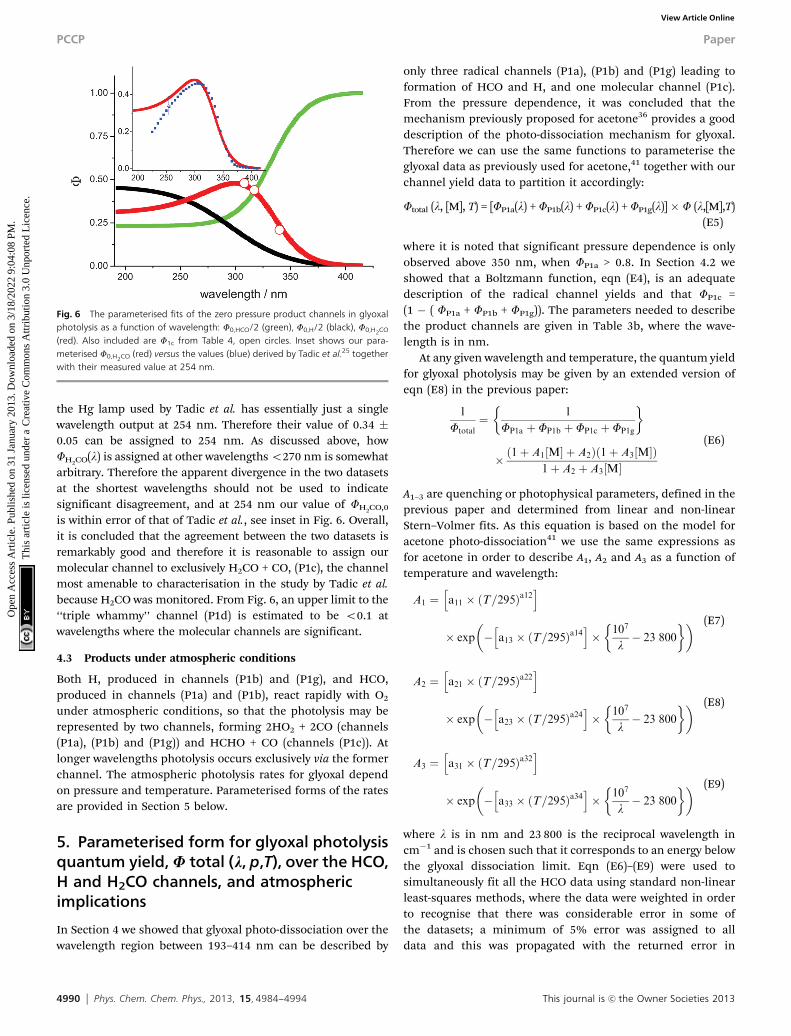
The calculation of the molecular yields can be extended towavelengths below 300 nm, using the parameterisations givenin Table 3a, which are more closely linked to observation andare based on fewer assumptions than those in Table 3b. Assum-ing that channel (P1d) is inoperative, F1c = 1� (F1a + F1b + F1g),while F0,HCO = 2F1a + F1b and F0,H = F1b + 2F1g, so that F1c =1 � [F0,HCO(l) + F0,H(l)]/2 at all wavelengths. F1c calculated inthis way is plotted in Fig. 6, which also shows the individualdeterminations from Table 4. Good agreement with the valuesreported by Tadic et al. is observed, especially given theassumptions made in our determination of F1c. The agreementis actually better than that shown over the range 350–400 nm,because the data of Tadic et al. for F1c(l) are for 1 atmosphereand corrections for zero pressure will increase the yield to be morein line with our zero pressure values. At wavelengths o270 nm,
Table 3 (a) Parameters to fit the zero pressure yields for F0,HCO(l) and F0,H(l)using eqn (E3), where wavelength is in nm. (b) Parameters obtained fromsimultaneously fitting the zero pressure yields of F0,HCO(l) (Leeds and Chenand Zhu)26 and F0,H(l) (Leeds) and F0,H2CO(254 nm),25 where eqn (E4) is used todescribe channels (P1a), (P1b) and (P1g), wavelength is in nm. F0,P1c is obtainedfrom 1 � (FP1a(l) + FP1b(l) + F(P1g)(l))
Parameter F0,HCO(l) F0,H(l)
B1 0.465 0.924B2 2.013 �0.0209x0 333.4 296.0dx 15.55 26.21
Parameter 2FP1a(l) FP1b(l) 2FP1g(l)
B1 0.0 0.0 0.56B2 2.0 0.39 0.0x0 330.0 331.7 276.7dx 14.1 �14.0 12.0
Fig. 5 Zero-pressure H atom yield, F0,H, from glyoxal photolysis versus wavelengthdetermined from this study. The line is the fit to the data using the Boltzmannfunction, given by (E4). Values at the wavelengths above 350 nm were set to zero inthe fitting programme, to ensure the correct asymptotic behaviour. They corre-spond to wavelengths well above the threshold for H atom production (342 nm).
Table 4 Quantum yields of channels (P1a)–(P1c), based on the measured zeropressure yields of H and HCO. Channel (P1g) is inoperative at these wavelengths
l/nm
F1a (This study)(=F0,HCO � F(0,H))/2
F1b (This study)(F(0,H))
F1c (This study)a
(=1 � F1a � F1b)F1c (Tadicet al.)
340 0.61 0.18 0.21 0.11317 0.30 0.26 0.44 0.37308 0.18 0.36 0.48 0.42
a Assuming that channel (P1d) is inoperative.
Table 5 Global fit parameters to describe the quantum yield for glyoxal photolysis over temperature and pressure using eqn (E6), where x is equal to 1,2 or 3 ineqn (E7)–(E9), respectively. Errors are 1s. The global parameters were fitted to 455 data points and yielded a w2/point of 1.78
ax,1 ax,2 ax,3 ax,4
A1 (6.48 � 0.48) � 10�19 �1.83 � 0.48 0.00076 � 0.00005 �0.515 � 0.360A2 112.8 � 3.1 �1.53 � 0.31 0.00461 � 0.00006 0.507 � 0.117A3 (2.25 � 0.31) � 10�16 �9.18 � 0.78 0.00078 � 0.00032 �7.03 � 1.58
Paper PCCP
Ope
n A
cces
s A
rtic
le. P
ublis
hed
on 3
1 Ja
nuar
y 20
13. D
ownl
oade
d on
3/1
8/20
22 9
:04:
08 P
M.
Thi
s ar
ticle
is li
cens
ed u
nder
a C
reat
ive
Com
mon
s A
ttrib
utio
n 3.
0 U
npor
ted
Lic
ence
.View Article Online
4990 Phys. Chem. Chem. Phys., 2013, 15, 4984--4994 This journal is c the Owner Societies 2013
the Hg lamp used by Tadic et al. has essentially just a singlewavelength output at 254 nm. Therefore their value of 0.34 �0.05 can be assigned to 254 nm. As discussed above, howFH2CO(l) is assigned at other wavelengths o270 nm is somewhatarbitrary. Therefore the apparent divergence in the two datasetsat the shortest wavelengths should not be used to indicatesignificant disagreement, and at 254 nm our value of FH2CO,0
is within error of that of Tadic et al., see inset in Fig. 6. Overall,it is concluded that the agreement between the two datasets isremarkably good and therefore it is reasonable to assign ourmolecular channel to exclusively H2CO + CO, (P1c), the channelmost amenable to characterisation in the study by Tadic et al.because H2CO was monitored. From Fig. 6, an upper limit to the‘‘triple whammy’’ channel (P1d) is estimated to be o0.1 atwavelengths where the molecular channels are significant.
4.3 Products under atmospheric conditions
Both H, produced in channels (P1b) and (P1g), and HCO,produced in channels (P1a) and (P1b), react rapidly with O2
under atmospheric conditions, so that the photolysis may berepresented by two channels, forming 2HO2 + 2CO (channels(P1a), (P1b) and (P1g)) and HCHO + CO (channels (P1c)). Atlonger wavelengths photolysis occurs exclusively via the formerchannel. The atmospheric photolysis rates for glyoxal dependon pressure and temperature. Parameterised forms of the ratesare provided in Section 5 below.
5. Parameterised form for glyoxal photolysisquantum yield, U total (k, p,T), over the HCO,H and H2CO channels, and atmosphericimplications
In Section 4 we showed that glyoxal photo-dissociation over thewavelength region between 193–414 nm can be described by
only three radical channels (P1a), (P1b) and (P1g) leading toformation of HCO and H, and one molecular channel (P1c).From the pressure dependence, it was concluded that themechanism previously proposed for acetone36 provides a gooddescription of the photo-dissociation mechanism for glyoxal.Therefore we can use the same functions to parameterise theglyoxal data as previously used for acetone,41 together with ourchannel yield data to partition it accordingly:
Ftotal (l, [M], T) = [FP1a(l) + FP1b(l) + FP1c(l) + FP1g(l)]� F (l,[M],T)(E5)
where it is noted that significant pressure dependence is onlyobserved above 350 nm, when FP1a > 0.8. In Section 4.2 weshowed that a Boltzmann function, eqn (E4), is an adequatedescription of the radical channel yields and that FP1c =(1 � ( FP1a + FP1b + FP1g)). The parameters needed to describethe product channels are given in Table 3b, where the wave-length is in nm.
At any given wavelength and temperature, the quantum yieldfor glyoxal photolysis may be given by an extended version ofeqn (E8) in the previous paper:
1
Ftotal¼ 1
FP1a þ FP1b þ FP1c þ FP1g
�
� ð1þ A1½M� þ A2Þð1þ A3½M�Þ1þ A2 þ A3½M�
(E6)
A1–3 are quenching or photophysical parameters, defined in theprevious paper and determined from linear and non-linearStern–Volmer fits. As this equation is based on the model foracetone photo-dissociation41 we use the same expressions asfor acetone in order to describe A1, A2 and A3 as a function oftemperature and wavelength:
A1 ¼ a11 � ðT=295Þa12h i
� exp � a13 � ðT=295Þa14h i
� 107
l� 23 800
� � (E7)
A2 ¼ a21 � ðT=295Þa22h i
� exp � a23 � ðT=295Þa24h i
� 107
l� 23 800
� � (E8)
A3 ¼ a31 � ðT=295Þa32h i
� exp � a33 � ðT=295Þa34h i
� 107
l� 23 800
� � (E9)
where l is in nm and 23 800 is the reciprocal wavelength incm�1 and is chosen such that it corresponds to an energy belowthe glyoxal dissociation limit. Eqn (E6)–(E9) were used tosimultaneously fit all the HCO data using standard non-linearleast-squares methods, where the data were weighted in orderto recognise that there was considerable error in some ofthe datasets; a minimum of 5% error was assigned to alldata and this was propagated with the returned error in
Fig. 6 The parameterised fits of the zero pressure product channels in glyoxalphotolysis as a function of wavelength: F0,HCO/2 (green), F0,H/2 (black), F0,H2CO
(red). Also included are F1c from Table 4, open circles. Inset shows our para-meterised F0,H2CO (red) versus the values (blue) derived by Tadic et al.25 togetherwith their measured value at 254 nm.
PCCP Paper
Ope
n A
cces
s A
rtic
le. P
ublis
hed
on 3
1 Ja
nuar
y 20
13. D
ownl
oade
d on
3/1
8/20
22 9
:04:
08 P
M.
Thi
s ar
ticle
is li
cens
ed u
nder
a C
reat
ive
Com
mon
s A
ttrib
utio
n 3.
0 U
npor
ted
Lic
ence
.View Article Online
This journal is c the Owner Societies 2013 Phys. Chem. Chem. Phys., 2013, 15, 4984--4994 4991
[HCO]0 from eqn (E1); fitting yielded a w2/point of 1.78. Theglobal fit parameters are given in Table 5.
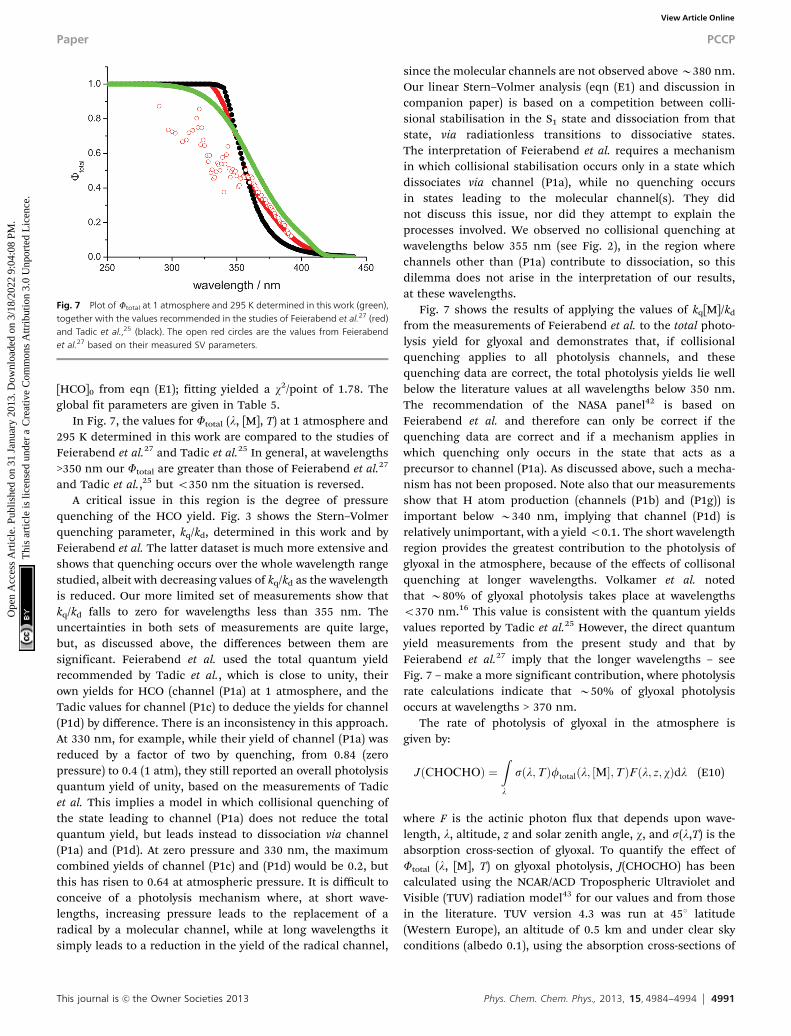
In Fig. 7, the values for Ftotal (l, [M], T) at 1 atmosphere and295 K determined in this work are compared to the studies ofFeierabend et al.27 and Tadic et al.25 In general, at wavelengths>350 nm our Ftotal are greater than those of Feierabend et al.27
and Tadic et al.,25 but o350 nm the situation is reversed.A critical issue in this region is the degree of pressure
quenching of the HCO yield. Fig. 3 shows the Stern–Volmerquenching parameter, kq/kd, determined in this work and byFeierabend et al. The latter dataset is much more extensive andshows that quenching occurs over the whole wavelength rangestudied, albeit with decreasing values of kq/kd as the wavelengthis reduced. Our more limited set of measurements show thatkq/kd falls to zero for wavelengths less than 355 nm. Theuncertainties in both sets of measurements are quite large,but, as discussed above, the differences between them aresignificant. Feierabend et al. used the total quantum yieldrecommended by Tadic et al., which is close to unity, theirown yields for HCO (channel (P1a) at 1 atmosphere, and theTadic values for channel (P1c) to deduce the yields for channel(P1d) by difference. There is an inconsistency in this approach.At 330 nm, for example, while their yield of channel (P1a) wasreduced by a factor of two by quenching, from 0.84 (zeropressure) to 0.4 (1 atm), they still reported an overall photolysisquantum yield of unity, based on the measurements of Tadicet al. This implies a model in which collisional quenching ofthe state leading to channel (P1a) does not reduce the totalquantum yield, but leads instead to dissociation via channel(P1a) and (P1d). At zero pressure and 330 nm, the maximumcombined yields of channel (P1c) and (P1d) would be 0.2, butthis has risen to 0.64 at atmospheric pressure. It is difficult toconceive of a photolysis mechanism where, at short wave-lengths, increasing pressure leads to the replacement of aradical by a molecular channel, while at long wavelengths itsimply leads to a reduction in the yield of the radical channel,
since the molecular channels are not observed above B380 nm.Our linear Stern–Volmer analysis (eqn (E1) and discussion incompanion paper) is based on a competition between colli-sional stabilisation in the S1 state and dissociation from thatstate, via radiationless transitions to dissociative states.The interpretation of Feierabend et al. requires a mechanismin which collisional stabilisation occurs only in a state whichdissociates via channel (P1a), while no quenching occursin states leading to the molecular channel(s). They didnot discuss this issue, nor did they attempt to explain theprocesses involved. We observed no collisional quenching atwavelengths below 355 nm (see Fig. 2), in the region wherechannels other than (P1a) contribute to dissociation, so thisdilemma does not arise in the interpretation of our results,at these wavelengths.
Fig. 7 shows the results of applying the values of kq[M]/kd
from the measurements of Feierabend et al. to the total photo-lysis yield for glyoxal and demonstrates that, if collisionalquenching applies to all photolysis channels, and thesequenching data are correct, the total photolysis yields lie wellbelow the literature values at all wavelengths below 350 nm.The recommendation of the NASA panel42 is based onFeierabend et al. and therefore can only be correct if thequenching data are correct and if a mechanism applies inwhich quenching only occurs in the state that acts as aprecursor to channel (P1a). As discussed above, such a mecha-nism has not been proposed. Note also that our measurementsshow that H atom production (channels (P1b) and (P1g)) isimportant below B340 nm, implying that channel (P1d) isrelatively unimportant, with a yield o0.1. The short wavelengthregion provides the greatest contribution to the photolysis ofglyoxal in the atmosphere, because of the effects of collisonalquenching at longer wavelengths. Volkamer et al. notedthat B80% of glyoxal photolysis takes place at wavelengthso370 nm.16 This value is consistent with the quantum yieldsvalues reported by Tadic et al.25 However, the direct quantumyield measurements from the present study and that byFeierabend et al.27 imply that the longer wavelengths – seeFig. 7 – make a more significant contribution, where photolysisrate calculations indicate that B50% of glyoxal photolysisoccurs at wavelengths > 370 nm.
The rate of photolysis of glyoxal in the atmosphere isgiven by:
JðCHOCHOÞ ¼Zl
sðl;TÞftotalðl; ½M�;TÞFðl; z; wÞdl (E10)
where F is the actinic photon flux that depends upon wave-length, l, altitude, z and solar zenith angle, w, and s(l,T) is theabsorption cross-section of glyoxal. To quantify the effect ofFtotal (l, [M], T) on glyoxal photolysis, J(CHOCHO) has beencalculated using the NCAR/ACD Tropospheric Ultraviolet andVisible (TUV) radiation model43 for our values and from thosein the literature. TUV version 4.3 was run at 451 latitude(Western Europe), an altitude of 0.5 km and under clear skyconditions (albedo 0.1), using the absorption cross-sections of
Fig. 7 Plot of Ftotal at 1 atmosphere and 295 K determined in this work (green),together with the values recommended in the studies of Feierabend et al.27 (red)and Tadic et al.,25 (black). The open red circles are the values from Feierabendet al.27 based on their measured SV parameters.
Paper PCCP
Ope
n A
cces
s A
rtic
le. P
ublis
hed
on 3
1 Ja
nuar
y 20
13. D
ownl
oade
d on
3/1
8/20
22 9
:04:
08 P
M.
Thi
s ar
ticle
is li
cens
ed u
nder
a C
reat
ive
Com
mon
s A
ttrib
utio
n 3.
0 U
npor
ted
Lic
ence
.View Article Online
4992 Phys. Chem. Chem. Phys., 2013, 15, 4984--4994 This journal is c the Owner Societies 2013
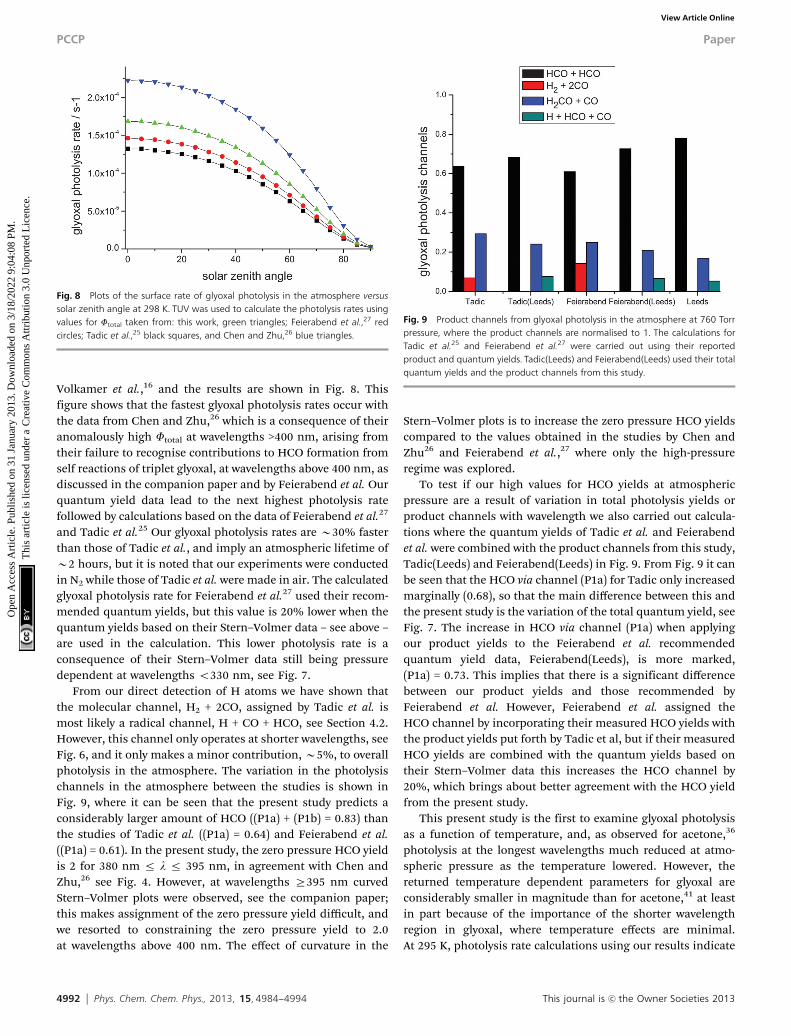
Volkamer et al.,16 and the results are shown in Fig. 8. Thisfigure shows that the fastest glyoxal photolysis rates occur withthe data from Chen and Zhu,26 which is a consequence of theiranomalously high Ftotal at wavelengths >400 nm, arising fromtheir failure to recognise contributions to HCO formation fromself reactions of triplet glyoxal, at wavelengths above 400 nm, asdiscussed in the companion paper and by Feierabend et al. Ourquantum yield data lead to the next highest photolysis ratefollowed by calculations based on the data of Feierabend et al.27
and Tadic et al.25 Our glyoxal photolysis rates are B30% fasterthan those of Tadic et al., and imply an atmospheric lifetime ofB2 hours, but it is noted that our experiments were conductedin N2 while those of Tadic et al. were made in air. The calculatedglyoxal photolysis rate for Feierabend et al.27 used their recom-mended quantum yields, but this value is 20% lower when thequantum yields based on their Stern–Volmer data – see above –are used in the calculation. This lower photolysis rate is aconsequence of their Stern–Volmer data still being pressuredependent at wavelengths o330 nm, see Fig. 7.
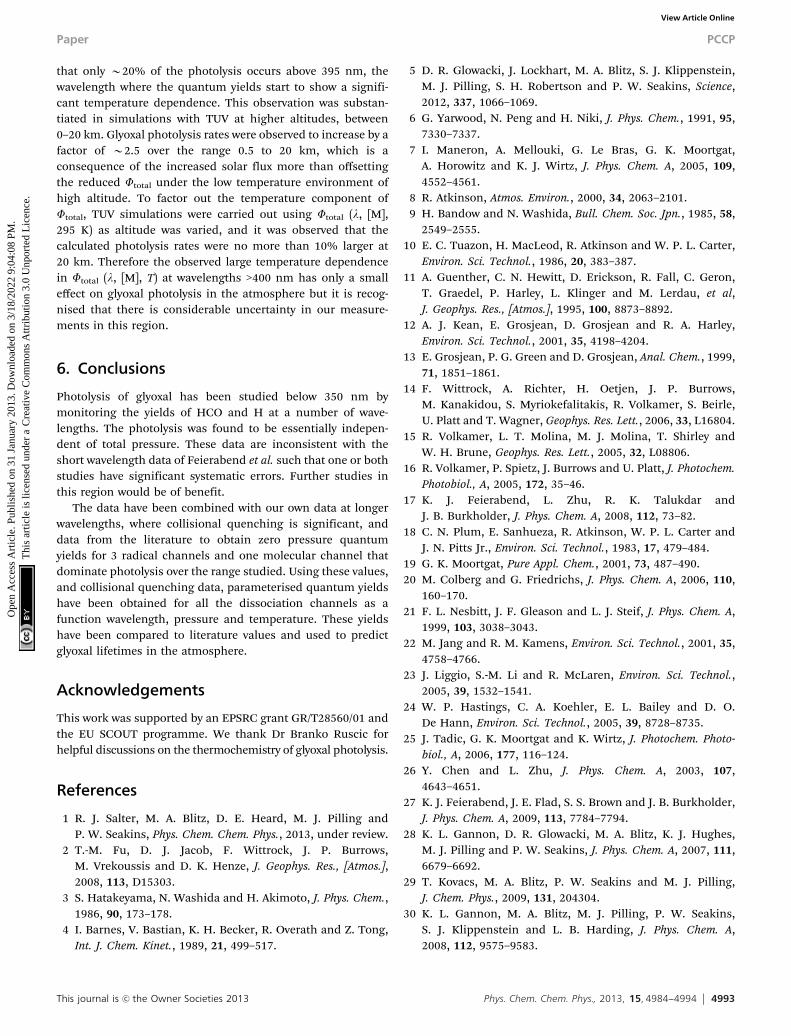
From our direct detection of H atoms we have shown thatthe molecular channel, H2 + 2CO, assigned by Tadic et al. ismost likely a radical channel, H + CO + HCO, see Section 4.2.However, this channel only operates at shorter wavelengths, seeFig. 6, and it only makes a minor contribution, B5%, to overallphotolysis in the atmosphere. The variation in the photolysischannels in the atmosphere between the studies is shown inFig. 9, where it can be seen that the present study predicts aconsiderably larger amount of HCO ((P1a) + (P1b) = 0.83) thanthe studies of Tadic et al. ((P1a) = 0.64) and Feierabend et al.((P1a) = 0.61). In the present study, the zero pressure HCO yieldis 2 for 380 nm r l r 395 nm, in agreement with Chen andZhu,26 see Fig. 4. However, at wavelengths Z395 nm curvedStern–Volmer plots were observed, see the companion paper;this makes assignment of the zero pressure yield difficult, andwe resorted to constraining the zero pressure yield to 2.0at wavelengths above 400 nm. The effect of curvature in the
Stern–Volmer plots is to increase the zero pressure HCO yieldscompared to the values obtained in the studies by Chen andZhu26 and Feierabend et al.,27 where only the high-pressureregime was explored.
To test if our high values for HCO yields at atmosphericpressure are a result of variation in total photolysis yields orproduct channels with wavelength we also carried out calcula-tions where the quantum yields of Tadic et al. and Feierabendet al. were combined with the product channels from this study,Tadic(Leeds) and Feierabend(Leeds) in Fig. 9. From Fig. 9 it canbe seen that the HCO via channel (P1a) for Tadic only increasedmarginally (0.68), so that the main difference between this andthe present study is the variation of the total quantum yield, seeFig. 7. The increase in HCO via channel (P1a) when applyingour product yields to the Feierabend et al. recommendedquantum yield data, Feierabend(Leeds), is more marked,(P1a) = 0.73. This implies that there is a significant differencebetween our product yields and those recommended byFeierabend et al. However, Feierabend et al. assigned theHCO channel by incorporating their measured HCO yields withthe product yields put forth by Tadic et al, but if their measuredHCO yields are combined with the quantum yields based ontheir Stern–Volmer data this increases the HCO channel by20%, which brings about better agreement with the HCO yieldfrom the present study.
This present study is the first to examine glyoxal photolysisas a function of temperature, and, as observed for acetone,36
photolysis at the longest wavelengths much reduced at atmo-spheric pressure as the temperature lowered. However, thereturned temperature dependent parameters for glyoxal areconsiderably smaller in magnitude than for acetone,41 at leastin part because of the importance of the shorter wavelengthregion in glyoxal, where temperature effects are minimal.At 295 K, photolysis rate calculations using our results indicate
Fig. 8 Plots of the surface rate of glyoxal photolysis in the atmosphere versussolar zenith angle at 298 K. TUV was used to calculate the photolysis rates usingvalues for Ftotal taken from: this work, green triangles; Feierabend et al.,27 redcircles; Tadic et al.,25 black squares, and Chen and Zhu,26 blue triangles.
Fig. 9 Product channels from glyoxal photolysis in the atmosphere at 760 Torrpressure, where the product channels are normalised to 1. The calculations forTadic et al.25 and Feierabend et al.27 were carried out using their reportedproduct and quantum yields. Tadic(Leeds) and Feierabend(Leeds) used their totalquantum yields and the product channels from this study.
PCCP Paper
Ope
n A
cces
s A
rtic
le. P
ublis
hed
on 3
1 Ja
nuar
y 20
13. D
ownl
oade
d on
3/1
8/20
22 9
:04:
08 P
M.
Thi
s ar
ticle
is li
cens
ed u
nder
a C
reat
ive
Com
mon
s A
ttrib
utio
n 3.
0 U
npor
ted
Lic
ence
.View Article Online
This journal is c the Owner Societies 2013 Phys. Chem. Chem. Phys., 2013, 15, 4984--4994 4993
that only B20% of the photolysis occurs above 395 nm, thewavelength where the quantum yields start to show a signifi-cant temperature dependence. This observation was substan-tiated in simulations with TUV at higher altitudes, between0–20 km. Glyoxal photolysis rates were observed to increase by afactor of B2.5 over the range 0.5 to 20 km, which is aconsequence of the increased solar flux more than offsettingthe reduced Ftotal under the low temperature environment ofhigh altitude. To factor out the temperature component ofFtotal, TUV simulations were carried out using Ftotal (l, [M],295 K) as altitude was varied, and it was observed that thecalculated photolysis rates were no more than 10% larger at20 km. Therefore the observed large temperature dependencein Ftotal (l, [M], T) at wavelengths >400 nm has only a smalleffect on glyoxal photolysis in the atmosphere but it is recog-nised that there is considerable uncertainty in our measure-ments in this region.
6. Conclusions
Photolysis of glyoxal has been studied below 350 nm bymonitoring the yields of HCO and H at a number of wave-lengths. The photolysis was found to be essentially indepen-dent of total pressure. These data are inconsistent with theshort wavelength data of Feierabend et al. such that one or bothstudies have significant systematic errors. Further studies inthis region would be of benefit.
The data have been combined with our own data at longerwavelengths, where collisional quenching is significant, anddata from the literature to obtain zero pressure quantumyields for 3 radical channels and one molecular channel thatdominate photolysis over the range studied. Using these values,and collisional quenching data, parameterised quantum yieldshave been obtained for all the dissociation channels as afunction wavelength, pressure and temperature. These yieldshave been compared to literature values and used to predictglyoxal lifetimes in the atmosphere.
Acknowledgements
This work was supported by an EPSRC grant GR/T28560/01 andthe EU SCOUT programme. We thank Dr Branko Ruscic forhelpful discussions on the thermochemistry of glyoxal photolysis.
References
1 R. J. Salter, M. A. Blitz, D. E. Heard, M. J. Pilling andP. W. Seakins, Phys. Chem. Chem. Phys., 2013, under review.
2 T.-M. Fu, D. J. Jacob, F. Wittrock, J. P. Burrows,M. Vrekoussis and D. K. Henze, J. Geophys. Res., [Atmos.],2008, 113, D15303.
3 S. Hatakeyama, N. Washida and H. Akimoto, J. Phys. Chem.,1986, 90, 173–178.
4 I. Barnes, V. Bastian, K. H. Becker, R. Overath and Z. Tong,Int. J. Chem. Kinet., 1989, 21, 499–517.
5 D. R. Glowacki, J. Lockhart, M. A. Blitz, S. J. Klippenstein,M. J. Pilling, S. H. Robertson and P. W. Seakins, Science,2012, 337, 1066–1069.
6 G. Yarwood, N. Peng and H. Niki, J. Phys. Chem., 1991, 95,7330–7337.
7 I. Maneron, A. Mellouki, G. Le Bras, G. K. Moortgat,A. Horowitz and K. J. Wirtz, J. Phys. Chem. A, 2005, 109,4552–4561.
8 R. Atkinson, Atmos. Environ., 2000, 34, 2063–2101.9 H. Bandow and N. Washida, Bull. Chem. Soc. Jpn., 1985, 58,
2549–2555.10 E. C. Tuazon, H. MacLeod, R. Atkinson and W. P. L. Carter,
Environ. Sci. Technol., 1986, 20, 383–387.11 A. Guenther, C. N. Hewitt, D. Erickson, R. Fall, C. Geron,
T. Graedel, P. Harley, L. Klinger and M. Lerdau, et al,J. Geophys. Res., [Atmos.], 1995, 100, 8873–8892.
12 A. J. Kean, E. Grosjean, D. Grosjean and R. A. Harley,Environ. Sci. Technol., 2001, 35, 4198–4204.
13 E. Grosjean, P. G. Green and D. Grosjean, Anal. Chem., 1999,71, 1851–1861.
14 F. Wittrock, A. Richter, H. Oetjen, J. P. Burrows,M. Kanakidou, S. Myriokefalitakis, R. Volkamer, S. Beirle,U. Platt and T. Wagner, Geophys. Res. Lett., 2006, 33, L16804.
15 R. Volkamer, L. T. Molina, M. J. Molina, T. Shirley andW. H. Brune, Geophys. Res. Lett., 2005, 32, L08806.
16 R. Volkamer, P. Spietz, J. Burrows and U. Platt, J. Photochem.Photobiol., A, 2005, 172, 35–46.
17 K. J. Feierabend, L. Zhu, R. K. Talukdar andJ. B. Burkholder, J. Phys. Chem. A, 2008, 112, 73–82.
18 C. N. Plum, E. Sanhueza, R. Atkinson, W. P. L. Carter andJ. N. Pitts Jr., Environ. Sci. Technol., 1983, 17, 479–484.
19 G. K. Moortgat, Pure Appl. Chem., 2001, 73, 487–490.20 M. Colberg and G. Friedrichs, J. Phys. Chem. A, 2006, 110,
160–170.21 F. L. Nesbitt, J. F. Gleason and L. J. Steif, J. Phys. Chem. A,
1999, 103, 3038–3043.22 M. Jang and R. M. Kamens, Environ. Sci. Technol., 2001, 35,
4758–4766.23 J. Liggio, S.-M. Li and R. McLaren, Environ. Sci. Technol.,
2005, 39, 1532–1541.24 W. P. Hastings, C. A. Koehler, E. L. Bailey and D. O.
De Hann, Environ. Sci. Technol., 2005, 39, 8728–8735.25 J. Tadic, G. K. Moortgat and K. Wirtz, J. Photochem. Photo-
biol., A, 2006, 177, 116–124.26 Y. Chen and L. Zhu, J. Phys. Chem. A, 2003, 107,
4643–4651.27 K. J. Feierabend, J. E. Flad, S. S. Brown and J. B. Burkholder,
J. Phys. Chem. A, 2009, 113, 7784–7794.28 K. L. Gannon, D. R. Glowacki, M. A. Blitz, K. J. Hughes,
M. J. Pilling and P. W. Seakins, J. Phys. Chem. A, 2007, 111,6679–6692.
29 T. Kovacs, M. A. Blitz, P. W. Seakins and M. J. Pilling,J. Chem. Phys., 2009, 131, 204304.
30 K. L. Gannon, M. A. Blitz, M. J. Pilling, P. W. Seakins,S. J. Klippenstein and L. B. Harding, J. Phys. Chem. A,2008, 112, 9575–9583.
Paper PCCP
Ope
n A
cces
s A
rtic
le. P
ublis
hed
on 3
1 Ja
nuar
y 20
13. D
ownl
oade
d on
3/1
8/20
22 9
:04:
08 P
M.
Thi
s ar
ticle
is li
cens
ed u
nder
a C
reat
ive
Com
mon
s A
ttrib
utio
n 3.
0 U
npor
ted
Lic
ence
.View Article Online
4994 Phys. Chem. Chem. Phys., 2013, 15, 4984--4994 This journal is c the Owner Societies 2013
31 Y. Matsumi, Y. Inagaki and M. Kawasaki, J. Phys. Chem.,1994, 98, 3777–3781.
32 G. Selwyn, J. Podolske and H. S. Johnston, Geophys. Res.Lett., 1977, 4, 427–430.
33 A. H. Laufer and R. A. Keller, J. Am. Chem. Soc., 1971, 93, 61–63.34 M. A. Blitz, K. W. McKee, M. J. Pilling and P. W. Seakins,
Chem. Phys. Lett., 2003, 372, 295–299.35 M. A. Blitz, C. Kappler, M. J. Pilling and P. W. Seakins,
Z. Phys. Chem., 2011, 225, 957–967.36 M. A. Blitz, D. E. Heard and M. J. Pilling, J. Phys. Chem. A,
2006, 110, 6742–6756.37 L. Zhu, D. Kellis and C.-F. Ding, Chem. Phys. Lett., 1996, 257,
487–491.38 O. Dorofeeva, V. P. Novikov and D. B. Neumann, J. Phys.
Chem. Ref. Data, 2001, 30, 475–513.
39 R. A. Fletcher and G. Pilcher, Trans. Faraday Soc., 1970, 66,794–799.
40 B. Ruscic, personal communication, 2009.41 M. A. Blitz, D. E. Heard, M. J. Pilling, S. R. Arnold and
M. P. Chipperfield, Geophys. Res. Lett., 2004, 31,L06111.
42 S. P. Sander, J. Abbatt, J. R. Barker, J. B. Burkholder,R. R. Friedl, D. M. Golden, R. E. Huie, C. E. Kolb,M. J. Kurylo, G. K. Moortgat, V. L. Orkin and P. H. Wine,Chemical Kinetics and Photochemical Data for Use in Atmo-spheric Studies, Evaluation No. 17, JPL Publication 10-6,Jet Propulsion Laboratory, Pasadena, 2011.
43 S. Madronich and S. Flocke, The role of solar radiationin atmospheric chemistry, in Handbook of EnvironmentalChemistry, ed. P. Boule, Springer-Verlag, Heidelberg, 1999.
PCCP Paper
Ope
n A
cces
s A
rtic
le. P
ublis
hed
on 3
1 Ja
nuar
y 20
13. D
ownl
oade
d on
3/1
8/20
22 9
:04:
08 P
M.
Thi
s ar
ticle
is li
cens
ed u
nder
a C
reat
ive
Com
mon
s A
ttrib
utio
n 3.
0 U
npor
ted
Lic
ence
.View Article Online