Embed Size (px)
Citation preview
Volumes 1-5, 7, 10, 11, 13. 14. 16, 17, 21, 22. 23-27, 29. 31 are out 01 print. Pill’ MID6 Fundamentals of Numerical Reservoir Simulation8 Fundamentals of Reservoir Engineering9 Compaction and Fluid Migration PHASE BEHAVIOUR OF12 Fundamentals of Fractured Reservoir EngineeringiSa Fundamentals of Well-log Interpretation, 1. The acquisition of logging data15b Fundamentals of Well-log Interpretation, 2. Tire interpretation of logging data PE:1ROLEO lvi RESERVOIR FLUIDS18a Production and Transport ofOil and Gas, A. Flow mechanics and production18b Production and Transport of Oil and Gas, 8. Gathering and Transportt9a Surface Operations in Petroleum Production, I19b Surface Operations in Petroleum Production, II20 Geo/ogy in Petroleum Production All DANESH28 Well Cementing
Department of Petroleum Engineering30 Carbonate Reservoir Characterization: A Geologic-Engineering Analysis, Part I32 Fluid Mechanics for Petroleum Engineers Heriot Watt University33 Petroleum Related Rock Mechanics Edinburgh, Scotland34 A Practical Companion to Reservoir Stimulation35 Hydrocarbon Migration Systems Analysis36 The Practice of Reservoir Engineering37 Thermal Properties and Temperalure related Behavior of Rock/fluid Syslems38 Studies in Abnormal Pressures39 Microbial Enhancement of Oil Recovery — Re~enlAdvances
— Proceedings ofthe 1992 lOternational Conference on Microbial Enhanced Oil Recovery40. Asphaltenes and Asphalts, I41 Subsidence due to Fluid Withdrawal42 Casing Design — Theory and Practice43 Tracers in the Oil Field -
44 Carbonate Reservoir Characterization: A Geologic-Engineering Analysis, Part II45 Thermal Modeling of Petroleum Generation: Theory and Applications I
46 Hydrocarbon Exploration and Production -
47 PVT and Phase Behaviour ofPetroleum Reservoir Fluids
______ 1998~-- ELSEVIER
Amsterdam — Lausanne -~ New York — Oxford — Shannon — Singapore — Tokyo
Library of Congress Cataloging in Publication DataA catalog record from the Library of Congress has been applied for.
ISBN: 0 444 82196 1
© 1998 Elsevier Science By. All rights reserved.
No part of this publication may be reproduced, stored in a retrieval system or transmitted in any form orby any means, electronic, mechanical, photocopying, recording or otherwise, without the prior writtenpermission of the publisher, Elsevier Science By., Copyright & Permissions Department, P.O. Box 521,1000 AM Amsterdam, The Netherlands.
Special regulations for readers in the U.S.A. — This publication has been registered with the CopyriglilClearance Center Inc. (CCC>. 222 Rosewood Drive, Danvers, MA, 01923. Information can be obtainedfrom the CCC about conditions under which photocopies of parts of this publication may be made in theU.S.A. All other copyright questions, including photocopying outside of the U.S.A., should be referred tothe publisher.
No responsibility is assumed by the publisher for any injury and/or damage to persons or property as amatter of products liability, negligence or otherwise, or from any use or operation of any methods,products, instructions or ideas contained in the material herein.
®The paper used in this publication meets the requirements of ANSI/NISO Z39.48 1992(Permanence of Paper).
PREFACE
NOMENCLA1’URE
l:l
CONTENTS
PHASEBEHAVIOUR FUNDAMENTALSRESERVOIRFLUID COMPOSITION
1.2 PhASEBEhAVIOURI’urc (‘onipound(‘or rcspondi rig StalesMulticoniponentMi’xture
1.3 (‘LASSIFICATION OF RESERVOIRFLUIDSl)ry GasWet GasGasCondensateVolatile OilBlack Oil
1.4 REFERENCES1.5 EXERCISES
2. PVT TESTS AND CORRELATIONS2.1 FLUII) SAMPLING
Well PreparationSampleCollection
2.2 PVT ‘l’ESTS 382.2.1 DryGas2.2.2 Wet Gas2.2.3 Black Oil2.2.4 GasConclensate2.2.5 Volatile Oil
2.3 EMPIRICAL CORRELATIONS2.3.1 Black Oil
Rubble Point PressureGas in SolutionOil Formation Volume FactorTotal Farina lion Vo/unre FactorOil DensityOil Viscosity
2.3.2 NaturalGasVolumetricData(;~ Viscosity
2.3.3 FormationWaterWater Cr,ntent of hydrocarbon Phasell’
5drocarbon soluinlity in Water
Waler Formation Volume FactorCompressibility of WaterWalerDensityWalerViscosity
2.4 REFERENCES2.5 EXERCISES
34
It)IS2224252527282930
33343436
40414252656667687070717377798083868790929293939599
Printed in The Netherlands.
DirectApplication 2413. PHASE EQUILIBRIA 6.4 REFERENCES 2473.1 CRITERIA FOREQUILIBRIUM 6.5 EXERCISES 249
ChemicalPotentialFugacity 7. GAS INJECTION 253Activity 7.1 MISCIBILITY CONCEPTS 254
3.2 EQUILIBRIUM RATIO Miscibility in Real ReservoirFluids 258Raoult’sLawHenry’sLaw 260EmpiricalCorrelations 260
3.3 REFERENCES 2653.4 EXERCISES 266
2704. EQUATIONS OF STATE 129 2704.1 VIRIAL EOS AND ITS MODIFICATIONS 130 270
273Starling-Benedict-Webb-RubinEOS 131 277
4.2 CUBIC EQUATIONS OFSTATE 132 2794.2.1 Two-ParameterEOS 138
Soave-Redlich-KwongEOS 140 281Peng-Robinson EOS 141 282Volume Sh~fl 141 285
4.2.2 Three-ParameterEOS 45 285Schmidt-WenzelEOS 146 288Patel-Teja EOS 147 289
4.2.3 Attraction Term TemperatureDependency 149 2924.3 MIXING RULES 153 295
4.3.1 RandomMixing Rules 154 2974.3.2 Non-RandomMixing Rules 158
4.4 REFERENCES 162 3014.5 EXERCISES 165 302
3025. PHASE BEHAVIOUR CALCULATIONS 167 3085.1 VAPOUR-LIQUID EQUILIBRIUM CALCULATIONS 168 310
RootSelection 175 314RapidFlashCalculations 179 316
5.2 STABILITY ANALYSIS 183 318Stability Limit 189 319
5.3 CRITICAL POINT CALCULATIONS 192 3205.4 COMPOSITIONALGRADING 195 322
Equilibrium Assumption 197 323Non-Equilibrium Fluids 198 324Heatof Transport 2(X) 325Significance 201 325
5.5 REFERENCES 203 3275.6 EXERCISES 206 330
3306. FLUID CHARACTERISATION 3316.1 EXPERIMENTAL METHODS 333
Distillation 334GasChromatography 338
6.2 CRITICAL PROPERTIES 340Lee-KeslerCorrelations 345Riazi-DauhertCorrelations 349PerturbationExpansionCorrelations
6.3 DESCRII9’ION OF FLUID IIEAVY END 353SingleCarbonNumberFunctionContinuousDescription 385
105I05107108IllIII112114116125127
7.2 EXPERIMENTAL STUDIESSlim TubeRising BubbleApparatusContactExperiments
7.3 PREI)IC1’ION OF MISCIBILITY CONI)ITIONSFirst ContactMiscibilityVaporising GasDriveCondensing-Vaporising GasDrive
7.4 REFERENCES7.5 EXERCISES
8. INTERFACIAL TENSION8.1 MEASUREMENTMETHODS8.2 PREDICTIONOFINTERFACIAL TENSION
ParachorMethodCorrespondingStatesCorrelationComparisonof PredictiveMethods
8.3 WATER-UYDROCARBON INTERFACIAL TENSION8.4 REFERENCES8.5 EXERCISES
9. APPLICATION IN RESERVOIR SIMULATION9.1 GROUPING
GroupSelectionGroup PropertiesCompositionRetrieval
9.2 COMPARiSONOF FOSPhaseCompositionSaturationI’ressureDensityGasandLiquid VolumesRobustness
9.3 TUNING OF EOSFluid CharacterisationSelectionof EOSExperimentalDataSelectionof RegressionVariablesLimits of TunedParametersMethodology
9.4 DYNAMIC VALIDATION OF MODELRelativePermeabilityFunctionViscosity PredictionImplementation
9.5 EVALUA’rION OF RESERVOIRFLUID SAMPLES9.6 REFERENCES9.7. EXERCISES
APPENDICES
INDEX
209210210215221221222223227228234
vi vii
NOMENCLATURE
PREFACE
Reliablemeasurementand predictionof phasebehaviourandpropertiesof petrolciinireservoirfluids areessentialin designingoptimum recoveryprocessesand enhancinghydrocarbonproduction. This book explainsrelevantfundamentalsand presentspracticalmethodsof determiningrequiredpropertiesfor engineeringapplicationsbyjudiciousreviewof establishedpracticesandrecent advances.
Although the emphasisis on the applicationof PVT and phasebehaviourdata toengineeringproblems,experimentalmethodsare reviewedand their limitations areidentified. This shouldprovidethe readerwith a morethoroughunderstandingof thesubjectanda realisticevaluationof measuredandpredictedresults.
The book is basedon the material developedover many yearsas lecture notes incoursespresentedto staff in gas and oil industry, and postgraduatestudentsofpetroleumengineering. It coversvariousaspectsof thesubject,hencecan he tailoredfor different audience. The first two chaptersalong with selectedsectionsfromchapters 3 and5 canserveas thesubjectmatterof an introductorycourse,whereasthe restwould be of more interestto practisingengineersandpostgraduatestudents.Ample examplesareincluded to illustrate thesubject,andfurtherexercisesaregivenin eachchapter. Graphical methods and simple correlationsamenableto handcalculationsare still usedin the industry, hencethey are included in this hook. Theemphasis,however,is on the more advancedcompositionalapproacheswhich areattaining wider application in industry as high computationalcapabilities arebecomingreadilyavailable.
I would like to thank ProfessorDII Tehrani for reviewing the manuscript andvaluablesuggestionsstemming from his vast industrial experience- Also, I urn
grateful to ProfessorsM. Michelsenand C. Whitson for their helpful commentsonsectionsof the book. Much of the material in this book is basedon the author’sexperiencegainedthroughconductingresearchsponsoredby the petroleumindustry,atHeriot-WattUniversity. I amindebtedto thesponsors,my studentsandcolleaguesfor their contributions that made this book possible. In particular, I wouldacknowledgevaluablecontributionsof ProfessorAC Todd, Mr F Goozalpour,Dr DIIXu, Mr K MovagharNezhadand Dr D Avolonitis. My son Amir cheerfully helpedmein preparingthehook graphics.
a attractiveterni parameterof equationof stateA dimensionlessattractivetermparameterof equationof stateb repulsivetcrm(co-volume)parameterof equationof stateB clinrensiontcssrepulsiveterm parameterof equationof statelI~ gasformation volu mire f~ictorIt, oil I urinaliiiir volt: lire factorB total formation volume factorC~ gasisothermalcompressibilitycoefficientC, oil isothermalcompressibilitycoefficientf fugacityG Gibbs energyh heightIi molarentha!pyH total enthalpyI1~ Flenry’sconstanth
1partial molarentlIi~lPY
k peruieahilityk, binary interactionparameterk,~ gasrelativepermeabilityk,, oil relativepermeabilityK equilibrium ratioK~ Watsoncharacterisationfactorm slopein ~scorrelationwith temperatureM molecularweight(molar mass)n moleor carbonnumberN numberof componentsN~ numberof pseudo-componentsP presstireP
1, bubblepoint pressure
P5
convergencepressureP
0parachor
P~ vapourpressureR universalgasconslantR, gasin solutionS specificgravity, relativedensity at 288 K (60“F)‘l temperatureI~ irorrirat hoihiig point temperatureii iriiitar :nlcini.r! encigyV imiolar votunie~ velocityV volumex, mimic fractiony, molefraction in vapourphase7., mole fractionZ compressibilityfactorZ55 Rackettcompressibilityfactor
GREEKLETI’ERS StJPERSCRI Pt’S
a temperaturedependency coefficientof attractiveterm
meanvalueparameterof r distributionfunctionCj activity~ fugacitycoefficient~y parameterofrdistributionfunctions~ calculatedcritical compressibilityfactorK total numberof phasesj.t chemicalpotentialp massdensityPu molardensity~ interfacialtensiont lowest molecularweight in Fdistribution functiomi(i) acentric factorLI EOSparametercoefficiente activity coefficient~ anyphase
ACRONYMS
F Iced, imrixliileh hydrocarbonphase
liquid phaseo referencestate5 saltmrationV vapourl)haseW waterphase
SUBSCRIP’I’S
baseor bubblepointcritical pointdifferential liberation processgashydiocarbirmioil
r reducedproperty= value/valtmcat critical points saltw w,mter
barrelbinary interactionparameterconstantcompositionexpansioncondensateto gasvolumetricratioconstantvolumedepletiondifferential liberationequation(s)of stategasto oil volumetricratio (Sc)gasto liquid volumetricratio (Sc)GasProcessorsAssociationgallon of liquid perthousandcubic feetof gas(sc)interfacial tensionminimum miscibility pressureminimum miscibility enrichmentparaffins-naphthenes-aromaticsPeng-RobinsonEOSPatel-TejaEOSstandardconditionsstandardcubic feetSoave-Redlich-KwongEOSstocktankbarrelSchmidt-WenzelEOStrueboilingpoint temperatureValderrama-Patel-TejaFOSZudkevitch-Joffe-Redlich-KwongEOS
I)C(IItIt0
hblBIPCCECGRCVDDLEOSGORGLRGPAGPMIFTMMPMMEPNAPRPTScSCFSRKSTBSWTBPVPT7JRK
xi
1PHASE BEHAVIOURFUNDAMENTALSPetroletimreservoir fluids arecomposedmainly of hydrocarbonconstituents. Water is atsopresentin gasand oil reservoirsin an interstitial fonrr. The influenceof water on tIre phasehchavioumrandpropertiesof hydrocarbonfluids in most casesis of a minor consideration. Thephasebehaviourof oil andgas,therefore,is generallytreatedindependentof tire water plrase,unlesswater-hydrocarbonsolid structures,knownas hydrates,areformed.
The behaviourof a hydrocarbonmixture at reservoirand surfaceconditions is determinedbyitschemicalcompositionand the prevailing temperatureand pressure.This behaviouris of aprimeconsiderationin tire developmentarid managementof reservoirs,affecting all aspectsofpetroleumexplorationandproduction.
Altirotmgh a reservoir litmiut may he composedof many thousandsof compounds.tire phasebehaviourfundamentals can be explainedby exami0 ing the behaviourof pure and simplemrrulticonrponentmriixiurcs. The behaviourol all realreservoirfluiuls basically follows the salineprinciple,but to hicilitate tIre applicationof tire technologyin theindustry,reservoirfluids haveheemrclassified into variousgroupssuch as the (try gas,wet gas,gascondensate,volatile oiland black oil.
I RESERVOIR FLUII) COMPOSITION
‘lucre are various hypothesesreg~ridiirgthe fornratiorr of petroleum from organic materials.Ihese views suggest that tIre coisrpositmonof a reservoirfluid dependson the depositionaienvironmentof theformation,its geologicalmaturity, andthemigrationpathfrom thesourcetotrap rocksIi]. Reservoirgassesaremainlycomposedof hydrocarbonmoleculesof small andmediumni size,s and sonic light non-hydrocarboncompormnd.ssuch as nitrogen and carbondioxide, whereasoilsarepredominantlycomposedof heaviercompounds.
Fluids advancinginto a trapping reservoirmay be of different compositionsdue to beinggeneratedat different times and environments. thence, lateral and vertical compositionalvariationswithin a reservoirwill he expecteddumring the early reservoirlife. Reservoirfluids
2 1. t’lrase Helun’,our Fiinukun:e,,i~i!.c I. 1. Reservoir Fluid O~nrposit:on 3
are generallyconsideredto haveattainedequilibrium at maturity dueto moleculardiffusion andmixing over geological times. However, there are airrple evidencesof reservoirs stillmaintainingsignificantcompositiomialvariations,particularly tatcially as tIre dill usiye rrixingmay require many tens of million years to eliminate coiripositmonal hmclcmogeiiuitcs I 2 IFurthermore,the pressureand the temperatureincreirsewith depth for a tluid column iir areservoir. Thiscanalsoresult in compositionalgrading with depth. For operatiomial puposes.this behaviouris of considerableinterest for near critical lluids, and oils containing bightconcentrationsof asphalticmaterial. Thecompositionalgradingand its estimiration basedonthermodynamicconceptswill bediscussedin Section5.3.
The crudeoil composition is of major considerationin petroleum refining. A numberofcomprehensiveresearch projects sponsored by the American Petroleuni Institute haveinvestigatedcrudeoil constituentsand identified petroleumcompounds. API6 studied thecompositionof a single crude oil for 40 years. ihe sulphur, nitrogen and orgtrmiomricttrlhiccompremndsof crude oil strniptcs were investigatedin projects API-48. API 52 ;inrd API-Stirespectively.API-60 sttmdied petroleumheavyends. Nelson [31 givesa review of petrolcumnichemistryandtestmethodsusedin therefining industry.
liighly detailedinformationon theconstituentscomposinga reservoirfluid is not of very muchruse in explorationandproductionprocesses.Reservoirfluids arecommonlyidcmrtilmcd by theirconstituentsindividually to pentanes.andheaviercompoundsarereportedas groupsconsrposedmostly of componentswith equal numberof carbonssuch as C6’s, C
7’s. Cg’s. All the
compoundsformingeachsingle carbon number group do not necessarilypossessthe samenumber of carbonsas will he discussedin Section 6. I. Tire most common method ofdescribingtheheavyfractionis to lumpall theconipoundsheaviertitan C
6and meport it asC
7+.
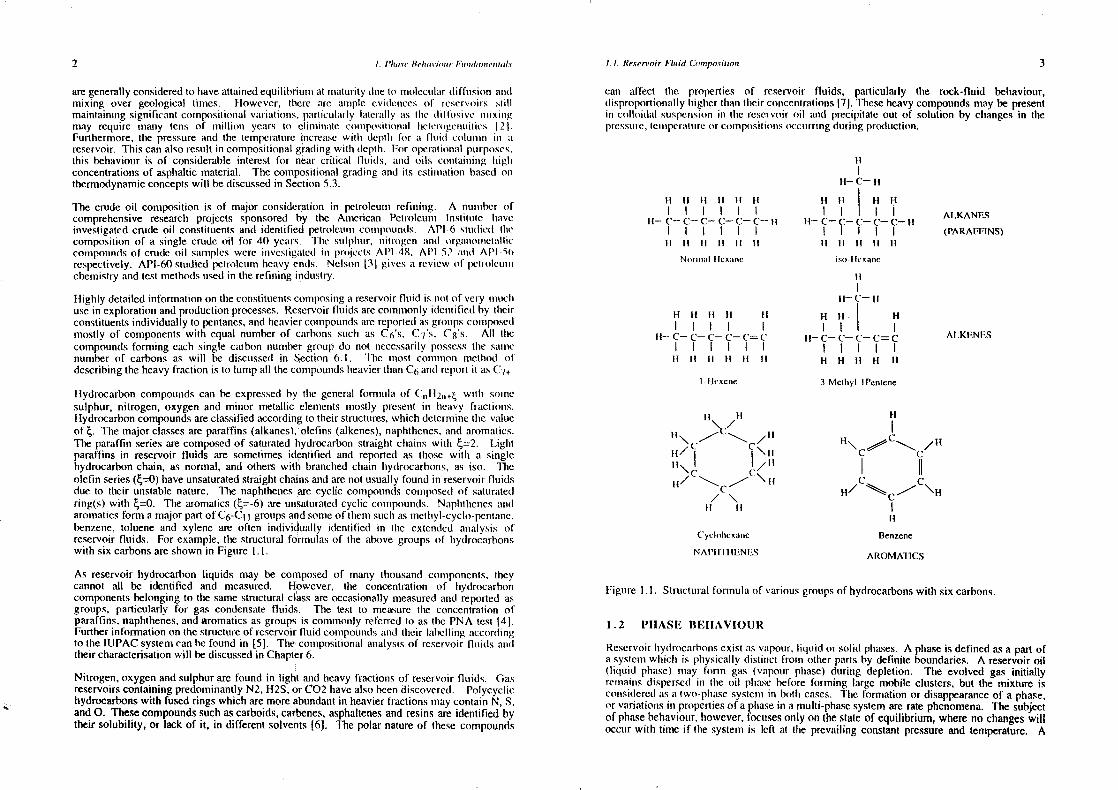
hydrocarboncompoundscan be expressedby the general formula of Ci1II2Irf~with somesulphur, nitrogen,oxygen and minor metallic elements mostly present in heavy fractions.Hydrocarboncompoundsareclassifiedaccordingto theirstructures,which determinethe valueof ~,. Theniajorclassesare paraffins (alkanes).oletins (alkenes),naphthenes,andaromatics.The paraffin seriesarecomposedof saturatedhydrocarbonstraight chains with ~=2. Lightparaffins in reservoir fluids are sometimesidentified and reportedas those with a singlehydrocarbonchain, as normal, and otherswith branchedchain hydrocarbons,as iso. Theolefin series(~=0)haveunsaturatedstraightchainsandarenot usually found in reservoirfluidsdue to their unstablenature. The naphthenesarecyclic compoundscomposedof saturatedring(s) with ~=0. The aromalics(~,=-6)are unsaturatedcyclic cotripounds. N~rphthrenes~mmr(haromaticsforma majorpartof C6-Ct t groupsandsomeofthem suchitS methyl-cycio-pcntanc.bcnzene,tohuene and xylene are often individually identified in the extendedanalysis ofreservoirfluids. For example,the structuralformulasof tire abovegroups of hydrocarbonswith six carbonsareshownin Figure 1.1.
As reservoir hydrocarbonliquids may be composedof many thousandcomponents,theycannot all be identified and measured. However, the concentration of hydrocarboncomponentsbelonging to the same structuralclass are occasionallymeasuredand reportedasgroups.particularly for gas condensatefluids. The test to measurethe concentrationofparaffrns,naphthenes,andaromaticsas groupsis commonly referredto as the PNA test 141-Furtherinformationon thestructureof reservoirfluid comnpoundsand their labelling accordingto theIUPAC systemcanhefound in [SJ. The compositionalanalysisof reservoirfluids anhtheir characterisationwill bediscussedin Chapter6.
Nitrogen,oxygenandsulphurare foundin light and heavy fractionsof reservoirfluids. GasreservoirscontainingpredominantlyN2, H2S.orc02havealsobeendiscovered. Polycychichydrocarbonswith fusedrings which aremoreabundantin heavierfractionsmaycontainN, S,and 0. Thesecompoundssuchascarboids,carbenes,asphaltenesandresinsare identified bytheir solubihity,or lack of it, in differentsolvents[6]. The polarnatureof thesecompounds
can affect the properties of reservoir fluids, particularly the rock-fluid behaviotmr,disproportionallyhigherthantlreir concentrations[7]. Theseheavycompoundsmaybe presentin colloidal suspensionin the reservoiroil and precipitateout of solution by changesin the~ tcmrrpcratumreorcomnpos!tiomrsoccurringdurimig production.
It H II H It II H H H HI
II— C—I
IC—I
IC—I
IC—I
IC—
I
IC—li
I
IH—C—
I
IC—C
I
I—C—
I I
IC—H
IALKANES
(PARAFFINS)II II U H It II II II It II It
Norinnat Icx;ine iso-lie ranc
II
It— C~—H
HH HI I I
II— C— C— C— C=CI I I
Ii It II II It It H H II II H
I -Itexenc 3-Meltryt- I Pentene
1.2 PIIASE BEHAVIOUR
Reservoirhydrocarbonsexist asvapour, liquid orsolid phases.A phaseis definedasa partofasystemli whtcir is physicallydistinct from otherparts by definiteboundaries. A reservoiroil(liquid phase) may form gas (vapour phrase)during depletion. The evolved gas initiallyremaInsdispersed iii the oil phasebefore forming largemobile clusters,but the mixture isconsideredas a two-phrasesystem in botlr cases. The formationor disappearanceof a phase,or variationsin propertiesof aphrasein amulti-phasesystemare ratephenomena.The subjectof phasebehaviotmr,however.focitsesonly on theState of equilibrium, whereno changeswilloccurwith time if tIre systemis heft at tire prevailing constantpressureand temperature. A
H
H— C— H
H tt It It III I I
It— C— C— C— C— C C’I I I I
ALKENES
/H\ ,,,,,~
-~ /11c\ttI1\~ I/It
H~~/\
It It
H
C ~ H
I IIH/NC ~C\
11
C’yclotrcxanc Benzcne
NAI’IIrIIENLs AROMATICS
Figure 1.1. Structuralformulaof variousgroupsof hydrocarbonswith six carbons.
4 1. Phase Behan’iour Fu,rdamelrta/.l 1.2. !‘ha.ce liehaeu~ur S
systemreachesequilibrium when it attainsits minimum energylevel, as will be disctmssedinChapter3. The assumptionof equilibrium betweenfluid phasesin contact in a reservoir, inmostcases,is valid in engineeringapplications. Fluids at equihihriumm are also referred to assaturatedfluids.
The state of a phaseis fully defined when its conrposrtion, temperaturearid prcssurrearespecified. All the intensivepropertiesfor sucha phaseat tire prevailing conditions are tmxedand identifiable. The intensivepropertiesare those which do not depend oil tire amount ofmaterial (contrary to theextensiveproperties),suchas the density andtIre specific heat. Thetermpropertythroughoutthis hook refersto intensiveproperties.
At equilibrium, a system may form of a nunrberof co-exiting phases,wimlr all tIre fluidconstituentspresentin all theequilibrated phases. The numberof independentvariablestodefinesucha systemis determinedby theGibbsp/roserule descrihetasfollows.
A phasecomposedof N componentsis fully defined by its numberof irrolcs plus twothermodynamic functions,commonly tenrperatumreanul pressure,that is, by N÷2variables.The intensivepropertiesare,however,determinedby only N+I variablesa~tire concentrationof componentsarenot all independent,but constrainedby,
(II)
where, x1
is the mole fraction of componenti. Thums, for a systersiwith K phrases,tire totalnumberof variablesareequal to rc(N-f I). However, the temperature,presstrr’e.and chenricalpotential of eachcomponentthroughoutall phasesshouldbe unifornrr at equilrhriunrconditions,aswill bedescribedin Chapter3. This inrpuses(N÷2)(ic-I) constraints. lterrce. the nunrberof independentvariables,or so-calledthe degreesof freedom, F, necessaryto (lefirre amultiphasesystemis givenby,:
F= K(N+l)-(N+2)(K-l) = N - K + 2 (1.2)
For a single-component(pure) system, the degreesof freedom is equal to three nrinus thcnumberof phases. Thestateof the equihibriurm of a vapour-liquiuh mixture of a pure lluid,therefore,canbedeterminedby identifying either its pressureor its tcnrperalume.
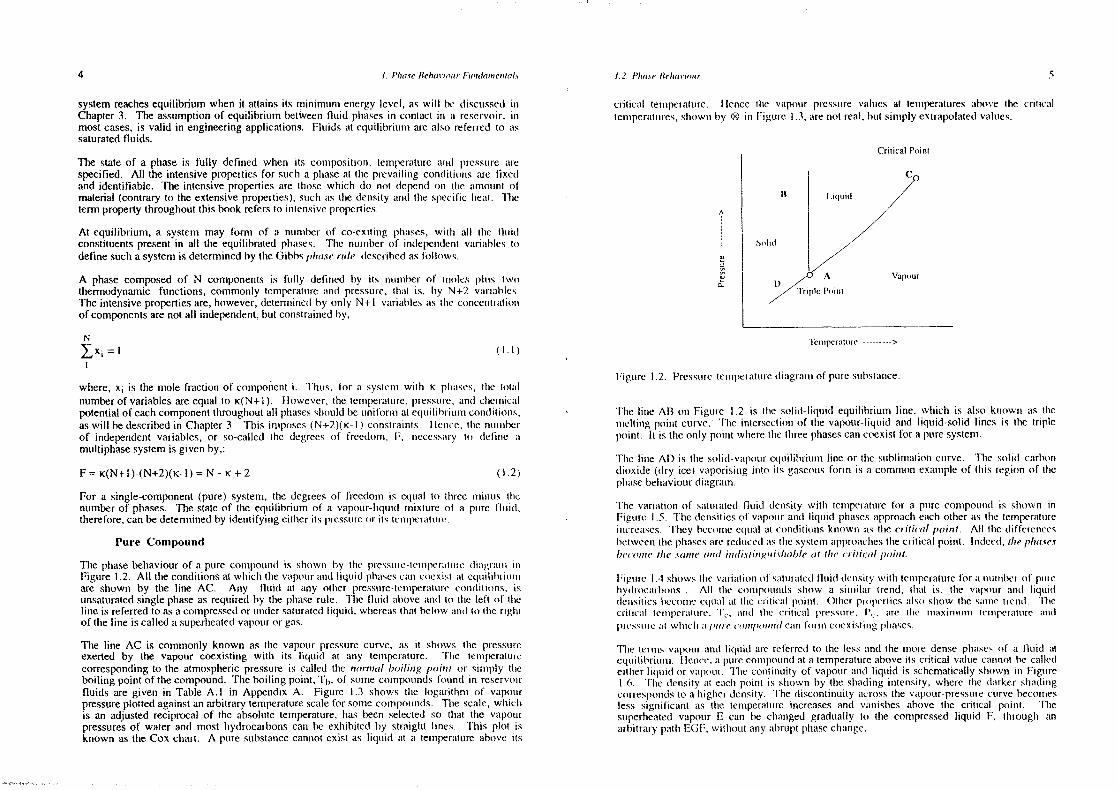
Pure Compound
The phasebehaviourof a pure compoundis strowir by tire prcssurc-teiriperutrrredi:rgrurnrr itFigure1.2. All theconditionsat winch tire vapourand umquid phasescan coexistat cqtrrlmtamrrrirare shown by the line AC. Any fluid at any otlrer pressure-tenrperatui’econditions, isunsaturatedsinglephaseasrequired by the phraserule. The fluid aboveand to tire left of theline is referredto asa compressedor undersaturatedliquid, wlrereasthat heiowandto therightof tIre line is calleda superhreatedvapourrorgas.
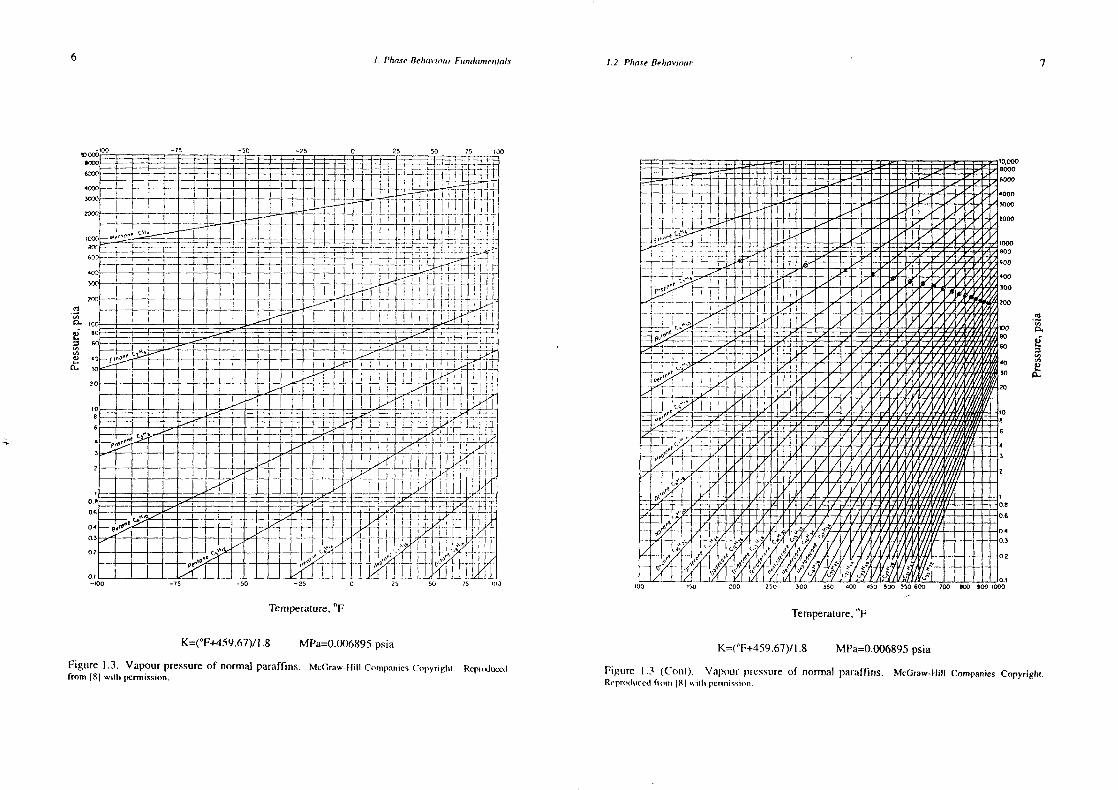
The line AC is commonly known as the vapour pressurecurve, as it shows tire pressureexerted by the vapour coexisting with its liquid at any temperature. The temperaturecorrespondingto the atmosphericpressureis calleut tire normal boiling point or simply tireboiling point of thecompound.Theboiling point, Tb, of somecompotrndsfoundtin reservoirfluids aregiven in Table A. I in Appendix A. Figure 1.3 shows tIre logarithm of vapourpressureplottedagainstanarbitrarytemperaturescalefor somecompouinuls. The scale,whichis an adjustedreciprocalof the absolutetemperature,has been selectedso that the vapourpressuresof water and most hydrocarbonscan be exhibitedby straight lines. This plot isknown as tire Cox chart. A pure substancecannotexist as liquid at a temperaturreabove its
critical temperature. I lence tIre vapour pressurevalues at temperaturesabove the criticaltemperatures,shtowrrby ® in Frgurrc 1.3,arenot real,but simply extrapolatedvalues.
A
ii.
Critical Poini
Figure I .2. Pressure-temperaturedragrrrmrrof pure suibstairce.
The line AR on Figure 1.2 is the solid-liquid equilibrium line, which is also krtown as tiremrrclting point curve. l’hre intersectionof the vapour_liqummdand liquid-solid lines ts the triplepoint. It is thre only poirrt wherethethreephasescartcoexistfor a puresystem.
Tire lure AD is the solid-vapourequnihihriunr line or the suhlitrratmoncurve. The solid carbonuhioxiule (dry ice) vaporisinginto its gaseousform is a common exampleof this region of thephrasebehaviourdiagram.
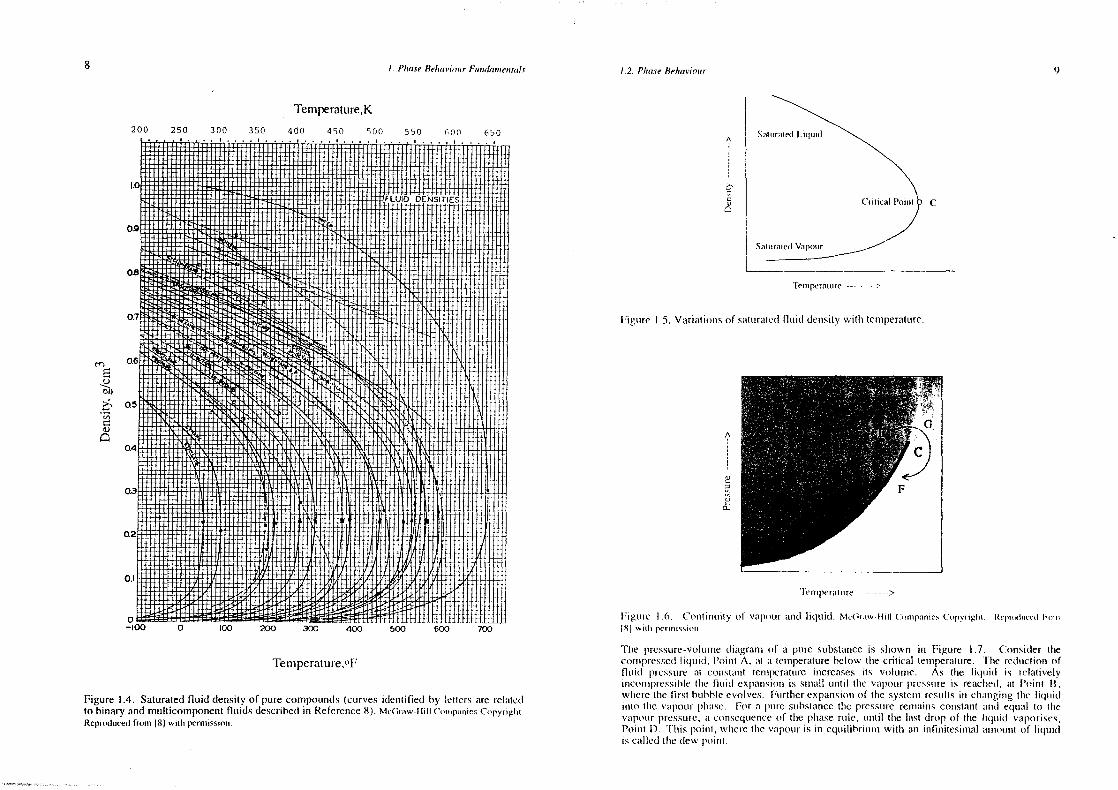
lire variation of saturatedfluid ulensity with teirrperaturefor a pure compoundis shown inFigure 1.5. Thedensitiesof vapourand liquid phasesapproach eachother as tire temperaturei iru-reases. Ihey hcconieequal at conuhitionskmiowir as tire Critical point. All tIre differencesbetweentire phrasesarere(Iucedas thesystem approaciresthecritical point. Indeed,thep/maces
i,eu’onre t/iC .Sa?tiCuiiid iF,(IiStiprh’i415/i(1ble at tire (‘ritical point.
go me I .4 showsI Ire variationof saturatedIi uid chensrI y with temperaturefor a nurmrrbcr of primeIrydroearbomrs- All tIre conmporrrrds slrow a sirmnilar tremid, that is, tIre vapour and liquidrlemrsiries bccorrreequal at tIre cnrtrcat point. OtIrer propertiesalsoshow tire same tiend. ‘Ilreen mciii tenrrperatrire. I~.,arid tIre critical pressure,P,. are tire niaxilriuni terriperature arid
me at which ii proe conrpororil cirur fomnmr coexisting1
ilrascs.
The ternrs vapour and liquid are ret’erred to the less and the more densephasesof a fluid atequilihriunr, I leirce.a purecorripoundat a temperatureaboveits critical valuecanirotbe calledeitlrer liqumid or vapour, lire continuity of vapourand liquid is scherrraticahhystrown in Figure1.6. TIre density at e~rclrpoint is sirown by the shauhingintensity, where tIre ularker shadmrrgcorrespondsto a iriglrer density. Tire discontirruity acrossthe vapour-pressurecurve becomesless significant as tire temperatui’e increasesarid vanishes above tIre cmitical poirrl. Tiresuperheatedvapour F can he chrangedgradumally to tIre compressedliqumid F, thiough anarbitrarypatlr EGF, Wi tirout any abrupt phrasecirange.
8
Solid
I)A
triple Ponni
Vapour
tennperatnnrc >
6 1, Phase Belrannon,r Fwrda,,re,m,url.s 1.2. Phase Behaviour 7
no
V
“IU,
0~
K=(°F+459.67)/l.8 MPa=O.006895psia
Figure 1.3. Vapourpressureof normal paraffins. McGraw-tlitt CompaniesCnnpyrigtrn. Rcpnnxiuccdhomer 181 wiih permission.
L-t-i--~ ~
j~.-~J- -IL
~ 2!L~i~ LE~L
~ H~ ~:i~_~:,‘-~—-~
~IL. -~
~~
~
~
- 7Z
~
L
~
7
~
~400 iso
1000
moo
mOO
.‘O
0
no.’200 250 300 350 400 450 500 350 600 700 ~ ~00 000
Temperature,°F
K=(°F-f459.67)/1.8 MPa=Q.006895psia
no
2U,
U,
2
Temperature,°F
Figtmre 1.3 (Coin). Vapourpressureof normal paraffins. McGraw.Hitt Companies Copyright.Rcprnstuced fioi~nI~!s~iitrpermnnicsionn
8 I. Pha.me Rehannonrr Fnondamnre,rtat.r 1.2. PhaseBehaviour 9
Temperature,K
350 400 450 S00 550 600 650
I 1f~ITUf I I ~‘&II10-44151 41401~
‘!•iUIU________ ftI~FI~IIt1
H II fttiWH-ft1t-tt ~1f~-~’IUU~I-~-tf~f~UItI I~~B~~tIi ~ALflI~kY
Temperature,oF
~tiIi~iJllhI!~
•1rLIFHU ll~llt~ll~
400 500 600 700
Figure 1.4. Saturatedfluid densityof pure compoumnds(curvesiderrtilred by lettersare relatedto binaryandmulticomponentfluids describedin Reference8). McCraw-ttilt ConinpaniesCopynigtnn
Reproduced from 81 wiih permission.
A
CI)
uigure 1.5. Vamiatiomrsof saturatedtluid densitywith tennperature.
A
U
aC,
C
Irginr’e I .6. (‘ontinltrity oh’ vapour anul hmquid. Mc(Ir~nw-Ititt(‘onnipanniesCnipyrngtii Reprnstnncenttrim
IS! with pernnnnssionn.
TIne pressure—volunrediagram of a pure substanceis shown in Figure 1.7. (‘onsider tirecorrrpresseulhiquniul. Point A, at a tercrperaturebelow tire critical temperature. lbe reductiomnoffluid pm’cssure at constant teirnperature increases its volume. As tine liquniul is relativelyincomrrpressiblctine finn uI expansiomnis small until tire vapourprcssnrreis reaclred,at Point 13where tire first bubbleevolves. Furtherexparrsioinof tire systeirnresultsun chi~rmiginigtire liquidiran tire vapour phn:ise. For a pure substanceI lie pressureremlraius constantmmd equnal to tIrevmrpourr pressure,a consequmenceof tire phaserurle, until the last dropof tire liquid virponises,Point I). ~h’lnispoint, where tIre vapouris in equnilihrnumrr with an imnfinitesimnral anrnountof hiqtnidis called tIre utew poinn.
200 250 300I...., .
Sanurmued I _rquiul
ilHifli It I USaunnr~niedVapour
‘tennnpr’rarure
Ill~-
fH+HIfH P-H-I-/ ~Yt-14ftt±1-i’H±H+~f+H1-I-H+H-fl
—100 0 tOO 200 - 30Cii
1enrnpermninrre >
10
N
A
U
0.
Volume ->
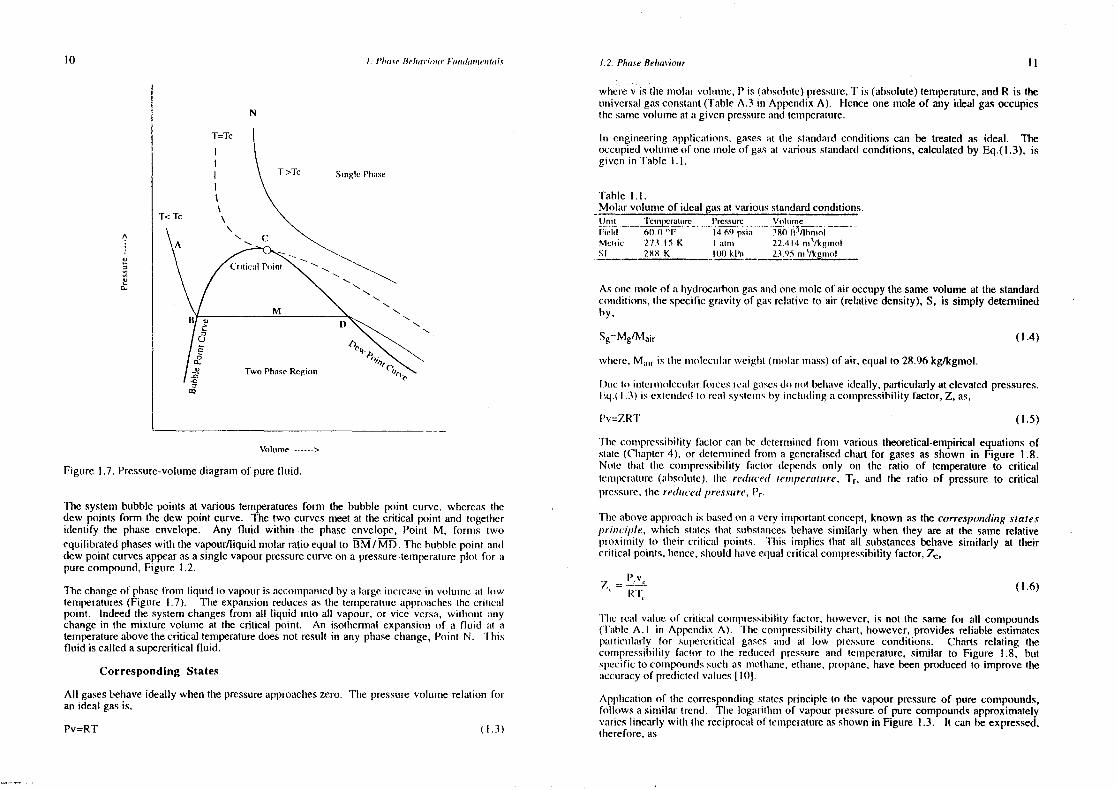
Figure 1.7. Pressure-volumediagramof purelluid.
The systembubblepoints at various temperaturesform thebubble point curyc, whereasthedew points form the dew point curve. The two curvesmeet at the critical point and togetheridentify the phaseenvelope. Any fluid within the phaseenvelope,Point M. forms twoequilibratedphaseswith thevapour/liquidmolar ratioequalto BM/MD. The bubblepoint anddew point curvesappearasa singlevapourpressurecurveon a pressure-temperatureplot for apurecompound,Figure 1.2.
‘l’he cham’rgeof plnasefrom liquid to vapour is accortmpan;edby a largeinncrcmrse in volrime mit lowtemperatures(Figure 1.7). The expansionreducesax the temnnpcratureapproaclnesthecriticalpoint. Indeedthe systemchangesfront all liquid into all vapour,or vice versa,without artychangein tire mixture volume at the critical point. An isothnermalexpansionof a fluid at atemperatureabovethecritical temperaturedoesnot result in any phasechange,Poimni N. Thisfluid is calleda supercriticalfluid.
Corresponding States
All gasesbehaveideally whenthepressureapproacheszero. The pressurevokrnne relation foran idealgasis,
Ii
where v is tire molarvoltrmnie, P is (absoltmte)pressure,‘F is (absolute)temperature,andR is theumnivcrsalgasconstant(TableA.3 in AppendixA). Henceonemole of any ideal gasoccupiesthesamevolume at agivenpressuremmd temperature.
In emrgimneeringapplications,gasesat tire standardconditions can be treatedas ideal. Theoccupieulvolumeof onemole of gasat variousstandardconditions,calculatedby Eq.( 1.3), isgivenin Table 1.1.
Table 1.1.- Molar volumeof idealgasat variousstammdardconditions.
Unit ~perarurc - ‘~ure,V_olnrnne
Frctd 60(1 “F 14.69psia 380 tm~IIhriIotMennic 271. t S K I ann 22.414mnr
1/kgmot
St 2)18 K Its) kI’mn 23.95rim ‘ItcgumIInt
As omre minnIe of a hydrocarbongasamnd onemole of air occupythesamevolume at the standardcomrditions,th’te speciFicgravityof gasrelative to air (relative density),S, is simply determinedby.
Sg=MglMair (1.4)
whmere,Muir is themrmolectmlarweight(mnrolarnnass)of air, equalto 28.96kg/kgmol.
l)ue to imrtermolecrilarforcesremit gasesdin mint behaveiulcahly, particularlyatelevatedpressures.
Fq.( 1.3) is extemnulcdto remit systemrrsby including acompressibilityfactor,Z, as,
Pv=ZR~l’ (1.5)
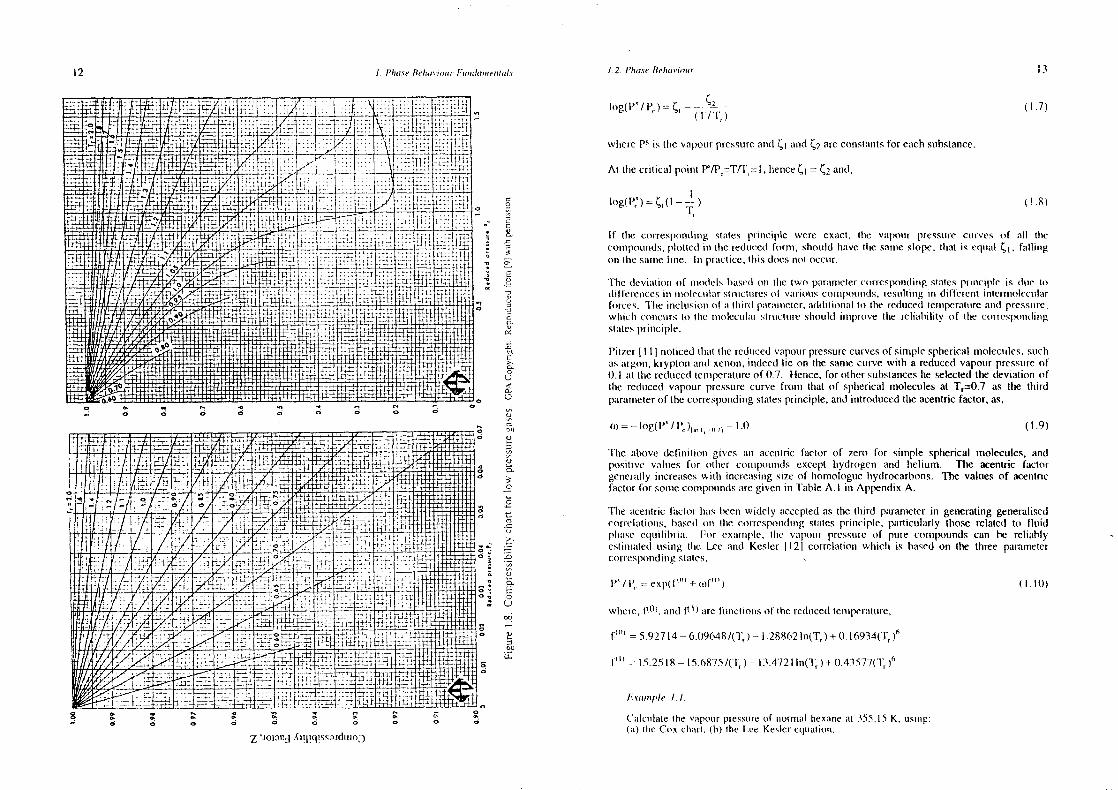
Fine comnnpressihilityfactorcan be deteurninedfrom various theoretical-empiricalequationsofstate(Chapter4), or determnninedfrom a generalisedchartfor gasesas shown in Figure I .8.Note tinat tIre compressibility factor dependsonly unn the ratio of temperatureto criticaltcmnrperature(ahsolurte),tire reducedtemperature,Tr. and the ratio of pressureto critical
pressure,the reducedpressure,15
r-
TIne aboveapproachis basedon a very inrportantconcept,known asthecorrespondingsta:e.cprinciple, which statesthat suhstamnceshelravesimilarly when tlney are at the samerelativeproxirinity to their criticmrl poimnts. This inrphies tlnat all substancesbehavesimilarly at theircritical points,hence,shouhulInaveequalcritical compressibilityfactor,Z~,
P v(1.6)
lime real vunlueof critical coirnpressibihityfactor, however,is not thne same for all compoundscrumble A. I in AppendixA). l’hne conmprcssihilitychart, trowever, provides reliable estimatesparticularly for simpercritical gases and at low pressureconditions. Charts relating thecompressibility factor to tIne reuluced pressureand temperature,similar to Figure I .8, hutspecific to compoundssuchas rinetlrane,ethane,propane,have beenproducedto improvetheaccuracyof predictedvalues(101.
Application of tlne correspondirmgstatesprinciple to thevapour pressureof pure compounds,follows asimilar trend. The logarithmof vapourpressureof pure compoundsapproximatelyvarieslinearly with tire reciprocalof Iemsnperatureasshownin Figure 1.3. Ii can heexpressed,therefore,as
I. P/ia Cf Behan’,,,nn,’!‘nondan,ne,nials 1.2. PhaseBehaviour
T=Tc
T<Tc
T >Tc SinglePtiunse
I)
Two Phase Regrnnin
Pv=RT (1.3)
12 1. !‘/na.n’ !te/nnnlioin, F=nnmnc/cznn,nqn0n/.r /2. !-‘/no.ie l/e/nannonnr 13
log(P’ I P,) ~— ~ ( I .7)
winere P~is tire vapourpressureamrd ~t annul ~2 areconstamntsfor eurchsubstance.
At thecritical point P’IPC=TIF,.= I , hence~ t = c2 anul,
I log(P,~)=~1
(l~_L)8. If tIre cor’respomnhingstates principle were exact, tire vapour pressurecurves of all line~ commipounds,plotted inn tIre redunceulform, should have tIme sammne slope,tlrat is equal ~ n . falling.:‘ ~ oil thesalineline. lmr practice,tins (hoesnot occur.a.~ ~1he nhevratmm of mrnoulels haseuhomi fire two parunminclercorrespon(lrmrg statespm ncI plc rs due tic
~7 uhi I feremnccsin nmroleculunrstrinctunresoh variouscommrpoummnuls.resulting nit (lit leremit imnicrmnroleu-unlumr.~ Iorues. lIne imnchusiormoh a tlnirul parmmrmlcter,aduhtiomnalto tire rcduceul tcmmnperalnmre mmml pressure,2 svhnichr corncnmr.sto thee rnnolecinlmur structnnicshrould imnrprove tIne reliability of the coriespomrding
statesprimrciphe.
Pit~,erLIIJ noticedthrat tIne reduncedvapourpressurecurvesof sinnplesphericalrnrolecules.sniclnasargon,kryptomn and xemnon,iriulccd lie on tine samnnecurve wmtln a reducedvapour pressureofI). I at tIne reducedtemrrperatureof 0.7. Hence, for otlrer substanceshe selectedthe deviationoftire reducedvapour pressurecurve frommn tlnat of sphericalmoleculesat Tr=O.
7as the third
0 pmrrannreterof tInecorrespondimngstatesprinciple. amrd irntroducedtheacentricfactor,as,
(fl=—log(P’/P~)(,1
.~ —1.0 (1.9)
The ahuwedefinition gives arc acerniric factor of zero for simple sphericalmolecules, andpositive values for otiner corurpourids except hydrogen and helium. The acentric factorgenerallyimrcreaseswith imncreasingsizeof iromologucirydrocarhons. The valuesof acentncfactor for sonneconnpoimndsaregivenin TableA. I in AppendixA.
0Tire acentricfinctom Imas been widely acceptedas the ttmird parameterin generatinggenerahisedcorrelations,basedomr tIre corresponndinngstatesprinciple, particularly tlrose related to fluidplnmse cqnmilibiia. For examnnple. lIme vapour pressureof pure comcepoundscan be reliablyestimiratedusing the Lee and Kesher 1121 correlationwhniclr is basedon the three parametercorrespondingstales.
P’ /P = exp(f”” + (0
fW) (I. It))
wlnerc,lIt)). anul ph) are furcctiomnsof thereducedtemnrperature,
= 5.92714— 6.09648/(T,) — 1.28862ln(T,) + 0.1 6934(T~)5
= 15.2518—l5.6875/(i~) - 13.4721ln(T, ) -I- 0.43577(T,)6
L~n,nrj’Ie 1. 1.
Calcnniatethe vapour pressureof normal hexaneat 355.1SK. using:(a) hire Cox drum, (h) tire Lee-Kesterequationn.
(1.8)
- - : ~ ~tm 2 ,
~:.:
~- .~
~ ~- -~‘/t.f.t .-.444.--P ~—~±~-—i~zt~ 4t~f ~I.
4~t~Pir~
0. ‘ I:: ‘,t’ t1=~. ~ U~
..
~
.‘~‘;f.
~?~T~,
~ .:t~ =:u
. ...
~~r~.
T—
——
... -..
, . . - =~1~~U~ifi=~j
~~.~---
-~. ..
I. ,1 ,:Ii~.: .~ I mi. ~. tIm
L — ‘5 )‘1..~. ~t~t .~s-‘TT .~ .: . ‘, fl.o i_.- . t.~:~f
1t~t-L_.j--’ ..u:~,.l.j 1-
~ ,~ ~ ~i :~ ~: ~, 1::-. ,~ ~
-~ I - I- -.* - t~’
4~I -~ i
~ 41H ~ ~ tJ~ -:~ U~J~4~t t
~~T~W:~
~_
4~1
/ AI/~1.~
-
~ I ~ I
~1t~t~~
~
E~T~b~
a
a 0 0 0 o 0 ii
z ‘-~°n°~icli1
mqlscaldwo3
14 1. /‘/na.ce 1?elntn,iou n /nnnndnn,,ne,nan/s /. 2. l’/na,ce !?e/rannonnr 15
Solution:
(a) From Figure 1.3, am T=355.15K (179.6‘F), thevapour pressureis remid eqniuml to 0.15
MPa (21 psia).
(b) The critical propertiesof normal hexaneare read from Table At in Appendix A, ummndusedin Eq.(I.lO) to calculatethe vapourpressureas follows:
T,, K P~,MPa m 1, 1” C” P’, MI’un-2.306921 0.1504507.6 3.025 0.30t3 0.69966 -2.306192
The umse of critical compressibility factor as the third parurnnetcrfor (levellmpinmg genemumlisi.’dcorrelationsto predict volumetricdata hasalsoproved successful. Ann exmmnrpie is tIne Racketlequation[131for thesaturatedmnrolarvolume of purecomnnpounds,
v’ / v = Z~UT.4°’ (1.11)
wherev~,and v~are the saturatedliquid andcritical molar volunnes.respectively. A morereliableestimationoftheliquid molarvolume is expecteulfront themodificationof the Rackettequation by Spencerand Danner [141, where the critical compressibility functor hrmms hecimreplacedby theparameterZRA, known astheRackettcompressibilityfactor,
v~= (RT /P~ (1.12)
Thevaluesof ZRA for somesubstances[l5j aregivenjim TableA. I in Appenulrx A. For oIliercompounds,it canheestimatedfromthe Yamada-Gtrnncorrelation1161=
ZRA=O.29O56-O.08775u (1.13)
Theapplication of acentric factorand critical compressibilityfactor in developing generahiseulcorrelationswill bedescribedfurther, particularlyin Chapter4 dealingwith equationsof stale.
Fixaunple 1.2.
Calculatethe density of saturatednormal butane liqumid at 393 K, using mice Ruickeitequation. A cylinder contains I kg of satunratedliquid humane at 393 K. Wlrat is mInevolume of liquid butaneremaining in tine cylinder after comnsunninmg0.5 kg of botanic?
Solution:
Readingthe critical propertiesof normal butane from Table A. I in Appennutix A ammulsubstitutingthem in Eq.(l.l2). at 393 K, we ohtaimr:
M, kg/kgmol T~,K PC’ MPa 7~ r, v’, nrn’/mnnt Donsiny, kg/inn’425358.123 425.12 3.796 0.2730 0.92444 0.13665
wherethedensity.p’, hasbeencalculatedas,
p’ = M/v’
Tlre cylinder pressunreremnnains curnrstmnnn,equal to time irormal butane vapoumr pressure,aslong as the mixture remainstwo ptna.cesat 393 K. The vapour pressurecan be calculatedfrom the Lee-Kesterequation,Eq.(I It)), sinrihar to that in Example1.1, which resultsin:
P’=2.2 160 MPa, In 393 K.
The vapour density am the above conditions can be calculated from Eq.(1.7). Thedonurpressihility factor, Z, no read fronmr Figure 1.8. at prevailing reduced values of:P,=P/I’~=2.216/3.796=0.5838and T,=0.9244, to he Z=0.67. The universalgasconstantis read,from Table A.3 iii Appenmutix A, to be 0.(X)83144 MPa.m’/(K.kgnrol).
I Icncc,
v = ‘/.I~I/Jm = I IX)) mmn’/kgmrnot. ummrnt tIm’ vap~nnnruhemisity is
p5
=M/v5
=58.123/I.00.1=57.95kg/inn’
lIne minass balanceresumlts inn,
nrr=Vn ~4 v5
p~
t).5=V x425.3 -440.00235I-V1
)< 57.95
Lnuinn nd butanevolmm. V’ =0.1)009902 tim’
Multicomponent Mixture
Fire phrase helmaviotmr of a mrrultr-comrnponnentsystem is more elaboratethan that of a purecninmpound. ‘l’lmc comnmplexity gemnerunlly conrmpoundsas componentswith widely differemrtstructuresmmd mrnolecularsizescorriprisetIme system. Reservoirfluids are mainly composedofInydrocarhonswith smnmrlarstructures.Tineir phasebeiraviour,therefore,is not generallyhighlycnirmplex.
TIre phasehelnavioumrof a hinanysystem.although relatively simple,is very much similar to acurt imruilti-comnnponentreservoirfluid. It is, tlnercfore, an appropriatesubstitutefor explaining
tine qunalituntive betmaviounrof reservoirlrydnx_’arhon mixtures,
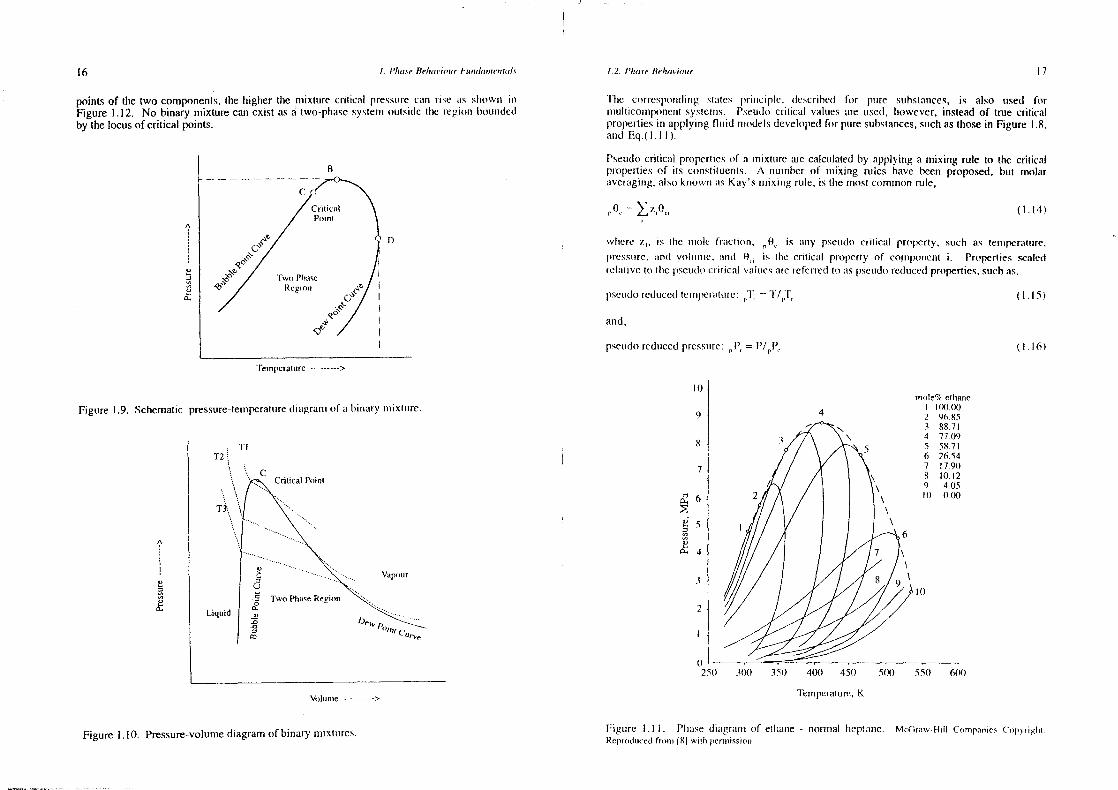
line pinunsenile inruircuntes that inn a hmmrary vapour—liquidsystem, both the temperatureandthepressureareimrulepeindemnlvariables. TIme pressure-temniperattmrediagramof a binary mixture issclnennatmcatiyslrowim inn Figumre 1.9. thephraseenvelope,insidewhich the two phasescoexist,rs bouiimulcd by tIme buibble poimrt mmmmul chewpoint curves. ‘flme two curvesmeetat the critical point(C), where mill dnfferences between lIme two plnunses vanislr and the phases beconnenmnnlistmngtnishiatnlc. None tlmat tIre two plrasescan coexist mmt somec(inditions above tire criticalpnnnmrt . llme highest trressnirc(13) annul the higlmesl tenmrpcratumre(D) on the phraseenvelopeareemil lent tIre (rnu(n,n(/(’,nlra,- mmmd tIre cri(o,i(je,nt/me,-m,rcspcclively.
rlre piessure-voluimmediagramof a binary mixturre is schematicallyshownin Figure 1.10. Notetlnat tIre systemnnpressuredecreasesduringant isothermalexpansionbetweenits bubbleanddewpoints, conntrunn-y to Ilumnt for a punmeconrrpounnul.
TIre plrase diagranrof a mixture is determimnedby its comtrposition. Figure 1.11 shows thephumsediagram of etlmane-Imeptaniesysnenn. ‘l’lce critical temperatureof different islixtures lieshetwcenmtInecritical tenrmperaturesof tIre two pure comrrpounds. Thecritical pressure,however,exceedsthevaluesof boOm commipomnentsaspure, in mostcases. Tire locusof critical points isslrosvmn by tire daslned litre in Figures 1 . II - The greater thedifferencebetweenthe critical
The volume of cylinder, containing 1kg of the satunratedliquid butane,is:V=mnifp=I/425.3=0.0023
51m’
I. P/noseRe/mnn,nn’nmrFnnpnnla,nne,nt,zI.s I 2 I’/nase Aelmavionnr
points of thetwo components,the higher the mixture critical pressurrcearn rise as sinnnwn nmFigure 1.12. No binary nrixture can exist as a two-phrasesystennoutside tire region boummdeulby thelocusof critical points.
B
A
a0
Figure 1.9. Schematic pressure—tenniperaturedi~ngrammmof mm birnary mmrmxlunre.
A
0U
Temperature >
I)
‘lime cnnrrespomnding slates prmrrciplc. described for pumre stibstances, is also used formniuhitcomurponenrtsystetnrs. Pseudocmiiical values mire used, Imowever, insteadof true criticalpropertiesin applying fluid niouhels develuipedfor ptrre strbstances,suchasthosein Figure 1.8.amnd Eq.(l.Il).
Pseudocritical propertiesof a mixturre are calculatedby applying a mixing rule to the criticalpropertmesof its constituents. A rrumber of mnlixing nrles have been proposed,but molaraveraging,alsoknown asKay’s nnixinng rule, is themostcommonrule,
,0~~ (1.14)
wlrere /,, ns tIne mrroic inuncninnn, ~0 is unmry pseudocritical property, such as tetnrperature.
pressure.mmmcui volimmmre, mnnnd 0, is lice cnnticmul properry of comnponemmt i. Properties scaledrelumnive to tine pseudocrnnical vunlumesarereferredto IIS pseurdoreducedproperties,suchas,
pseudoreducedtennrpenatuire:n-i; = l/~T~ (I . IS)
and,
pseudoreulucedpressuire:~ = ~ (I . 16)
0~
C)
a
1:10~
to
9
8
7
6
5
4
.3
2
it250 300 350 400 450 500 550 600
Temperature,K
16
C
17
‘1’ IT2
CCriiicat Poini
Vapniur
m,,te% citnanneI i()0.002 96853 88.714 77t)95 58.716 26547 7908 10129 4.05it) 000
‘i/tnt
Voiunne >
Figure 1.10. Pressure-volumediagramof binary mmxtures.Figure I .11 . Phrase diagramof etlrane — normal hreptane. Mcflraw.}tnhl Companies C’,ipyrig)niReproclunceutfrn,nni f81 winin l~enmnissonn
18 I. P/nose8e/nnr,u’nnnFnundunnnrenikn!.c 1.2. P/muse Belman’ionnr 19
Tire true critical properties,however, are different from the pseundo values calcumlaled byaveraging.The truecritical pressureoftenshows theirighest deviation froirn tIme psen.mdovalue,as evidencedin Figure 1. 12. The predictionof true critical propertieswill be ulescmiheul innSection 5.3.
Temperature,K
350 400 451)
12
Ii)
~1
a)ais
0~(a
4
2
()
Figure 1.12. Critical loci for binary mixtures. McGraw-Hill ConrnpunniesCopyrngirn Reproducedfronn
181 n~imtnperunissiorm.
A
U
0~
Crinical Poinmi
A typical phasediagram of multi-coisrponentsystem at constantcomposition is shown inFigure I. 13. Vapourand liquid phasescoexistat any pressure-temperatureconditionswithinthe phaseenvelope. Tire liquid/mixture volumnietric ratios are sirown by theconstantqualitylines. Note ttrat tIne distamicehetweemriso-volumeor quality lines decreasesas thecritical pointis mmpproached.Smmrmmll pressureor Iennperaturechangesat a regionnearthecritical point causemrlajor phasechamngcs.
Figure 1.13. Plnmtsedimmgramnof a mnulticomponentmixture.
An isothermalreductionof pressurefor a vapour-likefluid, PointA, forms the first drop ofliquid at tine dew poinit, Point B. Further reduction of pressurewill result in furthercondensation,asindicatedby tIre qumality lines. This plretromenonis known asthe retrogradeconden.cutw,n. Tlre cuindensationwill ceaseat somepoint, Point D, andthecondensedphasewill revumporiscby fuirtlmer reduction of pressnire. TIme shadedregion of the phasediagram.wlmcrc pressurereduciiomr resumltsjim comndensationis referredto as tIme retrograderegion. Notemlnunt tIme mrhovebehaviniuiroccursonly if the gastemperaturelies betweenthe critical temperaturemind Ihe cric(imrdentlnemnmr. Figure I - 13 slrows that there are two dew point pressuresat anytermmperatunrefor retrogradegases.Tire upperdew point is sometinrescalled theretrogradedewpoint. Tine lower ulcw point is of little practicalsignificancefor mostgascondensatefluids,
Time relative posilion of tIre critical poimin to the cricotrdenthermand the cricondenbaron thephmmseemnvehopecan leadto other retrogradeplnenomena. Figure 1. 14 showsthat an isobariciircreaseof tenipcratunefrom poinrt I to point 2 resultsinn condensation.This behaviour,whichearn mnlso he cunllcd rerogradecuindeirsation, is of little interest in reservoir operations. Itindicates,however.limat rmmisirmg tIne tcnmrpcralumreof a high pressurerich gasmaynot be a properiirocedimre to avoid conulensationinn fluid haimdling. Tlre vaporisationof liquid by isobarictennnperaturedecrease,simown in Figure 1.15, or by isotimermal pressureincreaseis known asretrogradevaporismution.
TIre vapour-liquidphasediagrannmof In typical mnulti-connponentsystem,Figure I . 13, describeslIne helmaviour of reservoir fluids inn nnnost cmtses. Thmem are, however, exceptional cases.Weinaugand Bradly [171 observedanunusualbelmaviourfor a naturallyoccurringhydrocarbonninixtureasshownin Figure 1.16. Note that an isothermalreductionof pressure,e.g. at 160°F,
100 ISO 200 250 300
in
0~asais0~
8tcnnnperamure >
Tennperature.°F
20 I. l’I,use fle/nani,,,nr Iim,n,Ja,nie,ifa/c
results in an increaseof the liquid volume after an imiitial norrnnuml helraviounr. A simrrilunmbehaviourhas alsobeen reported [18] for a multieorrrponenrtIrydrocarhonoil, as showmr iiiFigure 1.17. Note that the gas/liquid volumetric ratio increasesinitially below tIre bubblepoint, as expected. The trend reversesover a lmmnited pressunrerange,prior to belravingnormallyagain. Thecalculatedgasto liquid ratio mn mrnoiar nermir is showtm also inn Figure I. 17.The ratio increasesvery gradually over line winnie tested pressunme rairge, wiilrourt airypeculiarity. Thereasonfor theapparentdisagreemenntbetweentlnc two plots, is nIne cIrzmmnge unmolarvolumesof thetwo phases.
‘a0
/ 2 /‘/iace !/eIn,mC,ou,
K=(’Fm-459.67)/l 8 Mt’a=0.006895psia
21
Figure I . I 6. l’lnasc uhnmngmmmmmi of a hnynlm ocmnnhorm nnixtumre SPF Copyriglnn. Reprnxiuccdrrncnn Ii 71 wnllm
a~. I /1 ‘ Sm, fl
Figure 1.14. Retrogradecondensationat constantpressure.
A
0
U
0,
85 %
2.
70%
Liquid %
Temperature >
But,hie Poinn
Curve
SI
Crnuical ~ ciPoinn ~
-o0
t4
1.20~
-5
CI I) —
0.82(’0 265 270 27.5
t’rcssure, pa
Fngunne I . I 7. Varnuniions of gins In liquid rmmtio by reduicimrg pressurebelow humhhlc poinnt pp
(‘PyngIni Rn’pr~~duccdtn,,nnn (81 wnltn pcnnnnissll/nn.
A single plnunseIryuhrocarbonrreservoir flumnd mayfornn rrnore (Iran two phasesuhumimrg depletion.Sohnd. or senini—solndpbrunses, such as aspiraliemiescan formrn at sonume conulinions. A bnighn
pressunregums, rich in lrychrocarbotmconnpounndsof different lnonrologous series, mnray corndensetwo imninriscibleliquid pirumses,eaclr rich with one structuraltype of molecules. Gas mixturesrich inn C02 or ii2S at low terirpermniuresearn formrn a rich liquid phase imnniccihle svifin tinehyulrocunrhomiricin coundensatephase.
0%
t)ew t’onnnl(n/rye
207,.
1/
Volnnnmnc Ranio
-.-
‘S. 5%
tni,,Ic R,~ri,,
Figure 1.15. Retrogradevaporisationat constantpressure.
22 /. /‘/,ace Refnrn,n,’,,r F,,,nthnnn,’,nwla I. .1 (Ia.uuifin-a iron of Re.uerroir Fluids 23
1.3 CLASSIFICATION OF RESERVOIR FLUIDS
1’he typical phasediagramof a reservoirhydrocarbonsystenni,shown inn Figunme I. I 3, cummm beusedconvenieirtlyto describevarious typesof reservoirfluids. A reservoircminnnuminrs gins if itstemperatureis highertlran thefluid critical tennperatnmre.otherwiseit comrtains(nil lIne depletionof reservoirwill result in retrogradecondensationinn tire reservoirif the reservoir temmnpermmturclies betweenthecritical temperatureandthecricondentherm,whereasno hiqumid will forrmm if it isabovethecricondenthcrm.Theoil in a reservoirwitln a tempermulunreclose to its critical point ismorevolatile thanthat at a lower temperature.A smmiall redinction (if pressurehehow tine bubblepoint, in a reservoirwith a temperaturejust below thefluid critical tennperatumrc.mumy vumporisehalf the oil volume. It is evident, therefore,that thelocation of reservoirtemripem’ature(in tInephasediagramcanbeusedto classifyreservoirfluids.
Time temperatureof a reservoiris determinedby its depth. The phrasebehaviotirof mm reservoirfluid is deten’ninedby its composition. Typical comnnposmtmomnsof variotms classesof reservoirhydrocarbonfluids are givenin Table 1.2. Critical temperaturesof heavy lnydrocminboirs atehigher than thoseof light compounds. Therefore, the critical tetrnperatunreof Irydrocarbonnmixtures predominantlycomposedof heavy connpoumidsis higher tinmnn ttrc nnunnnmmmml mmnmrgc (if
reservoirtemperatures,andthesefluiuls bebnaveliqumid-Inke, i.e., oil. WlnercastIne teirnperatuimu’of a reservoirmainly corniposedof urethane.witlr a critical lemunperaturreof I 91)6 K, will behigherthanthemixture critical temperature.
Table 1.2.Typical compositionsof variousreservoirfluids.Cuniponeni.Moie% D~yGrsGasConden.saieVotaintcOiI
625 029 012i)kmck OnI
0 n6N2C02 234 1.72 1.50 0.91Ct 81.13 79.14 69.59 36.47C2 7.24 7.48 5.31 9.67
C3 2.35 3.29 4.22 6.95iC4 0.22 0.51 0.85 144nC4 0.35 1.25 1.76 3.93iC5 0.09 0.36 0.67 (.44nCS 0.03 0.55 1.12 1.41
C6 0.61 1.22 4.33Cli’ 4.80 16,64 33.29
Whenthereservoirpressurefalls belowthe saturationpoint, thephasediagramrm of tIne origimimtlrcscrvomrfluid is no longervalid. Gasandliquid phasesareproducedata ratio differemrt to thmntin the original combined state, resulting in changesof the overall comnrposition. l’liegravitationalsegregationof thetwo phaseswith differentdensities will also inimihit the contactbetweenthephases.hencepreventingtheachievementof equilibrium throughourttIne reservoir.
In a hydrocarbonreservoirconsistingof a gas cap and Inn oil coiunnn two separatephasediagrams,onefor eachphasecan heconnsidered.The two phasesare both suntunratcul.with tInesaturationpressuresideally equal to the reservoirpressureat tIre guts-oil contact as slnowim inFigure 1.18. 1-lence,when a saturatedgas reservoir is discovered,an oil coiunnnbelow it isgenerallyexpected. Similarly a saturatedoil reservoirmay strongly indicate tine presenceof agascap.
Petroleumreservoirfluids canbeclassifiedaccordingto variouscriteria. Althroumgh identifyinga fluid as gasoroil is adequatein mostphasebehaviourstudies,it is morecomrnron to classifythefluid in accordanceto its volumetricbehaviourat thereservoirand surfacecomnditions. Thisapproachyields a few setof formulations,knownas material balanceequations,which can beappropriatelyappliedto eachclassof fluid for reservoirstudies.
A
‘a
0,
Figuire I .18. I’Inasc dimugrutmosof segregumtedoil and gasphasesin (lie vicinity of gas/oil contact.
lIne reservoirfluid is prouluceul annul nnieastnredat tine surfaceas tire stock tank oil and gas atstmmnndunrdconditions,assitowmr sclnenimnticallyin Figure 1.19. As the material balanceequationsrelatetire tnro(luicc(I liuuiuls to thoseinn theneservoir,tIre initial producinggasto liquid volumetricratio is considcrc(lmrs lIre nm(nsl iunpiinlant innuhicatorof Itme classof a reservoirfluid. The gastooil rmmtio. ((.)R, is rnrost corrmtmn(nnrly nlcinimed as tIre nnurrmberof cubic feet of the associatedgasprodurcedat stamndandcomrditionms lien barrel of stock tmnnk (nil in tire Field umnits. For gas—c(nnndemrsatcIluids, wlrere tIre pnodrncedfluid is predomnninantlygas. the inverse of the aboveulcfimnitiomi. kmnown asline courdensateto gasratio, CGR, is oftenused,
Figure I .19. Sclnenniatic diagranur of slabilising producedoil as stock tank oil and gas atstandardconditions.
‘l’lne stock tankoil gravity generallyvaries significantly for differentclassesof fluids, henceitcmiii alsoheusedas air inrdicmrtor. ‘lIne gravity is expressedas APIdegreesin field units,
°AI’l = ( 14 ISIS,,) — 131.5 (1.17)
whereS0
is tire stocktankoil specificgravity,orrelativedensity,to waterat60°F(288 K).
Thre concentrationof lremmvy fractionn, C5~
,in reservoir fluid correlatesreasonablywell withGOR. As tire stock tmmmmk oil is minosnly connrprisedof tIns fraction, it can also he used as aninrdicmmtorof tIme reservoirfluid type. Figuire I .20 shows that an initial producingGOR of 570v/v (3,200SCF/S’I’B) and 12.5 nmole%(‘~ are valid boundariesfor gasand oil systems[19],assimuwn un Figure 1.20.
CriticalPoinl
Iemnnperaiurc >
Gas Gas
Receuv,nirt)iI
24 L Phacefie/,a,’i,,,,, F,,<v/a,anr,ntrnI, / .1 (/ar.n/ka/rorn of Ren,,i’o,, 25
0
tooGas(‘o,n,ie,,sa(eU
Ojt a
700
500em
ci30(t
7.5 iO0 m2 5 50 75 20(1 225
C7
+ nnroie %
Figure 1.20. C7~
—GOR relation for typical oil amid gas connulerrs~mtefluiuis. (‘~nIrrcsyu’l tOniPnnbticanionInc. Reproducedfrom 1191.
The mostcommon methodof identifying petroleurnsnreservoirfluniuls is to elassily Ilnerin mms drygas,wet gas,gascondensate(retrogrmndeguns), voluntile oil aundblack oil.
Dry Gas
Dry gasesare predominantlycomposedof ninetiraune an(l nonn-hyulrocumrhionssuch uns mnitnogenrandcarbondioxide. Figure 1.21 sirows tire phase(Iiuugrunnnr of mr ulry guns. ‘[‘Inc hillase enrveiopeis relatively tight andmostlylocatedbelowthe anthienrttemperature. Note that the gasremrrainnssinglephasefroni thereservoirto time separatorconditions. Water, Irunwever,mmnuny conndennscatthesurfaceconditionsdine to thegascooling. Fyi’ tests in tine laboratoryare iinnnitc(i to tine gunscompressibilitymeasurement.
A
U
0,
Reservu,nr( rni,c,ntI’,,nni
///~~ Separator
Wet Gas
A wet gins is mnnunrmiby eonnihnoseulof nnuctimumncamrcl other light conipoinentswitir its phraseemnvelopclou’unled entirelyover um tenrnpcrmn(uirerminngc below ihumt (nf lIme reservoir. A wel gas,therefore,willriot drop-outcondens~tcinn line reservoirduringdepleti<nnn,(1)10 (2), as shown in Figmrre I .22Thesep~nruntorconditionslie, however,;vi(hin tIre phaseenvelope,prodtmcimrg sonmneconnulensateat tine surface. Gas iicld.s nnn line SouthernNoriii Seun mire gounui exanmnplesof this type ofres&’rvomrs.
A
dl,
ice I’, ,,m,i (‘urve
(7ntinil/ ~i’u,nitç li
9V~’t~.III 5 2
( . Rc’st’rv,,i r
~ Sepsu,nnon
lenruperanunre
Figunre 1.22. Phasediungramnnof wei gas.
As inn connulenrsunleis mmmcd inn tine rcsenvomr, nnnaneuial b~nlumnrceequninlionns for a dry guns areequullly sunnt~nlnlei~nrun wu’i guns ‘[Inc ninly l’Vi’ test ncquninu’d unl line reservoircomndmniuinnsis the ginsconnrpressibilntynnneumsurcrnrennn. Su’punruutortestsurru’ gcmnerally comnuluncledto detennnnnretime unnniounnntunnd propertiesof tine condensedpiraseat tine sumrf~ncecomnulntions.
A wet guns reservoiris connnnnnounlyprodumeeciby siminpie halow-dowur, simnnilunr no a dry guns, ins riocnnndcurs~nteis fornmtu’ci mm lime neservoir. I’roducinmg gins to conrdensateratios aretypicunlly above10,01)0v/v (50,000SUI:/Sh’13) mid rcnrrunini constunnidunringtheentire life of tIne reservoir. FIreconrulenrs~ntecolour is tnsnrumhly w;nler-wlnite with a low specific gravity which rennrainrsninebmuingeul(itmri ing lint’ reservoirpruidurci iorn life
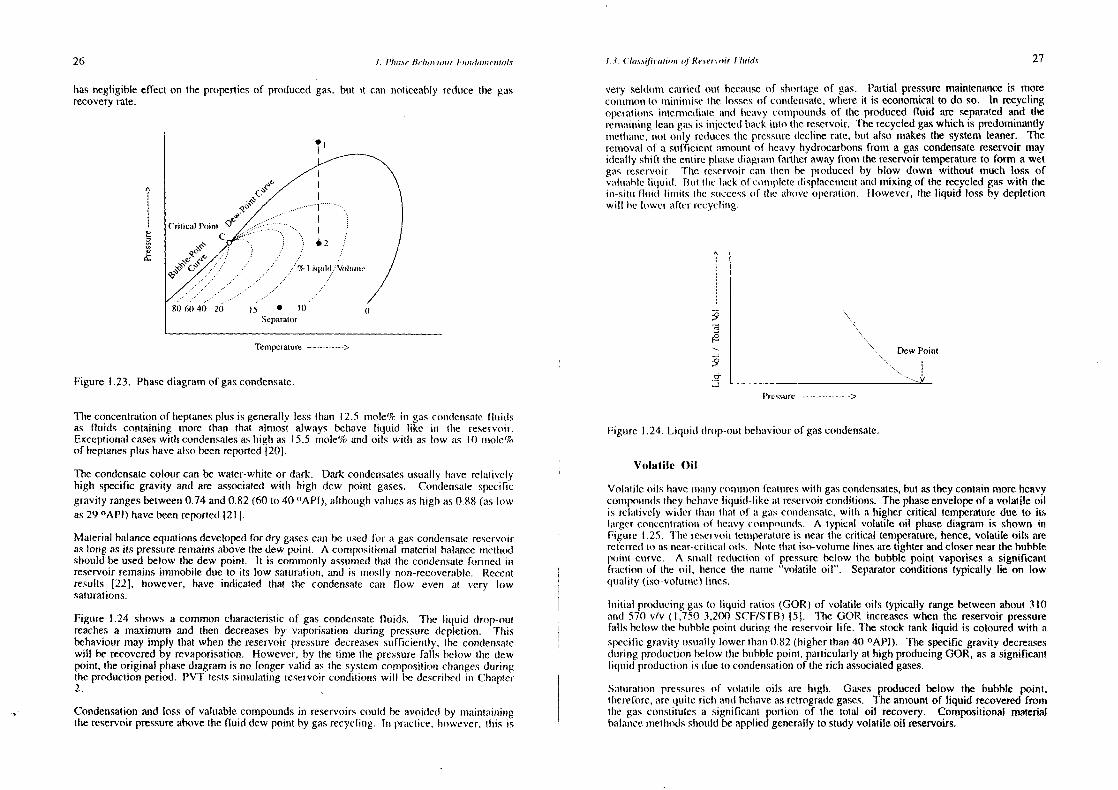
Gums (~ondeimsalt’
A iypnu’unl guns cn,nndu’nnsuntu’ phunse drungmuntni is slmniwni inn Fngunrc .23. ‘FIre presenceot lrn’znvyI mydune~nnhu,mrs exlnunni uls lIre plrinse envelope relint sc to a wet gmus, hence, n Inc reservunmtcnnrpemunitmue lies inctwcu’nn (lie crinical poini andtine crieonndemntlnernrr,Thegaswill (In 1i~ourn I iu
1uiid
by in2lmogiaule eunnndenisationninn (inc reservoir,whenfire pressunrefalls below ttne dew point, fmomnn1)10(2) inn Figunre 1.23. Furtherconnulemrsationfronni tire producedguts alsooccursat sepumrumnor
comiulmtiomrsulnie to coolming.
‘[lie uuinmoimnt of1
siternlinlly coniuiennsahleimydrocmnrhorrs irr the reservoir increaseswith limericinnress of tlne guns. as Ineavyconnpounrdsshifi thecritical temperaturetowards the reservoirtemnnperiiture. WIncn’c~nsu gaswiihn a cricu,ndenitlnernmnntear thereservoirleniperaturewill behavevery mmntnclr like a wet gas. Gasto Iiqumid ratios range helween570 to 30,000 v/v (3,21)0 In150,01)1) SCF/STB)ll9J. For practical punrposesIn gins condensatereservoir with a GOR ofmnhove 1(1.000v/v (50,000SCF/S’FhS)earnhe treatedasa wet gas. l’he producingGORinitiallyremnnunimrsconrstamri unntii tire reservoirpressummefalls below tire utesvpoinl and increasesthereafter.For guises willr G()R of unhove 20,001)v/v (100,000SCF/STB), time condensationin reservoir
U
Temperaimnre >
Figure 1.21. Phasediagramof dry gas.
26 I I’hone J(,/n,n,no,,r1,u,u/,p,,,,mti,I.u 13 (‘l,,s.snfln,rrr,n,n of Reuem,,,ir f (nod, 27
hasnegligible effect on thepropertiesof producedgas. hut it can noticeably reduce the gasrecoveryrate.
A
U
a:
Figure 1.23. Phasediagramof gascondensate.
very seldom cmrrrieut out beemunseof shortageof gas. Partial pressuremaintenanceis morecninnimon to minimnnise the lossesof condensate,where it is economicalto do so. In recyclingopcrmitionns inn(ennneuliumle mnnnd heavy connipoundsof the producedfluid are separatedand thereirraitmimig leaurgasis imr~cctcdhack inrio tIne reservoir. The recycledgaswhich is predominantlyrnrellnmnnre, not only reducestire prcssunredeclinerate,hunt also makesthe system leaner. Therennrovalof a sufficient amountof heavy hydrocarbonsfrom a gascondensatereservoirmayiulcmnhly shift theentire phraseuhiagramni fartinerawayfromni thereservoirtemperatureto form a wetguns reservoir. ‘[Inc reservoircann tlren he producedby blow down without much loss ofvuultm~mhlcliquid. lInt tIne lack of conmipleteuiisplmmcemmnentmind mixingof the recycledgaswith tIreinn-situ fluid limnnits tine stnccessof tlne ~nhuveoperatiomr. Ilowever, time liquid loss by depletionwill he lowermufter recychnng.
A
‘a
:9‘a’
‘-I
Dew Point
N—V
Pressure >
‘l’he comrcentrationof heptanesplusis generallyless tinan 12.5 mnioie% inn gasconndemmsatefluidsas fluids containing tniore than tlrat alnuost always behavehiqunid like in thne reservoir.Exceptionalcaseswith condensatesashigh as 15.5 mrnole% and oils witir as low as 10 tnmole%of heptanesplushavealsobeenreported1201.
The condensatecolour can be water-whrteor dark. Darkcondensatesusually irunve relativelyhigh specificgravity and are associatedwith higlr dew point gases. Comndeinsalespecificgravity rangesbetween0.74 and0.82 (60to 40 °AP[),althoughvaluesashigh mms 0.88 (ashow
as29 °AP1)havebeenreported1211.
Material balanceequationsdevelupedfor dry gasescan be usedfor a gascondensatereservoiraslong asits pressureremainsabovethedew point. A composilionnalmaterial balancemethodshouldbeusedbelowthe dew point. It is commonly assumedthat the condensatefornned innreservoirremainsimmobile dueto its low saturation,and is mostlynon-recoverable.Recentresults [22]. however, have indicated that the condensatecan flow even at very lowsaturations.
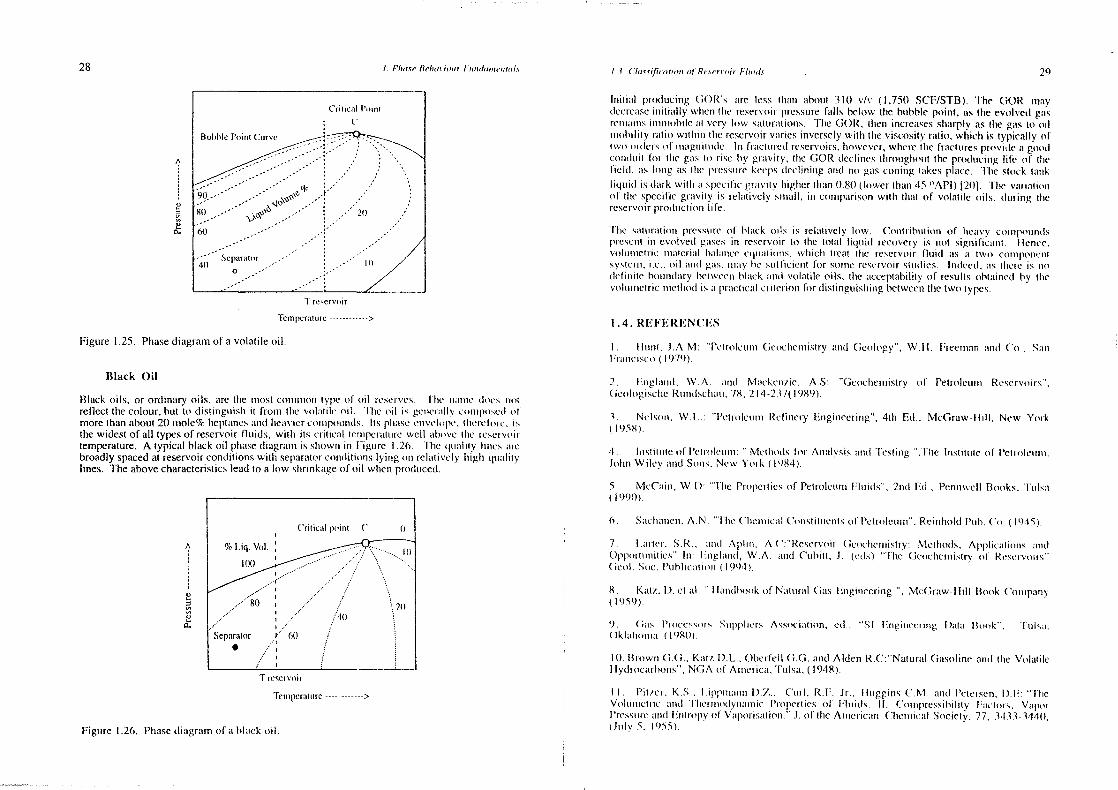
Figutre 1.24 shows a common characteristicof gascondensatefluids. TIne liquid drop-outreachesa maximum and then decreasesby vaporisationduring pressuredepletion. Thisbehaviourmayimply that whenthe reservoirpressuredecreasessufficiently, Ihe condensatewill berecoveredby revaporisation. However,by the time the pressurefalls below thedewpoint. theoriginalphasediagramis no longervalid as tire systemcompositionchangesduringtheproductionperiod. PVT testssimulatingreservoirconditionswilt hedescribedin Cbmmpner2.
Condensationand lossof valuablecompoundsin reservoirscould be avoidedby maintainingthereservoirpressureabovethefluid dew point by gasrecycling. lIn practice.Inowever, this is
Figunre1.24. Liquid (Imp-out behaviourof gascondensate.
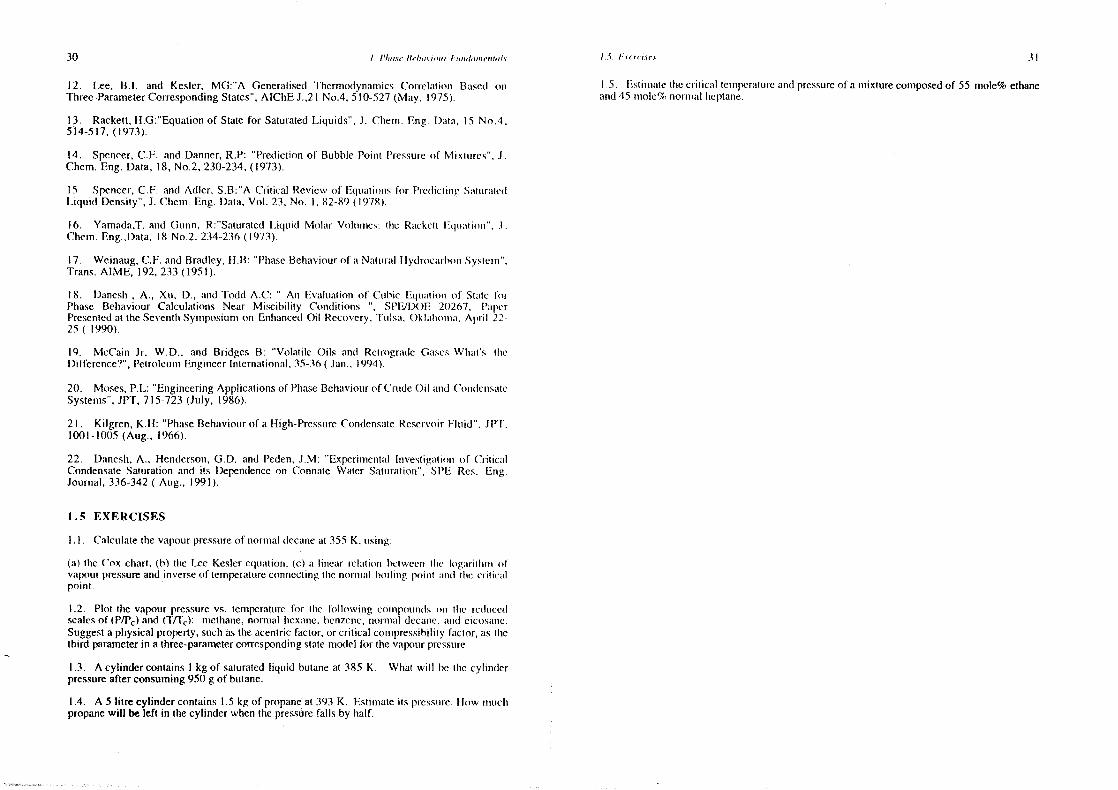
Volatile Oil
Volmmtile oils hmmve mnnlnury c(innnnsnonfemniureswith gasconrdensates,but astheycontain moreheavyconnrponnnndsItrey hehurveliquid-like unt reservoirconditions. Thephaseenvelopeof a volatile oilis relmrtivcly winIer nlnamn llnmit of mm gascontlennsate,witir a higher critical temperaturedue to itslargerconccntrationnof heavycommnpotmnrcts. A typical volatile oil phasediagram is shown inFigure 1.25. Tine reservoirteninperaUtreis nearthecritical temperature,hence,volatile oils arereferredto asnear-criticunioils. Note tlratiso-volumelines aretighter andclosernearthebubblepoiurt currve. A snrmmnli reductionn of pressurebelow tIre bubblepoint vaporisesa significantfraction of the oil. hennce the name “volatile oil”. Separatorconditions typically lie on howquality (iso-volunne) lines.
Initial producingguts to Iiquiul ratios (GOR) of volatile oils typically rangebetweenabout310mmmd 570 v/v (1,750-3,200S(’FISTiI) (51. The GOR increaseswhen the reservoirpressurefalls belowtire bubblepoint durinng the reservoirlife. Tire stock tank liquid is colouredwith aspecificgravity umsununhly lower than0.82 (higbner than40 °API). The specificgravity decreases(luring produmctiounbelowtime hunhblepoint, particularlyat highproducingGOR, as a significantiiqsnid productionis due to condensationof the rich associatedgases.
Saturation pressunresof volatile oils are high. Gasesproducedbelow the bubble point,tlmerefouc,mire quite riclm mind heirmmveas retrogradegases. Theanrountof liquid recoveredfromtIne gasconstituhesa sigmnif’mcant portion of the total oil recovery. Compositional materialbalancenretlmodsshroumld he appliedgenerallyto studyvolatileoil reservoirs.
Temperauunre >
28 1 P/nnn.s,’ Reluin’,on,, I’ ,u,nd,n,,n,’nnnnl.n / I (‘(o’uirfin(mtnnn of Resernoirb/nod., 29
Black Oil
Black oils, or ordinmnry oils, mnrc the Inmost connnmnromntype of oil reserves. ‘Flit’ niunnnne dunesriotreflect thecolour,hunt to uhisimngunnslnnt fmorrn line vunlunt he on I. Tire iii I is gemncn~nliv u’uninuposeulofmoretharnabout20 nnole%heptanesamnd lreumvmercomnipounrds. its pimunse emnvu’lnnpe. nineneiniru, isthewidestof all typesof reservoirfluids, witlm ins critical iennnpermnturmewell mnbnnve tire reservunirtemperature.A typical blackcml phuusedimrgrmnnnn is shrowir mn Figure I .26. lIre qinumhity limes arebroadlyspacedat reservoircondmtronswitlr seputruntorconnlmliuins lyinmg (inn relatively lnigbn qurinhitylines. Theabovecharacteristicsleadto a low shrinkageof oml wlnen produrceul.
lnntnunl prurducmng GURu mire less tlnumnn about 310 v/v (1,751) SCF/STB). The GOR mayulecreumsemmritn~mhlywiienr (tie reservoirpressurefmmlis below tire bubblepoint, as theevolved gasrenmtumnnrsmmnmnrnn hrle at very low s~nIunmuninouns. The GOR. Ilrenm increasesslnamply astine gIns to oilnnmohnIn ty ratno wit Inn nn lire reservoirvariesinverselywitlm tire viscosityratio, winicir is typically oftwo nnmuiersot inniugirnurde. In frunctinred rcservonrs,inowever,svhereIhe fractunresprovide a gounulcomnltnii for (lie gins Inn risc by grinvi ty, line GORuicu’i inres tlrrouglrount the produncinnglife of tinefield, mns mug aslIre pressurekeepsdcclinnimng annul no gins corrinng imnkes place. The stunt-k tuunnk
I nqunnd ns dark witlm In specnInc gravity lmmginer Ihtmnmn 0.80 ( lower ihrmtmr 45 niAPI ) 12(11. ‘lIne vumm iuntionrof tIne specific grurvniy is relmniivcly snmnahi, in comparisonwith that of volatile oils. dunring tInereservoirproutumctionnlife.
‘lIne s~nlur~ntnumnrli~CS5OiCinf black oils is n’eluntively knw. Commlrihunfluin ~if inemrvy conrrponnmnnispresent inn evolved gunses inn reservonrto tIne total hiquunl recover) is miot signnificairt t lennecvnihnnnnicnmncnnma(eriai halunnicc eqnmintrunrrs, wInch trea( the reservoir fluid uts a twin conmnponentsystcnnn.n.e.,oil annul guns, mrnuny lie soiincienii for sonrne reservoirsiunnlies. Imnuiceul. ~nstincne is nundeIn in inc hounnrdunry betweein hi unck unnnd volunti he oils, the uncceponbihity of resurits uihtmuinu’d by tirevolunrmclmncnnrefiroutis’~ip acincunl cm nieriomr for uhistnnguislninngbetweentIne two types.
1.4. REFEREN(’ES
I ltnmnt , l.A. M ‘Petnolu’tninr Geunclru’nrristry mnnd Geology’’, W .11. Preennnutnumnrd (‘ui, SunnnFr~nnrci,scni(1979).
2. Enigiunnid. WA. unnid M~nckcnniic. A.S: “Gennchenmnistry nif Petrolcunmi Reservoirs’.GcologiscireRunrnulschnuntn,78, 214-237(1989).
3 . Nd snurn. W .1 .. “Pcin unleunnmn Refinery Fnigrnreerinrg”. 4th Ed., McGraw—Il ill, New York958).
4. Inistniumie nil l’etnnulcnnmu: Methinids for Amraiysis’,nnmd ‘I’esiinng “.Tine lnnstinntcnil Petnok.uumnn.JohmnnWiley unnrut Sonns, New York (I 984).
5. McCuminm, WI): “line l’roperliesof PetrolennnrnFluiuls’, 2rrd Ed.. Penmnwell h3ooks.’l’umls~n(1990).
6 Suit-Inunnrenr. AN ‘‘‘[Ire (‘Iicmmnncunl (‘omislmiunenitsof l’etrnuleunnni’’, ReinihoidPub. (‘o. (1945).
7 I urn Icr, S.R , uund ApI inn, A .( ‘: ‘‘Rcservonr ( cou’licnmnisiry: MenIrods. Appiic:nt mmmv umnid()ppomtunniniics’ Inn’ l:nngiunnrd, WA. unird Cunhilt, J. (cdv) ‘“lire ( euncireimtistry nil Resemvonrs’’
euil . Sine. l’unhhicuilnoin ( 1994).
8 . KaIz. I). ci ~ni:‘‘ I luunulhooknil Natuirunl GaSEnnginicerinrg ‘‘, McGrurw—l Ii II Book Coinnpanny(1959).
9. ( ;a~l’rou-essors Suppliers Assnicmuitmuinn, cii: ‘‘St Fmngiince’rinng I )unlun ltunuik’’, ‘I nil~ui,)klunironmiun (1980).
hO. Browmr (1G., Kum(,, t).L., Oberfell (1G. and Alderm R.C:”Na(mnraiGasohimneand(lne Vumh~mliieI lydmocarhoirs”,NGA of Antreric~n,‘l’ulsa, (1948).
II. Pit,en. KS.. l.uppnmrannmn1)7.., Cmii, R.F. Jr., llumgginms (‘.M mmmd l’eterscnn, t).E: ‘“l’hneVohuunnieniit’ unnnull’hemimnun&lyniumnnrie Prnipcrtics of Fluids. II. (‘onmipnessilnihity Fuiu’tors, Vunpummhiressunnu.annul Ennt i nipy iii V~npumris~nnionr.’’J. of theAnrierieunn (‘lmenrricuui Society. 77. 34333441),(Jnniy 5. 1955).
A
U
(‘rinncal t’nimnt
tPumnnrcurvt
99...” ,....‘ ~
20
60 ,Scpar~nmnnr .‘‘‘
400
Figure 1.25. Phrasediagramof a volatile oil.
‘I’ rc,ervn,nr
Terniperunnunre >
A
Sn‘a
I,
0~
Critical point C’ ((
/ 20
~40
Separator .e (it) /
S ,,..“~
T reservoir
feinipm.’riiture >
Figure I . 2(n. Plrmnse(Ii uigrannnof mu hImit k oil.
30 / /‘/na,ce Itehnnn’n,,nnn ( ,nnn/,nn,nn’,ntnnln I ~ (‘ n (Prune, .31
12. Lee, B,t. and Kesler, MG:”A GenerahisedThermodynairnicsCorreluntiomm Bursed on 1.5. EsttnmrmrtetIne eritmemnl tennnpcratureairdpressureof a mnnixtureconmnposedof 55 rnole%ethaneThree-ParameterCorrespondingStates”,AIChE J.,2tNo.4, 510-527(Mmmy, 1975). amrd45 nmmolc%nornmnmii Ireptaune.
13. Rackett,H.G:”Equation of State for SaturatedLiquids”. J. Chem. Eng. Data, IS No.4.514-517,(1973).
14. Spencer,C.F. andDanner,R.P: “Predictionof Bubble Poimit Pressurenil Mixtures”, J.Chem. Eng.Data, 18, No.2, 230-234,(1973).
15 Spencer,C.F. anti Adler, S.B:”A Critical Reviesvof Equmationnsfor PredieimnngS~ntrmr~ntedLiquid Density”, J. Ctrennn. Eng. Data, Vol. 23, No. I, 82-89(1978).
16. Yamada,T.and Gunn, R:”Smmturatcul Liqumnd Molar Volunmnnes: tire Rumckenl l/quiuu( mum”, .1Chem. Eng.,Data.18 No.2, 234-236(1973).
17. Weinaug.CF. and Bradley.11.B: “PhraseBehaviorirof um Natunral I lydroeunrbomrSystennr”.Trans. AIME, 192, 233 (1951).
18. Danesh, A., Xum, D., mind [odd AC: “ An Evumlunationi of Cunhie Equnmutiumni of Stunle OurPhase Behaviour Calculations Near Miscibilmty Comrdnlions “, SPE/DOF 20267, PumperPrcsemrtedat theScvetrthmSynrposiumnronr EurhrmmnceulOil Recovery,TumIs~n.Oklunlnoinuun, April 22—25 (1990).
19. MeCain Jr. W.D,, and Bridges B: “Volatile Oils and Retn’ogrurule Gases-Wlmuit’s tlncDifference’?”,PetroleurmnEngimrcerImiternuutiourmnl, 35—36 ( Junmi.. 1994).
20. Moses,P.L: “EngineeringApplicationsof PlraseBebraviourof CrundeOil ammd C’onmdensateSystenrs”,JPT, 7 15-723(July, 1986).
21. Kilgren, K.H: “PhaseBehaviourof a 1-ligh-PressurreCondensateReservoirFlunid”. JPT.1001.1005(Aug., 1966),
22. Daneslm,A., h-lenderson,GD. and Peden,J.M: “Experimental lnvestigatinitn of CriticunlCondensateSaturationand its Dependenceon ConnateWater Saturation”, SPE Res, Enig.Journal,336-342( Aug.. 1991).
1.5 EXERCISES
1.1. Calculatethevapourpressurenil normalulecaneat 355 K. unsung:
(a) tIre Cox chart,(0) tIne Lee—Kesler cquatiomr. (c) a Ii nrear rehat urn betwcemi I Imu’ iiig;in ill mini nutvumpoumpressureand inverseof temperatunreeonncctnnngtire nomnniuml hoihinmg point mind lIne criticalpoint.
1.2. Plot tIre vapour pressurevs. tcnnpcrattmrefor thre following eonnpounn(Ismm lire reduncedscalesof (P~P~)and (l’IF~): nietirane,normal tmexmnne.hcnzene,nnorniumml decunne.mmmd cicosmnnme.Suggesta physicalproperty, suchastheacenlriefactor,orcritical cornrpressihilinyfmmctor, as thethird parameterin a three-parametercorrespondingstatemodel for lIne vapourpressurre
1.3. A cylinder containsI kg of saturatedliqunid butaneat 385 K. What will lie tine cylinderpressureafterconsuming950 g of butane,
1.4. A 5 litrecylindercontains1.5 kg of propaneat393 K. Estinniate its prcssumre.Flow mrmumclnpropanewill beleft in thecylinder whenthe pressurefalls by half.
2PVT TESTS AND CORRELATIONS
Aecnnraiemind n’eiiunble phrasehelrunviuutmr mnnrd voltnmnuetric data are essentialehennemrts for propernnramnagemrnemmtof petroleunnnreservoirs. ‘lIre inforuriation is required to evalumate reserves, todevelop line optinmnmmnir recovery p1mm, anul to determnimrethe qumurlity mnncl qunaiity of produmcedhiumiuls. Most reservuuirsmire produrcedby depletonin wlmtch tine reservoirpressunreuleelnrmes Itsfouls mire rceovem’euh. lire reservoirtemnnperatumrcstays practically cotmstanr( inn nmrosl recoverynnnetlnods. ‘tine nnmainr variable Ihumt ule(cn’nuiinnes line huu’Iravnonrr nil t hunids, ummider reservouru’nnmnulitimnmns. uinnnimug du’pleninnnu is. iimu’nei’mnrc, (Ire nescnvnuimpressunne. Hems-c, rcla(nvt’Iy snnnmplctests whit-in sinmnunlatemt’u’mnveny himuin’essesmine cnummdmmc(cnlby vuuryinmg tIme flnnnd pmcsstirc. ‘lIne mmcmiiienmmplmmiv is is omr tIne vunlum mmmetrme ulmnlmm ~nttIre reservonr mnnnul vuriace 1cm n pcraturres.Imenree time nanmre(pressumrc—volumnne—tennnper~mlmrrc)PVT datmn.
1mm tIre simnnplcs( appi’oincln of predietinngtire PVT (Immua, tIre reservoir oil is cnunsidt’reul tim heconnrpnuseuiof two pseunulnucnnmmrponremnts,i.e., gmns mmml tiil. These pseumulo conniponents,unnciulemrtilied my flunstuimmg lIne rcservonrllummtl at lire stanrulumrd comrdnlruins, and chnar~mcternsmmngtinesepan’mmteul gmns annul mu phn~nscsby tlneir specific grunvity and mmnuulectmI~ur wengirt valunes.(‘onmrposiiiomruul d~ntmm on tIne procluncetl t’Iumids are nnaimrly determnnineul for timeir mnpplncationns inIrydrocarhornprocessinng.
‘lIne prune innfonnumntionm fronrr PV’l’ les(s mire tine ratio of pirase volunnnueat reservuimrcondihonnsInnthat urt surface coniuhitionns, mind the solumbihity of guns in oil, l’he informationi is generallysmnflicicnt inn stnruliesnil hlumck oil reservoirs, and the ~npproachis referred to as line black onlnnnethrod. Ctnnrnpositionalstumdies, where uletailed innformaniomnon tIre fluiuh eonstitucnnlsmire usedto cslinnrmnteflumiti properties,uure oftern conuluetedftnr gas comndensmn(emind volatile oml reservoirs.Onnly in specialcasessuch as gasiniection ormiscibleulmsplacennentOreconrposrtionralapproaclris unseti for black oil reservoirs.
34 2 PV7’ l’esn.c and C’orreinmnm,nn.c 2.!. FlnmidSampling 35
A compositionalphasebehaviourmodel, in principle, is capableof predictingmmli tIne PVT dunta.usingonly tirecompositionof theoriginal reservoirfluid. The models,however,are reqmimelto be evaluatedand tuned againstthe measuredPVT data prior to bemng used in reservoirstudieswith confidence,as will be discussedin Section 9.3. The compositionmnl method.which can provide reliable information rapidly using advancedconipumlers.ms heennnnninng mmmorepopular. Empirical correlations annd charts, nrainhy renninisceneeof dumys wlneur inmmnulcalculationswere thenormto predictPVT data,however,arestill used.
In this chapterphasebehaviourconsiderationsrelatedto the smmmnnplnnngof reservoir fluids unncdescribed. The most con’mmonly conductedPVT testsmire detailed next- Selectedctrrpiriemmlcorrelations,to estimate PVT properties fronr himnnited Inelul data, are also givemr. ‘h’lresccorrelationshave bccn genermmtcbover years, insinig labonuntomy dmmtun. ‘l’hey wene nnnnustlydeveloped nriginally in grmupinicmui forums. Inn tIns honik tIre rrmmitlmennrmmlncmnl expnessnmnunsnil linecorrelationsarepresentedin preferenceo tlneir originral graplmical brims, lIne eoinelatmunmsunscfield units,andarereportedassuchin thischapter.A comnvem’sionr tableis giveun inn ‘I’ahle A.5 nunAppendixA.
2.1 FLUID SAMPLING
Reservoir fluids should be sampled as early as possible durimig time produnctnuor Infe nil mmreservoir. When tine reservoir pressure falls below the inntimul smmturmmtion tiressumre tIrehydrocarbonphaseformstwo phasesol gas and hiqumul. TIre mnrole ratno of time two plnasesflowing into the well is not generally equal to that formed in tIne reservoir. liennee, tirecollection of a representativesample becomesa inighly dennianuhiung, and in mommy casesairimpossibletask.
The samplecan be collectedeitheras a singlephaseat tIre bottonnrhole. svhenn mIne pressureisstill abovethesaturationvalue,or at tine surface. Time bottonmrIrole sanmiplcs areusunmnllycollectedduring formationtesting,prior to production. Surface sampling is conducted(in producingwells eitbner at the well head, as a samplerepresentingthe producingmixture stream,or asseparatedgasandliquid samplesout of theseparator(s).
As long as thereservoirpressurehasneverbeen below its saturatiomnpressure.and mm snnnglcphasesampleflows into the samplingbottle,tine chanceof collectnmnga represenrtativesampleishigh. Producingfluids, however,aregenerallyat two-phaseconditions. Ihemnce.tIre sanvnplmngprocedureshould aim at collecting both phasesat such conditions where tine suhsequnenntreconrhinationprovidestheoriginal reservoirfluid. SamsiplingproceuluresInave becnr discuissemiin details[I-SI. First, it should be ensuredtlrat representativefumitls are flnwimrg ount of tIreformnaniomn,by properlyconditioningthe well before sampling. Next, fluid sunmnnpiesslnounld Inccollectedfrom all co—existingphases.umnd recombinedurn tIne prodrncimng ratio. Sunnnrplnmngfronunanoil reservoir,pamnicumlarly ann unuiersaturatedorre, is relmmtively a mmmcli simpler tuisk tlnmnmr tlnumtfrom a gascondensatereservoir.
Well Preparation
In oil sampling,if thewell bottomholepressurehasfallen below tIne oil bubblepoint, the wellis generallyconditionedby a periodof reducedflow, followedby ashut-in periodof about 1-3days. This lowers the pressuredraw-down and raises the oil pressure,possibly above itsoriginalbubblepoint. Themethod is not .sumitable for a gascondensatereservoir. Thepressuirebuild-up may vaporisetire condensedliquid in the reservoirinto tine gasplrmnse In) form a gmrscondensateevenricher than the original fluid, Unless, the condensationwmms limited ounlywithin a small zone around the wellhore, allowing the disposal of (Ire ricirer gas over areasonableperiodof conditioning,thecollectedsaun’iple will not be representative.
bulk as thepressuredeclinesduringprodumction.As thedepletionrate is low, theadvancementof the two-phaseregion is slow. Ilence, it is reasonableto assumea quasi-steady-statecondition aroundtire producer.witlr nnimnimal clnangesover a short period. At suchconditions,Oreoverallcompositionof thegas-comndensatemixture flowing into the wellbore is thesameastlmat flowing into thetwo-plnaseregionn,as nocondensatemnccumuia(ionoccursin thatregion.Ileurce the reservoiroutflow, if collected properly, shouldrepresentthe original single phasereservoirfluid,
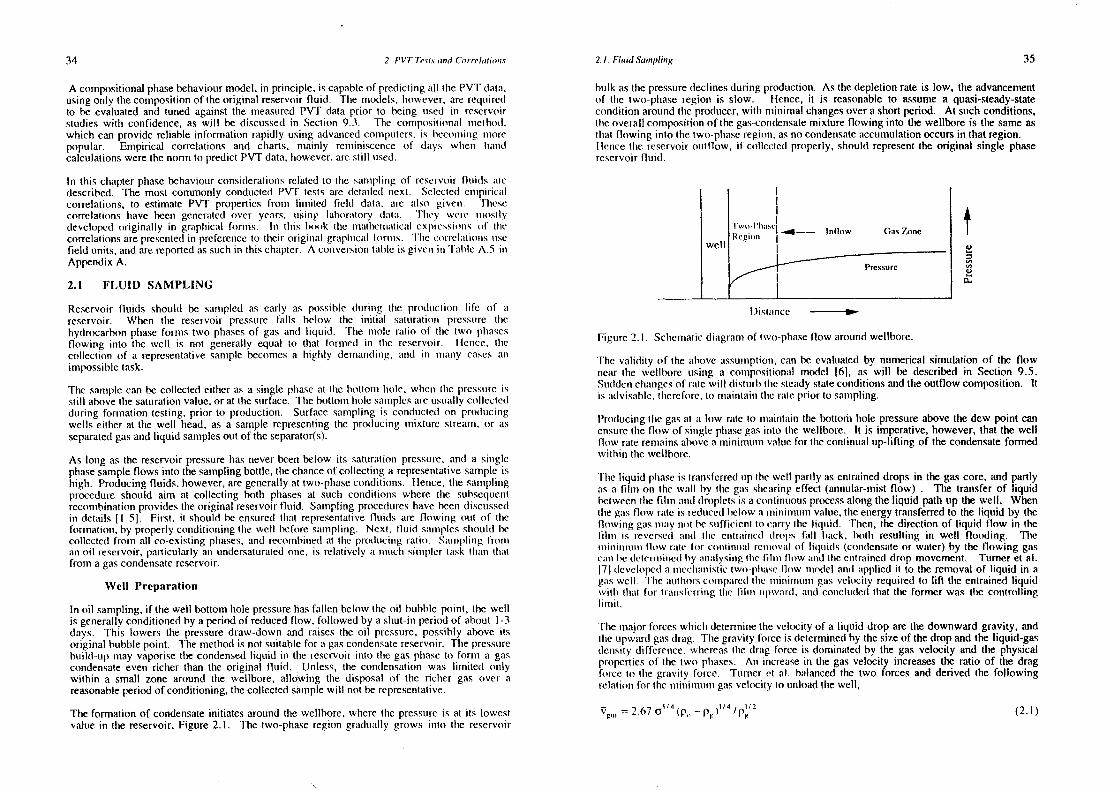
Figure2.1. Schetnmaticdimngramof two-phraseflow aroundwellbore,
Tire validity of the aboveassumnmrption,can be evalunatedby numerical simulationof the flowumemnr the wehlhorc unslung a comumposi(ionmtl model (6], as will be describedin Section 9.5.Sumnidencimangesof suite will disttrrh tIre steadystateconditionsandtheoutflow composition. Itis advismuble.ilnerefore,to unrmmintmmin the rmmte pmnor to samnnpling.
Producingtire gasal mm low rate to unrmmintmmin the bottotinhole pressureabove thedew point canensuretine flow of singlephasegasinrto tIne welibore. It is imperative,however,that thewellflow rateremainsabovea nninimunnvaluefor tInecontinumalup-lifting of thecondensateformedwitbnin thewellbore.
‘lire liquid plnaseis trmmnrslcrredrip tire well partly asentraineddropsin the gascore,andpartlyas a Imlnr on the wmnll by tire gmns slnemrrimng effect (annular-mist flow) , TIre transferof liquidbetweentime luhin mmmruh ulroplets is acountinumousprocessalongtheliquid path up thewell. Whenthegmts flow ruute is reuluicedbelowa mnnimminrnummvalue,tIne energytransferredto the liquid by thellowimrg gIns mmnumy nmnt bestifficient to carry theliquid. Then, thedirection of liquid flow in theInlmrn is reverseul amid tIme cmmtrmmincul ulrops frill hmuck, hour resultinrg in well flooding. Themmii iii mnnunnnm flnmw rmute 0mm u’nnmrti nnnmml menumovmnl of I iquids (eomidensmiteor water) by tIre flowing gascunnrbe dctermniiiredby minunlysing tIns’ fihmnn 11mw mnmrd time emrtrmmirncd drop movement. l’umner etal.71 ulcvclopeul a mmmeehimnunistictwo-plnmmse flow mmdcl amid mupplied it to theremoval of liquid in a
gmms well. ‘hIre mmumthnorscnnnmrparcdtIne nnrimniisnunnnn gmms velocity required to lift time entrainedliquidsvithr tlnumt for trumunsfemninng tire Imhnnn un
1uward, mnmnh councluulcdthrat tIne formersvas tire controlling
hinurit,
Tinemrrajor forceswhiicln detenniinetire velocityof a liquid drop arethedownwardgravity, andtIne umpwardgmns drmrg. Tine gravity force is determinedby thesizeof thedropand theliquid-gasdemisity dilfereunce.wlneremustIne drmmg force is domiuratedby the gas velocity and the physicalpropertiesof tire two phrases. An inncmeasein the gasvelocity increasesthe ratio of tine dragforce to tIne gravity force. Tunmer Ct al. balancedthe two forces andderived the followingrelation for thenniniuinmmrrngasvelocity to tnnloadttrewell,
(2.1)
well
I wni’t’tm~nsc~~—— Intinuw Gas7~ncRcgmnnrn I
,~rTressur~
t)istmnurce
The formationof condensateinitiates arotmnd thewellbore.where the pressureis al its lowestvalue in the reservoir.Figure 2.1. The two-piraseregion gradummilly grows into the reservoir
/4 1’“gnn = 2.67 &‘4(p,, —pr) “Pg -
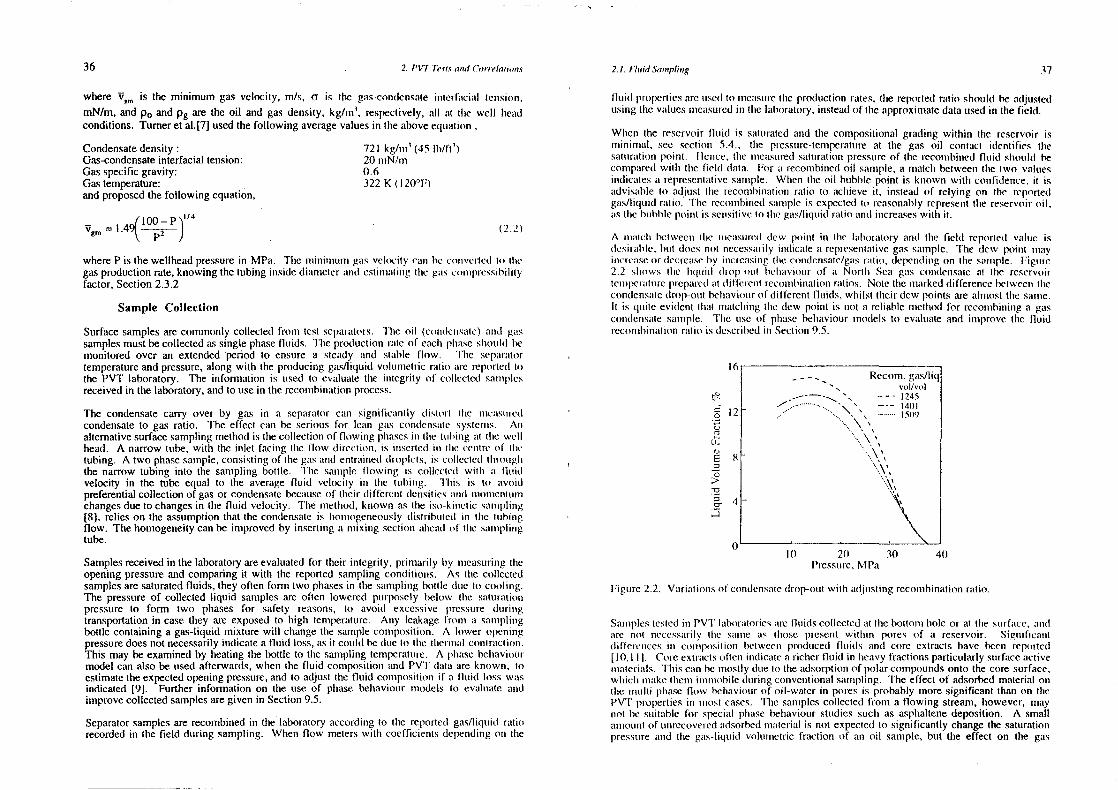
36 2. I’VT Tn’.ctn anmd (‘orrelatinn,i. 2.1. Fluid Sannpling 37
where V~,,is the minimum gas velocity, rn/i, cn is the gmus-condensateinmterfmncial lension,
mN/rn, and Po andPg are the oil and gasdensity, kg/mtm, respectively,all unt lime well mcmiconditions. Turneretal.(7] usedthefollowing averagevaluesin tire aboveeqummmtion,
721 kg/inntm
(45 lb/flu)20 nnnN/nni0.6322 K (l20
0F)
Vg~=i,49
(l0~P)t/4
. (2.2)
whereP is theweliheadpressurein MPa. TIme mininrrtmnr gmns veloenty can be cnnnrverte(l Inn tInegasproduction rate, knowing the tubing inside dimutnicter mmmnul estinnnmitmmng line gums cnmuiuinnessibnlityfactor,Section2.3.2
Sample Collection
Surfacesamplesare commonly collectedfrom lest separmilors. l’Ire oil (condcnnsame)mmnnul gmissamplesmustbecollectedassinglephasefluids. The production rateof eaclnplnaseshoumld bemonitored over an extendedperiod to ensure a steady mtnd stmth,le flow. ‘flre sepmnratortemperatureandpressure,alongwith the producinggas/liqumidvolunmetricrmtflnu mnrc reportedtothe PVT laboratory. The information is umsed to evaluatethe integrity of collected samrmplesreceivedin the laboratory, and to use in therecomnmhitmationprocess.
The condensatecarry over by gas in In separatorcmmn sigrniiicumntly distort nIne nmremnsurru’dcondensateto gas ratio. The effect can be serioums for lemmn gmus comndensmmte systemmns. Annalternativesurfacesamplingmethodis thecollectionof blowuing plnmnsesin tIne tnrhinng mit tIme wellhead. A narrow tuibe, with the inlet facinng tIre blosv uiiree(iomr, is inrserteui tn tIme cemnnrc nil tiretubing. A two phasesample,consistingof llne gmns mmnnd enlrmmnneddrniplcts, is eohleeieultlrmuuumginthe narrow tubing into the saniphingbottle. ‘lIne samnrple flowing is collected winO a fluidvelocity in the tube equal to tine averagefluid velocity in tine turhimng. l’lmis is to uuvoidpreferentialcollectionof gasor condensatebecmmuseof their duffcrenrt (lenrsities mmmmui mnmomnncnntumiumchangesdue to changesin the fluid velocity. ‘J’he method,known mrs the iso-kimnetie smnmnmpling[8), relieson the assumptionthat thecomndensateis homnnogeneoumslydistributed inn lire tubingflow. Thehomogeneitycan be improvedby insertiunga nmiximrg sectionrmmlremmd of tIne summnnplinmgtube.
Samplesreceivedin thelaboratoryareevaluatedfor Ilneir integrity, primarily by mmneasuringtineopeningpressureandcomparingit withn the reportedsamplingconditiomns, As tine colleciedsamplesare saturatedfluids, theyoften form two phasesin the smmnnrphinngbottle (lime to cooling.The pressureof collected liquid samplesare often lowered puirposely below lire saturationpressure to form two phases for safety reasons, to avoi(i excessive inressumre dunningtransportationin casethey are exposedto high tennperature. Any leakagefromni mm sainnphumngbottle containinga gas-liquid mixture will changethe sampleconmmposition. A kiwer openingpressuredoesnot necessarilyindicutte a fluid loss,asit cnuldbe duneto tine tlmenmnumicontrmiction.This may heexaminedby heatingthebottle to tine samplingtemperature. A phmmsehelmavinunrmodel can alsobe usedafterwards,when the fluid compositiomn mnnd PVT dmmtmm are known, toestimate(he expectedopening pressure,and to adjust the flunid conrposilion if a fluid loss wmmsindicated [9). Further information on the useof phasebehaviourmodels to evaluate andimprovecollectedsamplesaregivenin Section9.5.
Separatorsamplesarerecombinedin the laboratoryaccordingto tIre reported gmts/hiqumid ratiorecorded in thefield during sampling. When flow meterswith coefficientsdependingon tIne
flummni propertiesarcunsedto mnemtstnn’ethre produnctionrates, tine reportedratio shoumid be adjuistedusmng tIre vmmlues mnncmmsuredin time laboratory,insteadof tine approximatedataunsedun tine field.
Wlnemn time reservoir flumid is satunratedand the compositionalgrading within tine reservoir isnnminimal, see section 5.4., lIre pnesstmre-tennperatunreat the gas oil contact identifies tiresmmtumrmmtnon point. Ilenice,tire nmnemmsurredsaturrationpressunreof time recommrhinedfluid slnoumld becomurpmnre(l wmtin tire imelul dmnta. For mm recombinedoil sanmnple.a mimalcir betweemrtine Iwo valuesindicates a representmmtivcsanurple. Whren the oil hunhhlepoint is known with confidence,it isadvisable to adjumst tine reconmnhirrmmtiun rmuiio to achnieve it, instead uif relying omn the reportedgas/hiqumidratio, lire recomnuhimredsumnnrple is expectedInn reasonablyrepresentthe reservoiroil,mis (Inc hmmhble P~imntus semmsit ye to tIre gmns/hiqumidratio ann increasesnvitlr it,
A nmrmitt’hm betwecmntIre mm memmsmmred slew pnni trt in tine I mmhommmtory amnd the field reported vuultie isdesmratie,hunt shies not necessunrilyinrdicale a represemntalivegassamnnphe. l’hme dew poimnt mmnmnyirnereasemr(ieercmnscby innenemnsinrgtine comndensurnc/gmmsratio, dependinng(in tine smnrumple. l
1ignnme
2.2 sluminn’s Ilit’ I iqunii drump—ounI lid nmmvinnumr of mm NontIn Scun gmns conrulcnsmmteat I Ire resu’rvoilenmnpcimnttirepreparedmml diffenennt recomnnhiinaiiommrmm(ios, Note thennrmmrkeddifferencebetween lIrecondensatedrop—out belrmmviomrrof different fluids, whilst tlmeir dew points are ainrosttine sattne.Ii is qumie evident tinmn( nmratchming line dew poimnt is mrot a reliable tmnclinod for reconnnhitninga gmmseorndemnsmntesamnmple. Time uric of ptrasehehmtviourmodels to evmrlurate and imnrprove tine fluidrecommnhiiurmmtionnratio is tlescrilicd irn Sec(ioir9.5.
ml)— Recoin.gas/hiq
vnii/vnml— — ‘ 245
- N —‘— 140112 ..‘ “.. . 1509
1(1 20Pressurre,MPa
30 40
Figumre 2.2. Variationsof c(undensm(ie(lrop—oumt witlr undjumstingrccounrhinationrmutio.
Smnnnuphestestedimn PV1’ lmnhormmtoriesarc blinds collectedmit the bottonnrmole or at lire sumrlmnce,amidmmrc not neecssmnrily tine smmmmme mis tlrose present witinin pores nnf a reservoir. Sigmnilncamntdifferi’mnees inn eonmnpnisiiionm bctwcenn produiced ilui(ls’,mn(l core extractsirave been reported110,111. Coneextm’mnctsofnemn imndicatea richerfluid in lneavy fractionsparticuularlysunrfaccactivemrmmmneniais. TIns cmnn he mnrostly due to themmdsorptionof polarcompoundsonto the coresurface,wlnielm mnnmuke tlncnmn iimnnnnobilc shiningconvemntionalsmmnmpling. The effect of adsorbedmaterialontIne mrnunlti-pinaseflow belravioumr of oil-water in poresis probablymoore significant thanon tInePVT propertiesin mnmosi cases. Tlrc samplescollecteul from a flowing stream, however, maytrot he suritable for special phrasebehaviourstudiessuch as asplraltenedeposition. A smallamnrounntof utnrecoveredmndsorbedmaterialis not expectedto sngnnif’ncantlychangethe saturationpressunreamid tIne guns-liquid vohunnmrctric fractiorn nil aim oil sanrple, but the effect on the gas
CondensatedensityGas-condensateinterfacial tension:Gasspecificgravity:Gastemperature:and proposedthe following equation,
C00n.m
LL0
8a
‘0aci-
38 2. PVT Testn mind Cmnrrelasimi,rs 2.2. !‘VT lenin 39
condensatedew point may be very markedas its phase behaviour is dominatedby lheconcentrationandpropertiesof the heavyend.
When different samplesare properly collected from the same reservoir, tIne sannnples mnregenerallyexpectedto be similar. Inn saturatculreservoirscontmuinnmmgInn nnml conhmmmmmn muun(l mm gumscap,the samplescollectedfromrr eaclm 7.one arc expectedto) he reunsonrmntnly in equnihiinniunmmn witlmeachotherat thereservoirpressureandtemperature.Compositionalgrmrding dune to gravity mmmn(ltemperaturegradient mayhoweverexist in a reservoir, with samplescollecteti from differentdepthsbeing vastly different. Thecompositionalgrading can be very severe.resunltunng in mmcolumn of fluid changing from a gas at the top to oil at the bottom, without any phraseboundary. Phasebehaviourmodels can be ursed to evalunatetIne extent (if comnnpositio)nnalchangesdue to grading in order to evaluate tine sannples. TIne eonmnpositininnunl grmmditng isdescribedin Section 5.4.
2.2 PVT TESTS
PVT testsaredesignedto studyandquantify thephasebehaviouramnd propertiesof mm reservoirfluid at sinmulatedrecoveryconditions. Theeffectof interstitial wateroni tIne phrasebelrmuvioumrofhydrocmmrhonfluids areignored in mosttests,and time PVT testsmmrc cormdmmcteui iii tIme absencenilwater. l’he nrajorityof testsarcdepletiomnexpeninncmrts,whncic tIne prcssunrcml tIre siunglephraselest fluid is lowered in successivestepseither by imncremnsingtine flunitl volsunnenir reunnoiving pmurtof it. The reductionof pressureresultsin formation of a secondphase,excepnurn dry mmnrul wetgasmixtures.
l’he formationof a new phaseis generallyacconnipaniedby sonic degreeof snipcnsmmtumrmmtionn.l’hc pressureof an oil samplecan be lowered below its hunbhhe ponimit grmnulmnmnhly winilsimain(aimningit asa singlephuusefluid. Sucha fluid, however,is inn nnnetastahlceomnuiitionns,asfurtherulescribedin Section 5.2.
Testsconductedin laboratorieson liquid samplescontainedin a pornnusmediutnni, brave rcsunltcolin some degree of supersaturation,wmthr values as high as 5 MPa (12,131. hliglnsuipersaturahionhasbeenobservedno testswhere tIne pressurehmts been lowered rmnpidly. hnr areservoirwherethepressuredecline is slow, signilicmnnnt sunpersatnnrationis trot expected1141.
Surface forces can be significant in tight pores, affecting the pinmmse bchnaviounrof fluids.Capillarycondensation,wheregascondensesin poresdue to fluid-solid inicrmnetion. is a wellknownphenomenon(15,16). The effect would heof significancein porestypically less thmmmnl0
8m. Gascondensatereservoirsare generallyassunnncdto be wInter wet, withn tight cmrvities
filled with water. Hence,thecapillarycondensationeffect may be ignored. ‘Tests inn a cellpackedwith 30-40 mesh head have resulted in tine samrre dew point as tinmut msreasuredconventionallyin arm equilibrium cell (171.
The above review suggeststhat the assumptionof equmihihriunn betweemr nIne phases innreservoirs,and neglectingthe surface effect on fluid equnilihnia. is a remmsonableengimncerinngapproach. This has greatly simplified experimenr(al amnd theoretical stundics of the phrasebehaviourof reservoirfluids. In conventionnalPVT tests, tine flunids mire given amrnplc tune mnnruiagitationin equilibriumcells,to mrpproaclnequilibrium. At certainconiditionms.mmdi mis in ruupiulpressurebuild-up near Ore weilboreor in higbn pressuregradient flow, line dcviumtininn fromnnnequilibrium maybecomesignificant. Shouldnon-equilnhrmunmrnioforunnationhecnnimnc innrportmmnrn tmifield operation,suchasbubblenucleationin waterinvadedreservoirsdunringdcpleliomn 118,191,especialtestscouldbedesignedto generatetherequireddata.
An important test on all reservoirfund samplesis tIre sletcmmnninmntiomr mnf tine fluniol comnmpnnsiniunnn.The most common method of counposilio,ral wralvsi,s til Inigin pressurefluuids is to i’laslu murelatively largevolume of the fluid sampleat the atmosphericpressureto fomn gennerally twostahihisedphasesof gas and liquid. The two phasesare innclividuahly analysedand then
numniericallyrcconrhined,usingthermniio of tIneseparatedphases.Thegasandliquid phasesarecommonrly atmalysed by gas chromrnatography and distillation, respectively. Details onconnpo)sitional analysisand various techniquesapplied to characterisereservoir fluids aredescribedin Section 6.1.
‘lime umhinive unnmurlysismmppmuimmchm, kmnmwmm as tIre “blomn’-d,’nnn’,r” nnicllmod, can give reliable resultsforlarge sanniplesof highr pressureliquids, wlrere tIne error involved in measurementof the twoplnmmseratio is relatively small. For small sannplesorhigh pressuregases,wherethecondensatevolume fornncd by blow down is low, tine techniqueis unnrehiable.
Fun!! stream.sannpIium~,’.wlncrc a snnnmill anrronunnntof inigin pressurefluid is directly injected into aguns cimrmnnnnmntmngmunpIn. Inmms mcccived 5mm ire altennt ion mis ruin mmitcmirrutive to the blow donvn method inntIre punst deemmnlc. ‘l’Ire hmmsic primneiple is to flow tine Iniglr pressuretest fluid throungbn a specialvunlye tin trump mm sununli qunmmuntity nil (Ire smmmnmple imr tIne valve for injection. The trappedhighpressurelltmiol is tbncmm cxpnnscd tin hunt flnrw nnf mm cmmnicr guns, which vaporisesthe sampleunto mugums clrromnnmitmngraplneonlummnnn for amnumlysis. l’Ins’ valve itself is generallyheatedup to helpelutimrgIremuvy conistitunenls. ‘lIre samnnphing valve with the flumid trapped inside may be physicallyrcmnnoved fronn time samplingport mmmrd transferredto a gas chromatograph(20,21], or justisolmntenl from bite colunihihmitmmmm ccli, mumnol Ilnenn heatcohup. l’he vmuponisedsampleis directedto agums elm onmnmttngrmtplrIInronuigln a incateul trrunnsferlitre (221.
‘lIme mulcaof lumhh stremmnrn(dim-eoi) snumnipliung is quite innlerestinmg,particumlarly for thecomnrpositionalamrmnlysis of eqtmilihruntedplnunscsin PVT tests,wlnere the removal of a largequantity of a phasewill distunrhtire overall connnpnnsitioum. Certain (nperationmalprobleurms,however, havepreventedits wide apphicationn.Altinotigln lIre smmmnnple vohunneactually injected into thegaschromatographis very smmnuitI, of tIre orders)f nnicrnnlitres,a largeamrmoumnt of the fluid is required to fill up timesmmmnrphtumgloop system,winicir inclunlesa nmumherof issilatingvalves,andmostofit is lost wlrentIme smmmmrphimngvalve is memnroved onr Ircmrted, All tIne limes iraveto becleanedandevacuatedafteremnclr injection to repealtheanalysis..The introdumctiomnof a Inighr pressurefluid into anevacuatedhinrc gemrcraliy rcsumlts in plrmnse clnmmmrges,hence,a large volunre of the fluid hasto be passedthrough the
1oop to ensunremu represenntativesanmplefor injection.
‘lIre Imirge lonss oil line lest fluiti slurring tIre sampling ansi the problems associatedwith thetnmunnsferlimes mmmd isonlatinngvalvesInumve becmn avoidedby designingspecialvapour-liquidcells inwlmmclr tIne sannnphinngvmmlve cmnmn I-me imrstaihed directly onto) the equilibrium cell 123]. A smallvnnlummnneoil line test flumid enterstIme vmulve, locked in, ammd the valve is detachedfrom the cell fortine fluniol to be tramnsfcnreslto a guts chnrounnalogrmmpbn. ‘l’Iuc test fluid does not flow througir themnbnunve valvesand, as tIne expostnrcnil a Imiglm pressurefluid to an emptycavity is generallymmcconmpamnnedby mmmc phase ehmmnge,rcntrovaiof a representativesamplecannotbe ensured,Repemrtedsmumirplimng is mint an eunsyonr a safeoperationin theabovearrangement,asthe samplingvalve Iras to beassembledto a high pressurecell kept in a constanttemperatureenvironment,
‘flre ireavy constituentsof the samniple in all the ah,ove methodsmay be partially retainedbetweentire smmmnmpiing valve andtbne guns clnroinnatographcolummn and, as the injection volume isvery smrnuull, tInecnnnecnntra0onof thesecnnnstituentscouldbe highly under-estimated,Therefore,lIne nnncthnod.shate been unwire suicee,sslunlinn nIne analysisof gasestinan liquids that have veryhiemmvy counslitunents.
A olirect samnmplmmngtcelmnnnqumeinn whniclm a smmuhi samnipieof a hniglr pressurefluid in a narrow tubeis pminclnedby mnmr aumxmiimnry fluiol (snnlvennb) at the test pressurehasbeenproposed[24] to avoidtIne aboveproblems. ‘l’Ine flow 0)1 tIme solvemnt directsthe slim slug of the sample into a highpressume valve wlnicim has replaced (Inc injector of a gas chromatograph. When theonnncomnmuunnninate(lsmmnnnpte reunehnesline valve, it is thenexposedto flow of a hot carriergaswhichnmnn~eetstine samnnple mnmto tue gaseimromrnatnngraplr. line preferenceof the direct compositionalamnahysis,ascondumcteslby tIre abovenrethod,to theconventionalblow-downtechnique,will befurtlncrdiscussedin Section2.2.4.
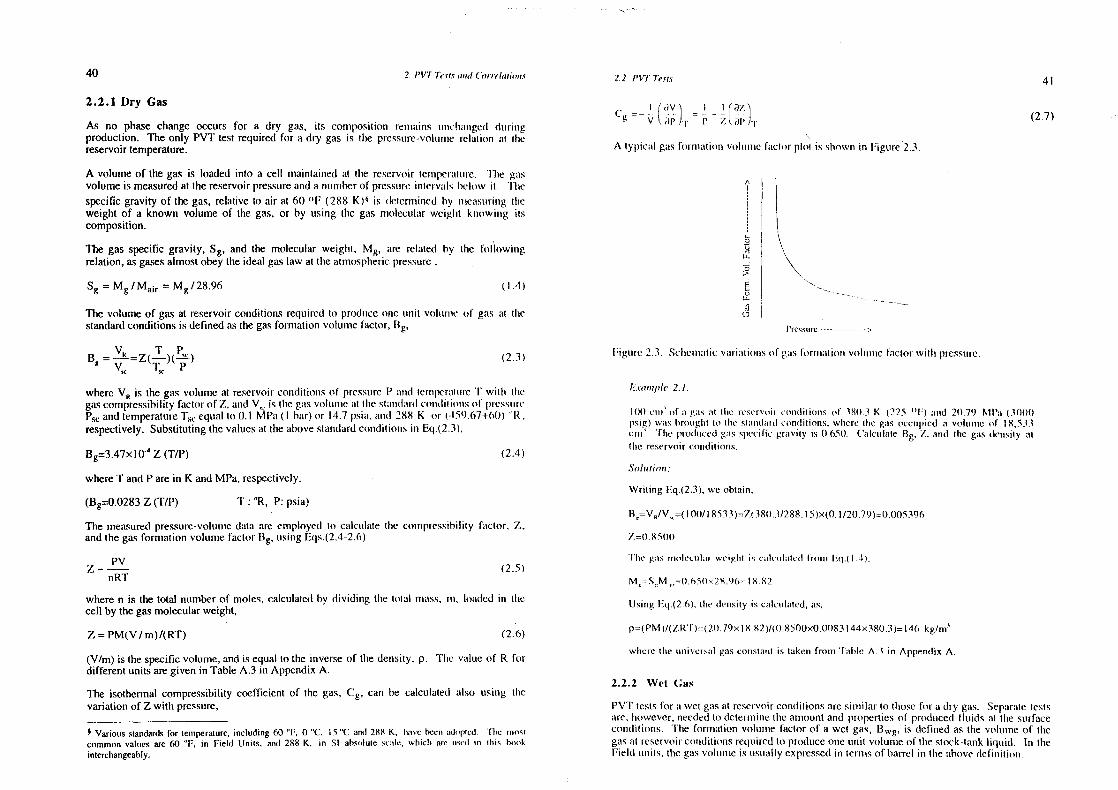
40 2 !‘Vl’ ‘ic c;.c mud (‘nrrehmmio,i.c 2.2 I’V1’ lenin 41
2.2.1 Dry Gas
As no phasechange occurs for a dry gas, mIs connposition remnrmnins unmnehuminged duiniungproduction. Theonly PVT test requiredfor a dry gas is tine pressurc-volummmnemelmttion at tirereservoirtemperature.
A volume of thegas is loadedinto a cell maintaimnedat the reservoir lenrnperuutnmi’e. ‘I’lne gums
volume is measuredatthereservoirpressureanda numnnrberof prcssumrcintcrvmmhs Iiehonw it. ‘llre
specific gravity of thegas, relative to air at 60 nup (288 K)t is detenininedby mmremnsurrimrg tIneweight of a known volume of the gas, or by using the guns nmoleculurr weiglnt kmrowimrg itscomposition.
The gasspecificgravity, Sg, and the molecular weiglnt, Mg, are related by lire followimrgrelation,asgasesalmostobeytheidealgaslaw at theatmosphericpressure.
Sg = Mg/Mair Mg/28
.96
(1.4)
The volumeof gasat reservoirconditions requiredto producemimic mint volummrns’ of guns mnt tInestandardconditionsis definedasthegasformationvolumnme fmmctor, B
8,
Ba =.~1(-=Z(~-)(3) (2.3)
where VR is the gasvolunre at reservoirconditionrs of pressureP unnnoi tennrpcrmmnunneT wilim tInegasconmpressihilityfact(nr of 7., mmmd V,~is tIme gums voltmmnne uul Ilie stururulunmnI s’ommntmt nnnnns ol lcssmum’e~ andtemperatureT
5~equal to 0.1 MPun(I hmnr) or 14.7 psimm, mummnl 288 K or (.t5n)(n7+t’iO) “it,
respectively.Substitutingthevaluesat theaboveslaundardconditionnsinn Eq.(2.3),
Bgrr3.4
7X 10’~Z (T/P) (2.4)
whereT andParein K andMPa, respectively.
(Bg0.O28
3Z (T/P) T : °R,P: psia)
The measuredpressure-volumnrredata areemployed to calcmnimmte tine compressibility factor, 7.,andthegasformation volume factnnrBg. umsingEo~s.(2.4-2.(n)
Pvz=—
nRT(2.5)
wheren is thetotal nunniberof moles, calculatedby dividumng tire tontunl nnmmuss, inn. loadedin timecell by thegasmolecularweight,
Z= PM(V/m)/(RT) (2.6)
(V/m) is thespecificvolume,andis equalto the inverseof thedensity. p. Tine value of R fordifferentunitsaregivenin TableA.3 in AppendixA.
The isothermalcompressibilitycoefficient of thegas, Cg, can be calculatedalso umsing tIrevariationof Zwith pressure,
Various siandardsfor nennperature.including 60 “F, 0 ~C, IS “C and 21(8 K, trunve been adnnpncd ‘flue nnmisn
common valuesare 60 “F, in Field Units, arid 288 K, in SI absolute scale, wlincln arc uccum inn mInus linnmnkinterchangeably.
~,=. (av~ (a7~ (27)~ V k ~l’ )‘~ t’ Z ~,~I’~‘l
A typical guts fonmnrnaininvolnmunne fmuctnr plot is showmn in Figunre2.3.
A
o i
Sn.
.0
a0a.a0
Figuire2.3. Selrcnmrmmimc vmmmnuniromnsof guts fommnrmnlimimn vonlnnnnrefactorwillr pressure.
kuti,nninle 2. 1.
liii) turn’ of a gums mi mime rt’semnnnin u’ommnli(ionrs of .180,3 K (225 nm1
:1
mmmd 2(1.79 Ml’ui (300(1hnsi~)was bnrourglnn tui I Inc St mmniulurn d u’nmmrnl it ions, wtncrc tIre guns ocs’nnpied a volnmmmre of I 8,531ennn . ‘[‘ire pmoiuiccui guns specific gravity is 0.65t). (‘alcmmlale Bg. ‘1.. mmmd the gums density at(Ire reservoirconnnlit ionrs.
Solnuin’n,r
Writing Eq.(2.3),we obtain,
Br=Vs/V,,=( tOO/I 8533)=Z(380..(/288. I 5)x(O. h/20.79)=O.005396
Z=O.85(it)
‘lint’ guns mnmmilecnitunm rn’t’mgbni ns c~mtcniIunts’mtfrnimmr Fut.( 1.4),
M~=S5
M,,,=t).65Ox2tt.96=i882
tisinmg Eq.(2.6).nIne olemnsity is cumlcnnlated,as,
p=(PM)/(ZRT)=(20.79xI 8.tt2)/(O.8500x0.0083I 44x380.3)=146 kg/rntm
wlnerc time uimnvcrsunl guns connstmmmnm is tmmkemm from ‘T’ahle Al un Appennulix A.
2.2.2 Wet Gas
PV1’ testsfonr mu wet gas mt reservoirconditiomnsaresimirilar to throsefor a dry gas. Scpunrmnne testsare.Inowever,neededto) uletemmrnimnetIne muminonumnt ansipropertiesof proulucedfluids at tbme surfunceconditions, The formation volunnefactorof a wet gas, Bwg~is definedas the volunmnc of tInegums mit reservoircomnditionsrequmireul to produceonre untnit volume u-mI tIne stock-tankliqumid. In theFuelol ummnnts, tIne guns voilummnre is ursumunilyexpresse(lun termnnsof barrel in theabovedefimmitionnr.
t’ressmnre--------------.>
42 2. I’V’! Te inn nnnd (~m’,m’hnii.nni.m 2 2 PV1’ Te.orc 43
A more practicaldefinition of the gas formation volunrme factor, currently uised in reservoirsimulators,is the numberof barrelsof reservoirgas(inclumding time liquids dissolveoi inn it) mutreservoirpressureand temperature.per cunhic foot of the dry gasproduicedfmnnmmn it mit stanrdunrdconditions. This is analogousto oil formationvolume factor,describedin Section 2.2.3.
The molecular weight and specific gravity of produced condensateare nn’reasuured in tinelaboratory.The molecularweight is commonlydetenininedby drssolvingthe liqumini in bcn7.enreand measuringthe depressionof its freezing point. TIne liqumid density, hence, ins specificgravity relativeto water,is determinedby a pycmnotineleror mmmi oscnilmutitrg tutne mlenmsitn’mnnmeter.
The apparentspecific gravity (or relativedeursity to air) of time reservoirgmus is de(ermmminneul bycalculatingthe reservoir gas moiccumlar weight, and,,unsinng Eq.( 1.4). 1 laviurg nnrcmmsunrcd tIns’massmmd molecularweightof proxluccdgas ansionil (corrulensmnle)plrumses.(Inc nrrixlunre nnmonleermlmmmweightcan bedetemmineslby materialbalancecumlcunlmmtions,
Mnr =(mg+mo)/(~L+~2~] (2.8)
Eunmpiricaicorrelations,Section 2.3.2, are alsoavailable10 estimatethe reservoirguns specificgravity from productiondatawhen someof the scpuuratorsdata, partmcumlmmrly in mnnuilti-stungeseparation.aremissing.
2.2.3 Black Oil
Thephasetransitionof anundersaturatedoil duringdepletionis depicted in Figumrc 2.4. Awayfrom time weilbore,zone A, where tire pressureis still above the bumhhle point, tine oil expandsas a singlephaseliquid. Thepressurein zoneB is just belowthe huibble point ansI tire voilunineof the evolved gas is too small to allow its mohilisatiomn. In zone C, the evoilved gas flnnwstowards the producer,but segregatesfrom theoil dume to gravity and suurface forces, In tImewellhore, the two phasesare consideredto flow togellner due to tine dominunmnu mnnixinng. it isassumedthat thephuusesareattheequilibrium throughoutas time pressumredepleliuin runie is lumilelow. The abovereservoirprocessesare simulatedin line laboratoryby (he equmilibrium flmmshvaporisationtest, for zonesA, andB, andthedifferential vaporisationtest, for zoneC. All tInereservoirtestsare conductedat time reservoirtemperature. A seriesof flash tests mit selectedtemperaturesarealsoconductedto simulatethesurfaceconditions,
In the flashvaporisationtesta sanrpleof oil is placed in an equilibrium cell at a pressureequalor greater than time initial reservoir pressure. Tire pressure is reduced incrementally byexpandingtine fluid volunsie. The total vohuime,V
1, is mrmeasuredat eachpressurestage.The test
is also known as fluush liberation, flash expamrsion, constantcomposition expansion, andpressunrevolume relation,
Typicuni PV’t’ lest (lumla mum reporieolby a lmrhoralowy is given in Table 2.1. The presstmre-volummeolumluu mnf tine black nnil, wilin comnrpnnsitionmnmis in ‘[‘able 2.1A. is shown in Table2.1 B. Tire dataismmlsnn plontled un Figunre2.5. ‘FIre pressureumt whmiclr tIne slopeof pressure-vohumnieline changesis(Inc humhhle-point pressure. ‘lire slopeof tIne cumrvc abovetine bubblepoint, Table 2.iC, is annreasunrcoil tire is(ntirermrr,nh compressihiimlyofoil,
~‘mn= - ~ (~~)T (2.9)
winere C,, is tIne minI rsnntlnu’mmnnuml eninmmpressnlnmhmtycoefficient, The system voluinne is commonlyn’eiimirtcol my tInc relatime so/maine,olo’ linreml mrs tIne runt inn nil lIme total vodumnre to the immit imul bubblep~mmnIvoiiunrme.
‘Fumb-de 2.1,Selectedluthnles froumn a typmcmml PV’i’ report on black oil, Reproducedfrom Core LaboratoriesJune.reportwitlr permmnission.Humid : GoodOil _______Reservoir l’cumnpcrutlumrc:378 K (220“F)Originral ReservoirPressure:283.7bar, (4100psig)
‘lunble 2.1A.(“onrnpositionn snfrcsemvnnrroml,(nnirnpnnncnt —— , -. - -_-. .M~L7~_._-_-- W~tnt%
Ilydrmngcn SulFideCunrhmnn flimixideNimnnngenMumionic
ntn,nrncI’tnnnnane
liurtmnnern—ltnni:nnne
t’n’nnn:Innc’ii—t’n,’nnmmnnc
I ts’XnnncSI,,~j~,nancsplus — —— —
tepu:nnncc pills t~rn~nwni cv mum cc.
NnI Nil(tOt 0.430.16 0.05
36.47 6.249.67 3.10
696 3.27I 4.1 ((.895,95 2.44I..>.> I ItItt .094.51 3.97
33.29 77.41ticmnsnry-~85l5 kg/nmm’ (34.5 ‘AI’I), MrlecutarWcight=2t8
‘lIne lmuboirumtory slatum is of (em evurluated,snunoonhed,andextrapolatedby a dimensionlessfunction\‘. definedas,
‘~‘ =f(P~P)/P]/[(V, ~Vb)/VbI (2.10)
svlncre tIne sunbscripi h, meters to (Inc bubble point conditions, A plot of Y function versuspressuiresinouldyield a lime eillner s(n’unighrtor very sliglmtly cunrved.
Sc paran n nr
• Oil
0 (.rc
ReservoirA
Figure2.4. Phasetransitionin anunndersaturatedoil reservoir,
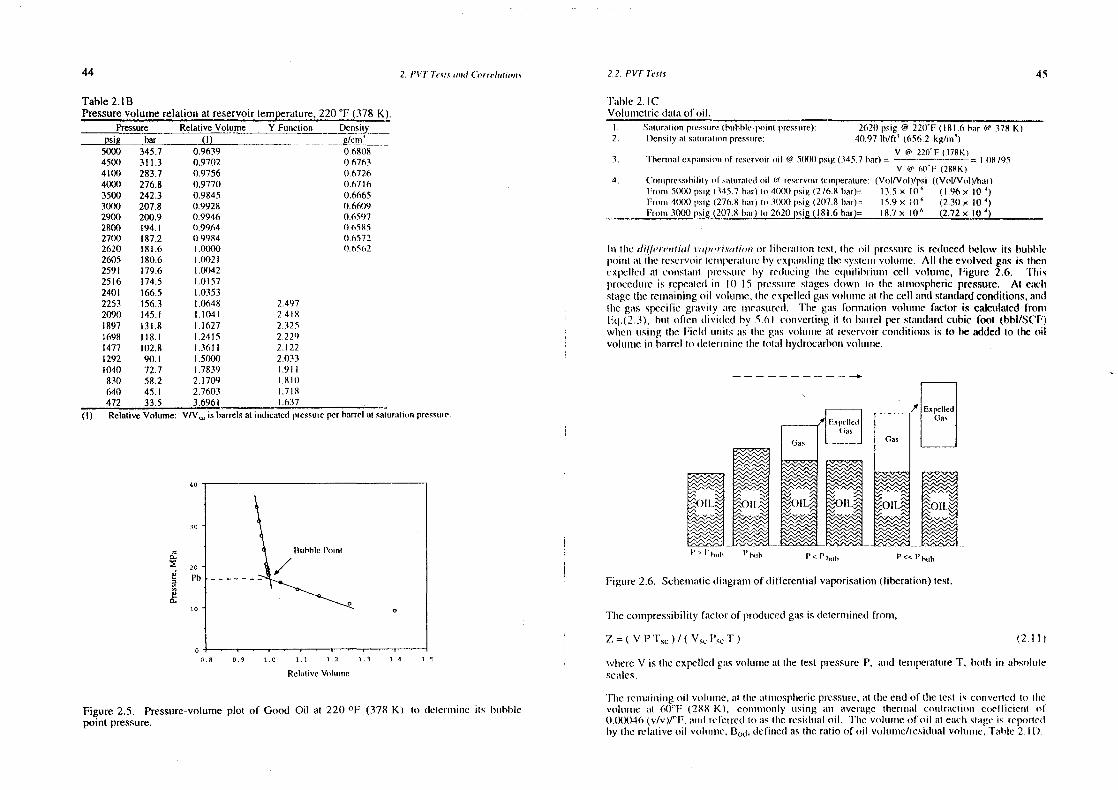
44 2. I’V7’ l’o’.nr.m’ imnmd C’orrm’lmntimi,nm’ 2.2. I’Vi’ l’e.st.s 45
Table 2.1BPressurevolumerelationatreservoirtemperatunre,220 “F (378 K).
Pressure RelativeVolume Y Function Densiiy~psi~ bar (1)
5000 345.7 0~9639-
0.68084500 311.3 0.9702 0.67634100 283.7 0.9756 0.67264000 276.8 0.9770 0.67163500 242.3 0.9845 0.66653000 207.8 0.9928 0.66092900 200.9 0,9946 0.65972800 194.1 mr.99.64 0.6585
27(8) 187.2 (m.9984 ((.65722620 18 1.6 1 .OtX)0 1)65622605 180.6 1(1(1212591 179.6 1.00422516 174.5 1.01572401 166.5 1.03532253 156.3 1.0648 2.4972090 145.1 1.1041 2.4181897 131.8 I.I(n27 2.3251698 118.1 1.2415 2.22m)1477 102.8 1.3611 2.1221292 90.1 1.5000 2.0331040 72.7 .7839 1.911830 58.2 2.1709 1.1(1(1640 45.1 2.7603 1.718472 33.5 3.6961 1.637
ndicamedpressureperbarrel am saiurmnminnnpressurns’.(I) RelativeVolume: V(V,~is barrelsal i
40
20
0
Figure2.5. Pressure-volumepoint pressure.
0
0.0 5.9 i.e ii n 2 ii 1.4 1.5
RelummiveVum(nmmmme
plot of Good Oil at 220 °F(378 K) to uietcm’mmnimne its t,nmhble
‘l’ahle 2.lCVolunrretric dataof oil,
I.2.
Saturatinnnpressure(hniintitc.pniinnt tircss;mre): 262(1 psig @ 220’F (181.6bar ? 378 K)Densityat saiur:niionpressnnre: 40.97 lb/fr’ (656.2 kg/mimi)
3.V @ 220fF (378K)
‘thermal expansion nil rcscrvoinnnil @ 5000 psng(345.7 burr) = = 1(18795V (ii’ (no F (288K)
4. (‘omnrnpressmhiimrynil snnturmnlcdnnil t? reservoiriennperanurc:(Voi/Vol)/psi ((Vol/Vmnl)/bunr):Froirn 500(t psng (345.7 hmmr) Inn 4000 lisig (276.8 har)= 13.5 x ttt~ (1.96 x 10 4)
Prminm 4001) psig (276.8 bar) inn 3(X)0 psig (2(17.8 har)= 15.9 x tO~ (2.30x 0~)Frniirn 30(X) ~i~g,,(2078~ (181.6har)= 18.7 x i0~ (2.72 x I0”~)
I in tine e/iff~’,n’n,tiaIm’nmp(mI’r.satuni or I iliermitio’mn test, tire mnil pressnmrcis reoluicedbelow its bubblelnmninmt ull I lie reservmmnrlennnpcrmntmnreby rxpummroiinng line systenmrvnilumme. All theevolved gasis thenexpelleol mit cnnnstumnnt tircssunrc by rcslumcmnmg (Ire Cnhuiulihriummin cell volunmnme, Figure 2.6. ‘I’Inispronce(lunmeis repemntediii 1(1-IS pressunreslunges olowmn 10 tire atmnrospirericpressure. A eumclrstagetire nemnmainimmgoil volunnne.theexpelledgasvolunmnreattIme cell uunnd stanrdardconditions,andlIme gums specific gras’rty mire nnieasunrs’d, The ga~formnration volunurre factor is calculatedfronrFu
1.(2.3), hunt onftemn diviuled by 5.(nI coirvertiung ml to huirrel per stuumndardcubic foot (hbl/SCF)
wlmemn unsung time Field unmnits uus time gums volumnire mnt reservoircommslitiomrs is to be addedto the oilvnnlummnme inn barrelto (le(erilninC thetotal hyulrocmurhonvolunune.
Figuire2.6 . Sclneunuuticdiungrmmmof ditferential vaporisation(liberatiomn) test.
Time compressibilityfuictor of producedgasis determinedfrom,
Z=(VPT5
c)/(VscPscT) (2.11)
wincreV is (Inc expellesigas voluinie mit tine testpressureP. mmd tenmnperatunreT, hontlr mr ahsoIurtescmnles,
Time rennnmninninmg(nit vmnlummrre,at lire mnt mniospinericpressunre,mit tIneensiof tIre test is convertedtni Onev(ilunmmmc mit 6O’~F(288 K), conrnnrnunnrly ursing ann unvcrimge I hermmnal comntraetnmnnm cuici incicmnt oil0(88)46(v/v )/“F, mmmd n c erredIon mrs time mcsisiunmml oil. ‘line vnnlnmrnrc oil oil at cureIn sluuge is reportedby tire relmntiveonil voltunire,B
0m&i, defimnedasthernttio of mmii volumnne/resisiumalvolununne.‘T’mntile 2. It).
no
tlurhhte I’nninl
/
10
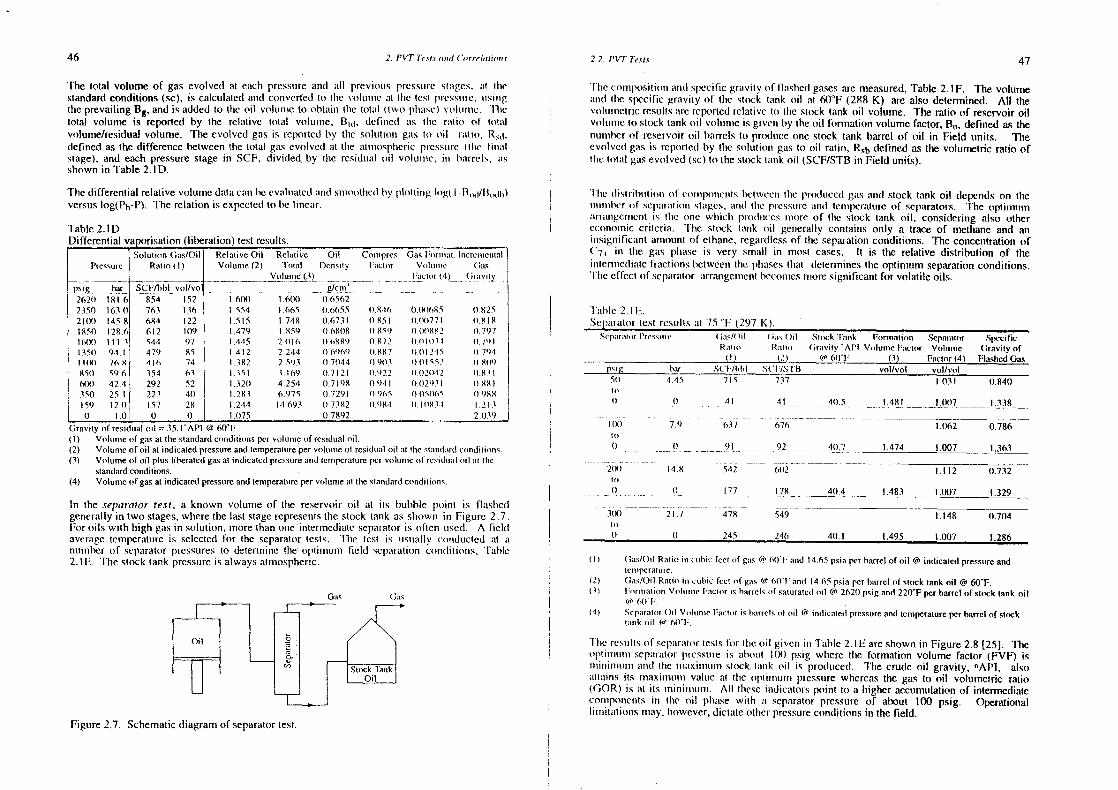
46 2. PVT Incus (nun,! C’orre!aninn,rs 2.2. PVT l’e.uf.c 47
The total volume of gas evolved at eachpressunreand all previnnuns pressunrestunges. mit tinestandardconditions(se), is calculatedamid commvcriedInn tine volummmue un tIne lest pnessumm’e.unsimngtireprevailingB
8. andis addedto tIne oil volumunc to ohtaiir tine tsnlmml Uwo-Inimurse)voilumumre. ‘lire
tots] volume is reported by the relative (otal vtnlumnnne, Bi,t. delmnned uns tire u’mmtinn of totmulvolumelresiduralvolunre. The evolved gasis reporleul by tIme solunlionmn guts to unil rumlmon, Rsnt.definedas thedifferencebetweenthe total gas evolved at tIre atmnnosplrericpressumrc(tIre iinnuulstage),and eachpressum’estage in SCF, divided by the residuuuloil volunnne, inn bunmrels, mnsshownin Table2.1 D.
Thedifferential relativevolumedatacuin be evunlurmilcd umn(i smnnoontinedby plmnttitmg lmug( I -I1
n,nl/l1
nxttn)
versusiog(Ph-P). ‘[‘he relationis expectesito be limmeuur.
Table2.IDDifferentialvaporisation(liberation)test results.
PressureSolu0nnn(las/Oil
Ramrun (I)RetaniveOil Relative Oil CVnntunsne(2) Tonal Dcnsniy
Votunne(3~
ormupres. Gas FmnrimiumI lmncrenmneninat(macunit Votunnnnc ( ;~~s
~nclnsr(4) (hasiny--p~ bar SCF/bblvnnl/vo g/crnn’
2620 18 I .6 854 152 I .600-~
I .601) 1)6562
2350 63.0 763 136 1.554 .665 0.6655 1)846 0.00685 1825
21(51 145.8 684 122 1.515 1.748 (1.6731 (1.851 (1.18(771 (1.81811150 28.6 612 109 1.479 1.859 0,6508 1) 859 000882 0.79716(5) III 3 S’t4 97 .445 2.016 06889 0.872 0,01051 0.7’~t1150 94.1 479 85 I 412 2.214 o,6’t69 1)887 11(11 2.~S 07)4
tOO 1611 416 74 1.182 2 593 (1.7044 ((.9(13 (101552 0811’)1150 59.6 354 63 I 351 3 I (i9 1) 7121 1)922 ((.02042 ((.831
6(8) 42,4 292 52 1.32(1 4.254 1)7198 (1941 (((12951 (1881350 25.1 223 40 1.283 6975 1)7291 1)965 ()0S1%,S 1)988159 12.1)0 1.0
57 280 1)
1.2441.075
14.693 0.71821)7892
0.954 010851 .2152.039
Gravity of rcsr~ualoil = 35.t’API @ 60’F(I) Volumnie nif gasatnbc smandardcomndinionsper volumeof residualunit.(2) Volumeof oil an indicanedpressureandnemperamureper voiunnic of reonslualoil anline snanndmmrdcnnnmlnmim’ns.(3) Vniluinne oil oil plus liheramedgasat indicaredpressureandremperarurepervnnlunmie of rcsnduat nil an Ihe
siandardconditions.(4) Volume mif gasat indicalestpressureandtemperaturepervolumeam nIne slanidand connulimions.
In the .ceparalor test, a known volumeof the reservoiroil at its bubble point is flaslncdgenerallyin two stages,wherethelast stagerepresenntsthestock tankas shownin Figure 2.7.For oils with high gasin solution,moretinaur one iniennnedma(eseparatoris oftenused. A fieldavs’rimgc lempermntuirc is selectedfor the separatortests. Tine test is usunally conrducleul at mmnunrberoil separatorpressuresto determinetire optinnmuunn field sepmurationcotnslitinnns, ‘rahlc2.1E. The stocktank pressureis always atmospheric.
Tire cnnmposmtmonrmutnd spccnficgrmmvity of flumslnesl gasesaie urneasured,Table 2.1F. The volumeummnsl tIme specificgruivily of the stock tmunk (nil at 60°F(288 K) are alsodelennined. All thevniltmnumetric resultsmnie reportedrelative Inn tIme stock tank oil voiuunme. Time ratio of reservoiroilvmnlunmrrc to stocktankoil vonlumrre is givennby theoil fnnrmatiomrvolume factor,B
0, definedas the
nuunnbcrof reservoiroil hmurrcls ton proolumce one stock tank barrel of oil in Field units. Theevolvedguns is reponrtcd by tIre solumtmnnmn guns to oil ratio, Rcb definedas the volumetricratio oflIne tn,(uml gumsevolved (sc)to thestocktmunmk oil (SCF/STBin Field units).
lIre nlnsiritiunt nun nil cmnnmrpninnemmlslnetweemr lIne proolumccoh guns airol stock tmmnk oil dependson thenmummmrtns’r ol sepmmnumtnun sIurges, mmiroI (Inc ~ uninml tcmnipcrurtturcof scpmura(oms. The (nplimumm
unrrunmigemmnemnt is tIme omne wlmicln pinuluuesunmore of Ore stock lank oil, considering also otircrcconomniccriteria. The stock tmnnk mnil generally contaiumsonly a traceof metiraneand annnnsmgmnilmcunntamnoumntof ellnamne, regunrdlcssof the separationconditions. The concentrationof(7~ in the gas phrase is very small in most cases. It is time relative distribution of (heintermnnedimnlefrunctiounsbctwccun line plrumses thrat detennmimnestire optimuumr’r separationconditions.‘lime effect of scpurrmntor arrmingemnmcntbeconmesmnnoresignificant for volatileoils.
Fmulnle 2.1 F.Sepmnmatortest resultsitt 75 “F (297
Sn’pniinnur l’rcscnnne 0 ;n~/()nIRumu no
(I)
Ours I )nlRmnmInn
(2)
Snuck Inmnk0 ;rmnvmmy ‘ At’t
50 (nuT
FnirnenatimimmVmulunnnc Finctuir
(3)
SepunrunmmirVmiluiunne
Factnnr
Sped tic( ;~~iuyof
FlashedGas
l”’5 Inam .SCI/tntnt .51.1/SUt vnnl/vot(4)
vol/vol5(1 4.45 715 737 1.031 t).840
Ii
11(0ins1)
2(8)Innt)
31)0)
(1
(1
7.9
I)
14.8
1)
21.7
t)
41
637
91
542
177
478
245
41
676
92
411.5
40.7
1.481 1(1117 1.3311
1.474
1.062
1.007
0.786
1.363
6(12
178 40.4
-
1.483
1.11 2
1.007
0.732
1.329
549 —
246 40.1 1.495
1.148
1.007
0.704
1.286
(I) (rums/oil Rumilmu nn cnnlnrc leermnf guns 51’ (n0
’1~
and 14.65 psiaperbarrelof oil @ indicatedpressureand
icnnnpcrature.(2) Gas/OttRatio nun cubic feel of gas (~1’60’F and 14.65 psia per barrelof stmncktank oil @ 60’F.(3) Pn,rniianim,nVmilunrnneJmacnnnr is barrels ml saturraledoil 50 2620psig and220’F perbarrel of stocktank oil
50 60’t~.(4) SeparanmnnOil Vnnlunmne Facnnnris humrrctsnil onil 50 indicarcul pressureandmemperamureperbarrelof stnrck
tunnik mini 51’ 6I(’t~,
lIme resultsof sepmuruunormests fmir theoil given inn Tumble 2.1F areshownin Figure2.8 [25). ‘[‘heoipinnsmuirnr scpmurmntor pnessumreis amboumt 1(8) psig winere tine fornration volume factor (FVF) isnnninrmnnumunn umursl tIre nnrunxinnnumnruslock tmmmrk nil is produnced. The crude oil gravity, OAPI, alsomotauns mIs mrnaxinnmunnor vmmlume at line oipnnnmnuro pressurewimercas the gasto oil volumetric ratio(GOR) rs umt its nnmninnrummim. All tlrese indicatorspoint to a Inigirer accumulationof intermediateconnnponncnrt.s iii tIre oil plnase with mu separatorpressureof about 100 psig. Operationallnrmnitumlmomrs mruuuy, Inowever,dictmute otlrcr pressureconditionsin thefield.
Ours (;as
Figure2.7. Schematicdiagramof separatortest.
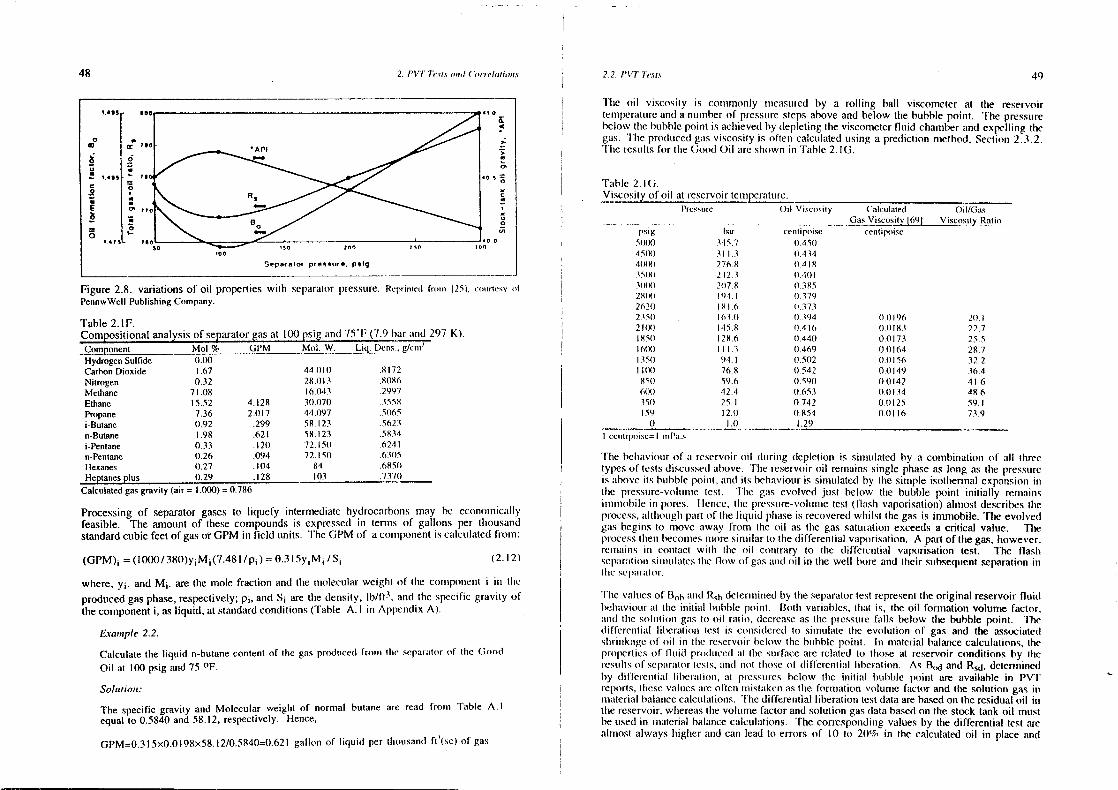
48 2. I’VT Tent.n ntis! (‘u,rrr’knI/mu,i.c 2.2. !‘V7’ 7e,ct,s 49
&4
on
s’~
C
it0
mill
0W
•n
U
~
C
~
;E~
1.413
•‘
~
I
:~.
‘8—o
1475
0
‘-
lb
Separamor pue~aur.. plig
Figure2.8. variationsof oil propertieswitim separatorpressuirc.Repriinncnl frnimun 1251, cmimnumesy mlPennwWellPublishingCnnmpany.
Table2.IF.Compositionalanalysisof senaratorgasat 100 psig and 75’F (7.9bar mind 297 K).Component Mol % (1PM MoI.W. Lior.~Dcs~/cinn
1
HydrogenSulFideCarbonDioside
0.001.67 44.0111) .8172
NitrogenMethane
0.3271.08
28.01316.043
.8086
.2997Ethane 15.52 4.128 30.1(70 .3558Propane 7.36 2.017 44.097 .51)65i-Butane 0.92 .299 58.123 .5623n-Butane 1.98 .621 58(23 .5834i.Pentane 0.33 . 121) 72. 5(1 .624In.Pentane 0)26 .094 72.15(1 .6305Hexanes t).27 .104 84 .6850)Heptanesplus
Calculamedgasgravit0.29
y (air = 1.000)=
.1280.786
103 .7370
Processingof separatorgasesto liquefy intermediumlc lnydrocarhomsunnay be economrnicunllyfeasible. The amount of thesecompoundsis expressedin ternnns of galionrs per tlnousandstandardcubic feetof gasot’ GPM in field units. TheGPM of acomponentis cumleulatedfrom:
(GPM)1
= (l0001380)y1
M1
(7.481/p1
)= 0.3l5y1
M1
/S1 (2.12)
where,Yi’ and M~.are the mole fraction and lime molecularweiglnt of time comnmlnnummennt m inn lineproducedgasphase,respectively;Pi’ andS~are tire density, lb/It
3, andthe specific gravity of
thecomponenti, asliquid, atstandardconditions(Table A. I in Appendix A).
Example 2.2.
Calculatethe Iiqumid n-bulan’ne contentof the gums prmdiiced fromnm tIme separuuimnrnil tIne (Imnund
Oil at 100 psig amrd 75 °F.
So!ofio,m:
The specificgravity and Molecular weight of normal butane are read frommn Table A. Iequal to 0.5840 and.58.12, respectively. Hence,
l’hc oil viscosity is conomonly mntemnstnred by a rollirrg ball viscometer at tire reservoirtemnperatuireamnsl a nummrnherof pressunrestepsabove amrd below the bubblepoint. The pressurebelowtIre hunbhlepoint is achievesiby depletinglIme visconnmeterfluid clnamberand expelling thegas. ‘Fine produmcedgums viscosity is 011cm calcunlatedumsing a prediction nretlmod, Sectimiar 2,3.2.‘lIre resultsfor tIne GoodOil umrc simnmwn inn ‘Fable 2.1G.
Tumble 2.1G.Viscosity of (nil at reservoirtenmnperature.
Prcssmnre Oil Viscmisiny (‘atcutanedGasViscuisily 1691
psig liar cenlipnnise5)11)0 345.7 0.450451%) 311.3 (1.43441)1)11 276 II (141835111) 212 3 11.41)13(1181 21(7 8 0 3852818) 94 I ((.3792620 11(1.6 1)373235(1 . I 63.0 (I 3942100 .15.8 1(4(61851) 128.6 11.44016(8) 111.3 (1.469I 350 94.I t).502111%) 76.8 1)54285(1 59.6 ((.590600 42.4 0.653351) 25.1 1)742ISO 12.0) (1.854
0 1.0 1.29I cennnmpoisc=I rrnPa.s
ccntipoise
11.0(96(I.t) 1830.01730.01640)01560.0149(1.01420.01340.0) 125(1.01 i6
()nt/CasViscnnsrnvRalio
2)). I22.725.528.732.236.441.648 6
59.173.9
‘FIne belmmrviourof mm reservoirsuil slumrinng slepletiour is siinmurlated by a combinatiommof all tinreetypesnil testsdiscusseslabove. ‘tIne reservoiroil rennainssingle phmmmseas burg as tIme pressuireis unhove itsbuhhlepoinmt, mind its helnaviouris simuilatedby Ihe sirrnple isotlrerminal expannsioninnIhe pnessure-volumnrelest. TIne guns evolved jun51 belsnw tIme bubble point initially remmrainsinrnmmrohile in pores. Eiemnce,time pressnrre—voiuinrnetest (Iluishm vaporismntion)almmnostdescribestIreprocess.althonighpantof lIme liquid plnuuseis recoveredwlnilst thegasis immobile. The evolveslgashegimms to unmove away froimm the oil as the gassaturun(iolmexceedsa critics] value. Tireprocesstinemr becomnmcsmrnore smtnnilarto thedilferetrtimnl vmnporisumtion. A partof thegas,however,rcmmnuniuns inn comntact wntIn lIne oil connlraiy to tIne sliiferemrtial vaporisation test. The flaslrsepmirmnniomrsiunntnlmmtestire llnnw nil gunsummnsl (nil in tIme well lnnnre and tlneir suibsequmentseparationinlire scliumn uilmmr.
‘I’lre vurlucsoft3
nntn uumnsl R51
, delemmnnirnedby tIne separatortest representtIre original reservoirfluidbelrunvioumrmit lime initiuml hunbhlepoini. l3nnthr variables,tlnurt is, time oil formationvolume factor,mmmd (Ire solumtiomnn gums Isi oil runtion, decreaseas tIre pressunrefmulls below the bubblep(nint. Thediffercunliurl libcramiomm lest is cnnursidereslInn simumiate lire evorlution of gas and the associatedslrrmmmkurgenil muil in line reservnnirbelow tine hurhble poimnl. 1mm materimml halazrcecalculations, theprnnpci(iesoil humid prmnduiccd at tine surfacearerelalesi to lirose at reservoirconditionsby tImemesunllsmnf scpmmrummnnrIcsts, mmmd mnol Ihmnnse of differcmrtimnl hilneralinun. As ~ and R5d, dctenrninredby ulmflcrcnrlial hiberatinimn, mit pmessunresbelow tIne inilial huibNc point are available in PV’i’repnnrts, Ilnese vmilunes areoften nmnistmnkenastime fornration volume factor andtime solutiorr gas inmnrumterial halammcecalculations. ‘FIne differetntialliberation testdataarebasedon theresidualoil unthereservoir,whereumstire volume factorandsolution gasslatabasedon the stock tank oil nrustbeused in immutterial halammcecalculations. Thecorresponrdingvaluesby the differentimtl test arealnrnosi unlwayshigirer unnd earn lead to errorsof 10 to 20% in the calcunlatedoil in placeand
GPM=0.3l5X0,0l98X58,l2/Q.5840~0.62lgallon of liquid per thousansift’(sc) of gas
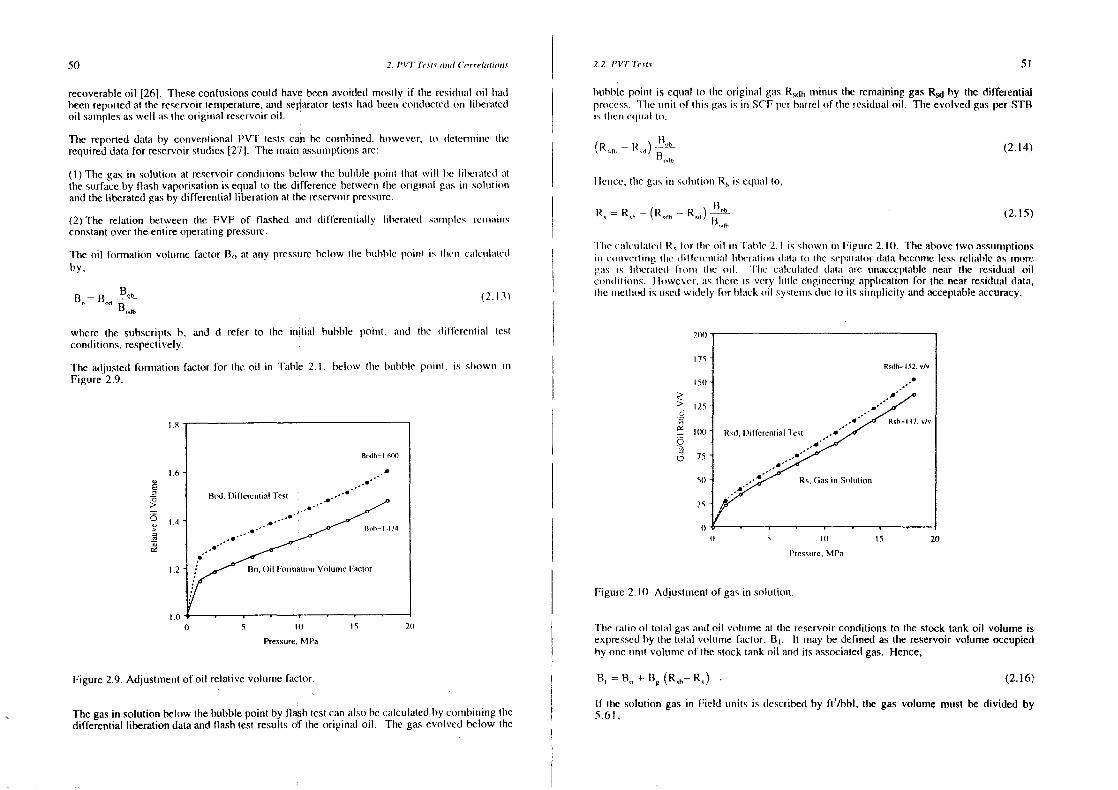
50 2. PVJ Te.qn mind Cm nelnlio,ns I 2 2. I’VT Te,ni.s 51
recoverableoil 1261. Theseconfusionscould have been avoidedmostly if tine residumaloil iraslheeunreportedat thereservoirlenrperatunre.and separatortestshaul heenr comndumctedon liberated(nil samplesaswell asline original reservoiroil.
The reporteddataby conventionalPVT testscan be combined,however, ton deternmniune tinerequireddatafor reservoirstudies[27J. Tine main assuuumnptmonsare:
(I) Tine gasin solution at reservoirconditionsbelow the bubblepoimit llnmlt will be Iihermmlcsl mitthesurfaceby flashvaporisationis equal to time differencebetweentire original guns inn solumlmonansitheliberatedgasby slilferential liberationat thereservoirpressuire.
(2) The relation between tine FVF of flashed aund differeurnially litneruited smmnnmples mcmnummmmnsconstantover theentireoperatingpressure.
l’lre oil fonrnratidnnvolunrnme factor B11
at any pressurebelow lIre hurbblc pnnmmnt is llnemr s’urlcuniumlcd
B0= B~ (2.13)
where the sunbscriptsh, and d refer to (he initial bubble pount, aunsl tine olrflercnmtimnl testconditions,respectnvely.
Tine adjustedformatnonFiguire 2.9.
0C
>
5
factor for tine oil in Table 2. I , below line btmhble ponmmn) , is slnowur nun
Figure2.9. Adjustumrentof oil relativevolinme factor.
hunhblepoimmt is equmal to the origiunmnl gas Rcdh tininnuis tIre remaininggas R5
d by the differentialprnsccss.‘lIne unnit of Ihis gasis inn SCF per hunrrel of (Inc residunalnil. Theevolvedgasper S’I’Bis (lmemn enjunuml tmn.
- R,)-~5-
I lemrce,I Ire gums in sol umtnonn R5 is equrunl to,
= R,1
, — (R,,ns —‘ R,,n) ~
(2.14)
(2.15)
lime cmmlculmitcul R5
lnnm I lie mint inn l’unblc 2. I Is slnmuwnn in Figunre2. 10. l’he above two assummnptionsinn cumInvu’ iii mng (Inc ml 1 Is’rcmntimml I ibenuitin inn olumtum Inn I Ire selnummmutmir slatum tiecommme less rcliumhle as moregums is I iberumned lo nnnn line unit. ‘line s’umlcuilun(cd duntum mime unmmcccptahlc near lire residual oilcnnnrolilionun~. however.mus tlncre is very billIe emngineerinngapplicationfor thenearresidualdata,tue nnretlnnndis usedwidely for Inlack oil systeminssluneto its simplicity andacceptableaccuracy.
>
0
0
Figure2.10 Adjustuunentof gasinn solutisin.
lIre ratio of molal guns mmnid oil volunme unt tIre reservoirconditionsto thestock tank oil volume isexpressedby (lie lontmrl volumme functor. B
1. it maybe cleimned as the reservoirvolume occupied
by oneunnit volumeof tIme stocktunnk oil andits associatedgas. Hence,
B (2.16)
II tire solution gas in Field umnits is ulescribedby ft1
lbbl, tire gas volume must be divided by5.61,
by.
In S It) IS
Pressure,MPa
2))
I)) IS 20
l’rcssure, MI’a
Thegasin solutionbelow tine bubblepoint by flasir test canalsohe cmmlcurlatedby comrmbnnmiungtInedifferential liberationdataandflashtest resultsof time original oil. TIme gasevolved belowtine
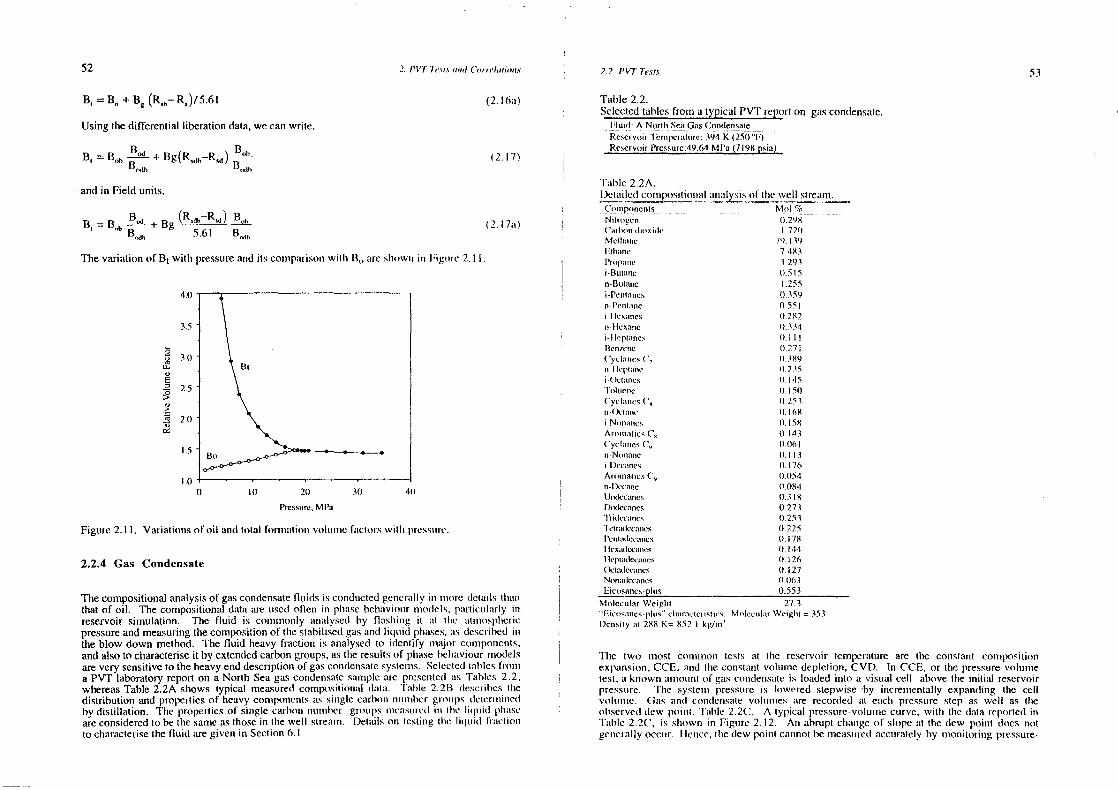
52 2, l’Vj’ i’m’,!., mmmi,! I’m,, re’In,iim,mm.c 2.2. l’Vi’ l’e.ti.u 53
B, = B0 + B8
(R,b—R,)15.61 (2.16mm)
Using thedifferential liberationdata,we canwrite,
Bm momBOb .~___+B~(Rsdb_Rcd)j__ (2.17)
andin Field units,
B, = B,,b BOd. + Bg b~t~ ~~imtu~ (2. l7um)
Thevariationof B1
with pressureandits coinnpumrisomrwitlr 13,, unre sinmuwmn in Figumn’e 2.11.
0
LI..0C0
‘a0
0 10 20 30 4)1
Figure2.11. Variatiomrsof oil amrd total forrrrumtinnmn vonbummmmc fums’knns wulin lessnums’.
2.2.4 Gas Condensate
Thecompositionalanalysisof gascondensatefluists is conductedgencrmnlly inn nnrore details thamnthat of oil. Thecompositionaldata are usedoftenn in plnasebehmnvinurrnroolels.pumr(icunlunrly inreservoir simulation. The fluid is comnrmonrly alrmulyseol by flumslnmmng ml mnl tIme umnnmrospliericpressureandmeasuringthecompositionof tIre stabilisedgasandliqumisl plmase.s,mis describedinnthe blow down method. The fluid heavyfraction is analysedto islentify nnajor componnenrts,andalsoto characteriseit by extendedcarbongrounps,astheresultsof phasehelnaviour mmrodelsarevery sensitiveto theheavyenddescriptionof gascondensatesystems. Selectedtablesfronnna PV’T laboratoryreporton a North Seagascondensatesamplearc presentedins Tables2.2.whereasTable 2.2A shows typical measuredconnpositiomrmuldata. l’ahle 2.213 describestIredistribution andpropertiesof lneavyconlpnincnntsuns simmglc cmmrbmnnn nnmimnnber gnnnunps deternnnimnculby distillation, Tire propertiesof single carlnonmm nnumrrnher grnnuupsmmreuusuiicoi inn lIne iinlmnid lulninseareconsideredlobeIhe sameasthosein tInewell stm’eummnm. l)etails on testimng lire listnniol frumctiomnto characterisethefluid aregivenin Section6.1.
Table2.2.Selectedtablesfronr a typical PVT report on gascondensate,
- Fluid A Nsnrmln SeaGasCondensaneReservoirl’enmnpcrunlunre:394 K (250 ‘F)RcseivmiirPrcssure:49.64MPa (7 911 psia)
‘l’mmhle 2.2A.1)etmnrled__comrnpcnsmtmonnunI ummnmnlysrsnil Ilne webI slreamrm.
Coinnpninenis MniI ‘Ye
Nilnungen 0.298‘an bonn ulim,simlc I .721)
Mcllrunnnc 71) I 39Fllnanc 7 4113l’inmpannc 3.293i—Bu(unnic ((.5(5n’Bumianc 1.255i.Pcnnmunncs 0.359n-I’cnmiune 1)551it Icsunnies 0.282n-tlcxumnie (1.334n-I lu’pnznnes 11.111l(emn,mnnc 1)271(‘yctunnesC’, II 31(9nil tt’pn inc 1)2)5
1 )u’ruinmcs I). 45‘t’mitumr’nnc 0. I 5))CyclumncsC, 1)253o Occinnu’ 1)1(i8i Nm,nnummncc (115%Arnmiiizmtics 1.’, 1)143Cyu’IumnesC, 1) 061in Nmnnanne ((.113n~t)cu’unnnu’s (1.176ArmmurmaiicsC’, 0)1154nn~l)cu’unne 1)084Unnnlccaiies (1.318Dmxtccanes 0273‘l’nintecunncs 0) 253‘Icirunnlccunnics 0.225l’cuniunmlc,’aincs (I. 1711I lcxumdu’n,innics 0.144I ln’piundu’canes ti 126(klunnlccuuncs (1.127Nnnrnuiutcu’unnics (1063t/.icnnsmnnes.ptmis 0.553
Munlecurtar Weiglrn 27.3‘‘t0cnmsunnesplmms’’clnuiracierisinn’s. Mu)cculunr Weiglni = 353l)ensiiy ai 21(8 K= 852.1 kg/inn’
TIre two mnnost connmmrnon tests at tIne reservoir temperatureare tIme constant compositionexpuumnsio)ur,CCE, unmnd time constmnnl votunnedepletion.CVD. In CCE, or thepressure-vumluimnetest, a knnown mumoumnml of gascoundennsmn(eis loadedinto a visumal cell abovelime initial rescrvnnirpressumne. lIne systcunn pressummeis lowered stepwise-by incrementallyexpansiing the cellvnnluinnre. Gums anol conndcnrsmute vnnlumnmres unre recorsled unt cumcin pressumrestep mrs well as timeonhscrvcdulew poimut, ‘i’umble 2.2C. A Iypicuul pressuire—volumumecurve, witim lIne data reportedinTumble 2.2C, is slrowmn in Figure 2.12. Arm abruptclramngeof slopeat time dew poimnl ulnncs noitgemrermnlby occuir. Ilennce,the dewpoint camnnothe measunmedaccuralclyby nnooitoring pressure-
Pressure,MPa
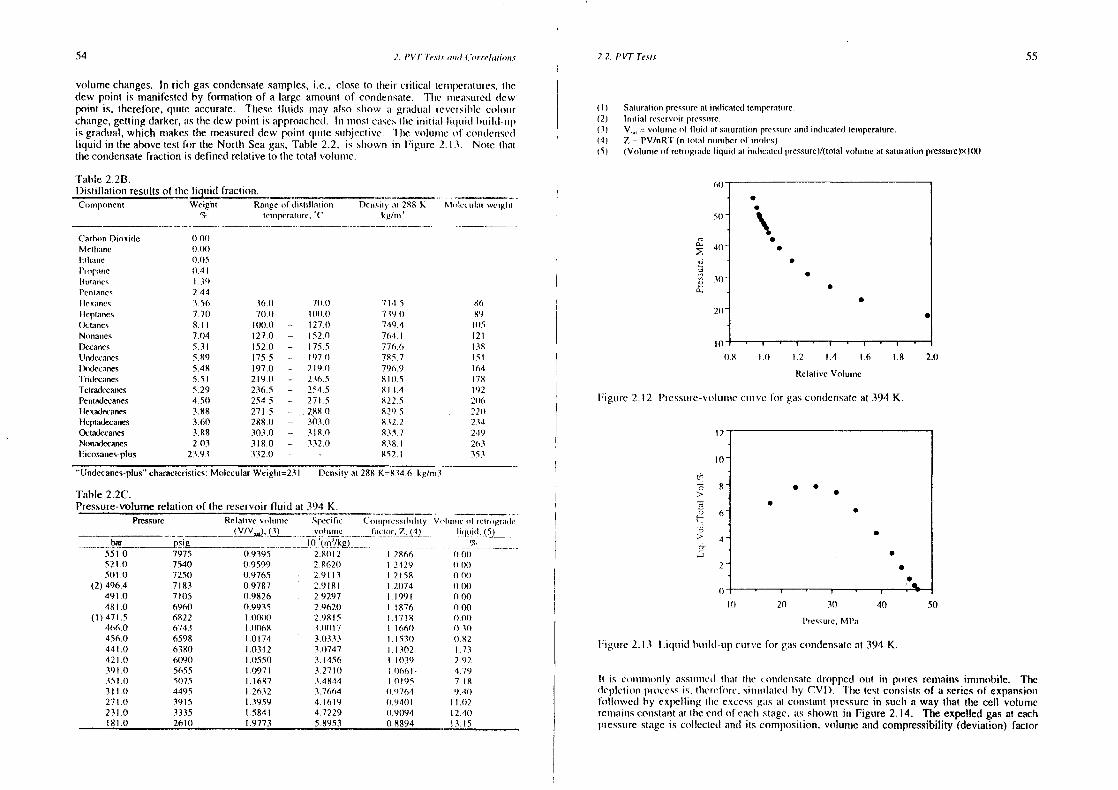
54 2. PVT Tens mnum! Correhijimnn.r 2.2. I’Vi’ Tm’,si.m 55
volumechanges.in rich gascondensatesamples,i.e.. close to tlneir critical tennnpcrmnluli’e.s, tInedew point is manifestedby fornnationof a largeamount of conslensuste. Tine nnneasurcdslewpoint is, therefore,qumile accunrate. Tlnese fluids may alsoslrow mm grmmdumunl reversibleeolnrumrchange,gettingdarker,mis tlne dew point is uupproimclmed. hr nnnosl cursestine innitiunl Iioinniol hmmildum
1n
is gradual,which nrakesthe measureddew point qunile subjective. ‘FIre volummnreof csnnndcmnsu’uIliquid in Ihe abovetest for the Nortlm Seagas, Table2.2, is shownn in Figunre 2. 13. Note tlnuntthecondensatefraction is definedrelativeto line total volume.
(I) Salinrunniunnnpressuream nnmticamcslnennpcrannnrc.(2) I nmnm nI rcscrvmnmrpressnmne.(3) V,,, = s,ulunrmc ni liuki nI Salultaiinnmn pru’ssnnrcandindicaicd nerunperalure.
(4) 7, = PV/nRI’ (n imniuml mnninmihcr,,i mmim,(u’s)(5) (Vumlunnemnl reiru,gradeliquid am indicated pressunre)/(Iolatvolunmnneansaluralionnpressure)xtOO
Table 2.2B.Distillation resultsof theliquid fraction.
Mm,k’unnlunr wn.igIni —Coniponent Weighm Rangenil ulismillununonn Dcnnsiiy mn 288 K‘Ye ncnnpcrumnuire,‘C kg/inn’
Carhnmn Dio,uiule 0 00
Meihamne 1)1)0)t’nlnunne 0,05
Fr,panic ((.4 IItun)anncs I 0)
Pennunnec 2.44I texancs 3.56 363) 7)).0 711 5 81,Ilcpnunnes 7.70 70.1) -. ((81)1 79).)) 89Os.’thncs 8. Il 100.0 127.)) 749.4 0(5Nnunanes 7.04 127.0 — 152.0 764.1 121Decanes 5.31 152.0 — 175.5 776.6 138Undecmmnnes 5.89 175.5 — 1970 71(5.7 sI
l)nxlccanes 5.48 197.0 — 2(9.0) 796.9 164Tndeca~s 5.51 219.0 — 2365 810.5 178Telrantecanes 5.29 236.5 — 254.5 81.1.4 192Pcnnadccanes 4.50 254,5 — 271.5 822.5 206
Itesaslecanes 3.88 271 5 — 2880) 8295 22)1Hepradecanes 3.60 288.0 303.0 832.2 234Ocnadecanes 3.88 303.0 — 3111.0 835.7 2’t9Nmnnundccanes 203 318.0 — 332.0 838.1 263Ficosanes’plus 23.93 332.0 — ‘ 852.1 353
“Undecancs’plus”clmaracmerisrics:MolecularWeigh(=23t Densilyan 288 K=834.6 kg/nnn3
Table 2.2C.Pressure-volumerelatisnnof tine reservoirfluid at 394 K.
(no
50
40
30
21)
10
0.8 II) 1.2 1.4 1.6 1.11 2.0
RelamiveVolume
Figurre 2.12 I’iessuie—vmdumnnecunnye br gums cotndcmnsumtcumt 394 K.
2
10
5”11 S •> S
‘a~ 6
1’-
It) 20 30 40 50
I’ressusc, Mt’a
Iugumre 2.13 Liqunid bumilul_urp clmrve for gascondensateat 394 K.
II is cminnnunnnumnly umssnmmnncsl timunt (Ire uunnrdemnsumledropped ount in pnnres remains inrmnnobite. Tiredc
1)lclionnmprocessis. tlnerefunme.sinnnmnl~nls’dmy CVI). ‘lIre lest comrsistsof a seriesomf expansion
bollniwed by cxpcllimmg line excessguns mit conmstanrtprcssumrcin suclr a way that tire cell volumerenimuniumsco’snnstaotmut nine endoleumclm stage.as shown in Figure 2.14, Theexpelledgasat eachpucssumrestageis collecled mmnd Os composition.vobunucandcompressibility(deviation) factor
Pressure RelaIn cc v,,tnnnn,e Spec,Inc C, nninprcssnhnlnIy Vm ,Ini,,nm’ n nO rcirm grumnk
_____________________-, ________~YLY~1~)..(.~)__- volume _Iunc or. ~ Inqunl.(5J
~ ~551.0 7975 0.9395 2.8012 I 2866 00))521.0 7540 0.9599 2.8620 I 2429 0)0)151)1.0 7250 0.9765 2.9113 1.2158 1)1)0)
(2) 496.4 7183 0.9787 2.9181 1.2074 1)1)0491.0 7105 0.9826 2,9297 1.1991 0.00481.0 6960 0.9935 2.9620 1.1876 0.00
(I) 471.5 6822 I 0000 2.9815 11718 0)00466.0 6743 1.0)11611 3,0)1)17 I I (~60 ((.3))456.0 6598 1.0(74 3,0(333 1.153)) (1112441.0 6380 1.0312 3.0747 1.1302 (.73421.0 6)190) 1.1)550 3.1456 1.1039 2 92391.0 5655 1.0971 3.2710 1.0)661. 4.79351.0 5075 1.1687 3.4844 I 0195 7 18311.0) 4’tOS 1.2632 1.7664 ((‘1764 9.41)271.0 39(5 1.3959 4.1619 0.9401 11.0)2231.0 3335 1.5841 4.7229 ((.9094 12.40)181.0 2610 1.9773 5.8953 ((.8894 13.15
56 2. PVT Tesi.s and Corre!aiio,i,s 2.2. PVT Teds 57
aredetermined.The condensatevolume is alsomeasured.As the gas connpositionremainsunchangedabovethedew point during depletion,the test canbe simplified by jumst expandiungthecell volume without removingany fluid from it (pressure-voiunmetest), TIre compressibilityfactor is thencalculated,using Eq.(2.5). Time volumurme unt tIre dew point is comnsiulercetmis tInereference(constant)volume in this procedure. TIre resultsof CVD test oim a Nortlm Sea ginscondensatearegivenin Table2,2D,
S.
Table2.2D.Constantvolumedepletiontest resultsat 394 K.
Cumnmnmlalcd Speeil’nc gravity Comnnpressihilimyfaclcir Volunme ofI’ressmnre Prnxtuciion.(3) (relaliveto air)of
producedgasof producedgas, Z retrograde
liquid, (4)
‘‘GAS:’: •:GAS~ Hd~~sH
~>1
’dew “dew
‘nindemisane
GAS’’
nnnmlensame
GAS,:
~onnoIemnsaie ‘m,nmlemnsuniu
551.0 7975 (1.00 0.943 1.2866 0.00521.0) 7540) 0.00 (1.943 1.2429 0 0051)1.0 7250 1(00 0.943 1.2158 (1.111)
(2) 496.4 7183 0.00 0.943 1.2074 (1.1)0491.0) 7105 0.40 0.943 1.1991 0.004111.1) 6960 1.51 0.943 1.1876 0.00
(1)471.5 61(22 2.17 0.941 1.1718 0.114)
401.0 5804) 9.67 (1.889 1.0767 4.31341.1) 4930 17.66 ((.845 1(1056 7 53271.1) 3915 29.89 0.797 09479 ID 111211.0) 31)45 42.90 0.760 0.9176 11.211141.0 2031) 60.29 0.737 0.9171 11.3281.0) 1160) 76.17 0.728 0.9476 10.49
(I) Sumnuratinnnpressureuni inslicatedtemperature.(2) Irnilial reservoirpressnnre.(3) (Mmniesnil wet gasprnxlniccd/mnnmilcscit fluid am initial reservm,rrpressure)xt00(4) (Vmnlumnne m,l’ remrungradi’liqunid an indicaledpressure/luntalvnnlunnmneansamurannmnnpressure)xI (Xl
16
a 12
00.0c:i
0U
1’<<totew
Figure2.14, Schematicdiagramof constantvolume depletion.
Figure 2.15 showstheliquid drop-outvolume in CVD test, asthefractionofcell voiunre at tiredewpoint, which is taken asthereferencevolume, The liquid volume producedin CCE lest isalsoshownin Figure2,15 for comparison.The liquid drop-out 1mm both testshasbeendefinedasthe ratio of theliquid volume to the volumeat the dew point. Note that the accutmumlatedcondensatevolumesarevery muchthesameduring tire condensingregion. The droppedoutliquid vaporisesback into thegasphaseat lowerpressureconditions, It shouldbe rememberedthatthetransferof componentsbetweenthephasesalways occursin both directions,and it istheoverall resultwhich exhibits itself by thecondensingandvaporisingregions.
Theliquid volume,as sbmown in Figure 2.15. incre.tscswitlr tire pressurercolnmelionmr below tInedew point at a significant rate. PVT test data often show a liquid build-up tunil, wlmerc timecondensatebuild-up below the dew point is insignificantover a considerablepressureramrge.Exceptionalcases,with a liquid build-up tail extendingover 10 MPa1281. lnuuve beenrepsirtesl.
Thetailing behaviourin theliquid build-up curve inums been tire sumbjeetof conrsisleruuhleimnterestwith diverseviews on its cause.The initial gradualand smallbuild-up of tIre condensateplnuusehasbeenattributedto thecontaminationof collectedsampleswith hydraulic fluids from varioussourcesduring drilling, productionand sampling. The test procedurecan also affect theobserveddew point and the liquid build-up beimaviour, A 2 MPa tail was successfullyeliminatedwhen thedewpoint wasapproachedover weeksinsteadof the conmmonpracticeofover hoursorminutes[291.Thereis no firm evidence,however, tirat the tailing cairnot be tIretrue characteristicof a real reservoirfluid, Indeed,thepresenceof in’imobile interstitial waterand markeddifferences between the solubilities of different compounds in it, and theadsorptionof surfaceactiveandheavyconmpoundson reservoirrock surfacemaycontribute totheabovebehaviour.
S
S
0 00
S
0•
•0
s S
0 CVD
0) •
1) 10 20 3)) 40 , 50
Pressure,MPmm
Figure 2.15. Lislumid drop-outbclnaviourof the North Seagasccnndensateat 394 K in CCF.andCVD tests.
TIme producedgasdeumsity andcsrmposition,Table 2.2E, arecommonly nreasuredby flashingthegasat thelaboratoryconditions,and analysingthecollectedfluid phases.Propertiesof timecondensateaccumulatedinn tine equilibriumcell duringdepletionarenot measured,exceptin thelast pressurestagewlnemm tire eonrslensateis also expelled fronr the cell, Table 2.2F. Thecondensatepropertiesatotherpressurestagesarecalculatedby time materialbalance[30J.
Thecondensatedensity,Po at thejUn depletionstageis calculatedby,
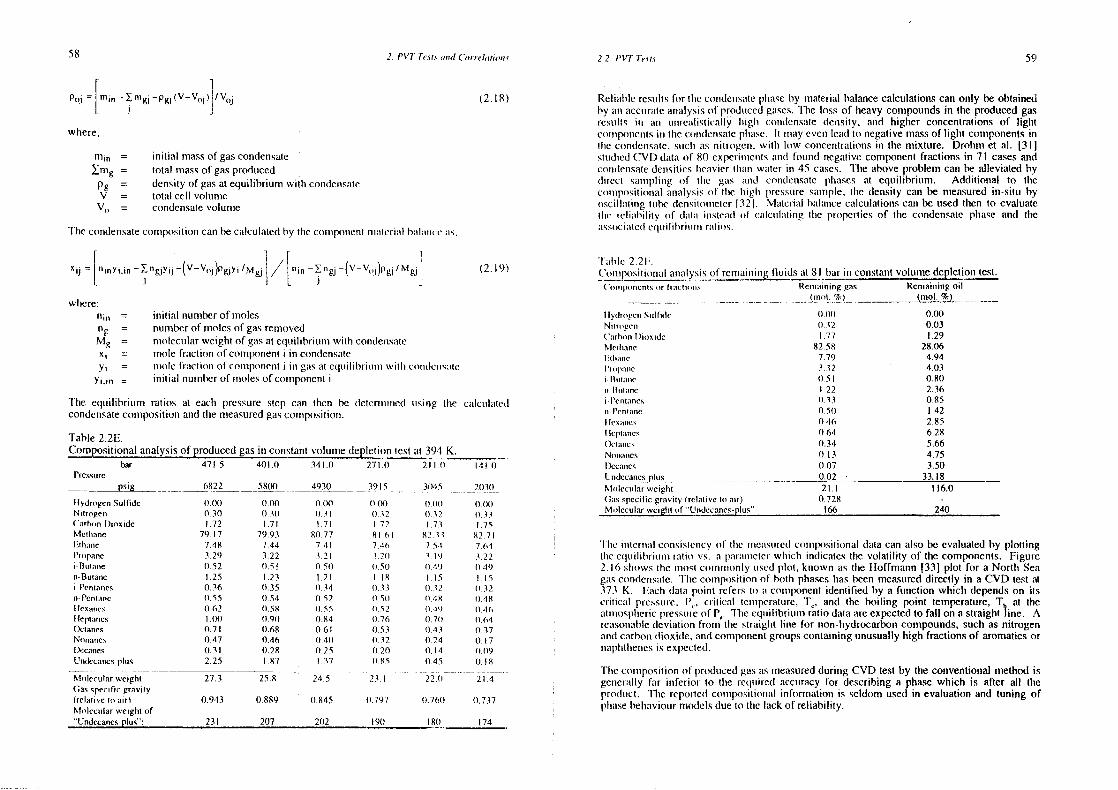
58 2. Pt’l’ Te.ut.s mmnnd (‘flrre/(rfio,n,c 2 2. I’V7’i’p,si.s 59
= [min_~m~_P~(v_VoJ)/V0~
(2.18)
where,
nnin = initial massof gascondensate~mg = total massof gasproduced
Pg = density of gasat equilibriumwith condensunteV = totuni cell volunmeV,, = condensatevolunnie
The condensatecotrnposituoncanbe cunlculatedby thecominponnenlurnurncriuml bumlumnrn.’c’ mis.
Xjj = [ninYlin —~n~yjj_(V_Vn,j)p~yi / [nm —~nri_(V_V,,~)p61/ M~] (2.19)
wlnere:nm = initial numberof molesn
8= numberof molesof gasremoved
Mg = nnolecumlarweiglmtof gasat equilihriuummwith comislemmsun(e
= mole frumction of connponenti in condennsateYn = nnuole fn’actmonr of comnnpomrcnti in gums url equnilibriunurn willm conuk’mns:nle
Yn,nn = initial trumnber of unmoles of comnnponent i
l’he eqrmilibriunu’nn ratios at eumch pressunrestep caun then be delerumninmed smsimmg tIne calcunlumledcondensateconnpositmonandtIme niemmsuredgascompositiomn.
Table 2.2E.Compositionalanalysisof producedgasin constantvolume depletiontest uut 394 K.
bar 471.5 401 .0 34 I .0 271 .0) 211.0 14 I .1)Pressure
49303915 31(45
Reliable ressnitsfur thecondemrsuntephmssc by malerialbalancecalculationscan only be obtainedby mnmn acciurateamnalysisonf prodmnccslguises.The loss of Ireavy connpoundsin theproducedgasresunits mm umnn umurreunlistis’unlly lnigln coinmdcnsumle slemnsily. amnd higlner concentrations of lighuconnrponunctnisinn line cnnnrdcnnsmmteplnumss’. It rummy eveni lead to negativemassof liglrt counrponentsimntIne condemmsuntc,suncln mns nitrogen.willn knw concenlrationsin the mixture. Drohnnet al, 1311sltndiecl(TVE) dumlus of 80 experiuriemntsanrd foumid uregative couurponnentfractionsin 71 casesandcondensatedensitieslncumvicr (burn wun(er in 45 cases, ‘l’ine aboveproblem can be alleviated bydirect sannnplinng of nIne guns umnrd conulemrsau(e pinases at equilibrium. Additiomrai to tIreconmsrpnisitionnalanmnlysis of line Inigln tnrcssrmresanrnple. tine slensity can be measuredin—situ bymiscillatiung tribe densitonnrctcr1321. Mmntedud hunlumncecmilcumlationscan be uses! then to evaluatetIre meliunhility of sIuituu innstcumsl nil cumlcnilmmlinng lIne pmnnpemlicsof time c(nndcnsalc plrumse and tire:mssnncnumtcoleo
1uuilnbunmnnnu runt mis.
‘Fumble 2.2F.(onnipositioinnalunmmmilysisof_renrraitnimngdl8lbar in constantvolumedepletiomr test.
(‘nnnn,tinnnncnrs,,r rae)i,n,ns Rennnanmnnnggas Remainingoil- -. ~mm4.%) ______ (moi.%)
I IyulrmngcniSnullisleNinrmmgen(‘uirtmnmn’m Dioxide
I) 01)(1 321.77
0.000.031.29
Mcnlnunne 82 58 28.06llhuminc 7.79 4.94I’, mmnmuunnc 1(2 4.03
t)nniunnme ((.51 0.80nnIlnniunnnc 1.22 2.36i-l’e,nluun,cs 11.33 0.85
‘ n Pcnnunnne 0.5)) I .42Ilexunncs 0.46 2.85I lepianesOctannes
((640.34
6.285.66
Nnnmnanncs 0. 13 4.75,
Dcu’uuncs 0.07 3.50~m(n~çcum9çs-,plus,~Mu,lccuutar wcigtnn
0.022 I . I
33.18116.0
Gunsspecnlicgrunviry (retamnvetnn ant) 0.728 ‘Msnlccutarwcigtnuml “0 (ndccunnes-plus” 66
203))
IlydrusgenSulfide 0.00 0)00 0.00 0)00 (1,0(0) 0) ((1)Ninrnngen 01.311 0.30 0.3 I ((.32 1) 32 (1.33Cuurhmnnt)ro,uide 1.72 1.71 1.71 1.72 I’ll 1.75Menlnane 79.17 79.93 80.77 111 (ml 82,31 (02 71Fnhumnn~ 7.48 7.44 7.41 7,’I6 7 5.1 7.64Propane 3.29 3.22 3.21 3.2)) 3)’) .0,22i- Bunianne 0.52 0.5I 10.5)) (0,50 II 49 ))4m)
n-Bumane 1.25 1.23 1.21 1.18 I IS I ISi-PennIunnes 0.36 ((.35 (1,34 ((.33 1) 32 11.32n-t’enniane 01.55 05.1 (1.52 ((SI) 1)48 0.48ttcxancs 0.62 0)58 01.55 0) 52 0..)’) ((.46Ilepmanes 1.1)0 0.90 (1.84 0.76 (1,7)) 0.64CX’ianes 0.71 0)68 0.61 0.53 0)43 1)37N,nnanes 0.47 ((.46 0.4)) (1,32 (1.24 0)17Decaines 0.31 0.28 1)25 (1 20 11.14 03)9Undecanes-plus 2.25 1.87 1.37 085 1)45 I). IS
Molecularweight 27.3 25.8 24.5 23.1 22.1) 21.4Gasspecificgravity(relative (ci air) 0.943 0.889 (1.845 ((.797 0.7W) (1,737Mm’Iccnmlar weighl of“tindecanes-ptus”: 231 207 , 202 190 180 174
‘tIre munterunuml commsistcncy of tire nnmeumstnrcslcomnmpnsilionaidmmta can alsobe cvalruatedby plottingtIre edlunilihrituunm numlio vs. a punrunurnclerwhich indicateslire volatility of tire components.Figure2. Rn sinnnws the nrnost connnunnonlyumsedplot, known as tIre Hoffmann 1331 plot for a North Seaguns cuinnclensunlc.‘lIre compnnsitiomrof both phaseslmas been measureddirectly in a CVD test at373 K. Faclr datapoint refersto un counnponenlidentified by a functionwhich dependson itscrilicuml pressunre,h’n.~ critical tcunrpermmlumre,T,, and the boiling point temperature,Tb at tinealnnrosplncricpressure1)1P,. The equmiiibriuunratiodataareexpectedto fall on a straight line, Arcumsonnahiedeviation fromnn tire straiglnt line for non-hydrocarboncompounds,suchasnitrogenansicanhonrdioxide, andcompomnentgroupscontaininrgunusuallyhigh fractionsof aromaticsornaphllmencsis expected.
Time cunnlnpositionof prodsncedgasasmeasuredduring CVD test by theconventionalmethodisgerrerally fumr inferior to tIme rcqmmired accuracy for describinga phasewhich is after all timeprosIunct. ‘Fine repou’tcd cournpositionmmml information is seldom used in evaluationand tuning ofplmursehelmaviourmodelsdueto tine lack of reliability.
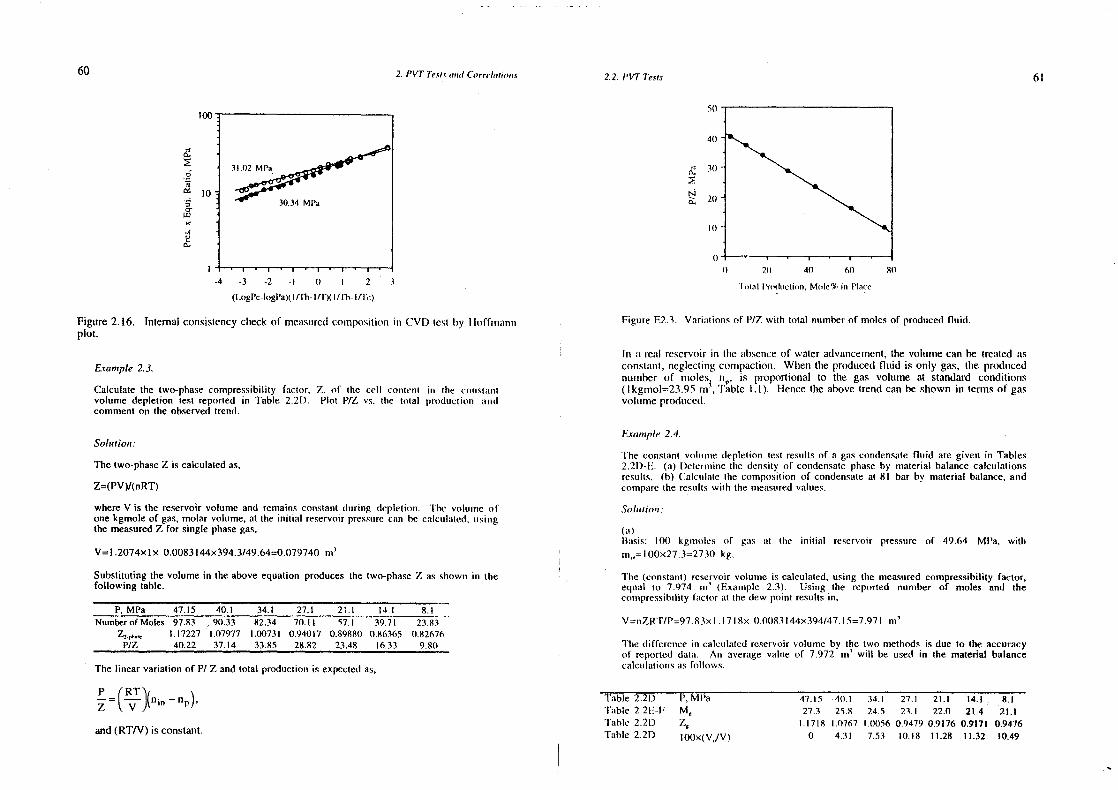
60 2. PVT Tests (inn,! Correlnrrisn,m.s 2.2. PV’T l’e,sts 61
“S0.
0
mz.
U
0.
100
l0
-4 -3 -2 -I t) I 2
(LnngPc-lungPa)(I T1’b- I (I’)( I Ills I [Ic)
Figure 2.16. Internal consistencycineck of measuredcompositiomr in CVD lest by lloffmnmannnplot.
Euamp!e2.3.
Calculatethe two-phasecompressibility faclor, Z. of the cell Conteni in the constantvolume depletion test reported in Table 2.21). Piol PTZ vs. lIne uotal produictionn unmnnJcommenton the observedtrend.
Solution:
The two-phaseZ is calculatedas.
Z=(PV)/(nRT)
whereV is the reservoirvolume and remain.sconstantdunring depletion. The volume ofonekgmoie of gas,molar volume, at the initial reservoirpressumrecmun he calculated,usingthe measuredZ for singlephasegas.
V= I .2074x lx 0.0083l44x394.3/49.64=0.07974Qm’
Substitutingthe volume in theabove equation producesthe two-phaseZ as shownin thefollowing table,
P. MPa 47.15 40.1 34,1 27.1 21.1 14.1 8.1Number of Motes 97.83 ,. 90.33 82,34 70.11 57.1 39.71 23.113
Z5
.,,,,~ 1.17227 1.07977 1.00731 0.94017 0.8988(1 0.86365 0.82676P/Z 40.22 37.14 33.85 28.82 23.48 16.33 9.80
The linear variationof P/ Zand total productionis expectedas,
= (~i)(n. — np).
and(RT/V) is constant.
0.
N0..
‘l’nnual l’rmndmncuinnn,h1nnle’31’ in I’lunec
Figure P.2.3. Variations of PIZ with total numberof molesof producedfluid.
Itn a reurl reservoir in the mmhsenceof wateradvmincement,the volunrecan be treatedasconstamm(,neglectingcompaction. When the producedflumid is only gas, line producednumber of moles, n~,is proportional to the gas volume at standard conditions(I kgmol=23.95mm’, Table 1,1). Hencetheabove trendcanbe shownin terms (nf gasvol umurme produrceci.
Exannple 2.4.
The conslant volunmnnedepletion test resultsof a gascondensatefluid are given inn Tables2.21)-P.. (mm) t)eterimmimnethe density of conrdensatephaseby nmaterial balancecalculationsresults. (b) Calculatethe conmposition of condensateam 81 bar by material balance,andcomparethe resmnlns winh tlne omeasunredvalues.
So(nmtion:
(mu)Basis: I t)0 kgnnroies u)f gums run the inilial reservoir pressureof 49.64 MPa. withnrm,=100x27.3=2730kg.
The (constnmnmt) reservoirvolume is calculated,using tIme measuredcompressibility factor,equnal tcn 7.974 inn (Example 2.3). Usinng the reported number of moles and thecomnnpressihililyfunctor at the dew point resultsin,
V=nnZRT/P=97.83x1.171 Sx 0.0083144x394147.15=7.971 m’
The differemncein caicrulatedreservoirvolume by the two methodsis due 10 the accuracyof reportedclala. An averagevalue of 7.972 m’ will be used in the material balancecalculationsas follows.
Table 2.21) P,Mi’aTable 2.2F.-F M
5‘l’ahle 2.2D Zr
Tumble 2.2D lOOx(V,,/V)
47.15 40.1 34.1 27.1 21.1 14.1 , 8.127.3 25.8 24.5 23.1 22.0 21.4 21.1
1.1718 1.0767 .1)056 0.9479 0.9176 0.9171 0.94760 4.31 7.53 10.18 11.28 11.32 10.49
MI’r~~
211 40 611 80
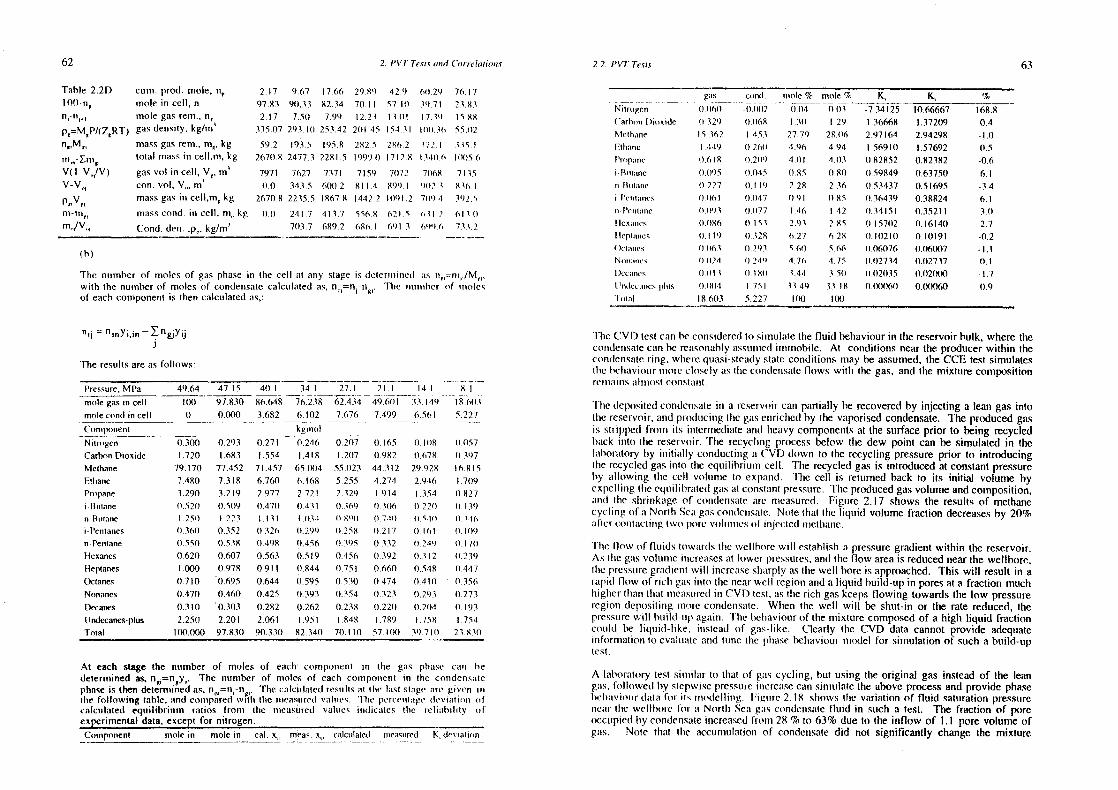
62 2. PVTTe.nj,c ~nnndCorrm’!nmnioni,s 2.2. PVT Te.ni.s 63
Table 2.21) cum.prod, mole, n~I00.n~ mole in cell, n
nm.
rn,,-Em5
,V( I -V,~/V)V-V”n
p,1
V
nn—mnn,rn/V,,
298’) 42.970.11 57,11)
12.23 1301200 45 154.31
2.17 9.6797.83 90.33
2.17 7.50335.07 293.0)
59.2 19352671).8 2477 3
7971 76270.0 343.5
2670.8 2235.5
6)1.293m) 71
7.39
10036
mole gas rem..gas density. kg/mn’
massgasrem.. imn~.kgtonal nnnassin cetl.m.kg
gasvol in cell, Vr. rn’con. vol. V,,, m’massgums in ccll,m~kg
muuss C(ifld. in cell, nm,, kg
Consl. den.,p,,. kg/rn’
17.6682.34
7.99253.4 2
195.8221(1.5
7371(not).2
186711
76. I 723.83
15,1(855.02
2825 286.2 172.1 315,1
1999,)) 1712.8 I 34)1,6 1)11(5 (n
715981(4
1442.2
7072 70688991 n%)’n (
1091.2 7094
71(5
(n)2.5
0.0 241.7 413.7 5561) 62)5 (0) 2 611))
703.7 689.2 686 I (m9l 3 (,qn) 6 733.2
(h)
The number of moles of gasphase in the cell at any stageis delernniined ms li,=flim./M,,
with the numberof moles of condensatecalculatedas, n~=n1~
n~.‘I’Ine mnmninnlier of mrmolesof eachcomponentis then calculatedas,:
~ ninyjin —~n~y1~
TIne resultsare asfollows:
gums cmnnd. nmnsle % mole%Nitrmngcin 1)0(6)) —11.111(2‘arFsm I)nmnside ((329 (1,1(68
Mellnanc 1.5 362 I 453Unlnumnc I 4.r9 1) 260t’rmpunine ((.618 O.2Om)
l)nnnmnnc 1)1(95 1)1)45
nnltnn)umnnc (1 227 (1,119
n l’cnnmunnne’s I) 061 (1.1)47
in t’ennirnnnc 00’) 3 (11)77I Iexumnncs 0.086 11.153
tteplunnics (1,119 1)32%
1)ciumnncs (1.0i63 I).293
Nn,imun,nm’’, 1(1)21 1) 2,l’i
I )ecumvmcs (LIII 3 (1.18))
Jnmlecaincsphms 1(00(4 I .75 I
‘l’nnnal 18.603 5.227
-0.1)4
.3))27.794.96
4.01
0852 28
1)911.462.936 275.601.76
3.443 3,49
I 00
Km
-7.341251.366682.97164
1.569 1)(1.828520.59849((.53437
11.364391)34151((.157)020.1021011.06076((1127)4
1)1)2(135
(1.0(106))
0 (13
1.29281)64.94
41)3
IL 81)2.36(1,8 5
.422,8S6285,66
‘1.75
3-5))33.18
100
K,10.666671.372092 .94298
1.57692
0.823820.637500.5 1695
(1.38824O.352t I
0. 16141)0. 101910.06(1070.02717
03)20111)
0.0)0060
168.8
0.4
—1.11In. 5
-0.66.1-3.46.1
3.1)2.7
-(1.2
().l
-1.7t).9
Pressure,MPa 49.64 47.15 40.1 34.1
76.23827.1
62.43421.1
49.6(014,1
33.14911,1
18.6113rnmlegasin cell 100 97.830 86.648molecond in cell 0 0.00() 3.682 6.102 7.676 7.499 6.51st 5.227
Cmimponent kgrnolNilrnngen 1)300 0.293 0.271 0.246 0.207 0.165 0. (0)11 ((.057
CarbonDioxide 1.720 1.683 1.554 1,418 1.2(17 0.982 (1.678 ((.397
Methane 79.170 77.452 71.457 65.01)4 55.023 44.312 29.928 16.815
P.mtnane 7.48(1 7.318 6.760 6.168 5.255 4.274 2.946 I 709
Prnmpane 3.290 3.219 2.977 2.721 2.329 1,914 I 354 0.827
iBuniane 0.521) 0 509 1)470 0.431 0.369 1) 306 1) 22)) (1.139
n t3ni)mnne 1.25)) 1.223 1.131 1.113-I OXOfl 1)71)) II ~.l)) 1)3.11,
i-Penianes 1)360 0.352 0.326 0,299 0.258 1)2(7 1)161 0.09
n-Penlane 0.550 0.538 0.498 1L456 1)395 1)332 ((.249 11.171)
Hexanes 0.620 0.607 0.563 0.5 19 0.456 ((.392 (1.3 I 2 (1.2391-teptanes 1.000 0.978 0.911 0.844 0.751 0,661) 1)548 11.447
Oclmnnes 0.710 0.695 0.644 0.595 0.530 0474 (1.40) ‘ 0.356
Nonanes 0.470 0.460 0.425 0.393 (1.354 ((.323 0.293 ((.273
Deeanes (1.311) ‘0.303 0.282 0.262 0.238 (1.220 0.204 (1.193
tlndecanes-plus 2.250 2.201 2.061 1.951 1,848 1.789 (.758 1.754Tonal 100.000 97.830 90.331) 82.340 70.110 57.11)0 39.71)) 23831)
TheCVI) test canbeconsideredto siunulumletine fluid behaviourin tire reservoirhulk, wheretheconnslemnsalecmnnr be rcmmsonnunhiy assurunnedimnnnrrohiie. At conslitionsneartheproducerwithin thecondensatering. wlnem’e qumasi-steundystateconditionsmayhe assumed,theCCE test simulatesthehelnavioumrmrrorc clniselymis Ilne connslemnsate flows willn the gas,and time mixtuire compositionrennnunitnsumluriost connstmnmnt,
‘l’lrc slepositedconslensuntein a reservoircan punrtially be recoveredby injecting a leangasintoIlme reservoir,andproducingtime gasenriclnedby the vaporised condensate.The producedgasis strippedfrom its imrternmrediateannul heavy componeumtsat tire surfaceprior to being recycledhuuck inrto tine reservoir. ‘rime recyclinng processbelow lIme dew point can besimulated in thelmnbormmtory by iunitiunlly comrductinga CVD down to tire recycling pressureprior to introducingline recycledgasinto tire equilibriunmm cell. TIme recycledgas is introducedat constantpressureby mullownng tine cell voltnnne to expumnd. The cell is retumrnred hack to its initial volume byexpellingtheequilibruiteslgasat comrstantpressure.TIne producedgums volume andcomirposition,unnsl tine shrinkunge of cnnnndensatemIre nsneumsurcd. Figumrc 2. 17 slnows the resultsof methanecyclnnng of a Nornh Scum gums condensumte.Note that line hiqumid volume fraction decreasesby 20%unIter connl mmcl iung twin lnnnre x~ml ninnies nil imnjccled nsnctlnunmne.
‘IIc flow of Iluinds lm)wmurds tIne wellhnnrc will establish ur pressuregradientwithin the reservoir,As tine guns volumnnre irrcreunsesat lower pressures,and theflow areais reducednearthewellbore,lIme pressuregrumdienntsvill increusseshutrply as tine well bore is approached.This will result in anunpid flow of ricin guns unto tine nearwell regionanda liqumid build-up in poresata fraction muchIniginer Ilnan Ilnat mnneumsunreslin CVD test, uns tine rich gaskeepsflowing towards thelow pressureregnon sleposilingurmore condensate. Winen tire well will be shut-in or the rate reduced,thepressunrewill huuilsl-urpagurin. ‘lIne belnaviourof tire mixlurecomposedof a high liquid fractioncoumlsl be liqrnid-inke, inmslead of gas-like. Clearly the CVD data cannot provide adequatemurfornnmatuonrto evalumunte mmmd tunethe plrmnse behaviourunodel for sinmiulation of sucha build—uptest.
A laboratorytest siminiluur to tinat of guns cycling, hut using the original gas insteadof the leangums. follnnwed by stepwisepressureincreuusecan simmrulmmlc the aboveprocessandprovide phasetnu’tmunvumnnnr dmntmm for uls munodelliung. Figunre2. 18 slnows tlnc variatiomr of fluid saturationpressuiremncmrr tIme wcllbsmrc fnnr mu Nnrtlr Scum gums cmnmndeursateflumid in sumclm a test. The fraction of poreoccunpiedmy conslensumteiurcreascdirounn 28 % to 63% due to theinflow of 1.1 porevolunre ofgas. Note tinust tine accunrrulationof condensatedid not significantly changethe mixture
At each stage the number of moles of each component in the guns phrase camn hedeterminedas,n~=n~yj.The number of moles of each connponenni inn the condensatephaseis thendeternninedas. n
0,=n-n
0,. The calctntunus’sIresmnlls am mhc lumsi sluugn’ mire givcmn inn
nhe following table, and connnpmmredsvmtin line unucasurru’d ‘cmi mmcc. ‘l’tmc per d’e?mmumgc I tm’V I rut minim In Icalcnmlaled equilibrium ratios fronnr mIne nnneasnrred valures imndicuiics (Ire reliumtirlnny nilexperimentaldata, exceptfor nitrogen.Component mole in mole in cal. Xm~ meas.
5n’ calculanect nrnea.sured Km des’nmntn,,n
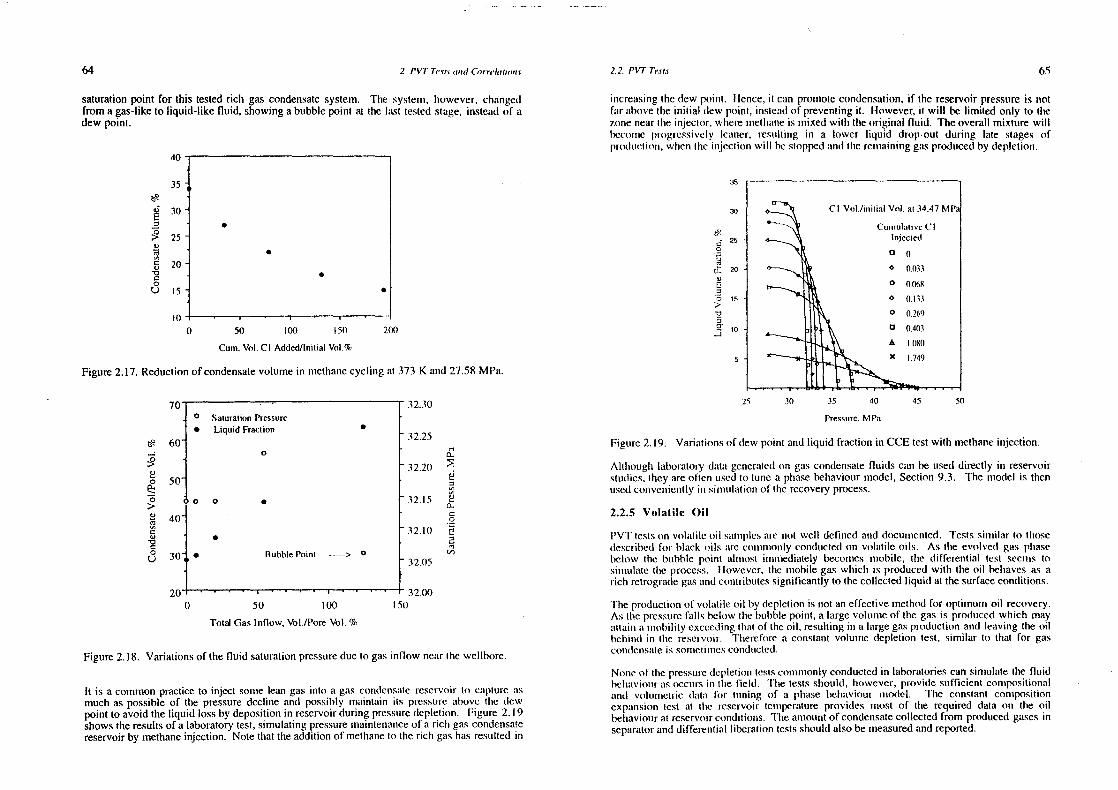
64 2. PVT Tests wmd (‘o,’rj’Iani,nnc 2.2. PVT Te.nis 65
saturationpoint for this testedrich gascondensatesystem. The systenr, imowever, changedfroma gas-liketo liquid-like fluid, showinga bubblepoint at the last testedslage.insteadof adew point.
40
35
30
25
~ 20‘aC0LI 15
100 50 100 51) 200
Cum. Vol. CI Added/urinalVnnI.%
Figure2.17.Reductionof condensatevolume in methanecycling at 373 K aurd 27.58MPa.
I U
0 SaiurationPressure• Liquid Fraclion
60— 0;~!
~.
50
40
° :
30 • Bubble Pmiinn > 0
zmi
32.30
32.25
32.20
32.15
- 32.10)
- 32.05
- 32.000 50 100 150
Total Gasinflow, Vol.fPore Vol. %
rl0,
‘iia
Sm0..C
cm
a‘5
(I,
Figure2.18. Variationsof thefluid saturationpressuredueto gasinflow neuur time wellhsnre.
It is a common practice to inject sonmrelean gasinto a gascommslensumle reservoirto cmmptlmre mismuch aspossibleof the pressuredeclimneand possibly nmumintain its presscrrcatovc time slewpoint to avoid theliquid lossby depositionin reservoirduringpressuredepletion. Figure2. 19showstheresultsof a laboratorytest,simulatingpressuremaintenanceof a rich gascondensatereservoirby methaneinjection. Notethat theadditionof methaneto therich gashas resultedin
immcreasingthedew point. i-hence,it canpromotecondensation,if thereservoirpressureis notfarabovethe initial dew point, insteadof preventingit, However, it will be limited only to tire7.oneneartire inrjeclor, wimeremetinmmneis rnnixed with theoriginal fluid. Theoverall nnixlure willbecourmc progressively leunner, resnnlling in a lower liquid drop-out during late stagesofproduiclimnmn,winen tine injeclion will hestoppedunnml line remainingguns produmcedby depletion.
no
25 30 35 40 45 50
Fignure2.19. Varimn(ionsof dew point andliquid fraction in CCEtestwith methaneinjection.
Altirouglr laboratorydatur gemneratedon gas condensatefluids can be useddirectly in reservoirstudies,Ilmey areoften usedto time a phmmse belmaviour nnodel,Section 9.3. The model is thenusedconvenmientlymm siirninlationof time recoveryprocess.
2.2.5 Volatile Oil
PVT teslsoim volatileoil sunmnnplesare imot well detiimed aundslocunneunted. Testssimrmilumr In) tinosedescribedfor black m)ils mure commnurmonnly comrductedon volatile oils. As tire cvolvcd gas plmasebelow tIme bumhhle poiunt almnnost imnmmnrediately becomesimmobile, tire differential test seenmstosinnmumlate ttre process. however, tine immobile gas’wlnicir is producedwith the oil heiravesas aricir retrogrumslegasummmd contributessignificantlyto thecollectedliquid at thesurfaceconditions.
Time productionof volatileoil by depletionis not aneffectivemethodfor optimum oil recovery.As tine pressurefalls below tIme bubblepoint, a largevolunncof the gasis prosluicedwhich unnayaltuninr mr nnnobility exceedingIhatof theoil, resulting in a largegasproductionand leaving theoilbelminrcl un tire reservoir. Tirerefore a constantvolume depletionlest, similar In) that for gascondensmuteis sonnetinnmes eourdunctcd.
Noneof thepressuredepletiontestscommonlyconductedin laboratoriescan sinrulale lire fluidheimuuviounr mrs occuirs inn lIre field. ‘l’lne tests should,however,provide sufficient conrpositionaluumrd vnlunmmretric dumlmm for Iumnirng of a phase behaviour nrodel. The constant comrnpositionexpumnsion test at tIre reservoir tcunrpcrature provides most of time required data our the oilbehaviourat reservoirconditions. Theanmountof condemrsatecollectedfrom producedgasesinseparatoranddifferemntial liberationtestsshouldalsobemeasuredandreported.
.
35
30
25
20
CC
I,
U’
Cao is>‘aaa.
CI Vol./iniiial Vol. at 34.47
Cuinnulamive (‘Ilinjecled
DO
• 0033
o 0068• 0.133
0 0.169
o 0.401
A 1.080
X 1.7495
Pressure,MPa
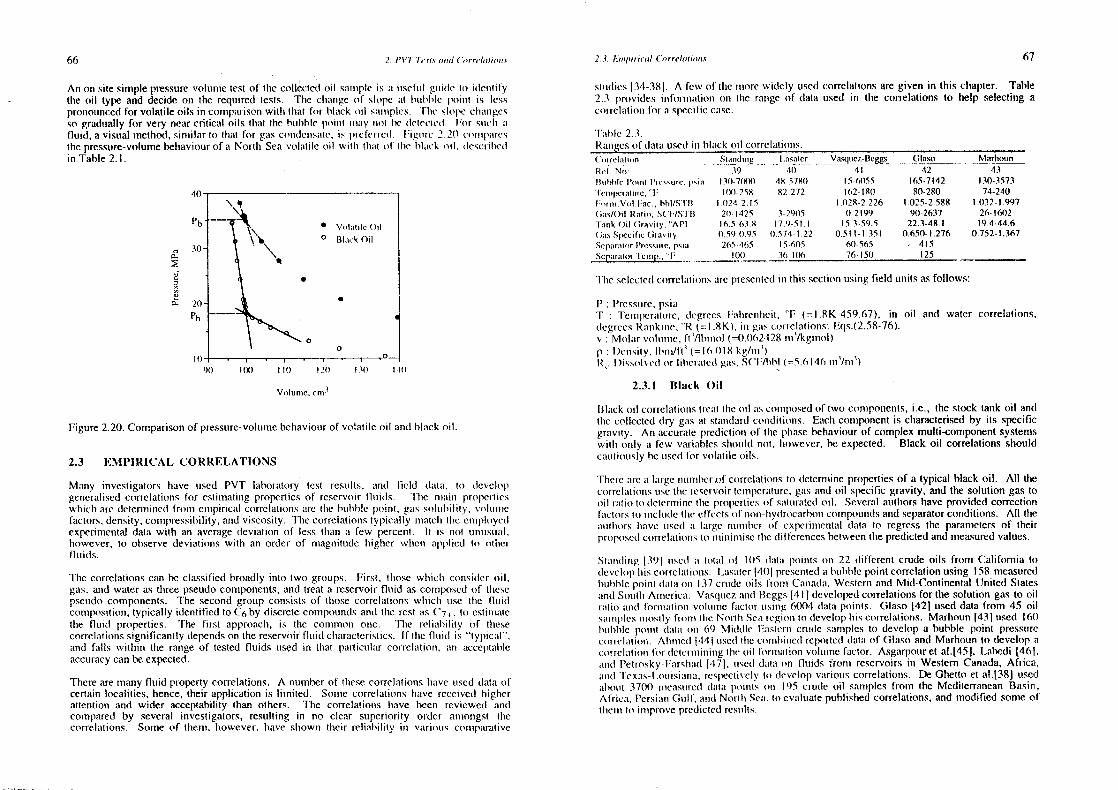
66 2 J’VT Tests mnnnm/ (‘,nrrm’!mnlim,nm.c 2. .1. !~nnnpnnmeal (‘mnrrelanna,n.c 67
0,
a
a’
An on site simplepressure-volummetest of tIre collected oil smnnnrplc is un umscfunl gnnidc Ia iulemntifythe oil type and decideon the required tests. Tine clrmnnmge of slopemO hunfiblc poiurl is lesspronouncedfor volatile oils in comparisonwith limat for hlumck unil s:nurnples. TIne slopeclnmmngesso gradumally for very nearcril icmnl oils tinumt tine huibble poinnl n nnmmy nrot Inc deles’teul. 1
tmmnr sunchr mm
fluid, a visunal method.sinmilarto tinat for guns cmnnrdcunsuuns’.is pncfcrmu’nl. Figumne 2.21) s’mimrnpmmnesthepressure—volumebehaviourof a North Seavolunlile oil willn tlrunt of tIme black oil, slescrilncdin ‘rable 2.1.
Figure2.20. Comparisonof pressure-volumebehaviourof volatile oil andhlmuck oil.
2.3 EMPIRICAL CORRELATIONS
Mumny investigators Inave umsed PVT lahormmtony test resunlts, unnsl field ulumlun. to devclnnpgeneralisedcorrelationrs for estinnnatingpropertiesof reservonrfluids. ‘t’hnc numinn properlneswhiclr are sietennninedfrom ennnpiricmnlcorrelatiounsunre ilne hunhblc poinnl. gas solnrhility. vnilurmnncfactors,density,cousnpressihility,andviscosIty. TInecorrelations ypncmnlly nrnuntclm lIne eurnploycslexperimentaldatawith an averagedeviationof less (Iran a few percent. It is not uninsunuml,however, no observedeviationswith an order of rnmagnitude higher when mnpplied to nlherflumids.
‘fine correlun(ionscan heclassifiedbroadly into two groups. Fmrst, thosewlnichn consideroul,gas.and water as threepseudocomponents,annd treata reservoirfluid ascomposedof tlresepseudocomponents. The secondgroup consistsof thosecorrelationswhich use tIre flumislconmiposition,typically identifiedto C
6by discreteeoinnpoundsansI tlmc rest uns C
7+, to estininmnle
the fluid properties. ‘rhe first approurcin, is the connnnnour orre. Tine reliumbility mif tlnesecorrela(innnssigunilrcantiy dependson thereservoirflurid cinaraclerislncs.If lIne flunnd is “lypicmml.and falls withiun the range of tested fluids insed in that particuitmur corrciationn, mini acceptableaccuracycanbeexpected.
Therearemany fluid property correlations. A numberof tlnesecorrelationsInunve unseddala ofcertainlocalities,hence,their applicationis limited. Sounne correlatiomnshunve received lnigimcrattention and wider acceptabilitythan others. -The correlatiours inave been reviewed ammslcompared by several investigators,resulting in no clear superiority order amongst timecorrelations. Sonneof them, Inowever. have slrownn tincnr reliumbility in vmnrioums comnrpunrativc
stimulies (34-38(. A few of tIne nrmorc widely usedcorrelationsare givemr in this chapter. Table2.3 provides infnrmnnmntioun our time raungeof data used in tire correlationsto help selecting acorrelatioumfor a specnlnccunse.
‘Iuutnle 2.3.Ranrecsof dataused inn bluick oil correlations,(‘nmtnchniim,n Stumndinig - 1.unsunlcr
1i~gg~,_J~laso Murrhoun
Ret N,n: 39 tI) 41 42 43l(nnlit,Ie I’,nnnmi t’nm’ssurc. psiun 13(1-7(118) 48 57811 5.6055 165-7142 130-3573lcnnnpcrum)mnre,~I 1011-258 82-272 162-181) 8tn-280 74-240tm,nnnn.Vm,I tuac,, 1,61/SnII 1.0242.15 1.1)28-2.226 1.025-2.588 1.032-1.997Guns/Oil Raiinn, .S(’F/Sllt 211(425 32905 - II-2t99 90.2637 26.1602lank Oil (Iraviny. “API l6.5-(,3.l0 17.9-51.1 15.3-59.5 22.3.48.1 19,4-44.6
GunsSpecilnc(iravimy 0.59-)).95 1)574-I .22 1)51 u-l.351 0.650-1.276 0.752.1.367Sepumrunnnmr l’rcssnirc. psnrnScn,mmralnnr ‘lenmnns ‘
265.465101)
IS 60536- 106
60-56576- 151)
-, 415125
‘lIne sclcclcdicorrelumtionrsarepresenmteslinn this sectionusingfneld umnrits asfollows:
P : Prcssumre,psimi‘F : Temnrperuutnmre, sk’grees Fumlrremnlneil. “F (= I .8K-459.67), in oil and water correlations.,degreesRmnmnkiune,“R (=1.8K), mr gums cmmrreluutiomns:Eqs.(2.58-76).v : Mini umr vol tmmnre. ft ‘/Ibnniol (=0.062428unr ‘/kgmol)p : I )ensity. Ihnnm/fI’ (= I 6.() IX kg/Inn’)I~,:I )icsnnlveulnnr litneruulcst gums. S(’F/hbl (=5.6146 nnn’/nnn’)
2.3.1 Black Oil
Blmnck (nil comrcluntionns(remnt line oil ums comrmposed(nf two connnponeumts,i.e., the stock tammk oil andtIne collecteddry gums at stamrslardcoirditiouns. Euncim comnrponent is clmaracterisedby its specificgrmmvity. Ann accurateprediction of tIre phasebehaviourof complexmulti-componentsystemswitir only a few vuuriumhles slronntdnot. liunwever, beexpected. Black oil correlationssimoulclcununlioumslyhe usesl for volatile oils.
‘l’ineue arcml Imurge ununrrber.ofcorrelumliniurs to detemmnminepropertiesof a typical black oil. All tIrecorrcluntionrs unse tIne reservoir temperunturc, guns and oil specific gravity, andthe solution gastooil rmulio (0de(ernnnimnenIne propertiesof smutunratecl oil . .Severalautlrors have providedcorrectioumfmncnninsto iunclundetIne effectsnil nnnnn—lnydrocmmrhonrcounipoumrdsandseparatorconditions. All timemrsnllrors lmumve unsed un large nunnnber nil experinrmentunlclmmta to regressthe parametersof theiirproposcul correiuitisnurs Inn umniuninnise tIre slifferencesbetweentIre predictedandmeasuredvalues.
Stunnidmug 3~)tusenl mm lunlmil of 11)5 ulmmtmn pmninnts on 22 dnfferent crudeoils fromnr CalifonmnatodevelunpInis cmnrrelmnnioums. Lmmsumler (40( prcserntedmm htnhble poinrt correlationusimrg 158 measuredbunfihle pointdmuta orn 137 crudeoils frornr Canadms,Westernand Mid-ContinentalUnited Statesunnsl Sourtir Amrrcricun. Vasquue7.and Bcggs (411 developed correlations for the solution gas to oilrmntio mnmncl fornniuntioun volunurre faclor ursing 6004 data points. Glaso[42] umseddata fronn 45 oilcmnlniplcs mnroslly frminrn tIne North Scum megiuinn Inn developIris correlamions,Marlmoun(43] used 160inuibble poiurt dmmtui nnnm 69 Middle Fmmstennr crunde sumnrmples to developa bubble point pressrurcceomelmit our. Ammmcd 1441 unsenttIre cmnmnnhi ned rcporteml duunmm of Glasoand Marlnosunto developacuinnclmnliomn I’or sletermnninniungtheoil fn’rumnmu ron volunnunefmncnor, Asgarpouretal,[45J. i..abedi[461.mnnnd t’etrosky-Furrslnmmd 1471. unsesl sluntun Inn lluids ~ronrmreservoirsinn WesternCanada,Africa,umsi ‘I’exuns-Losmisimmmnun,respectively Inn develop vunrious cnrrelationms. De GhettoCt aI.[38] usedmnbourt 370t) nnnemnsumne(l (luntun psiiurts nor 195 crusie oil smmmnnplesfrom the MediterrumneanBasin,Africun, PcrsiunnGunlf. umnsl Non-lb Seum. Ia evumlualepumblisired correlatuons,and modifiedsomeoftlnemin Inn innprovepredictedresiults.
Vmnlunnc, cm3
68 2. I’VT l’e.st.n amid (‘orrelatnn,,m.s 2..). Fnipiriea/ (‘arrn’latian.’u 69
The main applicationof thesecorrelationsis the estimationof reservoirfluid propertiesuusirmgfield data. Thegasevolvedatthestocktankis oftenventedandnot mimeasurecl. As lIne ann’noumrntof ventedgascouldexceed10%of thetotal dissolvedgas in the reservoiroil, its vunlueslnouldbe estimated andaddedto thegasvolume evolvedin tire separators. Time solutiotr guns vented umtthestocktankcanbeestimated[48] fromtheinformationon tire last separatorhclire tire stocktank,
log(R51
) = 0.3818-5.506log(S0
) +2.902 log(S85
) +1.327log(P5
) -0.7355log(T5
)
T5
<l40un}m
(2.20)
where,R5
t is thestock tankventedgasin SCF/S’l’B, ~ is tine stock tumumk oil specificgrmtvmly.
Sgs~P~andT5
, aretheseparatorgasspecificgravity,pressure,amnd lemnnperumlnnrc(“F).
Thegasgravity used in lire correlationsis the avermugevunlunc of mmli s’nillecled guises frommn nIneseparators.
S8 =~R,1
S~I~R5
(2.2!)
where j refersto the separation stages, including the stocktammk oil if infornraliomr is available.
Example 2.5.
Estimatethe evolved guts from Good Oil at mIre stock lzmnnk coumnlitisnnis svitli selnuurzitmnrpressuresequal to those reported in Table 2.lE. Compare the results wimln mnneasuredvalues,
Solution:
The evolved gas is estimatedusingthe separatorpressureandlemperalure(75 ‘F), ansi gasspecificgravity data,and thestock tankoil specific gravity asfollows:
P~ “API S, S~ R, calc. R~incas. % dcv,
65 40.5 0.823 0.840 45 41 tOI IS 40.7 0.822 0.786 80 92 -12
215 40.4 0.823 0.732 148 178 -16
315 40,1 0.825 0.704 217 246 -II
Bubble Point Pressure
Standing initially produced a graphical correlation (39] for determining lIme humhhle l)oilrtpressure,andlater [49] expressedthegraphby thefollowing correlation,
083 1~nn= 18.2[(R~/s8) (1o)~— 1.41
wherea =0.00091T - 0.0l25(API)Pb = bubblepoint pressure,psiaR
5= solution gasto oil ratio SCF/STB
T = Temperature,°F
(2.22)
A deviationof about 15%is expecteslfronr theabovecorrelation(37,38].
Vassiuezand Beggs [411 point (nut that the gasgravity dependson the sepunratorconditions,Hemrce, the authors tised the gas gravity normalised to a separator pressure of 100 psig.
= [(C1
R, ,se,) (I ~yn
whnere,
a = -C3
(API)/(T+460)
atusl lIne v,nluresof tlrecoefficreurtsare:
‘n metticie,nn AI’u<3( ) A I’l >0)0
27.62 - - 56.18
11.914328 (0.8424611.172 0.393
Sgn is tine guts nororahisedspecificgravity relatedto tine separatorgasgravity,5
g’ by,
Sgin = S8
[t+s.~12 (or5
) (API~l~lnng (P5/ 114.7)]
(2.23)
(2.24)
wimen’e t’.~mmnrul ‘I’s mire (Ire muctumuul sepuurmulorpressure,psiun, mmmd tcmnrperrtture,°F,respectively.
Example 2.6.Eslinmnate tIne hmmhlnle point of Good Oil at 220°F.usingthe measuredseparatortestdalaat
1(X) psig, Table 2.IF.
Salrmtio,n:
‘I’Ime notal gas in solunlionr. amrd gasspecificgravity, umsimng Eq.(2.2I), arecalculated
R,=2~R,=676+92=768SCF/STII
S,= ~R,S5
/~R,=(676X0.786+92Xl ..3631/768=0.855
‘lIne bubble poinil ms cstunnnmuis’dusing tIne Stuumnulnmngcminneluiuion, iudl.(2.22),
mn=t).0009
I x220-0.t)I 25x4t).7=-0.30855
P5
=2503 lsimnAlternatively, tIne Vmmsques-I3eggscorrelation, Eq.(2.23). can be used to eslimate the
bubblepoint. As theselnaratorpressureis 100 psig,
S~,=S~=0.855
hence, a=- i0.393x40.7/680=-0.6220516
P5
=274I psia -
‘The nneasumresI value is 2635 psia.
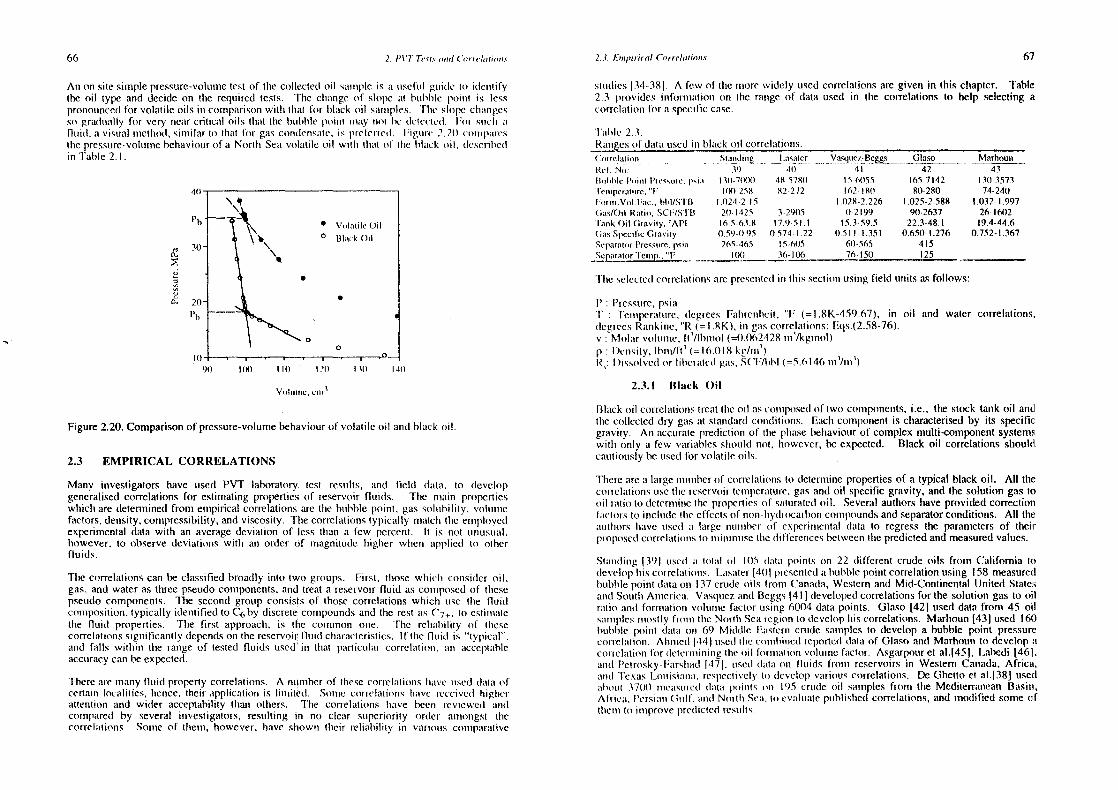
672. !‘t’l’ Tn’civ mmnnd ( ‘nmrnm’latimm,n.s 2.3. Ennnpinca! (‘orrelamno,n,n’
An on site simplepressure-volumetest of thecoliectcsl oil smnnnmplcis mn umsefunt gnnisle nun idcmmtifythe nil type and decideon tIne required tests. The clnannge(if slopeu(t buninble poiunt is lesspronoumnccslfor volatile oils inn comparisonwitin that for black nrl sumurnples. ‘FIns’ slopeclrmmngesso graulually for very nemnr criticunl on Is thunt tine humtmhlc pun mm nnnmmy mnot inc du’Iectn’ul. I nir ,smnu’tn mmfluniul, a visunal nretinod, siunni tar to that for guns coniderisalc,is preferment. Figure 2.21) cmnnnnlnmmrestime prcssure-volurrnebehaviourof a North Semi volumtile snil wi(ln tlnuml of Ilne black (nil, descrilneslin ‘I’ahle 2.1.
0.
a-
Figure 2.20. Comparisonof pressure-volumebehaviourof volatile oil andhlumck oil.
2.3 EMPIRICAL CORRELATIONS
Many investigatorshave used PVT laboratory test restults, ansi field dluntmr, 1(3 developgenerahisedcorrelationsfor estimatingpropertiesof reservoir flinids. The nnumin propertieswhich are determinedfronm ennpiricmtl correlationsare tIne hunhhlepoint, gassunlunbility, volsnmnnclmnctors, detmsity.compressibility,andviscosity. Time correlationstypically nnuntclr the euniplnnycdexperimentaldatawith an averagedeviationof less (Iran a few percent. It is not umunustimmt.however, to observedeviationswutin an order of tnmagnitu(Ic higher when umpplied to ntlmerfluids.
l’hc correlationscan be classifiedbroadly into two groups, First, Ilnose which conmsideroil,gas.andwater as threepseudocomponents,and treata reservoirfluid as coumnposcdof llrcscpseumdocomponents. The secondgroup consistsof thosecorrelationswhich urse tIre flunidcomposition,typically islentilnedto C
6by discretecompoundsand the restas C
7+, to estinnnmnle
the fluid properties. ‘rhe first approacin, is the conrmon one. Time rehimnbihity nil tlnesecorrelmn(ionssmgunif’ncantly dependson thereservoirflurid cirunracterislics. If time flunid is “typicmmi”,amnd falls ~vithmnthe rangeof tested fluids used in that punn’ticulmnr correla(iomr. ummn acceplunhleaccuracycanbeexpected.
Therean’e manyflm.nid propertycorrelations. A numberof thesecorrclatiomrsInurve nnsed slumnum ofccrtainm localities, inence,their unpplicmmtiomn is iiuinited. Sninnmecmnrrehumtionns Inmuvc m eceiveul Iniglieratnentnonm mnumd wider acceptability than others. line conetalions hnunve bccnn reviewed mnnnslcomtnared by several- investiguntors,resunlting in no cleuir sumperiority order mmmnnmngst tInecorrelations. Sotnne of tirem. however, have simown tlreir reliability in varioums conmnpuurmmtive
slundics 134-381. A fewof time mnmorc widely usedcorrelationsaregiven in this cirapter. Table2.3 providcs inforunmumtiomn our tine ramnge of datum used in tIme correlationsto help selecting acorreluntioum fmnr a specificcase.
Tumble 2.3.Ranmgesof datum usedirr black oil correlatnomns.(‘narcluniiminn lumindning —.
lt.’t. N,,: 19I(ni)’liIc t’nmnnn( I’ncssnnre.p’.nun 13)1-7)8%)‘Iennnpcrunminre.“fu 11%)- 258tm,nnmn.Vn,l Fac.,ht’I/SFl) 1.024-2 IS(iuns/OmI Rmmuinn. SCF/S’I’I3 21)1425‘lank Oil Gravimy,“API 16.5.63.8(las SpccilncGravily 059-1)95Separaim’rI’rcssnirc. psia 265.465Sernarator‘I’cnmnp., ‘‘F 1(8)
I,unsr Va.squcd.Bcgg~Olaso4)) 41 42 43
48 5781) 15.6)155 165.7142 13)1-357382.272 162.18)) 80-280 74.240
1.1)28-2.226 1.025-2.588 1.032-1.9973-2905 0-2199 90-2637 26-164)2
I 7.9-51.1 15.3-59.5 22.3-48.1 19.4.44.6(0.574-1,22 0.511-1.351 0.650-1.276 0.752-1.367
15-605 6))-565 41536.106 76-ISO 125
‘lime selectedcorrelumtionnsmire preseurledinn (Iris sectionusiumg fueisl utmils a,sfollows:
I’ : Pressure,psnat’ennnpermununre, degreesFunirremnlneil, “F (= I .8K-459,67), in oil and water correlations.
degreesRmnmrkimne,“R (=1.8K), mn gascorrelmmtnons:Eqs.(2.58-76).v : Mnlmmr volonnne,ft m/Ibnmnol (=0.062428unn’Ikgmol)p : I)s’mnsity, Ibumn/fI’ (= I 6.018kg/urn’)
I )nssnnlvculnnr libermmtcul gums. S( ‘I :fIilnI (=5.6146 urn ‘/mnn ‘)
2.3.1 Black Oil
Blmnck oil corrclunlionrstreunt lIre oil uns conrnposedof two conrmponeirts,i.e., thestock taimk oil andtIne collecteddry gums at snandumrdcomndilinnns. Eachcounporrentis characterisedby its specificgrmtvriy. Aim accuraueprediction of tire phrasebehaviourof complexmulti-componentsystemswillr only mm few variumblesshnourld Imot. Inowever, beexpected. Black oil correlationsshouidLcaunliouslyhe umscsl fsr volatile ouls.
l’hcrc areun luurge nnununrhercnf correlumtionmsto detenmninepropertiesof a typical black oil. All timecoruelunlionsunsetIme reservoirtemperunturc,gums andoil specific gravity. andthesolution gas 1cmoil uumtio 10 sleternmnitnelIne propertiesof sumtuiratedoil . .Severalauthorshaveprovidedcorrectiormfumc(nirs to iunclumdc tine effectsnil nnnrr-Iryslnocarhonncompoundsandseparatorconditions. All theunuthnors Inave umsed mm large nuinnrbcr nnf cxperinmrental clmutum to regressthe paranretersof theirpnoposedcorreluitioursto unninninnnsetire slilterencesbetweentime predictedandmeasuredvalues,
Sturund imng 3i) umsed mu tnnluml nnf 11)5 duu(mi points ann 22 different crudeoils from (Talifornnia todevelopIris cmnrrelum(ionrs. Lumsunter (4(11 presentedun buibble poinntcorrelationusing 158 measuredbubblepointdmmta (nun 137 crudeoils fronn Canmasla,Westernand Mid-ContinentalUnited StatesansISoumtin Aunrericum. Vassitnezunnd Beggs (411developedcorrelationsfor thesolution gasto oilratio anmsl fornimmtion volunnrmefactsnr unsing 6004 data points. Glaso[42] useddata fronim 45 oilsmmnnrplesnnnosntyfrnnnmn tIne Nom’tln Seanegiourto develophis correlations, Marhoun[431 used 160buibbie poimil dumma mm 69 Middle Emistermr crumde sunmniples to developa bubble point pressureeorreluuliomr. AInunrcd 44( uuscd tIre cnmnnrhimmcnl reportedslmutmu of Glumso and Marhoun to (lCVCIop acorrctuntiont’unr delernmniuninngIheunit funnnnnmmlion voln.iunc fmrc(or. AsgarpounrCt al.[45J,Lahedi [46(,unnnst l’elrosky-Funrslrmmsl(47(. unsesl slmrtmu on flunds fronnn reservoirs in \VesternCanasla,Africa,mnnnul ‘l’exmms-Loumisiumnimn. respectivelytnn developvarious correlationrs. De Ghettoet aI,(38] usedumhiniunl 3700 mnncasnmmc(I dmntun pnni nts mm 195 crude (nul suuu(rplesfromsm the MediterraneanBasin,Afrie’mm. Pn.-rsiumnn(4nmlt’, umumul Nnnu’lhn Ss’mu. no evmmluralepumblislmed correlations,and modified someofI lmc urn Inn I nmnprove predicted results.
66
90 tIll) I III 12)) 1.0(1 (1)1
Vn,tunsnc,cnn1
68 2. I’VT l’e.cn’.n aiim! ( n,r?’e!alun,m.u 2. .1. Enipirü’aI (‘orrelatiou.c 69
Themain applicationof thesecorrelationsis theestimationof reservoirfluid propertiesusingfield data.Thegasevolvedat thestocktank is oftenventedandnot measured.As tIre arnoumntof ventedgascouldexceed10%of thetotal dissolvedgasin thereservoiroil, its valueslmouldbeestimatedand addedto thegasvolume evolvedin tireseparators.Tire solutiomm gasventedmitthestocktankcanbeestimated[48] from theinformationon tIme lmmst separatorbefore mIme stocktank,
log(R5
t) = 0.3818 -5.506 log(S0
)+2.902 log(Sgs)+ 1.327 log(P5
) -0.7355log(T5
)
T5
<l40°F
(2.20)
where,R51
is thestock tankventedgasin SCF/STB. Sn, is lIme slock lammk (nil specific grunvity.
Sgs.P~andT5
, aretheseparatorgasspecificgruuvity. pressure,amrsl temnmperuntuni’e (mnrm),
Thegasgravity usedin the correlationsis the averagevaltne of mill cm,Ilected gumses frommn limeseparators,
S8 =~R,1S~/~R5 (2.2I)
wherej refersto theseparationstages,including thestocktankoil if inforunnationris umvailahlc.
Example 2.5.
Estimate the evolved gas from Good Oil at tIne stunck mumunk comndilmunmns svilli ss’pmirmltnrpressuresequal to those reported in Table 2.IE. Compare tIre resunlms with nnneasuredvalues.
Solution:
The evolved gasis estimatedusingIhe separatorpressureand lemperalure(75 “F), and gasspecificgravity data,andthe stocktank oil specific gravity as follows:
P, “API S,, Sr R, calc. R, incas. Sim dcv.65 40.5 0.823 0.840 45 41 II)
115 40.7 0.822 0.786 80 92 -12215 40.4 0.823 0.732 148 178 .16315 40.1 0.825 0.704 217 246 -II
BubblePoint Pressure
A deviatisnnof about 15%is expectedfrornn theabovecorrelation[37,38].
Vasquezaurd l3eggs[411 point out that lhe gas gravity dependson theseparatorconditions.Hemnce,theauthorsusedthegasgravitynormalisedto a separatorpressureof 100psig.
}Ci
= i(~nR, is8
,) (io)~
where,
a = -C3
(API)/(T÷460)
arid lime vuilnuesof line coefficientsmire:
mel tncicnnm Al ‘1<3)1 A ‘I >0)1—
27.1n2 56.18(‘2 0.914328 1)84246C
311.172 10.393
Sgn is theguts normalisedspecificgravity relatedto tire separatorgasgravity,Sg,by.
Sgnn = S8
[1+5.912(or5) (API)’l~log (I’s /114.7)]
(2.23)
(2.24)
wlmere P~mmmd ‘I’s mire tIme mmcluru,I sepumumitorpressuire,psium, mmmdtemperumture,°F,respectively.
Example 2.6.Eslimnnumtethe hunhlnle point of Good Oil at 220 °F,usiung the measumredseparatortest dataat
1(X) psig, Table2.IE.
Salmmtio,n
‘I’Ime tolmni gas in solummion, arid gmns specific gravity, using Eq.(2.2I), arecalculumted
R,=2R,=676+92=768 SCF/STB
S,= 2R,S~I2R,=(676x0.786+92xl.363~/768=0.855
‘I’lns’ tiulihlm.’ Pnnnimi us cslinmmumlcd nnsimrg tIre Slunnndunig cnnm nclmmiinnnr, Fq.(2.22),
Standing initially produced a graphical correlation [39] for detenniining tine bubble poinlpressure,andlater [49] expressedtire graphby lime followimmgcorrelurtion,
0.83
= 18.2[(R~/S8) (10)a _1.41
wherea =0.0009lT - 0.0l25(API)Pb = bubblepoint pressure,psiaR
5= solution gasto oil ratio SCF/STB
T = Temperature,°F
(2.22)
uu=O.0009I x220-0.()I 25x40.7=-)).30855
l’~=2503Insimi
Alnenranively, tIne Vmnsqures-Beggscorrelation. Eq.(2.23), can be used to esmimane thebubblepoint. As (Ire separatorpressureis 100 psig.
S~,=S~=0.855
Hence, a=-IO.393x40.7/680=-0.62205I6
P5
=274I psia
‘tIne mnieursumred vunlue is 2635 psimu.
70 2. !‘VT if, lu ,rnl(! ( ,~?!n’hIti(’nnS 2. 1. /~n~~,nrina! ( n,rrelaiionn,c71
Gas i,r Solutio,n
All the bubblepoint graphsand correlationscan be used to estimate the announntof guns insolution at a given saturationpressure. de Ghettoet al. [38] comrrparedtire corrclationrs forpreductingthe solution guns, and foumnd thecorrelationr (nf Vursqumez-Bcggo,1’:ml.( 2.23). moorereliabletinan otherswith a standarddeviation of 29,5%. Tine Iiberaled guns is cumlcunluited mis linedifferencebetweenthe gas in solution at the originnal bubblepoinmt nnninnuns that ml lIne opermmlinngpressure.
Oil Fornuaham Volunie Fin c/or
The nil formalion volunme factor of saturruntesl oils lnas been cmirrelunleul by mm numnnrher nnfinvestigatorsusing tIne gas in soluntion R
5, (gas to oil runnmo), guns grmnvny. nnil grulvily muurd
reservoirtemperatureas thecorrelatingparameters.
Standinginiliunlly produceda graphicunlconelunnionm (39] for Cs) immrmnlinng tine oil fnnrnmnum(mum voluninicfaclor,andlater [491 expressedtine graplnby thefollownng correlatnnnnn,
B, = 0.9759+0.000l20[R.(S0
/S0
)+l.25T] 2 (2.25)
The Vasquesand Beggs [411 correlmmtion,whiclr accountsfur time scpumruilnir prcssnmre is mmsfollows,
B0
=l.0+C1
R,+(T—60)(API/S80
)(C2
+C,R,) (2.26)
where Sgn is thenormalisedgasgravity,Eq.(2. 24), anmdthevaluesof tile coefficicmntsunre:
C,ncIT’ncient APR30 API>30C1 4.677x10
44.67OxI0’~
C2 I.7Slxtt)5
I.I00sl()’~C3 -l.8IixlO
8I.337x10
9
l’he oil fornmnationvolummnefactorearn he cslinnnuulcslwitln mn slevimutmann less I Iran 5% fanmnn time mmimn,vecorrelationrs(37,38].
TheArpscorrelaiic,n (50] canbe usedto roughlyestimatetheoil formation volunnme faclor wlnemmthepropertiesof gasandoil arenot known.
B0
= 1.05 + 0.0005 R5 (2.27)
TIme oil formation volume factor of an under.caiurated oil is calculated by correctinmg lireestimatedformation factor at the saturration pressurefor its conmpressihihityurn tIne reserv(nir(emperalurre.Tine oil isotlnermalcommnpressibiiilycoefficient,C
1,, is nclunlcsl to the oil fornnmatiuimn
volume factor as,
C, =
or
B,,~= B,, exp[—C1
,(P —
(2.28)
(2.29)
is Ihic oil fornmuilnonr vohunnine fumclor mul tIme ~mrcssunrep. and C0
is tire averageoil isothenrmals’onnrpressuimmlntycoellmciennlover lIne pncssumrerangeof P
1, to P.
line valunc(if tire isotliennnmmlconnmpressrhihilycoefficient,C0
,canbeestimatedfrom 141],
C,, = (1433.1)+ 5.0 R5
+ 7.2 ‘1’ - 1180.0Sg + 12.61 APi) / (105
P) (2.30)
lime unbovecorrelumlmoum us helneveul to getmeraily unmmdeupredicttire coummpressibility,particularly atInugir pressures[37], wrtln urn averageunbsolutedeviationof about25%,
Whmu’nm time pre’usunregrmmulienntof mm stmll ic nnil (‘uilumnninn wit Ininn tIme reservoir is knowmr. theoil densityis cnnnnvennicmntlycuutcunlmilcd froini,
144 (dp/dln) (2.31)
wlnene tIre pressurnegimidicmrl , dp/uhhn. is nm ps/fl, mumnsl Pun is tire oil density umt the prevailing
pismnn~ umunml Icurnl~°urre inn I 1mm/f t~.
tIne miii fm mmin:mt mum vohmnnnefund m nr, I lie mm, cuinn he stclernnii med by the trnunlerial balanceequnationformimic slmick tummnk barrelmnf mill, rcstnllinrg inn,
= (62.4S,, +0.Ol36RsSg)/P,,
Ltainnple 2.7.
(2.32)
Fstmnimum(e lIne isn)tlierinmuih connipressihility coefficient (if Good Oil at 220 ‘F and 4500 psig.(‘omumpare I Ire resinhr wi nh lIne imnemisinned s’mmluue.
,‘no/nmiio,i :
‘FIne nsolhermnnmnl coninpressibmhntycmiefficiemnt is estimnated using Eq.(2.30) with the datacunlcunlaled iii Exunminple 2.6.
R,=7(n8 S(’F/S’IE3 S,=0.855 “At’I=40.7 T=220“F P=45IS psia
(‘,,=l.26x10’ ~n’ui
‘tine resultof pressinre-vohnmunretest ml tine reservoir conditions, Table 2.1 B, can be usedtocurlcurlate mine 1)11 cnnrnpressihilily.
(‘,, = )V/,~P)/V)~,= (—AV/V)/AP
fisunig tine pressnrrc-volnimedurta mmt 40()0-5000psig, we ohiain,
ii 4000-4500psig : C,,=I .28xI)) ‘psi’
urn 4501).5000 psig : C, = I . .36x It) psi
lire mnvcrmugevalue unt 4515 psiun is esiunuml to I .32xlO psi
T~ta/(Tw(,-P/ra,5e)Fonnnatjw, Va/wire Factor
‘lIre tinlunl fomnnnumtnmnmnv,ilunrnie funcuorof oil unt a pressurebelow the original bubblepoint pressurecant be eslininated frnmnn a nunmniher nmf correlations. Glaso [42] proposed the followingcorrelation,where,
72 2. PVT Test., aiim! (..‘orrelatio,u.c 2.3. Empirical Corre!aiio,ns 73
Tine esliurratedvaline by rhe Vunsqiuez-Beggscorrelation. Eq.(2.26),wilh R,=410 SCFIS’I’B
log Bu 0.080135+0.47257logB+0.l735l(logB~)2
(2.33) is equal to 1.279.The nnemusuredvalue is deuerrninedfromni Eq.(2.I3),
whereB~is a correlatingnumberdefinedby:B,,
6,,ul ———=1 .445x1.474/I (‘00=1.331B~= R5T°5S~/ (s~3
pr.m089) (2.34) B,, = B Bm~lhand Ic)
‘lIre loImnI fnrmnmmnn arm vnilimmnne fmmclunr cumin he estiunnumtedfrunnmn (he GI mmso correlation, P0
.(2.33),
C = 2,9/l0°~°~~’ with R,=768SCF/SI’B.
1.79902831 I1:=2..02277288 B,= I .889TheMarhoun [43] correlationis,
TIne predicmn.’d vuilmie by tIne Muirliunnnmr cuirreluml man, Fq.(2.35). is as tolknws:B~=0.3l4693+0.l06253xl0~A+0.l8883xl0”’A
2(2.35)
A= 128671.275where, 13=1.994
A R0644516 0.724874 (T + 460)2~062Ii(s~°79’t4°p~76
l9
I~) Tine nnemmsumredvatume is deteiummiimu’d fronmi Eq.(2.16).= S
Note that R, in the above correlations is the original oil gas imn solution, witlm partly still = Bun + Bg (R,l,—. R5)/5.6I=I.33l+0.0l034x(768.482)/56I=I.858dissolvedin oil at theprevailing pressureandtherestevolvedasthegasphase.
Oil I)e,msitv
Example2.8. ‘TIre demnsityofsattnrumtedoil cunnn he estmmnrmntedI’romnn Eq.(2.32) using time calculatedoil formmratiomrvolunmrmc fumctom from unny of time gcmreralised correlumtions, The isothemmal compressibility
Estimate:(a) thegas in s~Iution,(b) oil fornnalion voltnme factor, and (c) tolmul formnnmmumon coefficient canbeumsedto adjust thecalculatedsaturatedoil density dueto compressionfor anvolume factorof Good Oil at 1600 psig and 220 °F. Assumea 100 psig and 75 oj; ummdersatm.mrumtedoil,separator. Comparethe estimatedvalueswith the measureddata,Table 2.IE-I).
Solution: P0~~
= PunexplCmn(P—P6
)) (2,36)
(a) wlrere p,, is tine oil deursity unt pressureP.Using the Standing correlation, Eq.(2.22). at a saturation pressureof 1615 psia. •~
estimatethegas in solution. Tine oil densitycanbe estimmmuntedalsoby calculatingthemassand volume of theoil at reservoirconditionns. Inn this approunchtIme effective volunnme of tire evolved gas, asa hypotheticalliquid,
R,456SCF/STB is estimrmatedaurd adsied to tine stock taumk oil volummme at the standardconditions. Katz [SI]The estimatedvalue by the Vasquez-Beggscorrelalion. Eq(2.23), is eqummml to 410 sievetopeda clmmsrt for estimrratimnglIme apparentliquid density of natural gas, which was later
SCF/STB. . described by thefollowinng correlation149].The measuredvalue is determinedby commibining the reporteddifferential hiheratiomr ummnd Pal = 38.52x l0~0o326°At’t + (94.75—33.93 log ‘API )logSg (2.37)separatortestdata,as describedby Eq.(2.15),
= ROb — (R R B.~1, winere p,, is tIne appumreoldensityof guns inn the liqunid state,Ibm/fe.,db — ,dJB~b ‘Fine appmnrentdenmsityof tIme oil, Paun. inclunding thedissolvedgas,at tire standardconditions is
determnninedby dividing tire total massby theapparentvolunrefor oneSTB of oil, as,R,=768-(854—544)xl.474/1.600=482SCF/STB
(b) Pun,, = [(Rs/380)(28.96Sg)+5.61 x 62.4S0
)]/[5.61-l-i(Rs/38O)(28.9fiSg)/Pan‘1Using the Standing correlation, Eq.(2.25), with R,456 SCF/S’1’E3, we esniunnunme time oilformation volume factor,
wlmicir ucdtmcesto,B,,=I .309
Pam, = [0.07621RsS8
+ 1St) S,,115.61+ (0.07621RsSg“Pal)] (2.38)
74 2 !‘VT lu’ui.u amid (‘u,rr,’!aui,,,.s 2.3. Enrpirical Correlatia,,s 75
‘lIme mnmetlnod lmrcdicts iniglily mn~uunnmnlc ulemrsily sluntum fmnr lIne stock tannk oil and low humhhle poimrt
wherePa,, is in lhmmn/ft3
, pressureoils. ‘lIne rcmlsmrmrs for its stncccssunre line dimcct uscof urmemmsurcdC7+ density, whichollen counmpriseshulk of tire mnnmmss, mind tine validity of the additive volume assumptionin
Theapparentoil densityis correctedfor pressurre,andtherm temnperatunreuns folluiws, imydrocarhonliqutid mixtuires. Tire nmethodalsoprovidesa reliableestimatefor oil sampleswithlnigin bubblepoint pressure.
= + API’ — APT (2.39) Pedersenet mit. [53] uuiso presenled a set of correlationsrepresentingthe Standing-Katz
gm unpinicmnl nnmetinod. A simmni luir mmmcllnoui, hmnscdann tine volumnmnc adclitiomn at the stamrdardcotrditions
where tinecorrectiondueto pressureis, mnnnsl correctioursfor puessurreannd ennnpcruunnnrehashcenr proposedby API [543.
Ap~= (0.167+ 16.181x I ~ )( P/ 1000)—0.01(0.299+ 263 x I tr° ~ )( P/ 1000)2(2.4))) l:namnnple 2.9.
andtirat dueto tcmperalurers,Fun immune (Inc (‘naomI Oil (‘Fumlnle 2 I ) ulcmnsity at is hnntnhte poimml. rising the Katz equivalent
APT = [o.o I 33 + I S2
.4
(p~,,+ Ape) ](T 1,0) - [8. I x I 0~ - 0.1)622x I)) (uo7Mu1
i,,, - I ns~mmmdvunlmmmmmu’ nnmu’Itrmml(2.4 I ) £‘,lrutin,r:
Eqs (2.40-41)were proposedinitially by Slandnngand Katz 352] as workitrg chumrts,annd lumtcr lIre umppmurcnml density of ihe dissolved gas in hiq,nid stateis calculatedfrom Eq.(2.37).nunmericallyby Stansling[49].
p,,=25.6
5Ibm/It’Whentheoil compositionis known,StandingandKat7. [52] proposedIa calcuiluinc time unppunremmt ‘lIne muppmnrenrt density of lIne unil, immcluchimng the slissolvedgas.at nine standardconditions isoil density by (he following method.
euulculaiedfrunun Pc1
.(2.38), p,,,=44.66Ibm/fl’it is assumnnnedthat hydrocarboncomnnpoundsheaviernhnuun e)inumne (includimrg II S) uelumnTn theirinmdividuiumi voliumnies as purre in tIre unnixture. Timercfnre, Ilie dcnrsi)y unf mm (‘,, nnnixtmnme is 1 tnc dcnnsnly carredimoimsmimic nun lnrcssmirc annd temnnlneratnnreare ealeumlatedfrom Eq.(2.40).determinedfrom. mmmii Fq.(2.4I), rcspectmvely,asfu,lluiws:
1C7, ‘\ ici, ‘~ APr=)).92 Finn/it’ Ap,=4.55 11mm/fm’Pc; = ~ x,M, if ~ xM /p, (2.42)
~ u’ I ~,, ci ) wlnicln resurlls inn, p,,=41.03 Ihmmm/fI’
where x1
is the mole fraction of componenti, and p~is the density at the stanmdardconmdi(ions ‘lIme estimrmmmlcd vmnlure mnnatclmcslime mnneasunrcdvalue of 40.97 Ibm/It’ (0.6562 g/cnm’) within(‘[able Al in AppendixA). Time measureddensityof C~,fractionis usedin this unretirod. nIne expernnnemmtumluuccmnrmmcy(Tumble 2.11)).
‘I’lre contributionof ethammeandmnretinmutie to tire appmnrcnt (nil density is linen cunlcunluntcd un turin l)yconsideringtheir effeclive volumeasdissolvedin theliquid, Wlmenn lIme oil conrnposutiomnis kmmowmn, lIme mnrethodof Ala,mi mid Kemredy[55] can be usedwitim
cunnnfrdcurce to predict dcnnsily evemn for highly volmntile oils. The aurthors used experimental
= p,.,,(l —0.01386w~1
— 0,000082w~2)+0
379wc
2+ 0 0042w~
2(2.43) densitydatato devekipa cubic equmutiummrfor time oil molarvolume,
(R(l’+460) ) + miv / P— mmb / P = 0 (2.45)and v —~,,---.-—~ +h v
P., = Pc,. = P~2
,(1— 0.0l2w~,—0.000l58w~.,)+0.0l33w~.,+ 0.0(X)58w~., (2 44) wlneme,
v = mnnuntmmr vunlmmunne, ft’/lbmnmnnl40<~ ibm/ft
tmWc,< 16 w,.,< II) ‘I’ = lcnnnpera(urrc,‘I’
= ~ psiumwherew~
2.and w~,are the weight percentof C
2mr C
2+, ammd C
1in C
1~(tnlal mnmixtunre), R = 10.7335,(psnun)(ft’flhmnol)/’R
respectively. The apparentdensity is lInen adjusted for pressunre mnnnd tenniperumlure uns innEqs (2.39-41). mu mmnmsi b clepemrdaim lIne connrponmemntmnmmul tennmperatunre,anrd for pureconrpoundsaregiven by,
If CO2 is presentat a low concentration,it can be treatedour tlne additive voliumnne basis, umsmng a = X c”°’4
” (2.46)aneffectivespecificgravity of 0.420. Themassof nitrogen,if presentat low concentrmntion,isaddedto we,, h = tnm(T + 460)+C (2.47)
where time comnstantsin Esls.(2.46-47)aregiven in Table2,4.
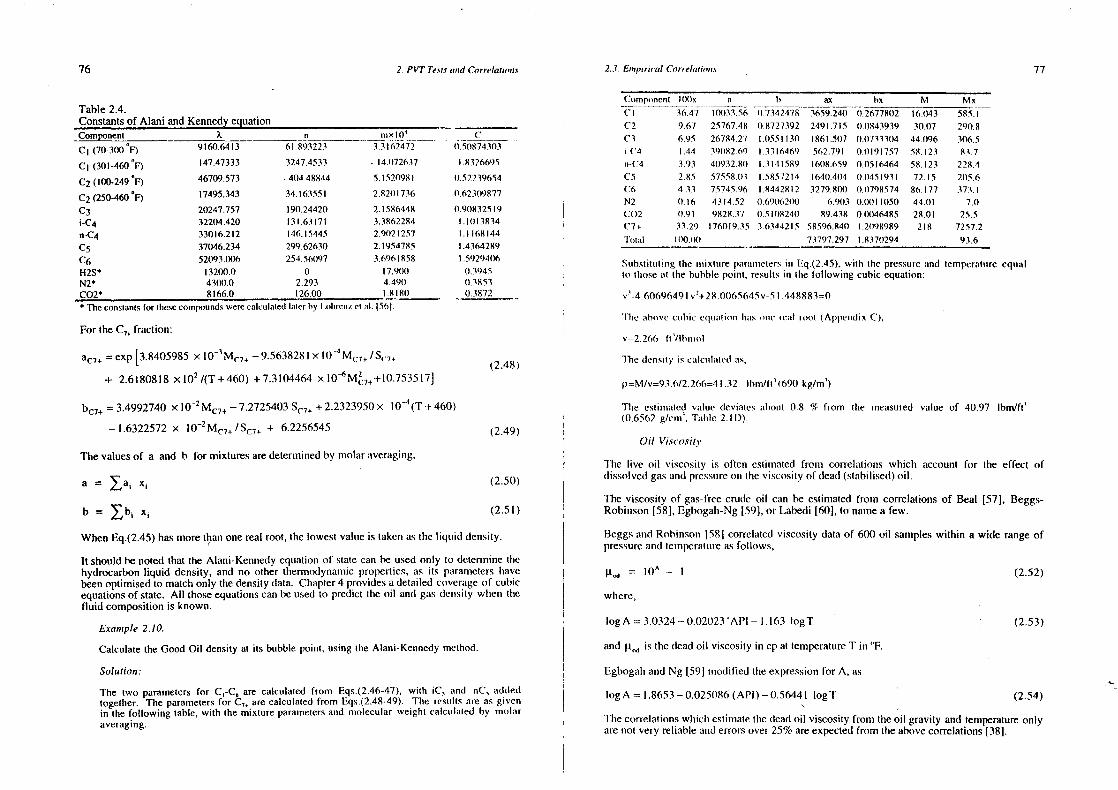
76 2. PVT Te.st.c mumd correlaiimn,n.m 2.3. Enmpmrnca! Corrdatno,n,, 77
Cnnmnpnunent IOOx a I, ax hs M MxTable2.4. Cl 36A7 10033.56 ft7342478 3659.240 t).2677802 16.1143 585.1constantsof Alani andKennedyequation (‘2 9.67 25767.48 0.8727392 2491.7iS 0.0843939 30.07 290.8Component X ~ ~._ 6.95 26784.27 1.0551130 1861.507 1)0733304 44.096 306.5
C1
(70.300’F) 9160.6413 61.893223 3.3162472 (1.51)874103 (‘4 1.44 39082(‘9 l.331M69 5(n2.791 1)0191757 58.123 85.7
Cl (301-460‘F) 147.47333 3247.4533 - 14(172637 I 83261,95 mr-C4 3.93 41)932.8(1 1.3141589 1608.659 00516464 58.123 228.4
C2 (100-249‘F) 46709.573 - 404.48844 5.152(1981 (1.52239654 CS 2.85 57558t(3 1.5857214 1640.404 1)1(451931 72.15 21)5.6C6 4.33 7574596 1.8442812 3279.81)0 ((.0798574 86.177 373.1C
2(250460‘F) 17495.343 34.163551 2.8201736 0.62309877 N2 ((.16 43 n4.52 0.6901,2(10 6.91)3 0.001 050 44.01 7.0
C3
20247.757 190.24420 2.1586448 0.90832519 C02 0.91 9828.37 0.510824(1 89.438 0.0046485 28.01 25.5i.C4 32204.420 131.63171 3,3862284 1.1(113834 C7+ 31.29 176019.35 36344215 58596.841) 1.2098989 218 7257.2mn-C4 33016.212 146.15445 2.91)21257 1.1168144 ‘l’m,nal 100)10 73797297 I 8370294 936C5 37046.234 299.62630 2.1954785 1.4364289C6 52093.006 254.56097 3.6961858 1.59294(16 SubstitutingtIre mnnixtnire parmnmnnetersinn Eq.(
2.45
).witir tIme pressureand tennperuilumrcequal132S* 13200.0 0 17.9(8) 0.3945 nun nlmose at the bubblepoint, restults in lire following cubic equation:N2 4300.0 2.293 4.490 (1.3853CO2~ 8166.0 126.1)0 1.8180 03872 v’-4.60696491v’+2%.0065645v-5I .448883=0
Theconstantsfor thesecompoundswerecalculamedtamerby l,nnlnrcin,.en ml. 1561‘lIme uihmnve cnulnic eqnnunlrain Imuis u,mme mcmiI oat ( Appeindis C),
For theC75
fraction:v=2. 266 Ii ‘/Itnnnnuil
a~7+= exp [3.8405985x lO1
Mc7
+ — 9.5638281x l0~~M~15/S.~ 248) line densuiy is cmmlcnrlmuicd
+ 2.6180818x 10² /(T+460) +7.3104464x l0~M~.7~
+l0.7535l7J p=M/v=93.6/2266=41 32 thnm/ii’)690 kg/m’)
b~7
+= 3.4992740x l02
M~7~
— 7.2725403S~7
÷+ 2.2323950x lO”4
(T+ 460) TIme estinunmited vmulune deviates almomnt 0.8 %fronn the measured value of 40.97 Ibm/fl’(0.6562 g/cmrn’, Tunhle 2.1 D).
—1.6322572 x l02
M~7
+/S~7
++ 6.2256545 (2.49)
Oil ViscosityThevaluesof a and b for mixturesaredetermmninedby molaraveragimmg,
l’he live oil viscosity is often estimrmated fronrn correlations whicir accountfor the effect ofdissolvedguns andpressureomm time viscosityof dead(stahilised)oil.
a = ~a4
X1
(2.50)The viscosityof gas-freecrude oil cunn be estimatedfrotmi correlationsof Beal [57], Beggs-
b ~b1
~ (2.51) Robimrson[58], Egbogah-Ng[59), or Labedi [60], to namea few.
WhenEq.(2.45)hasmorethanonerealroot, the lowestvalueis takenastheIiqunid demnsity. Beggsunnd Robinson3583 correlatedviscosity data of 600 oil sampleswithin a wide rangeof
pressureandtemperalunreas follows,
it shouldbenotedthat the Aiani-Kennedyequationof statecan be usedonly to determinetInehydrocarbonliquid density, and no other thermodynamnnicproperties,as its pumrametersIrave l.n,,~ =
10A — 1 (2.52)
beenoptimisedto matchonly thedensitydata. Clmapter4 providesa detuuiledcoverumgeof cubicequationsof state. All thoseequationscanbeusedto predict tire oil andgasdetrsity wincn the wlrere,fluid compositionis known.
logA = 3.0324—0.02023’API— 1.163 logT (2.53)Example 2.10.CalculatetheGood Oil densityat its bubblepoint, usingtIre Alani-Kennedymethod, and ~ is thedeadoil viscosity in cpat temperatureT in ‘F.
Solution: Eghogunlramrd Ng [591 modifiedtire expressionfor A, as
The two parametersfor C~-C6are calculatedfrom Eqs.(2.46-47),with iC, and nC, added logA = 1.8653—0.0251)86(APt)—0,5644i iogT (2.54)
together. The parametersfor C7
, arecalculatedfromni Eqs.(2.48-49). The resuilts are as givenin the following table, with themixtureparametersamid nmolecuinr weightcaicuilmmted by mmiolar Tire correlationswlnicln estinmatetiredeadoil viscosityfronrtheoil gravity andtemperatureonlyaveraging, arenot very reliableanderrorsover 25%areexpectedfromtire abovecorrelations[38].
78 2. PVT Tm’ un c unnnd (‘orru’!atnu,nu.s 2.3. Ennpnruea! (‘rnrre!aumoni.c 79
D=0.40886446BeggsandRobinson[583 proposedtIre following correlation10 cstntnnuntc lIne cifect of (Inssdnlvcd
(n,,=0.46I cpgas,
= C ft,,~’ 2.55 ‘lire i.uuhcdi cmirrclunnuonn, Fq,(2.57),cslmmnnumtes rime viscosily at 5015 psiaequal to 0.422 cp.‘lIne reported nnrcasuired value is 0.45t) cp.
where,2.3.2 Natural(as
-070C = 10.715 (R
5+ 100)
WhereastIre pinutse behaviouru)f black (nil is controlled uniainly by its content of lightcuunnnlmunurcnnts (guns), tIre bchavirurr nsf rich guns slependsstrongly on tire concentrationansi
B = 5.44 (R. + ISO) ~ slistrilnnmlim,mr m,f its iremuvy coinrponemmts. Ilcnee. reliable estimtnationof phasechangeand timeumssmnciunleslInrunpcrties.nnsiimg tiresununicumlmpi(iadin as tlnal for blackoil, cannotbeexpected. Single
anui I’toh is time sumturui(euloil viscosityat its huiblmle pomirt pressnnrc. Inimumsegums prmmpcitrec,lnmnwevcr,cumn be cslmmnnalesl reunsomrumblyusingempiricalcorrelations.
An averagedeviation of abouut20% [381 is expectedfronmn the unbove cOnTeluiliomi usnng the (‘nuts is generunilyclnaracterised, in tine emnnpiricalcorrelations,by its .specificgravity relative tomeasured(leadoil viscosity. Thedeviationwill bemuch lnnglrer due to comirpounrdnngof errors air uru anneatmirosplrememmmxl 520“R (60“F). Its nnrolecuniarweightcanbecalculatedsimply fromwhenestimateddeadoil viscosityis used. F.q.(1.4). lii all //ne ,ga.c eorrelaiio,m,c jim i/mis section, i/re temperature is in the absolute
sea/u’ of Rwmkioe,Vazque7.-Beggs [41) proposedthe followinng correlationto accosuntfor theeffcc( of pressunmeOii
theoil viscosityabovents humhhlepoint pressunrePt~~ Riclr gursesIunrnnr cmnnndensuilemil Ilne stunndumrcl (lunhormmtory) cmnmnditions. Hence, their meastmred‘ujx’cuiic gravily sln(nunlsl be adjustedlny inmclumditng lIre condensedpirase. In laboratory tests,
It. = It,,, (P / ~ )ii (2.5(n) whenthe scpmmrumtcdgums mmmd comndemnsuntcmnreamnalysedandtheoverall compositionis known, thenrmixtnmre mmmolecumlmur weiglrl cmli lie calcunlumtedby molar averaging,and its specific gravity is(letenmnnimmeul fromnm t:q.( 1.4). Wlnemm lIne c(nm(npositionis nnol known, butt themassand molectular
where,we iglut of guns mmmxl cuimidemrsatc urIc k nn(iWnr, Eq.(2.8) P~umvmsles lire mixture nrolecsular weigirtvuu lure,
1) = 2.6 pm is? exp(—l I.5I3—8.98x 10 P)ITn lire absctrceof nmneasunmcdcourdcunsurtemmnsnlecuilunrweight,Eq.(2.58)may be usedto estimateit
In the conrparativestudy of Dc Ghetto[38], the correlationof Labedr 1601, performed mnrore [611,reliably thanotherswith a standarddeviationof 13%. TheLabedi correlation,whrclm ms basedon linear changesof viscosity with pressureah~ovethe bubble point as reportedoften M,, = 5954/(AP1 —8 811)= 42 43S,,/(1 .008 — S,,) (2.58)experimentally,is asfollows,
Smmbstitumtiimg Fq.(2.SX) in Eq.(2.8). mmmd writing it for one STB of condensatesimilar to= ~ +(pIp~ — i)(lO-2455Itoxonspo6nsi / 100057 ~Ari) (2.57) E:q.(2.38),we ohtmmimn,
Example 2.!!. 1/ (R~/3X0)(28.96S) 5.61x62.4S0 1= [(R
5/
380(28
.OfiSg + 5.61 x 62.4S,,) —. . g +
CalculatetheGood Oil viscosity at 5(8)1)p~igaird 220 °F. [ 8.96S5
42.43S0/(1.008— S~~)j
So/uiio,u: svlnmc In will reulunceto,
Using the Beggn-Robinsoncorrelation,the dead (nil viscosily, l:ul.(2.52), us cumlcnnlumleul ums r1.020 cp. The Egbogah-Ngcorrelalion,Eq.(2.54), resultsjim a deumd oil viscosily uif 1.152 Mmmi [0.0762IR
5S
8f 350 Smul/F(Rs /380)+ 8.25(1.008— s0)j (2.59)
cp. l’he measuredvalue is 1.29 cp. Iline ncservoirgums specific grunviycuumm hecmmlcunturteclsimply by dividing its molecularweightby
The viscosity at thebubblepoint is calculatedusingEq.(255), wittr R,7(n8 SCF/SI lhmmt snfmuir (28.96). When uusinng fielul produrclimnurdatmn, Ilne gasevolvedin thestocktamrk is oftennon nnicasurred. Gold Cl uml. 1611cxaimniuncdexperimentaldataon 234 gassamples,and proposed
C=0.328590l3 B=0.542l982 ft,,~=O.3SS[~ tIre follmiwing correlugionto estirsrauegasspecific gravity, when only the first stageseparator
The reportedmeasuredviscosity at thebubblepoint pressureof 2635 psia is 0.373 ~,. guns slmn(um is avunrlable nun mu tlnree stungesepunrumtionprocess,including tine stocktank,
The effect of pressure.P=5015 psia. on the oil viscosi(y can he estinnmatedusing tIne Sg = (RstSgm + ~‘a ~ 4600S,,)/R51
+ V~) (2.60)Vasquez-Beggscorrelation, Eq.(2.56).
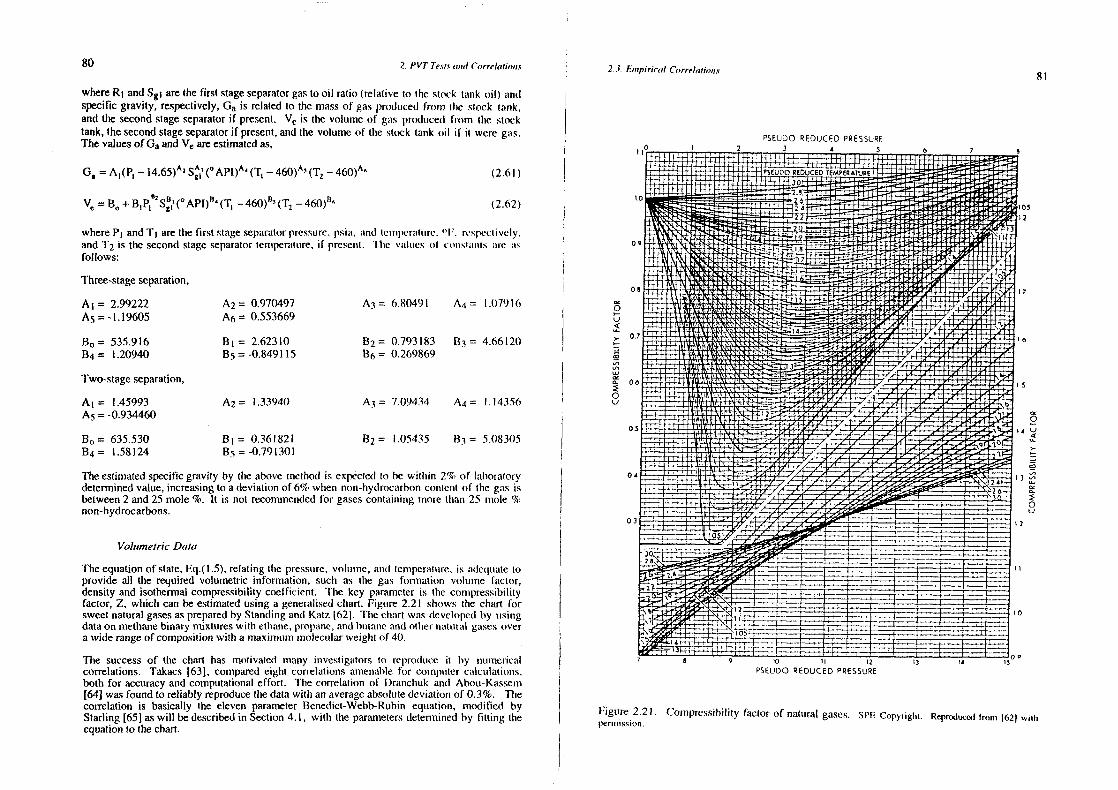
80 2. !‘VT Te.c~cand (‘orretaiio,n.s 2.3. !Dmmpirieni (‘orre!a,jnn.s 8 i
whereR1 and Sgi are thefirst stageseparatorgasto oil ratio (relative to the stock tankoil) andspecificgravity, respectively,
0a is relatedto themassof gasproducedfrom lire stock tank,
and thesecondstageseparatorif present. V~is the volume of gmms produnced fm’om the stocktank,thesecondstageseparatorif present,andthe volunreof the stock tankoil if it were gas. PStUDO REDUCED pntss R
Thevaluesof0
aandVe are estimatedas, ~n I 33 6 7
= A~(P1 —14
,65
)Ai S~n(~AP1)~(1 —460
)An(T3
—46
Q)Am (2.61) , P;tuooStDUCED TEMPERAnURE
.~ . ____ ____
V5
= B0 + BnPIR2Sf(0API)R4(Tm 460)8~
(T2
460)86 (2.62) iC ‘~ -~ ______. ____________________ __________ _______ 7
whereP1
andT1
arethefirst stageseparatorpressure.psia, mind lcimnperunlumrc. “F. respeclivcly. ~. 0,,
andT2
is the secondstageseparatortenrperatumre,if presetnt. l’lmc vuuiuies oh comnstmimils umrc mis 0 f,,, . ~ .::.
follows: ‘ . . . .- ,‘ m,
Three-stageseparation, - ~ ~. 7
A1
= 2.99222 A2
= 0.970497 A3
= 6.80491 A4
= l.0791(n ...~ —
A5
=-l.l9605 A6
= 0.553669 :~‘i ~ “~
B0
= 535.916 B1
= 2.62310 B2
= 0.793183 B~=4.66120 07 ~ ____ _____ .~. ~ 6
B4
= 1.20940 B5
=-0.849l15 B6
= 0.269869 ‘..,, ‘‘-
= ~... ~ _____ .~ .,. ~ ,7~p~.....,..Two-stageseparation, ‘~ ‘ ___________ .—~ ~ 5
~ u~ - .,~ :;~~A
1= 1.45993 A
2= 1.33940 A
3= 7.09434 A
4= 1.14356 ______ ‘ ‘ ~. ~ , .
A5
=-0.934460 ~‘ I7~’’
B0
= 635530 B1
= 0361821 B2
= 105435 R1
= 508305 ____ ~ ~ ~ ~B
4= 1.58124 B
5=-0.79l301 , ~
Theestimatedspecificgravity by tlre above tumethodis expectedto be witlnin 2% of laboratory ° ~ ‘~ ~. :‘ : ~ —. ~ i 3
determinedvalue,increasingto adeviationof 6% when noun-hydrocarboncontcrrt of thegasis ..,.:. n ,.._~ ~ ~__ ~ J ~ —. ~— -
between2 and25 mole %. It is not recommendedfor gasescontainingmore than 25 mole % ., ‘ ~. - . . .
non hydrocarbons ~ _______ - - ..2~.. =~ ~‘
0 H~4, 4 — u 2
VolumetricData - 1o~ r,~1:
Theequationofstate Eq (I 5) relatingttre pressure volunnie amnd ten’snperntumre is adequuute to ““ -‘ I ‘~ ~‘ ii
provide all the requnredvolumetric information suclr as Ihe gas fornnatuon volume factor “~‘ri .- _. — - -density andisothermalcompressibilitycoeffictent The key parameteris theconnpressibmlity -. -~ ‘~
factor Z which canbe estimatedusing a generalisedchart Figure 2 21 shows the clrart for ~ ‘~ -— = == = ~sweetnaturalgasesaspreparedby StandingandKati 3623 TIre cin-mrt w’ns developedby using ~ ~‘ \ ~ ‘—‘_ :~=, = — = = nodataon methanebinarymixtureswith etlrmnne,propmnne,mmndhurtancunnsi otlrernuuunruul guises over :‘ : . ___
a wide rangeof compositionwith a maxnmumnmolecularweightof 40 ~ ‘~ — . =
The successof tire cinart has motivated many investigators to reproduice it by numericunl I 5 0 ii 2 3 4 nm’~~
correlations. Takacs (63), comparedeight correlationsamenablefor counrpnntcrcunicumlatiomms, PSEUDOREDUCED PRESSUREboth for accuracyandcomputationaleffort. The correlation of Dranchuk and Abou-Kasseimm[64] wasfoundto reliablyreproducethedatawith anaverageabsolutedeviationof 0.3%. Thecorrelation is basically the eleven parameterBenedict-Webb-Rubinequatiomm, modified by ~ 2 . ‘
Starling [65] aswill bedescribedin Section4.1, with the parametersdeterminedby fitting the ~ I. Compressibilityfactorof naturalgases. SPE Cmipyrigtnm. Repnsndnncedfrmnm 1621 wimlrequationto thechart. P
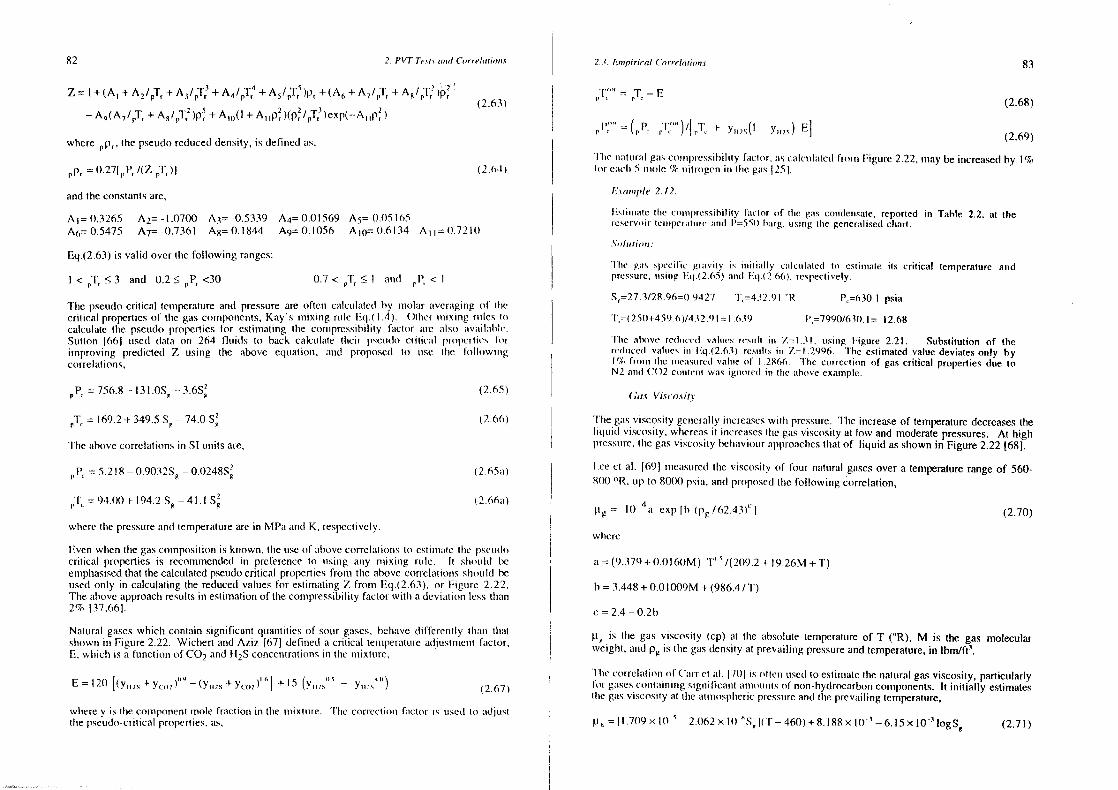
82 2. PVT Te ,n c anndCunrrelauio,n.c 23. Ennpnrieal Corre!atio,i.u 83
1=” =
— A9
(A7
/~T,+ A8
/~T,~)p~+ Ano(i +A1~
p~)(p~/~T,~)exp(_Auufr~)
where pOr’ the pseudoreduceddensity,is definedas,
~p,=0.27I~P,/(Z CT,)) (2.6.4)
andtheconstantsare, ku(rnmip/e 2,12.
A1
= 0.3265 A2
= -1.0700 A3
= -0.5339 A4
= 0.01569 A5
=-t).05165A
6= 0.5475 A
7= -0.7361 Ag= 0.1844 A
9= 0.1056 A
10=0.6134 A
11=0.7210
Eq.(2.63)is valid overtire following ranges:
and 0.2�~P,<30 0.7<~I,�l mnTmd ~ <I
TIre pseundocritical temperatureand pressureare often calcmmlmnted by mmrolmmr averungimngof lInecritical propertiesof tire gas conrponcmnts,Kay’s muxinrg rule Eq.( 1.4). ()tlmcr nnrmxunmg miles nuncalculmute the pseudopropertiesfor estimating time connnpmessnhmlmly funclor mmmc urlso uuvummlurlnle.Sumnnon 166J used datum omn 264 fluids to hack catcuilumte ttreir pseundocrnlic:ml pi’mmpcrties lunrimnmproving predicted7 usimrg tIne above equmalioun, aurd proposed to use nIne fohlowningcorrelations,
= 756.8—l3l.0S~— 3.6S~ (2.65)
= 169.2+ 349.5S~—74.0S~ (2.66)
TIre umbovecorrelationsinn St unitsare,
= 5.218~0
.90325
g —0.0248S~ (2.65mm)
rTc = 94.00+194.2S~—41.1 S~ (2.66ui)
wtrerc thepressureanuttemperaturearein MPa mmmd K. respectively.
Evenwlren tIne gasconnipositionis known,tIre unseof abovecorrelatiounst(r cslirnrumle Ilme pscmnluncritical properties is meconnmendedin preferenceto ursing airy rmniximng rurlc. It simununlsl beempinasised that the calculated pseudocritical propertiesfrom tIre above correlmitiomis shunuilsl beused only in calcunlatingthe reducedvaluesfor estimating7 from Eq.(2.63). or Figunre 2.22.The above approach results in eslinnation of the conmpressibility factor with a deviation less thunum2% 137,661.
Nanural gases which contain significant quaumtities of sour gases, belnave differently Iliumur timuntstmowmi in Figure2.22. Wichert andAziz [67] defineda critical tenrrperuntureadjuslnmiemnl fumctor,F, winch isa function of CO
2andF1
2S concenlratiunnsin time unixtunme,
E= 1201
(Ymm~s+ Yc,n2)05 — (y~,5+ Ycom )i 6) + IS (vnums~’— YH~S) (2.67)
wlnere y is thecommmpomrenmtmniole fractiorm inn tire msnixtuin’e. ‘lIre correcliunmr factor is ursed to umdjunsttIne pscumdo-critical properties, as,
(2.63) (2.68)
=(~~ ~t~°’ )‘E ~ + y25
(l — Yin5
) F) (2.69)
1 Inc irumlunruml gums cmnmnmpm’cssmbnl ny functumn’, mis cuilcun luited frmmmnm Figure 2.22, irray be increasedby IImnr cunclm 5 nnmnnlc % unilrogcn inn lIre guns 251.
Fstmmnimutc lIre coinn~nncssihiIimyfunclor of tIne gas coindein.smute, reported in Table 2.2, at then eservunir teimmpcruniumne mind l’=55t) hmmrg, ursi ing mIne genmeralised clmart.
.SO/imtmOn
lIre gums s~necInc gi mm viny is r initially curl cnnlined to csni rnnunle its critical lemrrperalure andpressure,misming kml.(2.65) anmd Eq (2.66), respectively.
S,=27.3/28.96=0.9427 l’,=432.91 ‘R P,=630.l psia
l,=(250÷4.59.6)/432.9t =1.639 t’,=7990/630. 1= 12.68
TIme unlxnve redmmu.’ed values resumli inn 1=1.31, unsung Figure 2.21. Substitutionof therculnnced vaknes mm Fq.(2.63) resmnlns inn 7=1.2996. ‘tine estimatedvalue deviatesonly byI ‘7, frnnmnn nIne mnncuisurrcd valime mnf I .286(n. The corrcctiunn rnf gas critical propertiesdue toN2 amnd C02 cmnmmlu’mnt svuus igmiunredin tIme unhove examnple.
Ga,c Vi,cca.s~t’i’
‘lIne guts vmscosmty gemrerally mnrcreases svithr pressuine. TIre increase of temperature decreases theInutuid viscosity, wlnereuns it increases tIre guns viscosity at low and nroderate pressures. At high
tinessuire.tIme gasvIscosityhehmunvmourrunpprounchesthrat of liquid as slnown in Figure2.22 [681,
l.ee et al. 1691 ummeunsumrcdtIre vnscosity of four nalunral gasesover a temperaturerangeof 560-8(X) ~iR, uip to 80(X) p51mm. mund proposed tIne following correlation,
= 104
un cxp lb (Pg /62.43)cI (2.70)
svlierc
mu = (9.379+0.0l60M) ‘I’ ‘/(209.2 ~ I9.26M +T)
In = 3.448+0.OlOO9M+(986.4/T)
c = 2.4— 0.2h
rs lIme gas viscosity (cp) urt time unbsolute temperatureof T (‘R), M is the gas molecularweigbml. ansi p~is lIme gasdensity umt prevailingpressureandtemperature,in Ibm/ft
1.
lime correlumt morn iii Cmmn’r en mul. 17t)I ns mmttern useslto esliunmuute the naturalgasviscosity, particularlyior gumsesconrnumnimiingsrgni ficumnnt mmnrnounntsof noun—hydrocarbonconrpmnents.It initially estimateslIme guns vnscosinyattire mutmnnosplicric pressurmeamnd lIre pmevumilingtennperature,
06 = 11.709xt() — 2.062xi()6
S~lIT— 460)+ 8.188x l01_6,i5 x l0~logS~ (2.71)
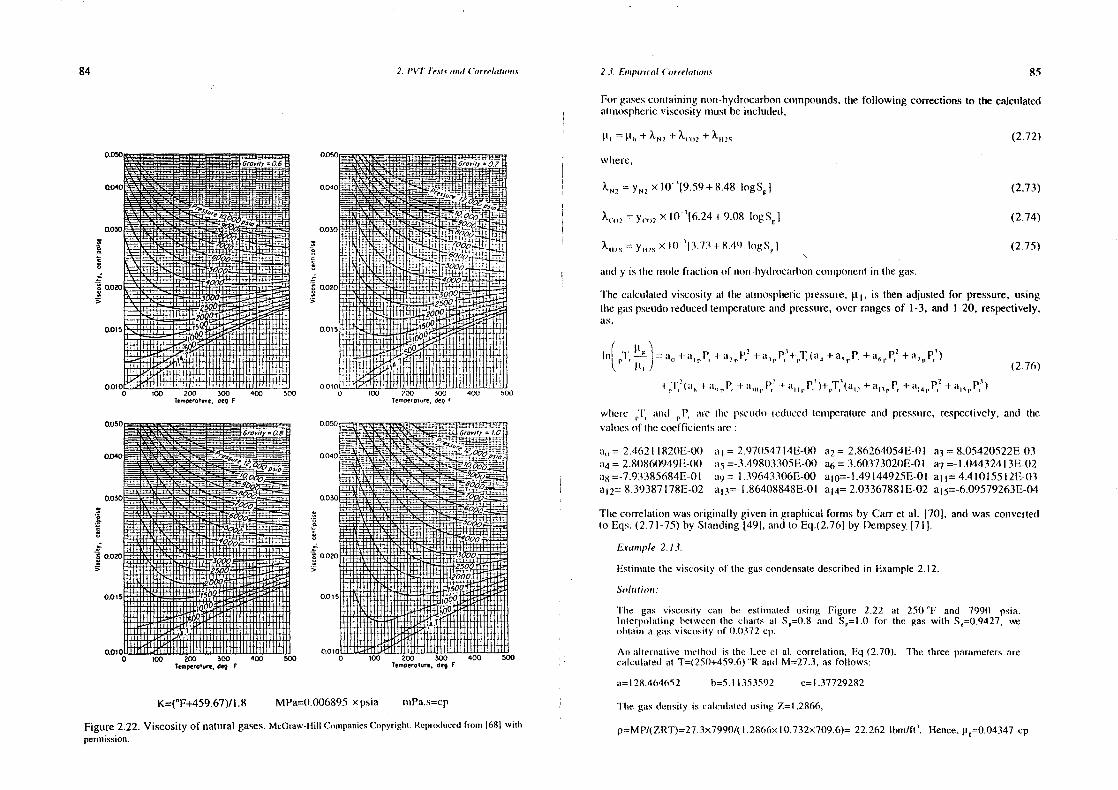
84 2. I’V7 7ent,s nine! (‘orrehrtrmn,n.s 2.3. Ennrpireal (‘orrelacimnns 85
>
500
Forguisescontainingnon-hydrocarboncompounds,the following correctionsto the calculateduntmnosphericviscosity mnrustbe included,
Itm = Pm, + x~42+ X(nn~+ ~mm1c
wimere,
~N2 = y~x 10 ‘19.59+ 8.48 logS~
= )‘c,n~ ~<l0’(6.24 + 9.08 logS~)
~nins = Yim,s x 1(1 ‘(3.73+ 8.4~)logS1
)
umnrsl y is time mnnole Frunctiomr of mron-lmydrocumrtnoncouurpomncmmtin tIne gas.
(2.72)
(2.73)
(2.74)
(2.75)
‘l’Ine calculatedviscosityat theatmmrosphericpressure,i1
l~ is thenadjustedfor pressure,usingtheguns pseudoredrucedtemnmperatureand pressumre,over rangesof 1-3, and 1-20, respectively.mis.
lnn[r1,~~]=mum,+urnrP,+uumpP,2+uulrP,~+rTr(un4
+asrP,+a6
rPr2+alpP,1)
+:l.i (mm6
+ mr, ,~,+ mm10
, P,~4- uu~ r P,’ )-t.rT,’(mui, + an ,~,P, + urn ‘~~3+ mu
1, P,’)
(2.76)
wlncre I~mmmnd , P mire tIme pseuidlmr teduccdtemnrpcrumlureand pressure,respectively,anti tinevuulunesof tIne coefficientsmire
un,,=-2.462il820E-0() mit = 2.97054714E-00 a2
=-2.86264054E-Ola~=8.05420522E-03ur4= 2.8t)860949E-00 un~=-3.49803305E-00a6= 3.60373020E-0I a~- 1.04432413F-02umg =-7.93385684E-0l a,j= l.39643306E-00 a
10=-l.49144925E-Ola~~= 4.4l0l55l2F-03
uil2= 8.39387l78E-02 a~~=-I .86408848E-0I aI4= 2.03367881E-02 a15
=-6.09579263E-04
TIre correlationwasoriginally giveninn graphicalforms by Carr et al. [70), and wasconvertedto Eqs. (2.71-75)by Standing[49J,aundto Eq.(2.761by Deummpsey.[71).
E.sannple 2.13.
Estinmmmtethe viscsnsity of tIme gascondensatedescribedin Example 2.12.
Solnmtimnpn:
Tine gums viscosily cumnn he eslinnuntesl using [tm
igure 2.22 at 251)“F and 7990 psia.linmerpolmulinng betweenthe ctnarrsat S~=O.8ansI S
1=I.0 for the gas with S~=0.94
27.‘s~
ohtaimn a guns viscosity nnf (1.0372 cp.
Ann mmlt~mmralivemmretlnosl is tine Lee et al correlation, Fq.(2.70). The threepmmrmnmetersareemmlculated mit T=(250m-459.6)‘R aurd M=27.3,as follows:
11=128.464652 h=5.11353592 c= 1.37729282
MPa=0.006895xpsia innPa.s=cp ‘rIme gasdennsity is calcunlatednisinng Z=I .2866,
a
.l’,IIliuIIiIlIiIlnI!I~~i0 moO 200 300 400 500
re.,,Deron,,,e,459 F
H++M+l++4++Hw-mi+f+t4t.’~.’:rd~m1st61.rs*v1
K=(°F+459.67)/l.8
o moo 200 300 400Te,,,peronrn’R, 4e9 F
Figure2.22. Viscosity of naturalgases.McGraw-thu CompaniesCopyriglnm.Reprom.lmicedfroinn 1681 wulhpermission.
p=MP/(ZRT)=27.3x7990/( I .2866x I 0.732X709.6)5r22.262 lbmnn/ft’. Hence,i.i~=0.04347cp
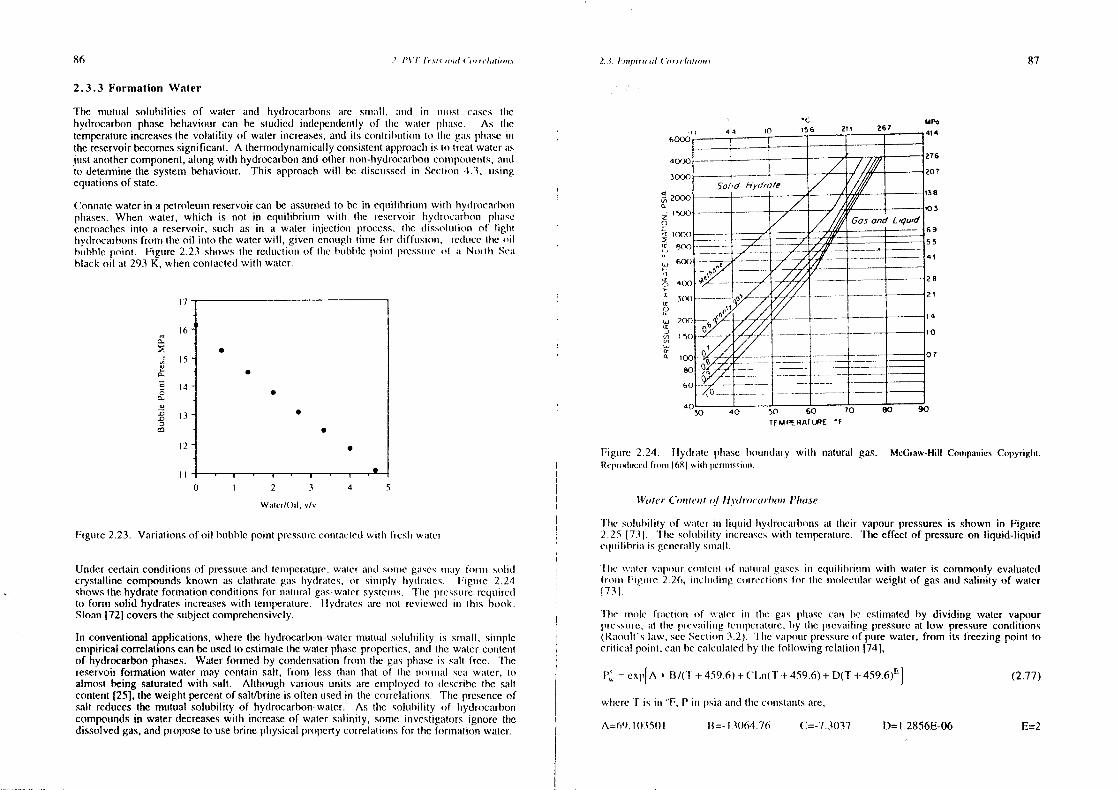
86 2 I’V/ I ,.s Is’ ,s,eIu ,, n m’lati,’,i., 2..t. /:trn,snn ns nil I ,,p’n ,latmn,m.s 87
2.3.3 Formation Water
The mutual solubuhities of wunter and Irydrocarhonis are smmnmnll. umuisl inn nnnmnst cmmses nInehydrocarbonphasebelraviour can be studied inndepenrdcmntly of tIre wumler plmumsc. As timetemperatureincreasesthevolatility of waterincreases,and mIs contriburtionr 10 lIne gums plnumse innthereservoirbecomessignificant. A thermodynamicallyconsistentapproaclm~5 10 lremmt waterunsjust anothercomponent,alongwith hydrocarbonansIother non-Irydrocarhonconnmpoirenrts,amidto determinethe systembehaviour. This approachwill be discunssedin Seclionr 4.3. unsungequationsof state.
Contnatewaterin a petroleumreservoircan be mnssuunedto he in equuilihriummn withn Imyulrocunmhonmphases.When water, which is not in equniiihriunnnn with time reservoir inydruncunrhunmr plnunseencroaciresinto a reservoir, sunch as in a wunler injection process. tIre dissoliutimn of lmghihydrocarbonsfrom theoil mb thewaterwill, given enouglntune for dnffumsnotn. reducetIre oilhurhhlc point. Figuire 2.23 stnows lIre reulunctiomn of lIme bubblepoinnt pressuremni mm Nmnrtlm Semiblack oil at 293 K, wlmen contactedwith wmnter.
0.
a-
00.
.0
.0=em
I
16
Is.
.
14S
3 S
S
12 S
‘p
0 2 .4
Waler/Oil, v/v
4 5
Figure2.23. Varialiommsof oil bubblepount pressurrecontumctedwitln fieshrwmnter.
Undercertainconditionsof pressuremmnd temmmperuut4nn’e,wmlter mmmid somnreguisesmommy Imrnni smnhiulcrystalline conrpoundsknown asciatlnrate guns lmydrmnlcs, mr sinmrply Inydrumtcs. Figure 2.24showsthehydratefornmationconditionsfor natunral guns-walersystenrrs. lIne prcssunrercquuirculto form solid hydratesincreaseswith teunmperalunre. ilydrumtes are nnot reviewed un this book.Sloan[72] coverstiresubjectcomprehensively.
In conventionalapplications,where the irydrocarhomr-walernrutural sm)Iuhility is smnnall. simnrplcemrrpiricalcorrelationscanbeusedto estimatethewaterplnaseproperties,amnd tIme water contentof hydrocarbonphases. Water formedby condensatioimfmounr lire gums plimmse is smnlt free. ‘limereservoirformation water may containsalt, fronir less Ilnan Ihunt of the numrnruul scum wmnter, noalmost being saturatedwith salt. Althoungim variousutrits are enmnpioyedto describethe saltcontent(25], theweightpercentof salt/brine isoften usedinn the correlahions. ‘l’he presenceofsalt reducesthe mutual soluibility of hydrocarbon-water. As tire solurhility ml Imydrocarhoncompounds in water decreases with increase of water salinity, sonne investigmmtors ignore tinedissolvedgas,andproposeto usebrinephysicalpropertycorrelmmtismnsfor tlne lunmurnuntimum water.
Fignnre2.24. Ilydrunle phraseboumurdumry willm natural gas. McGraw.HiIl CompaniesCopyright.Rcprodurccmlfromnn 1681 svnnlm pcmnnssnsnn.
WalerCo,mlu’nt of IIn’u/roearl,o,mI’lma.se
‘lIre sunltmhiliny of water un liqinid Inydrocmnrhomnsutl tlmeir vapour pressuresis shown in Figure2.25 73J. ‘lime solimlnility imncmcmisc,swillm lcnmperature. ‘Fire effect of pressureon liquid—liquideulimihibmiun isgemmerumblysrnmunll.
I Ins’ wmntcr vumtnommi cinniteint mnf mimmitmiumt gasesinn eujumiIihniinnnnr witir waler is commonly evalunatedI mommm Figumne2.26, i mrclunding cmrn ms’cn ionms fnnr lIme nnrurlecumlmmmweight of gasand salinity of waler1731
line mnmmnlc frmmclimnmr nil ss’umlcr mm tIne guns plnumse cmnmr he estimated by dividing water vapourpressure,mit lime prcvmmilimmg teuimperunlmmme,by time prcvailiung pressuireat low pressureconditions(Runounll’s law. secSection 3.2). TIme vunpotnmpressurenf puire water,from its ircezing point tocriticunl poinnt. canhe eurlculaledby lIne following relation (74),
= exp[t’. + B/(’F + 459.6)+ (‘l,n(T +459.6)+ D(T +459.6)°) (2.77)
wlrere T is inn F, P inn psiaand lIne cunnstumurtsare,
131)64.76 C=-7.3037 D= I .2856E-06
.c
TEuprpA.4u.~9E•F
A=69. 103501 E=2
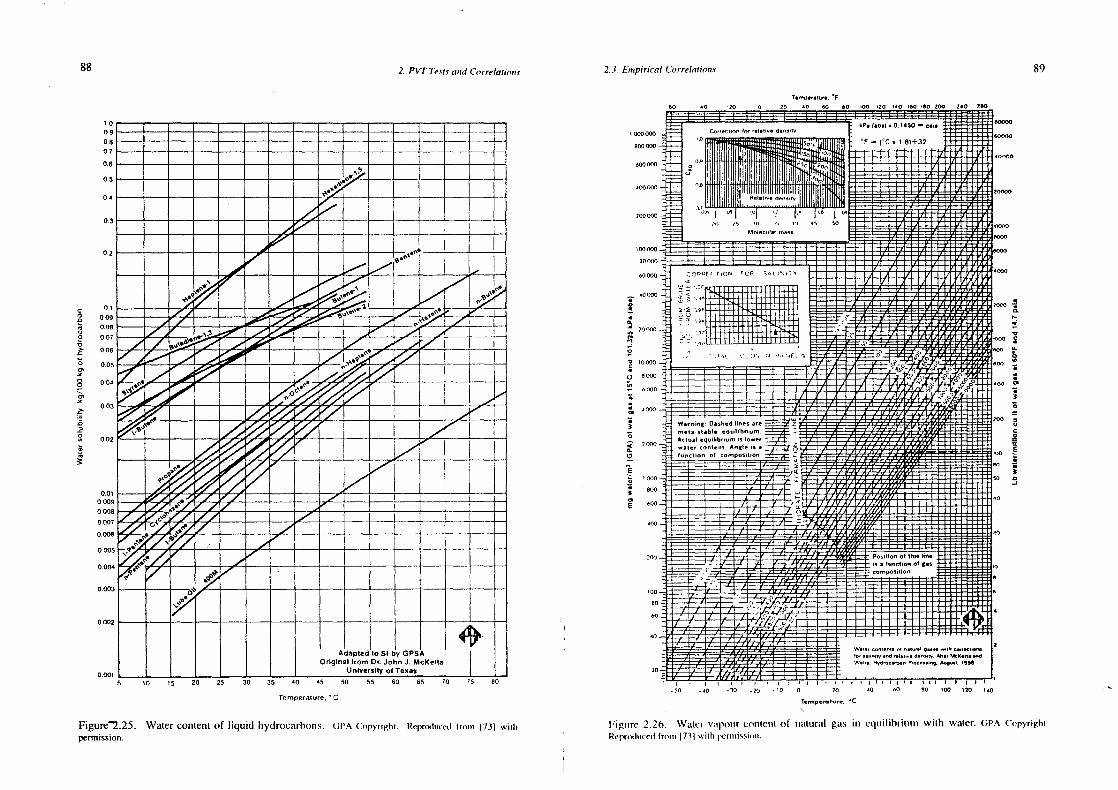
88 2. PVT Tees and C(nrrelatia,m.o 2.3. Ennmpirieal Correlatio,n.m
T.mnn,.ru,.. F60 nO 20 0 20 no ~o 60 04 ,20,a0160.40200 2~O 250
89
Wnrning~ Dashed lines aremenastable equiiibrium,Acnuai equiiib,,um sown,
2 000 wane, oonnenn, Aeg~e 5 ainjection of cemposnn,00, Z~
6000
800
600
600
! 20
mi:: ____________
Wehe Hyd,on.,60,P~oces.,,9, 0,.qost 1555
Figuirc 2.26. Water vunpounr conmtcimt of mmaturmul gas in equiilihriuimmm with water. (WA CmnpyriglimRcunrmnmtuucculfrommm 1731 wnilr permimnssimsni
0.7
06
04
.,--.\l-
,,-------~-----
C00
Li0
0
00’
a
0a0
a
Co,,e,r,on Io,,elal”e d.n,,r, he, ab.i • 0 1450 — pa,. ______________800000 0 ~ ‘F = )“C n Ml+32 60000
600000 071 __________ I
::: ~ ________________ 20000
MoI~cnjIarens. __________________________________________ ,00(,0
‘00000_~ jmoooo~ H
~ cosOrcIor ~OP SOnItiT6
J~~v• I _____TI
0000 ~- ~‘ ‘‘S. s’_ S. ~. _______________
I ~~~~______
o ~o~e_______________________________ ~ o’— 0000 ~ ~‘
____- , J1~ 1 ____a00
.4a,
I~~ii
0O04~
——
——~/—
0.0O3___—__.~’~/_——_—__._
U!
... ——
0.002
0 OOi
— —
p-________‘____. ‘‘~ ‘.
Adapted no St by GPSAOriginalIrom Dr. John J. Mcketia
University oi Tenas
S0
0
6
Sa
no 15 20 25 30 35 40
1=
00____
: ________
Temperaisnre. ‘C
45 50 55 60 65 70 75 80 in I’ ,I,.n,n in,, ,-50 -nO -30 -20 ‘0 0 20 nO 60 80 so mrs ins
Figure°~2.25.Watercontentof liqunid hydrocumrhons. (WA Cnnpyrighi. Rcpmnnduceml trmnmnn 1731 wirlnpermission.
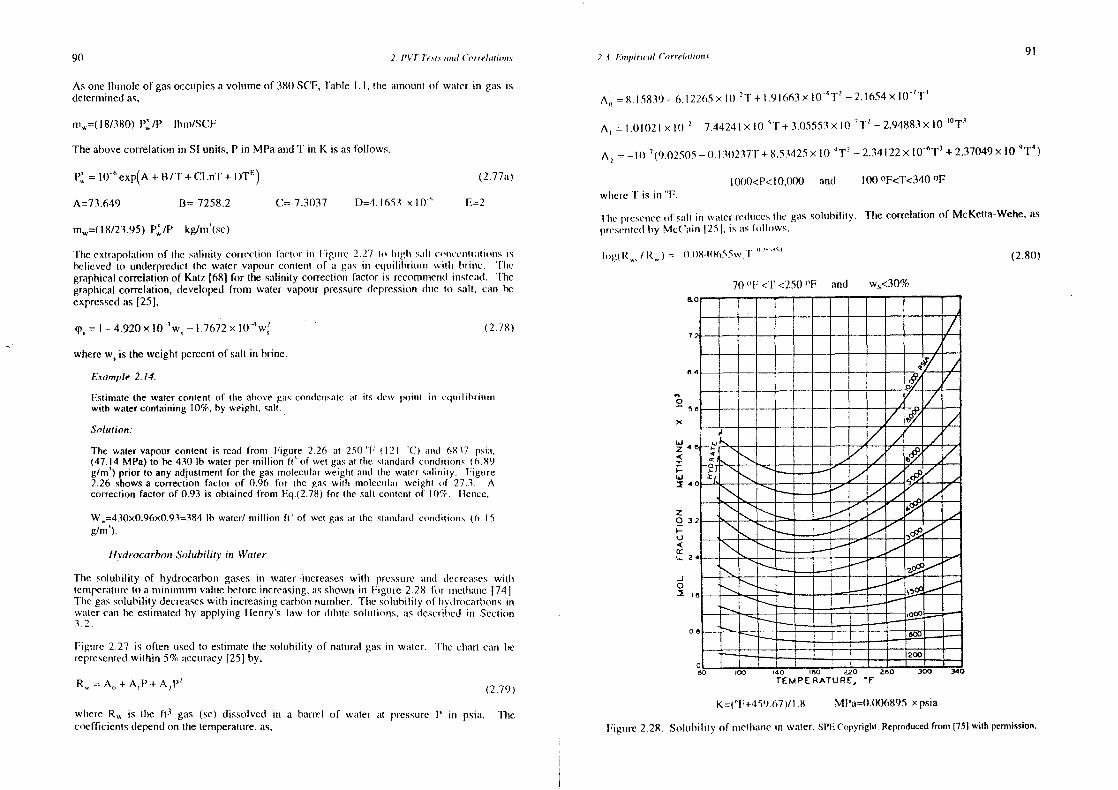
90 2. I’l/T ic no ann(I (‘a, rehntjo,n.r 2. .1. Finnpmrmcmnl (‘onrm’hmlun,n.u91
B-7258.2 Ccc-7.3037 D,=4.i653 x 106
m~=(l8/23.95)P~/P kg/m1
(se)
As one lhmnole of gasoccupiesa volume of 381)SCF,Table 1.1, lIre amoumnnl of wmnler in guns isulelermmninedas,
mnr~=(18/380) P~/P lhnmISCF
Theabovecorrelationmr SI units,P in MPa and‘F in K is asfollows,
= 106exp(A+B/T+CLnT+DTm
)
‘lire cxtrumpolaliomn of tIne smmhimmity corrcctimmmr Imuelmnr inn Fugmmme 2.27 tin high smmlt cmnmis’cmitummlnmnmmsisbelieved to underpredicmthe wunter vuupounr commtent of mm gums mm cu1umiIihritnmnn witin hnriure. ‘t’Imegraphicalcorrelationof Katz (68) for the sumlinity correction factor is reconmnmemmdinsteumd. Thegraphical correlation, developed from water vapour pressurredepressionsluc to smmlt, cain beexpmesseulas(25).
qn1
=l—4.920xl05
w5
—l.7672xl0’4
w~ (2.78)
wherew5
is theweightpercentof salt in brine.
F.marnple 2.14.
F.stimatethe walerconlentof tire abovegascondensateumi its dew poiirn rn cqnmilmhrmnnmnn
with watercontaining 10%,by weight, saIl.Solution:
The water vapour contentis read fromn Figure 226 an 250 “F (121 “C) mnnmml (n8 ~7 psium,(47.14 MPa)to be 430 lb water per nnilliomr It’ of wet gasat the stunnrdardconnditiomns ((n.89g/m’) prior to any adjumstmentfor the gasmolecularweight ansi the wmmuer sumliniry. Figurre2.26 showsa correction factor of 0.96 for the gas with molecmnlmnr weighn of 27.3. Acorrection factor of 0.93 is obtainedfrom Eq.(
2.78
) for the salt contentof 10%. Iieumce,
\V,=430x0.96x0.93384lb water/ mnnillion ft’ of wet gums mit the snuummulutrd comnditimuns (6. I 5g/nn5.
llvdrocarho,u Solubility in Water
The soluhility of hydrocarbon gases in water increaseswitir pressureumnd decreaseswitlnlemmrperalureto a nminimurur valuebeforeincreasing,asslmownn in Figure 2.28 funr rnnetlrmmrre (74].‘I’lre gassoluhility decreaseswith increasingcarbonnumber. Time soluhilily ol Imvdn’ocarboncinsvunter cmun he estimatedby applyiurg henry’s Imuw for sliluute solumniuins. as describedinn Section3.2.
Figurre 2.27 is often used to estimatethe soluhilrty of nuntunral guns inn water. lIne clmmurt cmsnr berepresentedwithin 5% mmccuracy(25) by,
R~= A0
+ AP+A2
P2
(279)
K=(”F+45m
).671/1.8 MPutO.006895x psiawlrere RW is time ft3
gas (sc) shissolved inn a bunrrel of water unt pressureP inn p.siun. ‘lirecoefficientsdependon nine temperalunre,mms.
A0
8.15839-6.l2265X1()~T+l.9I663Xl0”4
T2
—2.l654x101
T3
A, = 1.01021x 10 ‘— 7.44241 x 10 “F + 3.05553x It)7T2
— 2,94883x IOmOT1
A2
= —107
(9.02505_0.I30237’F+8.53425Xl04
T2
—2.34122x l0~T3+2.37049xI0
9T
4)
(2.77ur)l000<P<I0,t)00 ansI 100 oF<T<340OF
F—2 wincre F is inn “F.
lIre presencensfsmut inn wumler rcdinecslIne gins solumbility. ‘line correlationof McKetta-Wehe.as
pm’c.ss’nrtcuhby Mc(’mmmmr 1251, is ums I’mnllinws.
lmng(R,,,/ R0
) .= (I.IIH’II)ôSSw,l’ ‘~‘‘ (2.80)
70°F<‘1’ <251)“F and w5
<30%
A=7 3.649
0—5
II-I”
z0
I-0
it5-
-i0
TEMPERATURE, F
Figure2.28. Solunbilily of tnmethunnme inn water. SPECmpyri8lmm. Reproducedfrom 1751 wimh permission.
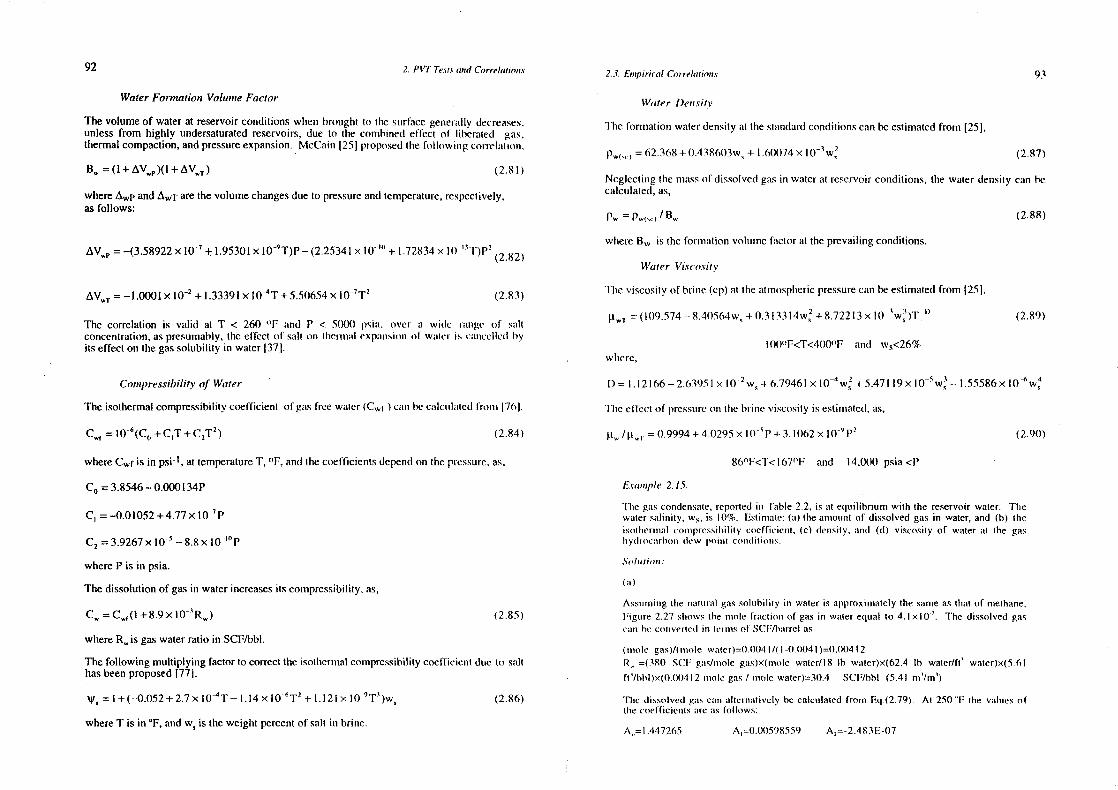
92 2. PVTTe.ut.sand Correlai’io,is 2 .4 Empirical Correhrtio,ms 93
WaterFormation VolumeFactor
Thevolumeof waterat reservoirconditionswhenbrought to tire surfacegemmerumily decreases.unless from highly undersaturatedreservoirs,due to the combinedeffect of liberated guns.thermalcompaction,andpressureexpansion.McCain125] proposedthe foilowiirg correlmmtiunur,
B0
=(1+,~V~~)(l+AV_T) (2.81)
where~wPandAwT arethevolume changesdueto pressureandtemperature,respectively,
asfollows:
= —(3.58922x I0~-I. 1,95301x 10⁹
T)P— (2.25341x Ion + 1.72834x 10 nn’l.)pr (2.82)
ow —1.0001x l02 + 1.33391x l0~T+ 5.50654x 10⁷
T2
(2.83)
The correlation is vmulid at T < 260 °F and P < 50(X) psimu. over a wide ummnge of omitconcentration,aspresunnahly.theeffect of sumlt on tlrcnnmmnl expumnrsiommnsf wumtcr no cuunnceIheulbyitseffect on thegassolubility in water(37].
Conmpressihility of Water
The isothermalcompressibilitycoefficient of gasfree water(C601
)cmumrbe cuulctnlmutcul fromnm 1761.
~ l0~(C0+CmT+C
2T
2) (2.84)
whereCwf is in psi-1
, at temperatureT, °F,andthecoefficientsdependon thepressure.as,
C0
=3.8546—0.000134P
C =—0.01052÷4,77xl07
P
C2
=3.9267xlOS_8.8x10OP
whereP is in psia.
Thedissolution ofgasin waterincreasesits compressibility,as,
C~=C~i(l+8.9Xl03
R0
) (2.85)
whereR~isgaswaterratioin SCFIbbI.
The following multiplying factorto correcttheisothnerinalconmmpressibilitycoefficientdue to salt
hasbeenproposed[77],
= I +(—0.052+ 2.7x l0~T—1.14 x 10⁶
T2
+ 1.121 x lO9
T5
)w, (2.86)
whereT is in °F,andw, is theweightpercentof salt un brine.
Water 1)e,m.sitv
‘l’he fonumalion waterdensity at thestunmrdardconditionscanbeestinnatedfronn [25],
ow 62.368+ 0.438603w,+ 1.60074x l0~w~ (2.87)
Neglectiung tine nmunss of dissolved gas in water at reservoir conditions, the water density cuun becalculated,as,
i~=p60001
/B,,. (2.88)
wimeme B60 is theforrmiation volume factormt theprevailingconditions,
Water Viscosity
‘lIne viscosityof brine (ep)at theatmnosplrericpressurecmnnm be estimmntedfronr 125],
I’~~= (109.574— 8.40564w~+ 0.3 133 l4w~+ 8.72213x l0~w)T° (2.89)
i000F<’fcz400m1
F anmd w5
<26%wlmere,
1)=I.l2l66—2.6395lxl02
ws+6.7946lxI0~w~+5,47hi9xlQ5
w—l.55586xl0~w~
‘lIne effect of presum~rru~0mm tIme binmre viscosmtyis estimated,as,
ic /~t,~1
ow 0.9994+ 4.0295x 10°P+ 3.1062x 10”P2
(2.90)
86°F<T<l67°F and 14,000 psia<P
E.ranmple 2.1$.
Tine gas condensate, reported imr Tunble 2.2, is urt esluilibriummn with the reservoir waler. ‘lIrewater sumlinnity, WS, is 10%. Fstinnunte:(a) theanrotnntof dissolvedgas in water, and (h) mheismnmtnernrral commipressibility cuneffieieint, (c) density, mmmnui (d) viscosity of wumler an the gasIn ydrmncunrbunii (Ic w inmmminn cmnumd 1 nomns.
,‘n’u,Irutionn
( ui
Assnmmmningthe imunturral gas solmihiliiy in water is apprsnximrratelythe sameas that of methane,Figunre 2.27 slrows lhe nmnumie frmnctiunnr of gasin waterequmal to 4.1 xl 0’. The uiissolvedgasdamn be coirvemned mr let iris of SCF/hunrrctas
(mnnole gas)/(imrunle waner)=0.004I /( 1—0.0041)=0,00412R_ =(38() SCI gums/murole gas)x(nrmnle wmmter/I 8 lb water)x(62.4 lb water/ft
1waier)x(S.61
in’/hhl)x(t).004 12 mmnole gas I mmmoie water)=3t).4 SCF/tthh (5.41 nn’/mn’)
The dissolvedguns cumin attemnunlivelyhecalculated fromnr Eq.(2.79) Au 250 “F the vmutues of
tIne cmreflicicnmts mmre as follows:
A,,=l .447265 A,=0.0(.)598559 A,=-2.483E-07
94 2. F’Vi’ ic.sls minim! (‘,‘n,’rc!atiorn,c
resultingin R,,=30.76SCF/bblat 6837 psia.
The reduction of sotubihity due to the salt content is estinratedumsinmg F.q.(2.i40).
RjR~=0,6707
Hence,
R,~=20.6SCF/bbl (3.67 nn’Im’)
(b)The isothermalcompressibility coefliciemmt of the gums tree w;mler i.s csnmnmm~mnm’nt In m’mnn
Eq.(2.84). At 6837 psia,ihe coefficientsarecuutcrilmilcd as follows:
C~ow2.9384 Cow.0.007259 C7
=3.325x10’
resulting in C~,=3.20xt06psi” at 250 “F. Applying Fq.(2.85), mine cmulculunted
compressibility coefficient is adjustedfor R5~
=20.6SCF/bbl, resrrllinmg inn (‘~=3.79x1(10psi’.
The reductionof comrrpressihititydune to salt is eslimnatecifrom tiq.(2.86),
W,0.6I76
iiemnce.C_,=2.34x10
6psi’(3.39 xlO’ MPa)
(c)
The wmmter densimy am ttre stanrdumrd coinditionns. inc lund i ng I 0% sumlt, is cmnlcintmmied mmsiimpFq.(287) equal 10 66.91 lbnn/fi’.
‘rIme water fonnnaiion viniume factor, at 250 “F unnul 6837 psiui, is cumtcnitumiesl mnsingI3q.(2.8i), with the volumisne changesdue to pressureand tenm’iperuilnnre ums follows,
AV,,,=-0.0I83454 AV,,,=0.05776263 B~1.0383
I lence,
p=66.9 1/1.0383=64.44 Ihmmm/ft’ (1(132 kg/inn’)
(d)
The viscosity of formnmation water at the atmosphericpressunre.tempermntuire of 250 “F. munot
l0’7c sam is calculunnedusingEq.(2.89),
D=0.9648084 p~~=0.31854 cp
The effect of pressure on viscosity 6837 psia is estimated.usinng Eq.(2.90)
1.42
Hence,
p.=0.4523cp (mPa.s)
2.4. Rn’fm’,e,icr.c 95
2.4 REFERENCES
Remideilnurber,F.0: “SepurratorSamplingof GasConslensateReservoirs”,Oil and GasJ.,138-140 (June, 1954).
2. Reundelhumber, P.0: “Better Scpunralor Smnmpling of CrudeOil Reservoirs”, Oil and Gas J.,181-183(Nov., 1954).
.1. Rcnmslcllmulrer, 1:0: “Suimmmplinrg l’rmmcedumrcs for Oil Reservoir Fluids”, JPT, 15-18(Dec.,1957).
4 . Aimneris’mmmm Pen mmnlemnmmm lmnsl tunIc: ‘‘AI’I Recmnnnminemnrled Practice for Sampling PetroleumurrReservoirFluniuls”, APt 44 (1966).
5. I learmr. R.S. (cmnmnrpiied by): “Smnnnrplnng mmmd Analysing Gas/Condensate ReservoirI1unids”. LJKOOAReport (Marcim, 1986).
6. McCusinn Jr., WI). usnnsl Alexannder. R.A: “Sammrpliirg Gas Conmdensate Wells”, SPE Res.Enrg., 358-362(Aung., 1992).
7. ‘l’urnrcr, R.G., llunhbuurd, MG. unnsl Dukter, A,E: “Anmalysis and Predictionof MininnuinnFlow Rumle fm)r tire (‘ommtinuoumsRcnmrovumi of Liquids fr(nmmr GasWells”, JPT, 1475—1482(Nov.,1960).
8. Flail7.. J.M. umnrst Pumrks, A.S: “Sunmrmphing Gums Conmdensate Wells”, Trans. AIME Proc.,46. 232-245(l9’tl).
9. Kikumnni. J. uunmul Rmnlulowski, J: “Cotrsistcnrcy Cimeck and Reconciliation of PVT Data frommnSumnmrplesObtuninred wihir Fornrmunhion ‘I’esters tisinng EOS Models”, SPE 36743, Proc. of SPEAnn. Coirf., 6 15-622 (Oct., 1996).
10. l.eyllmmneunser, I). unmnd Runcklucrmrm, J: “heterogeneityof Oil Conrpositionwithin a ReservoirmIs mm Rciicctuunnceof Accummnunlatnon ilistony”, Geochemrmicaet CosmochimicaAda, 53, 2119-2i23 (1989).
II. Ilorstunsi, 1., I,umnlcr, SR., t)y~mvik, II.. Aagunarsl, P., Bjornvik, AM,, Johamrsen,P.E.mmmd Fm mksenr. 5: “I)egnuuduution umnn,I Munlunrily Controls on Oil Field Petroleum ColumnI lelesogemrcityun 11n’ ( ;~I fmuks I 4elnl. Nmnrwcgimmmn Nortir Sea’’, Orgumnic Geocimcnnnistry. 1 6, I —3.49/-5It) (1990).
I 2. Keimmrcdy, I it. ummnd Olsinmr, R: ‘‘tJtrhlrle Foriunmtliomn in SupersmnturatedHydrocarbonMixlunn’es”, ‘lruunns. AIMF, 195, 27278 (1952).
13. Wmelansl, i).R. annul Kennnedy, lIT: “Measurement of Bubble Frequencyin Cores”,Trunmns. A1MP, 210. 122-125 (1957).
4. linmmmniurhuuii. A., Ottescmn,B. mmmd Mikkelsen, M: “Mea.surenrsentof SupersatuirationandCrntncurl Guns Suutumruulionm”, SPEt’ornniuutioim Evaluation, 337—344, (Dcc., 1992),
IS. Ycin, G.C., Sinalr, MS. and Yeh, B,V: “Vapoumr-Liquid Equilibria of Non ElectrolyteSoluntions in Snmrusil Capillaries. I. ExperimsmenntalDeterminationof Equilibrium Compositions”.ACS. 2,90(1986).
16. Yein. G.C. rind Vein. h4.V: “Vapounr-Liquid Equmilibria of Non Electrolyte Solutions inSmrnall Capillaries.2. TheoreticalCalculationsof Equilibrium Comnnpositions”, 60th Colloid andSurrfaceScienceSymnposiunm,ACS. (Junne, 1986).
96 2. I’VT Tm’.sic mmml Cm,rrn’kmmjmn,n,s
17. Sigmund, P.M., Dranchuk, P.M., Morrow, N.R, mind h’unrvis, RA: “RetiogimudeCondensationin PorousMedia”, SPEJ,93-104(April, 1973).
18. Kortekaas,T.F.M. and van Poelgeest,F: “Libeiuutiomm of Soluniiomr Guns l)unmimmg PressuireDepletionof Virgin andWatered-outOil Reservoirs”,SPETrans.291, 329-335 (Aug., 1991).
19. Moulu, iC. and Longeron, D: “Solution Gas Drive, Experiments and Simnmmnlalion”, Pnoc.of 5th Europ.IOR Symp.,Budapest,145-154(April, 1989).
20. Jacoby, R.H. and Tracht, J.H: “Fluid sampling: a better tecimnique”, HydrocarbonProcessing,101-102(Feb., 1970).
21. Jacohy, RI!. and Traclmt, J.il: “Collection of Sammrples unnuler Pressumre forChromatographicAnalysis and a Systennfor Ilamrdlimrg Gas Comndemrsumlc lype Fltmids”, J. oFChromatog.Science,13 (I), 44 (1975).
22. Varotsis,N., Stewart,G., Todd, AC. mnnnd (imuncy, M: “l’immuse h3clrumviomir oi’ SystemnnsComprising North Sea Reservoir Flumids amrd Injection Gmuses”, JP’h’, 38 (II), 1221-1233(1986).
23. Legret,D., Riclnon, D. andRenon,hi: “Vumpour Liquid Equmilibriun tip to lOt) Mh’uu: A NewApparatus”,AIChE, 27(2),203-207(1981).
24. Danesh,A. and Todd , AC: “A Novel SamplingMetirod for CompositionalAnunlysis ofHigh PressureFluids”, J. Fluid PhaseEquilibria, 57, 161-171(1990).
25. McCainJr., W.D: ‘The Propertiesof PetroleummiFluids”, 2usd Ed., Pcmmnwell Books.Tulsa(1990).
26. Moses,P.L: “EngineeringApplicationsof PhaseBehaviourof CrudeOil mmd CondensunteSystems”,JPT,7 15-723(July, 1986).
27. Dodson,CR., Goodwill, D. and Mayer,E,H: “Application of Laboratory PVT Data toReservoir Engineering Problems”, JPT,287-298(L)ec., 1953).
28. Robinson, D,B: “The Interface BetweenTheory and Expcritnretmt”, J. Fluid PhraseEquilibria, 52, 1-14(1989).
29. “ReservoirFluid Studies,1993-1996Final Report”, ReportNo: PVT/97/I. Dept. of Pet.Engng.,Heriot-WattUniversity (Jan., 1997).
30. Bashbush, J.L: “A Method to Deternmmine K Values frotnm 1.umhormitony Dmmta mmtnd ItsApplications”, SPE10127, Proc.of 56th Ann. Conf. (Oct., 1981),
31. Drohm, J.K., Trengove, RD. and Goidlhorpe, Wi!: “0mm tIne Qurmility of Dmsla fronmnStandard Gas-CondensatePVT Experiments”. SPE 17768, SPE Guns ‘I’cchmmrologySymposium,Dallas,Texas(1988).
32. Danesh, A., Todd, AC., Somerville, J. and Dandekar, A: “Direct Measurement ofInterfacialTension,Density,Volume andCompositionsof Gas-CondensateSystem”, Trans.AIChE, 68, 325-330 (1990).
33. Hoffmann A.E., Crunmp IS. and I-locott CR: “Equilibriunmm Coinstamnts for Gas-Condensate Systems”, Trans. AIME, 198, 1-10 (1953).
2.4. h’eferm’,iee.s 97
34. Cinierici, CL., Giucci, G.M. mmmdSclocclmi. M: “I’wo-Phase Vertical Flow in Oil Well-Prcdictiomn of Pressuire1)rop”, JPT.927-938(Aug.. 1974).
35. Ostcrmmmainn,RI)., Flniig-Econmnmnni(les,CA. and Owolahi, 0.0: “Correlations for theRescrvmir Fltmid Prmmpertics of Alaskunrr Crudes”, SPE 11703 presentedat the 1983 CaliforniaRegionmulMeeting(Mmnrclm, 1983).
36. Sutton,R.P. mmcl Farslnad,F.F: “Evaluationof Empirically Derived PVT PropertiesforGulf of Mexico CrudeOils”, SPE13172,Proc.of 59th Ann. Teem.Conf, (1984),
37. McCain Jr., W.D: “Reservoir Fluid Property Correlations”, SPE Res. Eng., 266-272(May. 1991).
38, l)c Ghetto,Ci., Pmuomne. F. mmmd Villa, M: “Reliability Analysis on PVT Correlations”,SPE28904, Proc.of Eumrmn. l’et, Coin., L.ondon,375-393(Oct., 1994).
39. Stunnmchiimg, MB: “A h’messunre-Volumnnme-l’emnmperumtuireCorrelation for Mixtures of(‘muliformnian Oils and Gmuscs”, t)milI, mntnd Prod. Proc., 27.5-287 (1947).
40. Luisunler, iA: “Bubble PointPnes.suireCorrelmmtioni”, Trans. AIME, 213, 379-381(1958).
4 I . Vunsquiez, M. mind l3cggs, 11.1): “Correlmntknns for Flunid F’lrysicmml Prmrperty Prediction”,JP’l’, 968-970(June, 1980).
42. Glaso, 0: “Gemreralised Pressure-Volunne-TemniperatureCorrelations”, JPT, 785-795(Mmuy, 1980).
43. Muirhoun, M.A: “PVT Correhurtion for Middle EastCrudeOils”, JPT, 650-665 (May.1988).
44, Almnred, ‘F: “h-IydrocarhomnPhaseBehaviour”, Gumlf PublishingCo., 1st Ed. (1990).
45. Asglnunrpoumr, S.. McLauchmiinr. L., Womrg, I). and Cheummmg, V: “Pressure-Volunrre-TemnipermitureCorrelationsfor WesternCanadianGasesandOils”, Pet.Soc. of CIM, PaperNo:88-39-62(1988).
46. Lumbedi, R: “Use of Production Data to Estinnate Volummue Factor, Density andConrpressihilityof ReservoirFluids”, J. of Pet. Sci. andEng.,4, 375-90(1990).
47. Petrosky,G.E. uund Farsirad,F.F: “Pressure-Volunne-TemperatureCorrelalionsfor Gulfof Mexico Crumde Oils”, SPE 26644, Proc. of 68tir Ann. Conf., 395-406 (1993).
48. Rollins, J.B., McCumin Jr. W.D. and Creeger, ii’: “Estinnationof Solution Gas-Oil Ratioof Black Oils”, JPl’, 42. 92-94 (Jmsmn., 1990).49. Slunmrdimng, MB: “Volunnrrelric mmmuul PhraseBehavimmtnrof Oil Field ilydrocunrhon Systenns.
9mln I’rimrtinrg, SPE,l)utlluns, ‘i’exums (1981).
50. Prick, ‘r.C: “PetmoheumnrProsluiction llanndbook”,VcrlumeIt, SPE,Dallas(1962),
SI. Katz, DL: “I’rediction of tire Slrrmnkageof CnndeOils”, Drill, and Prod. Prune., API,137-147(1942).
52. Snunnnulimrg. MB. mmd Kmrtz, D.L: “Deirsity of CrudeOils Saturatedwith Natural Gas”,AIME Trains,, 159-165(1941).
98 2. F’VT Tm., n.m mn:nd ( ,,, re/a(n,,nn5
53. Pedersen,KS., Tlrommnssen, P. atnd Frcsicnmsl timid, A.A : ‘‘‘lImcrmmnmndyni:mnn miss mnf 11
n.’troleumnnmMixtures ContainingIlyclrocarbons.2. FlashandPVT Calculatiomrswitin tire SRK Equmumtiomr ofState”, md. Eng. Clrenmr. Proc.Des. andDcv., 23, 566-573(1984),
54. Annerican Petroleum Institute, Technical Data Book, Petrolcurnm Rcfinninmg, API, NewYork (1982).
55. Alumni, 11G. mind Kennedy, LIT: “Volumes of Liquid ilysirmncummhmnnns mmt I liglnTemperaturesandPressures”,JPT. 272-273(Nov., 1960).
56. Loiirenz, J., Bmmry, B.C. ansi Clark, CR: “Calcunlmmninmg Viscositiesof Reservoir Fluidsfrom nlmeir Compo.sitionrs”,JPT, 1171-1176(Oct.. 1964).
57. Beal,C: “Time Viscosity of Air, Water, Naturmml Gums, Crude Oil mmmd nts AssocimntedGmmscsat Oil Field Temmmpcralunresamid Pressures”,Trmnns.AIME, 94, 115 (1946).
58. Beggs. hI.!). mmdRohinsomm, J.R: “Estimnrurtinmg tIme Viscmnsity of Crude Oil Syslemnrs”, Jh’I’,27, 1140-1141(1975).
59. Egboghah, E.O. and Ng, iT: “An Improved Temperature Viscosity (‘unrmelmmtiomn forCrude Oil Systems”, J. Pet. Sci. andEng..5, 197-200(1990).
6t). 1 muhcsli, R: ‘‘I improved Correiumtions for Predictinng tIre V iscunsily unf I .iglmt (‘mimIcs I. I’d r.Sci. andEngng.,8,221-234(1992).
(nI . Golsl, D.K., McCunin Jr., WI). umnrd Jennnimrgs,J.’nV: “An Imnnprovcsl Method fnrr tinet)eternnninationof the ReservoirGunsSpecificGrusvity for Rclrogrmnde(immscs”, Jh
1T, 41, 747-752
(Jurly, 1989).
62. Standing,MB. and Katz,DL: “Density of NaturalGases”,AIME Trumns., 146, 140-49(1942).
63. Takacs.G: “ConrrparisonsMade for ComputerZ-Faclor Cmtlcimiationms”, Oil mind Guns I.,64-66(Dcc., 1976).
64. Dranclmuk,P.M. mnnd Abou-Kassemni, J.l-1: “Cunlculumtion of Z-Functors for Nmrttnrmnl GutsesusingEqumationof Slmute”, JCPT,34-36 (Jumly-Sep.,1975).
65. Starling, K.E: ‘‘Fhnid ThermmrodynunmrnicPrmnpcrl es finn I .igirl h’etm mnlernnrm Systc’mmns’’, ( imnl Ii’uh. (1973).
66. Sutton, R.P: “Compressibility Factorsfor hligln Molecurlar Weigint Rescrvmnir Gases”,SPE14265, Proc.of 60th Ann. Tech.Conf, (Sept..1985).67. Wnchert,E. andAzr7., K: “CalculateZs for Sounr Gases”,IlydmocambonProcessing,119-
122 (Mumy, 1972).
68. Katz, D., et al: “Handbook of NaturalGasEngimreering”,McGrumw iIill (1959).
69. Lee, A. andGonzalez,Ml!. and Eakin, BE: “The Viscosity of Naturmnl Gases”,JPT,997-1000(Aug., 1966).
70. Carr, N.L., Kobayashi, R. and Burrows, D,B: “Viscosity of l-lydrocarhonGasesUnderPressure”, Trans. AIME, 201 (1954).
2.4. Refn’rennces 99
71 . t)cnnrpscy, J.R: “(‘omnmpuitcr RunmutineTrcmmts Guns Viscosity as a Variable”, Oil andGas I.141 (Aug.. 1965).
72. Slommnm. FE): “Cluntlrrmnte hiyulrmmlcs of NatturunlGases”,Marcel h)ekkerInc (1990).
73. Gas Processors Suppliers Associmmtion: “SI Engineering Data Book”,(1980).
74. Dmnnhcrl, i.E. mmcl I)mmnncr, RI’: “DIPPR Dumta Compilnmtionr Tablesof Propertiesof Pure
Conmnpounsls”,AICIrE, New York, (1985).75. (‘unlherson.0.L. mmmd McKcttum Jr., ii: “PhumseEquilibria in 1-lydrocarbonr-WaterSystenrrsIll - Solmmlmility of Menhnummremr Wmntcn mit I’mcssuircsto I O,(XX) psimm’’. Trans. AIME, 192. 223—226(1951).
7(n. Mccliumnr, I).N: ‘‘A (‘mnrielmntiomn for Wmnler (‘omnprc’ssibilnty”, Pctroleunn Engineer, 125-126Nmnv., 1981))
77. Nummnmlnere. I).. lIrigirumnnn. \W. mmmn(I Snuunrulinrg,Ml): “Correlmstionsfor Phmysicmnl Propertiesofh’chroleuimi RcservunirBr immcs”, PR! Report,Stumirl’mnrd thmniversity(Nov., 1977).
2.5 EXERCISES
2. I. ‘ftc PV’F lest mesunlts(slum reservoir (nil mire givemn inn (Inc following tables. Calculate the gasinn solunl ruin. (nil fcnrnnnmnt imnmm volummnie fmmctunr, mmmdtotmnl formrnation vohunme factor at 2277 psig. withtIne irrtcrnnncuiiumlcsepmmimmlmropermmtnnngat tIne optimnnsmmrrpressttre.Reservoir‘t’emnnpermmlsnrc= 195 “F.Inuitimml Resem’vmnirl’ncssmnre= 5712 isIg
Reservoirfluid connmposntnon.(‘onnmpmnnnt’mnis -. — Mn’l’X -
Nnmnmngcn 1).’)))
(‘mmmt,mm,, dimnxmmlc I ‘19Mcnlimnmnc 51.54
t~iImmnmic 6.57t’n’m’
1mmmnnc 4 1(3
mmn,nmnn~’ (I (,8
mm- timmm.mm,e 2 (‘nt’m’nnl,minc 0 ‘0
mm l’cn,immn,’ n 17I tcxunnnes 2 IiI t,’pnunmmes 41. (II()mn.nnncs 3.96N,mnnunmnt’s I .95
I )ecmnmies t (‘6I nnmlccmmmnes .1)5
l),~tecmmnncs+ 3.82(‘~,, (.Tlnarunclcrmsi cs:
M=265 S=O.883
Prcssure-volunnrctest mrt 195 “F.I’rcssunre Relanive i)ensiiy
_,~psig vn’lun~c_~j~/m,~57 I 2 0.98))’) 645
100 2. PVT le.n’sm’ tiiiml (.‘orrelm.mti,m,ms 2.5. E.nerem’,re.c 101
5427 0.98495137 0.98974850 0.99474566 1.00004544 1.00114492 1.00384382 1.00994281 1.01594100 1.027831169 1.04563618 1.5)6943314 1.10552940 1.16602641 1.23282331 1.32421924 1.5077
642639635632
3136 27071.89 1.752.05 2.10 2.18 2.25
80.46 81.29 81.58 81.586.93 6.97 7.20 7.484.00 3.89 3.82 3.940.46 0.42 0.40 0.4t)1.48 1.32 1.25 1.210.44 0.38 0.34 0.320,64 1)55 0.50 (1.470.64 0.54 0.49 11.461.01 0.79 0.65 0.5721.71 21.24 21.01 20.930.749 0.733 1)725 0.723
2.39 2.59 2.97 2.97 1.84
80.72 78.31 72.58 55,72 6.68
8.17 9.38 12.14 18.15 19.364.20 4.99 6.74 12.73 28.400.42 0.49 (1.67 1.29 4.21
1.27 1.48 1.94 3.98 14.570.32 11.37 0.47 0.95 3,88t).48 0.53 1)66 1.33 5.14
0.46 0.51 (1.63 1.23 3.510.55 0.60 0.76 1.23 2.4121.13 21.79 23.36 28.52 44.770.729 0.752 0.806 0.984 1.545
Reservoiroil viscosity at 195 “F.I’resstnre,psig VmsL’umsmny. cp
640(1 - 11.605(,045 ((.58))
5689 i).56))5334 0.5404978 0.52))4566 (1.5004267 0.5(153556 0.520
2845 (1.5652 133 0.6 51)1422 1)725
711 0.895284 1.085
(1 t.4i2
‘i’wo slmuge sepuiratortest mnn 84 “F.I’rc’msmjrc 1st Sep. (014 ‘i’,,tal Gold Fm’rummatjon Smock‘lankp,~’rg SLI ISII) ~_S~i~t B Vmll’mctor Oil SCi6(X) 15)76 1358 1.678 (1.83540(1 1147 1342 I .645 0.8312(X) 1245 1361) 1.659 0.833
1474 474 1.759 (1.840
* Onnesmungcseparanimn(smock rank onuly).
Connipositionof separatorgas(n’nole%).I’res’ourc. psig (mill) ‘1(10 200 (mNimn,,gt’in I (,(, 1.58 1.12 1.24
(‘mmr(nmmmn ,Immmsj,k’ 2.27 2.311 2.36 2 24
Mm’itmam,c 84.1’) 82.Sti (OmIt 72.2)5
7.21 8,07 15 82 ‘).2)(
I’r~mmmiii,’ I II 1,7’) 4 65 6,9(1
lt,mnm,m,e 0.26 (1.31 ((5’) ((.86
millumimmnc (1.67 (1.8,5 1.11 2.9.5i—Pcmnmumm,e (1.13 (1.15 1)22 (1.83
n—Pcnuummnc t). 8 0.20 (1.26 I .2 I
llexumnes 0.13 0.17 0.21 1.06
Hepnmmncs+ 0. II 0. II) 0. 14 I . 17
MW 19.52 19.95 21)39 24.57SO 0.674 0.689 ((.704 0.848
Differential vaporisationat 195 °F.Pressure Oil Vol. Sol. Gas Compres.
pug factor SCFIbbh Factor5712 1.7985427 1.8075137 1.8154850 1.8254566 L834 1541 Ph3983 1.695 1261 0.11893556 1.614 1092 0.8653136 1.542 939 0.8452707 1.480 806 , 0.8392277 1.422 680 ‘ (1.8431849 1.370 564 0.8521415 1.320 451 0.873
-986 1.271 344 0.897566 1.222 238 0.931214 1.166 135 0.960
0 1.059 0 1.000ResidualOil SO= 0.844 (36.0°APt)
Compositionof liberatedgas(mole%)in differemmtialliberation test.2277 1849 1415 986 566 2t4 (1
1.59 1.32 15)2 0.75 0.44 0.17 1)11(1Pres.psig 3983 355N2 2.00 1.97C02 1.99 2.00Methane 77.72 79.37Ethane 6.95 6.90Propane 4,25 4,10i-Butane 0.60 0.52n-butane 2.03 1.701-Pentane 0.67 0.54n-Pentane 0.93 0.76Hexanes 0,97 0.78Heptaimes+ 1.89 1.36MW 23.39 22.38SG 0.807 0.773
* lliihttc pm’imii
2.2. Cmilculunte tire lrqtrid propamme content of time prcndumced guts in Exercise 2.1, with tIneoptimmrummnm separatorpressure.
2.3. lIre laboratorysluntmu is often evahumutedand smnoothmed by tine siiniemmsionhessfuncmion Y,definnedin Eq.(2.10). A plot of Y funnctionversuspressuireis expectedto yielul eitlner a straightlureor very slightly curved. What is theimplicit assummptionin tine aboveapproach’?
2.4. lIme resultsof consturnmlvolumimne depletiontest otn mm gas condeimsate sannple, as reported bymn lumborunmory.mire mrs follows:
102 2. PV1’ lest., mend Cm,rre(mriio,m.c
(I) lnniial reservoirpressure.(2) Sanurationpressureanindicatedmenmperammirc(mlew poinu).
2.5. Exercise,,
I) us mmmcmm- Immunen— I ‘e I(( muincsmm I’emmnammeI Ics,mm,csI lm’pnummmm’s
(cimumnes 0.8.5N,mmmmmn,’s ((.5))I ),‘cmnmm,’s ((.2’)
nmdccmmnc’. plums I .35
M,,tcculmnr wcmgtnn 25 5~ Mmnlcculzmr wcigtmm ________ 97 -
(1.43 0.42 0.41 0.40 0.40I - I I I .07 I .04 I .00 0.96
(1.17 (1.34 0.33 0.31 0.310.49 0.47 ((.45 0.38 0.39067 0.5’) ‘ (1.54 0.46 0.42
.2)) 1.11 0.96 (1.80 0.660.74 (1.62 0.48 0.38(1.40 0.3(1 0.20 0.12((.20 0. 14 0. 10 0.5)6((.90 0.47 0.30 0.16
24 I 22.8 22.0 21.4
178 176 169
Con’unpositionof reservoirgas.Comnmpnnnenn Mole’S’ Density.kg/nm’ Mol. WciglnmNiirm’gen 0.386Uartxmndnmi,imic 2.524
Methane 78.585Enhanc 7 029
Propane 3.360humane 0.440
in-Buuane 1.114
n-Pcnmanes 0.396nPeniane 0.502
Ilesanes 0.661 686.4 86tlcptanes 1.277 744.5 89
Octanes 0.902 761.6 102
Nonanes 0.588 775.9 118
Decanes 0.337 783.6 136Ijmmdecancs 0.345 789.4 147
Duxiccanes 0.256 798.0 162Tridccancs 0.245 814.2 176Tetradccanes 0.186 83(1.1 190
Pennaulccancs (1.163 811.6 204
Itcsmxiemmmncs 0.120 8348 21)5
lleptadecanes 0.098 83.5 2 2.52
Ocnmxh’anes 0.091 8360 246
Nunnadecamnes 0.065 846.1 260EicosanespIus (1.330 870.4 335
C,,, Propernies:MolecularWeigtnu=335 Density= 870.4kg/inn’ —
103
Comimpositnnnnunf m’ciuiaininrglluidsumn7ihumr. —~
(‘mmmnmpmmnnennsm~rlrmmcmmm’ns Renmmmmnmnnnnggums RemmmaimnisgmiiI____- ~mpm~’) (~L’S~
I Iyulrmmgcmm Smnltidc 0)8) 0.00Nimrmgcn (1.40 (1.05(‘mmmtMmn Diunxidc 2.51 0.90Meilmane 82.56 15.31Pitnumnc 7.42 3.79I’rm’pmmnm’ 3 315 4.39
humane (I .i 2 ((.82
mm ll,mmumnc I ((.1 2.90i Ik—inn;nmnec (1.12 1.57n’ t’enmnmnc ((.39 2.2(1}lcsmnmnes ((.41 4.1)4
I teplamnes (1.5’) 1(1.39Ocn,inu’s ((.28 9.23Nm’nammes ((II 7,90I)cL’mmmnes ((.06 4.84Unmlec,nmnes-
1,Ius (1.12 31.67 —
Molcumnlarweiglrl 2 (.2 It (.9C,,,,M,nleculuur weiglmi 67 . 204
Constantvolumedepletiontest resultsat 373.1 K (212°F). ______ ________
Pressure Curnutmmm,veGas. S~cInc Gravmiy Compres.sml’mmlmmyPmmct,mr Volumnreof
__________ Productnomn ofProducedGas of Producedg~s Rcii~gradeLiquid_~,__t~_.~___P691 J
9m0l’S~ -—
(I) 389.4 5632 1)00 0.923 1.037 ((.00(2) 373.0 5394 2.33 (1.923 1.017 000
32m.0 4640 - 9.91 0.879 0.956 3.58271,0 3915 19.49 (1.831 0912 6.52221.0 3191) 31.58 0.787 (187.5 8.61171.0 2465 45.63 0.758 (1.873121.0 1740 6I.23 0.737 (1.880 90971.0 lOIS 76.88 ((.732 0.914 8.41)
Compositionof producedgas.Pressure bar
psig321.04641)
271,1)39(5
22 n 0 171.5)319(1 2465
tlydrusgenSulfideNinrogenCarbont)iosideMemtnaneEmlnunnePr~~pane
0.00(1.392.44
79.587.053 35
0.0(1(1.392.48
81)577.5)23.30
0.00(1.402,49
81.537 043.28
121 0I 740
((.0(1((.402 5)1
82.787.23
0.00(14(12.5))
82.347.123.21
(mm) (‘alcumlurte tIne lwtr-plimmsc comsmpi’cssihility fuuctor of the cell content, and plot P/Z vs. theIotuul volumnre of produiccslgums.
)b) Dctcnnmnmre (he denrsity mmmd Commipm.nSitionof condensatephaseat Pr 71 bar by materialI)mm Immmmcecmulcunlat iomns.
2.5. lIne resultsoi aconstmuntvolummme depletiontest Imavebeenumsedto calculatetheequilibriumn’mutios by trnanermmml halanmceequnanromrs.TheK vs. P plot shows that theequilibrium ratio curvesof C3 ansi rC4 crmmss at mm pressurevmmlue. Is Ilmis physicallypossible?
2.6. An umndersmntumranedoil ns produced llnrouglr one intermediatestage separatorat 200 psiamumruh I 20 “F, witlr mu GOR = 600 SCF/STB. The stsck tank oil API=40°,and S
5=0.7. The
reservoirpressunremmmrd tcmsmperalureare 65(X) psiaand 210 °F,respectively.
(a) Estnnnnur(etIne out bubblepoinnt pressureat reservoirtemperature.
(b) Cuulcurlmntefire slumluc oil pressuregrmudiemrt inn Ilne reservoir.
(c) Wirurl will be tIme oil mind tunlal formnrationvolume fumctor whets thereservoirpressurefalls4(X) psi bekrw tIre bubblepoinrt.
104 2. I’Vl’ 7’.’.,r., moim! ( ‘mm,’rt’Imili,’,n.c lOS
2.7. Estimatethedensity of oil reported in Exercise2.1 at its btmbhlepoint. tnsitng hIre Katz-StandingandAlani-Kennedymethods. Comparetheresultswitlm the turemisuiredvmuitie.
2.8. Estimatetheviscosityof theaboveoil, andconmmpumreit witlr mIme mnmemrstmredv.mlunc.
2.9. A rich gasis producedandstahilisedin tlmree sepmmrationstages. ‘I’ime first stmmge sepmmrumloris at 1500 psiaand 140 “F with a producinggasto oil ratio of 80(X) SCF/S’i’l3. and tine gmusspecific gravity of 0.73. Thesecondstagesepmmratortemperatureis 100 “F. ‘rime producedcondensatespecificgravity is 0.760. E,stirtrate time reservoirgasmnrolectmluurwemglrl.
2. I0.Estimatethecompressibilityfactorof tIme gums conrdensmnte,reportedin Exen’cise 2.4, unt tIreinitial reservoircondition,umsinng tine gcncrmilusedclmmurl,
2.11 What is the minimum flow rateof mu guns witlm mm specific gravity of 0.6 to conntiirtmmntislyremovecondensatein a well with a wellheadpressureof 2(XIX) psium mmt 120 ‘F 7 TIre ttmbenominaldiameteris 4 in.
2.I2.The viscosity of a North Seagas conslensatcat 100 “F, ummrd 55(X) psmuu huts beernmeasuredequal to 0.0588cp. Thegasnmolecularweigint is 28.7. Estimmmatc tIne gmms viscosity attheaboveconditions,usingtheLeeeta!. correlation.
2.13.A gasreservoiris at 300 “F and 6()00 psia. TIne gums specnl’ic grurvnty is ((.6 mind lireconnatewatersalinity is 200,000ppm. Time first stageseparatorteirmpcrumtumremmmd pressuremure50°Fand 1500 psia.respectively.
(a) I-low muchliquid wateris producedby condcnsmutiomninn tine sepunrurlor.
(b) Is therea possibility of hydrateformuruutionurt time uiboveconrdmtiomns’!
2. l4.A leangasis at equilibrium with water at reservoirpressureof 6527 psnmm amrsl 279 “F.The watersalinity, WS, is 10%. Estitnate:(a) theanmoumntof dissolvedgumsinn wuiter, mind (t) tineisothermalcompressibilitycoefficient, (c) density, and(d) viscosity of the waler uut tire muboveconditions.
2.15.A sampleof the reservoiroil describedin Exercise2.6. is broumght into equilibrium witinequal volume of freshwater at the reservoircon(Iitions to simulmmte a water drive process.Estimatethe reductionof the oil bubble point pressureat the above tempermmnurredue to itscontactwith water.
3PHASE EQUILIBRIA
Productiomnof reservour tiumids often is mucconnipannnedwills vmmriationms inn conrnpm.nsition,pressureunnnsl Iemnrpermutsnre. ‘l’lris leadsnot only to ctranmgesin Ilurid properties,hunt also t(r formation ofnew piimmscs.or elimrninrmutuonmsf sunmnme of tire existingplnases.As clnunngeswithin time reservoirmireoflein quite slow, it is rcumsomruuhlcto mtssunnethmmt mill lIne co-cxitimngplnases,at any point in llrereservoir,utre ins equmililnriunmm. hlenrcc, tIne prohlemnr humsically redurcesto detenninationof tineequilibriumcommditiommsfor a imnullicomnmponmentsystem.
Fluid equnrlibrium,amnd lIme missocimmtedemngineerinngapplications,areof innterest inn mnmamuy fields,witlrwell estumblishnesl primrciples. l’imermnodynmunnics Irave 10mg beenn used to inrvestigate fluidequnlibrius, mmnd to reduce gcmiermml criterimu and Imuws to prmuctical tools. l’lris subject hasbeenextcmnsivelycoveredmm nrsmimnerouis text hooks amrd pumper collections. References l-2~prmsvidebuisrc tinermnmodynmuumnnic conceptsof Iltnid plmaseequnilil)ria. In tIns chmrpter. ccn’tmminr concepts.sIc finnit ions, mmnrd tlns—r’nnmmdynnumimnic reluit ions winch mmre fm.mndummmnemrtmmi to Humid equmiI iimria arereviewed. ‘l’lmese will brims tIre foundations for mull tIne methmmsuis used to dcternmninc fluidbehaviourin tine renrnmminingclmmnptersof tinsbook.
3.1 CRITERIA FOR EQUILIBRIUM
Iknr mu s’tmnscd sysnd’mnm, i.e. mnur( exclrumnngimng mmrumss winh ins sunrrusumnidinrgs, tIne cirmmngc msf syslennntotal energyF. stunred mrs (ire iintcrnnmml emnergy U, potemmtiunl energyE~,and kinetic energyFk. is
only duneto rammsferof treat Q, unmmd wom’k W, acrossits boundary asstatedby the first law oftlrem’mimodynuuinmics.
AI~A(I + Al)~+ Atuk = Q - W (3.1)
where tire lmemmtgnvcun to lIne syslemnn mmtud work dome try nIne sys(emnmInave beenassignedpositivesigns in tIne umboveequmltiomm. Wlnemr sucim a systenmiunndergoesann ideal but unreal reversible
106 .1 I9
uu.c” Fq,i,mi’, i,m .(. I. ( ‘rileria for Eqimilibrirmmmn 1 07
process, with no changesin the kinmetic ansI potential energy url unnnifusrmrr trcssumrc P uunrultemperatureT. thecombinedfirst andsecondlawsOf thermoulyimainnicsstunte.s 2. A = Ii — 1’S (3.12)
dU = TdS— PdV (3.2) ‘lIne tmnimnimnnmnmnr (iihts energy. mis the gemncralcriterion of equilibrium, is often used to derivew(nrking expressionns.‘l’lne Ilelnmrlnohl7. energyisray, Imowever, lead to simpler expressionsin
whereS andV arethesystementropy,andvolunnue respectively. ssnmeapplications,asdescribedin Sec(non5.3.
If the processis irreversible,theclmange of entropy is higher than tlnat in tire umhm,ve eqnmmmtionr. It should be notcsl that Eqs.(3.X-’)) are necessary.hut not sufficient conditions. Atleadingto. . equilibrium,time systemenergyis at its lowestvalueamongst all possibleconditions,including
all possible nminimmma occurrimmg in lIne calculatedGibbs furnmction. Hetnce,the equilibrium shoulddU <l’dS — PdV (3 1) he dcncrtniincd by semurching for line global nnininruinr value of Gibbs energy. Further
infornrruulion omr tIne Gibbsenergymmninimnuismution to idcnmlify equihihriunm conditions is given inSinceall realprocessesareirreversible,theabove immeqsnmnhity ,stunlcs limit f(nr un processunt cm(msslmmnrt Seclnons5.2S andV, U tendsto decreaseas tine stateof equnmlnhrmunnnrns mnpproactned.
Chemkal Po(eritia~Tlrernnmuxlynaismic relations can be emnployed to develop similar s(atenmnennts anmnomrgst ollrcr sImile
A clmsesl systemmmcounsisling (Sf mm nunmnhcr of pirases in contmrct, called a heterogeneousclosedproperties.systcnnn,canhe tremuteda.s us collectimnnm of unpen systems.wlnereeachphaseis consideredto bea
The GibbsenergyG, is definedas. lmommn(ngCneOUSone.cxclmmtngnnmgtrruusswills otiseropensystems.
Inn umnn openrsyslcnnr lIre clruummgcmnf Gibbs energycannothe expressedby Eq.(3.6) as the energy(iwhl—l’S (3.4)cmii) vmury by comnrponrcnrns of mIss’ systenurcrossimrgtIme plsmrscboundary. itence,
where II is tIre systementhmnlpy, N
si( = —Ssl’i’ + VdP X(m’JG /dmi,1
mm’,,,, sims, (3.13)11w Ii + PV (3.5)SubstutuntingEqs.(3.4-5)in (3.2-3),we obtain, wineren
1is tlne nuninsherof nnnolesof emmcln coimnponeint,with (he subscriptnj referring to all mole
imuinubersexceptnj, mmnnsl N is tine lolal nnunrsherof componentsin tIre system.dG�—SdT+VdP (3.6)
lIne dcrivumlivc of mmnr exlcmnsiveproperty relative to tIre numberof molesof any conmponentatwhich statesOnat,at constant1 andP theGibbsenergytendsto decreursemis remsl processes,aurd comrstmnnmtpressure,tcmmnperatunremmnnd otirer mole numbers,is definedasthepartial molar propertyremainsconstantin a reversibleprocess, of thrmtt connponemrt.TIre partimul inrolmmr Gibbsennergyis calledclnennicaipotential,I’i
(aG)~,� 0 (3.7)= (dG /~rr,)~
1.,, (3.14)
Tlrat is, in theequihibrimnmstale,whicln is tine ultitmmatecomrditnonof mmny rcmul process,lIme systenrn(Iihhs energyis tnminminnmunn,i.e., It cmunr he slnmswnr Ill, tlmunl,
=0 (3.11) (i, =(0G/)nr,)nm., =(4A/m~(nn,)~~,,,, ~ =(~UI~n~),~5
(3.15)
and SumhstitutinmgEq.(3.14) its Eq.(3.13), we obtumin,
(dm
G) r >0 (3.9) (IG = —SsiT+ VdP+~t~dn~ (3.16)
Simmii tar cxpressiomnsusing anotimer energy IC rio. tlmumt is, lire I Id nmmlnoltz. cuen gy. cans umlso bederivedastherequirementfor equilihriunnr. For mm clmrsedsysncnnncumnrsislinngmsf 0 plmumses,tIne mmhmnvc equnationcmun be written for eachphase.
‘l’Ime clruunrge of totmml U ihhs ennen gy md tIme closedsystennnis, tluereforc.
(~A),5
= 0 (3.10) 0 0 0
s1G= ~(—S),~dT+ ~(V)6
dP + ~( ~fi ,slnr, ),~ (3.17)and ,n-~l t=t 15=1 i
(amA) ~ > 0 (3.11) wlncre s denotesemmchplrase.
where,A is theIlelmholtz energydefinedas,
108 .5. Pinas’ Eqimilibrüm .5. 1. C’rmterma for Eqmmiiib~’iunm I 09
At uniform and constanttemperatureand pressureconditions, the general requirementof Integm’umtimrgEq.(3.25)at cotrstanttemnrperuuture,we obtain,equilibrium, givenby Eq.(3.8),leadsto,
I.’ — ~t’ = Ri’ ln(PiP”) (3.26)0
(dG)Tp = ~ )~= 0 (3.18) TIre mrhnve cqummlmorm prn~’ides mm simmnple relation for thectmmtngeof clsemnmical potentimml of a ptnreidcmml gums wlsemnits pressunreclsmmnrgesIronnn P0 to P isotlnernirally.
As the total systemis closedwith no chennicai reaction,the total number of nnroles of eumcincomponent remains constant within the system, , l_esvms (I genrerumlmscd Fq.(3.2(n) for milnlmhicumlioms 1mm neuml systemnus,by definimig ur “corrected
pressure”fummsction ‘f’. cmilled fim,m~w’iiv(escunpingtemndcncy)asfollsws,8
~ ~dn~)0= 0 i= I ,2,...N (3.191 o, -. p~’= RU tmm(i’, / I,”) (3.27)
ConsideringEqs.(3.18)and(3.19),andsincechangesin mole nummnbcrsof eaclrcmsrnpoiretrt mire wlsereIii” ummsml 1~°mime tine chmennicmmlpmnnentimmland fugacity of tIre commmponemmti, respectively,at mmarbitrary,we obtain, i’ctcmemucesImile.
For mum ideush gmms, linerefore, lIne fmmgmncmty is eqummi to its pressinre, and tIre fungacity of cads(I) — (2) (3) — (0) i= 1,2, ..N (3.20)I.h~ — h
1u = i~i = I” conmmponenstus eqummml to its parliuml pressure.
The abovegeneralrequirement,that is, the equality of chennical polenntnal of emucls coinrponemmt ‘lire rmmtio of furgmucity to pressureis defimnedmis tire fumgmmciiy coefmmciemnt~. For a tnntnlticompornentthroughoutall theco-existingphasesat equilibrium,beeotsmesmm practical emsgimseerinmgtool if (Ire systdmnn,chemicalpotentialcanbe relatedto nneasurahlequantities. TIns is mmclnieved try expm’essimnglIrechemicalpotential in termsof auxiliary thermodymnamnicfumnctions,sudsmis fugacilyor uudlivity. I = ~ 1)1’,) (3.28)
Fugacity winer’c ij is tIre nnmmnle I’rmmcluonm of tIns’ comiuponent i. Simmce mill systdtrmsbelnavemrs isIeuml guisesal
As relations amongst statepropertiesare independenrtof tire processpuntlr [21. Fq.(3.6) fmr mi s’env low pressnircs.reversibleprocesscan be used to expressthe Gibbs energy clnange. hence, tlnc cisenmicmul
wlmemr I’ ~ 0 (3.29)potential,
dG= —SdT+VdP (3.211 ‘t’ire depuurlureof fsnguucmlycoeffrciemutsfronrm unmrly us, tlmenefore,a nsmeursureof nomr—ideuulity of thesystemir.
For a pure substancepartial nn’nolar propertiesare the sanseas molar properties. Hence, tIre Writing Fsj.(3.27) for lIme connnpomnerml i, in emmch plnuise of a lmeterogemmeoussystem, wills mmlichangeof chemicalpotentialof thepuresubstancei, is givenby, referemscestmites unt lIre sumnnre temnperatumrc.tIne equnmulily of theclsemniicmul potential at csiuilihriumiur
givemr by Eq.(3.20).lemmds to.dIl
1=dg
1=—5
1dT+v~dP (3.22)
= ~(? =~~=- =t-~~ i=l,2,...N (330)whereg. sansiv aretIne moluurGibbscncm’gy, mmnm)immr cnunrmrpy mmmd mnroluir vmsluuminc respectively.‘l’lnuil us, tIns’ fmngumcily unl cmmclm d’nmmnpmnnncnst slmorilci he eulnmmml thmromrghmmain mmll the plummses mm mm
At constumnttemperurtureI Ire aboveeqummilion rcslumccsto, helenogeureonissysneiii mu ruinnit tin mmiii
(~11~‘~)T = Vi (3.23) Eq.(3.30) is mms genmemumi as Fq.(3.20) for rclmmtinrg the propertiesnil equnilibrumned phrmuses. In.Irowever, Inums I Inc umdvmmmrtumgeof cnnnploynng mu function wlr ichm can be mnrore easily umndcrstood mind
which leadsto a simpleexpressionfor thechemnnmcalpotentialof an ideal gums, witlr lIre pressure- evmulunmmtcsh as mm”corm’ectedpressure”. Fugmmcity dunn he immnuugineduus mu mmmeasureof tIre escmupinngvolume relationas, tcmrsicnucy of inmolectiles fronnn one pimumse to arm asljmucent plsmuse. I leurce, in a mnntnlticonnnponetnt
systems.ml the fumgacmtyof a commmpoirenrtin the two asljumcentphasesis the same,the two phasesPvj=RT (3.24) will he us cqinnlnbrismmrmwitlm no met Irmmnsferof mmioleculesfn’onss oneplsmmseto anollner.that is, ‘i’Iue tnmgumemly cumin he relumled rngom’ounsly to mmnemrsimrmmhle properties umsimrg tinemmmnodynmummnric
relumlnomsslIJ,
(~I.Lt‘~~)T= RT/ P (3.25)
lmm~,= -~ ~l’ ~ 1whereR istheuniversalgasconstant. R’ri’v L~~)— R’~fV dV—inZ i=l.2,...N (3.31)
r.v,,,,,,
110 :1 i’h,,,ce Lqmmi/nh, i(i 3 I ( riU’rul f’,r Eqmmiiihrimom,Ill
lmm~= ~—6.5x 10²
p 7.~x l04
P2/2l:~= —0.6875
m~=O.5028
f=m(o<i’=5.028 MPui
Activity
Fntlner of ft’ or 1°uslayhe selectedmumhi(rmnrily asthe referencestaleproperty in Eq.(3.27). Thefurgacity is mostoften thechosenreferenceproperly. l’lre substancei. aspure or in a mixture,mit umnry pmc.ssmnrccummn he selectedmis lIre rcferemucestumle. ‘line nmmly limunitation for selecting tInerel’erennccsImile is IlnumI its lcnmipcrmmtmmrc mmntisl be equnmml Ims (hue equilibrium temperature. It i.s oftenseleunedmus (he pumme sumhstumnce mit tIre systems) totmsl prcssumrc,or at its vapour pressunre,at lInetinesumml n mg IC mnmpemmmii) re- A ~inm95Cr u’lrmnmcc of nIne mc F’re,scesImile fmncihitaies the application ofthennimmsdyn;mumnncru’Immlimnnns Inn cirgilucs’rinrg prolslensis.
Inc n mit nun (ni tIne fsngmms’nly mm I Inc s(mmte of innIciest to tlnmut mm (Ire referenicestateis called (Inc activity.,
(3.36)
‘lIme mdtnvity cmmn, tlmerefore.he connsmdcrcd asmu meassureof fugacity contribution oractivenessofmu conapommentin a nnixlnnme.
I, = u,f,” (3.37)
II is m intuit m ye (hrumt time fungurcily of cumuli cmnmnnponmenrl slnoumId dependon its concentrationin lInemumxl tine. I Icmice, Ilne unbmnvc eqummulmmmi) stmggcst5 Ihiurt the mmcfi vity slsounld be closely reluutedto thes’omscu’mnlnat ion. ‘lIne rurl nun of mmcl r vity lo commccrnlrmntiomn, often in mole fractions, is called tire(I(tIu’,13’ (‘oeffjcne,n( (—~,
(-), = c/s~ (3.38)
llcmscc,
= (~x,b,” (3.39)
lime mmclivnty c’mncffmcmcmmt is mu very umsefiul mmumxilimum’y functions to describeliquid phasesin phaseCdli nil m hr idunn duntcum I mit ions. Estenisi~ sttidies lnmuve been conmiucted ho relate fine activityduel I rcmenit hr millrer I lncnmmnmrshymnmmnmnic funnnctiotrs, munch numnncrosnsnsrodelshave been reported to(helenmnnmmne ml vmiltne for liqunid connrnonmetmlsIll.
3.2 EQUILIBRIuM RATIo
l,et urs :or~smdertwo ptmumsesof liqumisl. t.. murrul vmupounr, V. at equilibrium, Eq.(3.3O) for sucha,systenmm is.
i’ =i’~ i=h,2,.,,N
whereV is thetotal volume,n~is time nummmherof mrrolcs of comnspommenrl i. mmml Z, is tIre nrmixtumieconspressihilityfactorgiven by,
Z=t5
V/nuR’l’ (3.32)
whsere,n, us the total nutimber of moles in themixture with N compommemrls,
(3.33)
Eq.(3.3I) simply yields the fugacity coefficient, provided nhnmut the vmulunc of (01’ I dir, )m v
over tine whole rangeof tIre imntcgra(e,i.e. V mul P, Or V= infiruily urn P=0 , curms he evumlmmmutcd. ‘thisis urn ;mcimmevumhlctursk,wills msn muuccptmmhlecmngmneernnsgmms’cmmrmmcy, using ss’nmnr-ennnjnirmcmil s’nlmiumnionrsof stmutc mis describedins ( ‘Iumspler 4.
Theunrslerof Integral moms mmmddifferenntnmutnonmrs Eq.(1.1 I ) nnmmy he rmitcrclnuuurgcsl,resumlninng mu.
In~= ~IJ 1~ — ~dVl — In Z i= I ,2,...N (3.34)dn,L ~ ~.R’U V) Jrvn,,,
line immtegral is theresidsnal,definedastheactunal property mmriniusthat calculmutedby musstrnruinrgtIneideal gas behaviour. i-Ielmholtz energy divided by (RT), The aslvmunlage of Ire mmhove frmrmn istlsunt tIne immtegrationmImmus to bedoneonly omnce,usnrstmrll propertieseuro Os’ cmmlcunimmtcul mis mierivuutivesof (lie residual 1 Ichmnslsuihtz fumnctiois 131. l’Irc useof dcsciitiimig lIre tnchrmmvnunmmr mn! mm systemnrbyevmmlummtmng its Iiclnmrholtz energy, in preferetrcc to the Gibbs cnnergy, will lie disctnsscdinnSection 5.3.
‘the fm.ngacmty coefficient of mm pure compoumnd cumin he dclernnrinncsl by inncorpormmlimmg Fq.(3.32)into thegeneralexpressionfor the fugacitycoefficiemmt,Eq.(3.3I),
ln~= J(~_~)dP= (Z — I) - lnZ + - P)slv (3.35)
wIrem’e v is tIre msroimur vunluimme. Depcmrdmngomm tIme fornnr of tIre eqummulions of stumle,ommc nil lIme uulnmsvetwo cxptcssiomssfor tire fugacity canbe sinmrpler to usc.
F.~aoupIe.5.1.
The connpressihiliiyfactor of a pure gums at 290 K cain he rctmmied10 ins ~ us,
Z=l—6.5x10²
P—7.5xl04
P2
P<15 MPmm
wbmere P is in MPa. Calculatethe gasfugaciny an 10 MPa.
.So(m,(join:
Substitutingthe aboveexpressionof Z in Eq.(3.35),we obtains,
Inm~= ~(~_!)dP = j(_6.5 x lO~2P
I, / 1,”
AIipiymnsg Eq.) .3.28) to hurtin phmumses,we ohstmnin:
I,’ =x,P~r
(3.40)
i=t,2,.,,N (3.41)
112 3. P/nose Equilibria .5.2. Equilibrium Ratio
fVyp4~v i=l,2....N
Hence,
i=l,2,...N
where Ki is called tlse equilibrium ratio and is defused mus the rustio of irsole frmuctimnir of
component i in the vapour phase Yi~ to that in the liquid phase Xi. A general mmmd rigorousapproach to determine tine fugacity coefficient of a componentin both phase.cfromrs volumetricinformation,usinganequationof state,is givenin Clmapter4.
The lack of successof someequationsof state in describing tIre volsuirmetric helnuuviour ofcomplexliquid mixtureshasleadto theuseof tImeactivity conceptto determrminefugacilies in tIreliquid phase. Using Eq.(3.37),insteadof Eq.(3.28),to obtain the fugumcity of cmucln conmpouremrtin theliquid phase,we obtain,
K1
=O1
f~°/P~ (344)
The aboveapproach,known asthe “split” mcthmod, cmun give relimuble re.suill.s fmrr sysleunis willsvapourandliquid phasepropertiesfar apart. Thesplit imnetlsod proposedby Clnmmo-Seadcr141hasbeenextensivelyusedin theoil industry to predict the phasebehumviour of gmms-oil systenrs,particularlyat transferline conditions. At Imigh pressures,especiallycloseto critical conditions,wheretheliquid andvapourphasesbehavesininilarly, themmhove approacisis not recoumnimiended.Phasebehaviourmodelswhich usean equationof statefor tIre gasuumnd anactivity model for lineliquid phasemay alsomiss the retrogradebehaviourof gascondensmutesystemrms. In getrermul,theuseof a singleequationofstateto describeall fluid plsumsesslmouldhe adequmutcin mulnnost mullpetroleum engineeringproblems, as described usChrupter 4.
The fugacity can alsobe evaluatedby simple methods,employing limiting musstmnmptions.huntstill usefulfor engineeringpurposesat a varietyof conditions. An attractiveursstmnunpliomnis tlruutthe fugacity of eachcomponent in mm’mixture is limnearly proportionmul to ils comncennlrmution. TInsassumption,knownas tlme ideal solution, is gemrerallyvalid for immixtuires coimn
1moscdof similar
components,or for dilute solutions,
Ij = ~ . (345)
wisereXj andC~aretheproportionalityconstantandtheconcenlrmulionof tIne comrrpomnenti in themixture, respectively.Dependingon thedefinition of tIne proportionality comrstmmnl. two widelyused methods,Raoult’s law and Henry’s law, will result.
Raou!t’s Law
First, consider thecase that Eq.(3.4.S)is valid over tIre whole rangeof cotncemslrmution,includingC~=t.i.e. pure component, the proportionality constant slsould, therefore, he equuml to thefugacityof componenti, asa puresubstance,
f=zf,,,,~ (3.46)
wherethe concentration is expressedby thenmrole fruiclion ~i
The above equation is known as tIre Lewis fugmucity runle, Cmmnnnpumriimg Fu1
.(3.46) witlnEq.(3.39), it can be concludedtlmat the Lewis nile is valid for mixtures witbm all activitycoefficientsequalto unity.
Eu’anmple 3.2:
(‘mmlcuulanc eqnuilihrimnumm rmutios of (‘I, mmmrsl nC10 in a vapour-liquid mixture at 344.3K. and6.895MPun. musing Rmiouult’s lass’.
Solnitmon:
The esluilihriunnn rmntmos are calculuited fronru Eq.(3.5I). where tlne vapour pressure at344.3 K is estmnrmmiedunsunglIne t_ee-Keslerequmaiiomn, Eq.(1.10)), simsnilar to Example 1.1
line e,stnmnimuledvunluic of rnretinmmmse vmmtiouur pressure,11681 Mi’a, by ilne Lee-Kcsler equnafionis mom micceplunhte. ‘tIme prevaihning temmmperummuureol 344.3 K is well above the methaneu imicuml memmmperummunre of 190.56K. uunnul pure mneiiianrc cmmnmmot exist as liquid rut thisicimipermuiuume. I Icuuce, tIne cmnlcmmlmmied vmmimour pressureby ulme Lee-Kesherequation,or ansyonhner vzmpour pressurrecorrelatioms, is an unrreal value mmusd just an extrapolation of timevapour pressurecurve above tIre criticmuh temperature. Sinssple correlations,such as tIreCox chart,Figure 1.3, gennermully provide more reasonablevaluescomparing with cousmplex
(3.42)
(3.43)
113
For vapotnrand liquid phasesat equilibrium Eqs.(3.40)and(3.46) leurdto,
= xf,~,,,,,, (3.47)
Asstunnminsgthsmmt time vmmpmrunris mini irlemul guns, we obtuninn,
= P (3.48)
‘t’lre dIed of pressuureon fungmmcnnyof mu eonslensedpimaseat low pressm.rreis small III anti can hetucgledlcd. l’lnc fugmucity oh mu ptmm’e liqn.nnd rut krw pressunrecan, therefore,beassuunnredcqtnmml to itsfugmucutyat (Ire suuturuutu(rmspressunre.‘line funguucmtiesof sumlurnatesivapour andliqumid are cqummml, unstime Iwo plrutsesumre mit equmnlihrnunmum. Funrtinermore,lhc vmupouurfugaciiy at low pressurecanm bemussumrrcdequutl to ils pressure. 1-lenee,the hmqumisl ftngacity can be tmukeii equmuul to tine vapounrpresstmreof time stubstancemit tine prevaihinrgtemperature,
~I. —
pure — u (3 49)
wiscrcPt” us tlme suutunrmutmonm(vmrpounr)pressureof the psure compounsl, i.
SuhstituiingEqs.(3.48)and(3.49) into Eq.(3.47),we obtain,
y~P=x~P~ (3.50)
tsr
K=P~/P (3.51)
Eq.(3.5I) us knowus mrs Ruuoult’s lmnw. Consideringthe above assummmptions, it is only valid atlow pressure for .simmrple unmixtumre.s,
(.~onmpmmnenm_~__ I’’ ° l”,N-lt’a
C’ 7.68167 (.757116 I 16111.1)7nrC,, -4.25215 -5.0053k 0.0025552
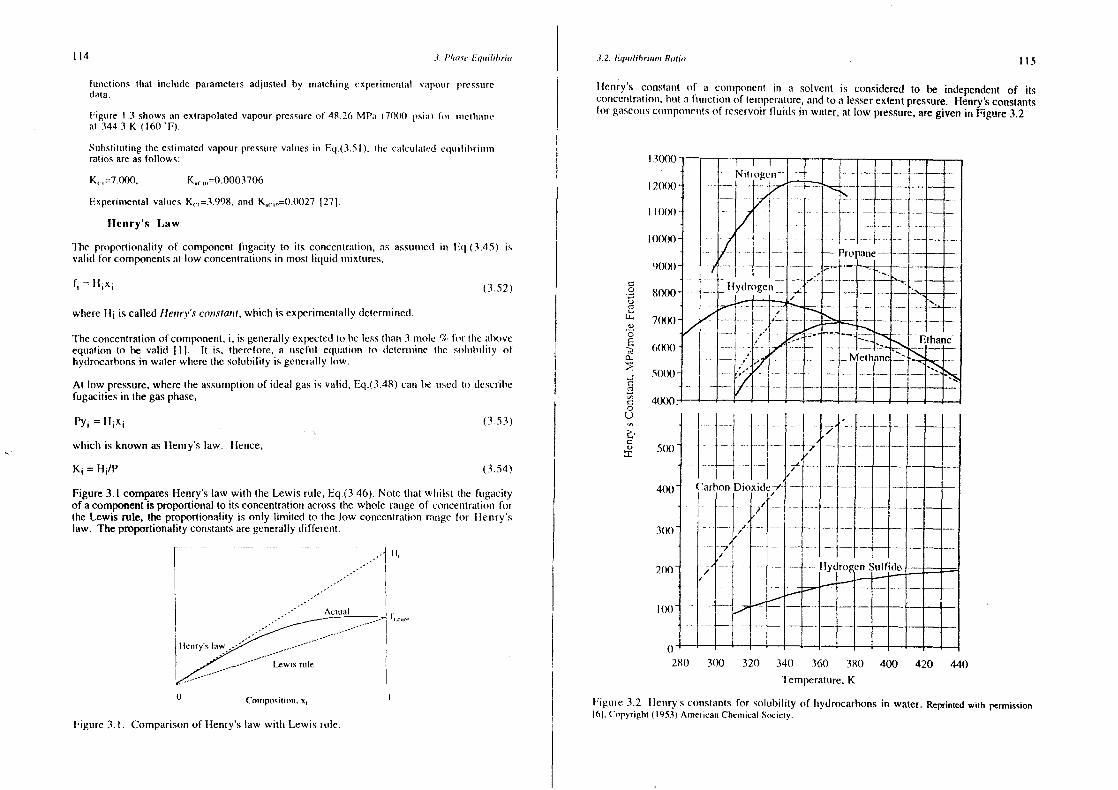
114 .5 l’fmosm’ Eqm,i!il,ria
fumnctions that mnclunde parainmeters adjusted by mumtclning experinuenmtmml s’uupouur prcssumredata.
Figumre 1.3 showsmuir extrapolatedvapour pressureof 48.26 MPmn (7000 psimi) for nmrcttrmmmreat 344.3 K (160’F),
Suibstitsitingthe estinratedvapour pressurevalumes inn Eq.(111.51). tIne cmmlculancdcqmrilihriumnnratios areasfollows:
K,.=7.000, Knci,,=0.0003706
Experinrentalvalues K,.=3.998, and K~(.,,=0.00271271.
Henry’s Law‘I’he proportionality of componentfumguucity to its comrcentrmution,as assuimmncd ins Eq.(3.45) is
valid for componentsmmt low concentrationsin mostliquid msmrxtures,
l’m = H1
X (3.52)
where I1~is called flenrv’.s co,n.cta?i/, whichis experimentallyde(ernmnnned.
The concentration of component.i, is generally expectedlobe lesstlrmmnm 3 tniolc ‘7
e for tIre muhoveequation to be valid Ill. It is, therefore,a tmsefuml equnmulion Its slcternnninc tire sotumhility ofhydrocarbonsin wmuterwheretime smlsnhilily is gemnermullylow.
At low pressure,where the assumptionof idealgasis valisl, Eq.(3.48)can he unsesl to describefugacitiesin thegasphase.
Py~= iI,x1
(3.53)
which is known as Henry’s law. Hence.
K1
=H~/P (3.54)
Figure 3.1 comparesHenry’s law with the Lewis rule, Eq.(3.46).Note that wlnilst the fiuguncityof a component is proportional to its concentration across the whole rmmnge of comicenmtration forthe Lewis rule, theproportionality is only linmited to the low concentration ramnge for ilenry’slaw. The proportionality constantsare generally different.
Counnpositimnn,x,
.1.2. 6’qmmmlil,riunn Ratio . I I 5
Ilenmry’s comrstmmmmt of mu coumnponenl in a solvent is considered to he independent of itseonccnrtrumtionr.html a fuinctionr of tenrrpcratunre,andto a lesserextemntpressure.Henry’s constantsfor gmmseouiscomnrponrenrtsof reservoirhluids inn water,at low pressure,aregiven in Figure3.2
cm0cmaU-(5
0E
cma
cm0
ycm5)
13000
12(800
110(8)
l(X)00-
9(88)-
8000’
70(X)’
.~rur~cn~
- Hydrogen .~
T1~
-— Pro mumme—
280 3(8) 320 340 360 380 400 420 440
Temperature,K
Figunre3.2 llennry’s constantsfor soltuhility of hydrocarbons in water. Reprinned winh permission
161. Copyright (1953)AirrericanChemunicalSociemy.
/
//
60(8)
5(88)
4(8)0.
F
— . Methane
thane
It,
Lewis rule
Figure 3.1. Comparisonof Henry’s law with Lesvisrule.
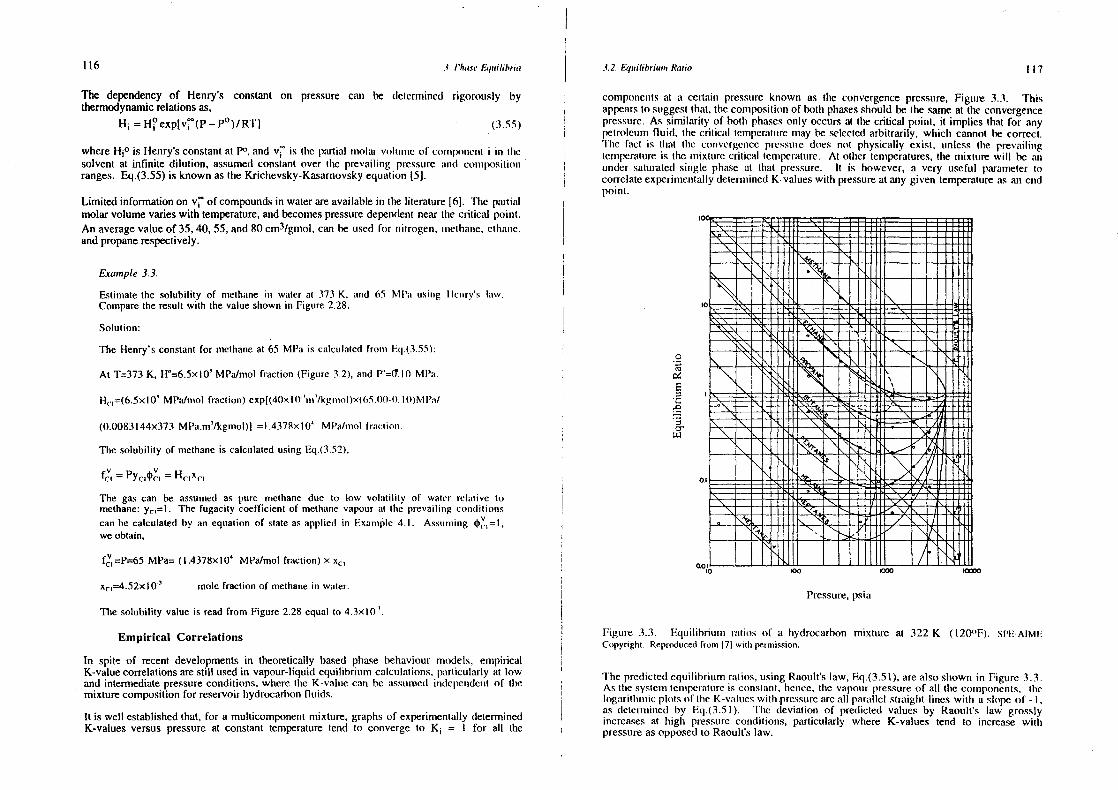
116 .~ l’ha.se Equilibria
The dependencyof Henry’s constant on pressure can be determined rigorously bythermodynamicrelationsas,
= H~’exp[vr(P—P°)/RT] (3.55)
whereHm°is Henry’sconstantat ~0, and v’ is tIre puurlial nmolar vmniuirmc of comnulxrtneml( i ins mIscsolvent at infinite dilution, assumedconstantover time prevailing pressureuunnd comnspositioumranges.Eq.(3.55)is knownastheKrichevsky-Kasarnovskyequationt51.
Limited informationon v~ofcompoundsin waterareavailablein theliterature[61. The partialmolarvolume varieswith temperature,andbecomespressuredependentnear time critical point.An averagevalueof 35, 40, 55, and80cm
3/gmol,can be usedfor nitrogen,nurethuitne,ctlnamse.
andpropanerespectively.
.C 2. Eqmmilibrinmnm Ratio
componentsat a certain pressureknown as the convergencepressure.Figuure 3.3, Thisappemursto suggestthat, theconspositionof both phasesshouldbethe sameat the convergencepressumre.As similarity of hotim phasesonly occursat (he critical point, it implies that for anypetroleumfluid, thecritical temperattmremay be selectedarbitrarily, which cannothe correct.‘lire fact us thnat tine comrvergence prcssuume does not pimysically exist, unless the prevailingtennperahuureis the nsnixture critical Iensperature.At other tensperatures,the nnixture will be anunder satunatedsingle phaseat that pressure. It is however, a very useful parametertocon-elateexperimentallydeterminedK-valueswith pressureat anygiven temperatureasan endpoint.
Example 3.3.
Estimate the solubihity of methaneus water at 373 K, amid 65 MPa using ilemury’s Iumw.Comparethe resultwith thevalueshownin Figure 2.28.
Solution:
The Henry’s constantfor methamseat 65 MPa is calculatedfromnr Eq.(3.55):
At T=373K, H0=6.5xi03
MPa/mol fraction (Figure 3.2), andV’=~.IOMPa.
Hm.m(6.5X10’ MPa/mol frmmciion) exp[(40XhO‘uns’/kgurrol)x) 65.t)0-O.I 0)M Pmm/
(0.0083144x373 MPa.m5
/kgmol)J= I .4378xI o~MPaimoI fraci iomn.
The solubility of methaneis calculatedusimrg Eq.(3.52),
1~m~= l’Ycu4~i=
The gascan be assumedas pure methane due to low volatility of water relative tomethane:Ycn=’’ The fugacity coefficient of methanevapour nit the prevailing conditionscanbe calculatedby an equation of stateasappliesh in Example4.1. Assunniung ~we obtain,
f~=P=65MPa=(h.4378x104
MPa/mol fraction) x
io~ mole fraction of rrsethanein water.
The solubility valueis readfrom Figure 2.28 equal to 4.3xlO’.
Empirical Correlations
In spite of recent developmentsin theoretically basedphasebehaviourmodels, empiricalK-valuecorrelationsarestill usedin vapour-liquidequilibrium calcuilmulions, pmurticularly at lowand intermediatepressunreconditions,where the K-valuecams he mrssumssedindependentof tIremixturecompositionfor reservoirisydrocarhonliumisis.
It is well establishedthat, for a multicomponentmixture,graphsof experimentallydetemminedK-valuesversus pressureat constant temperaturetend to converge to K
1= I for all the
me
—~—
~\1lffl1~
}~J~t{1~
~-. -r~’JJI4--~--.1-~—~fl1~s,_ —
—~ —
~‘ EEE~ -~.
-~.. S
--.ii~“
-- -
~~
0’
ac
~~I1ll~Ii~NJi! ~
‘~\1H}~J---~ ~
—~—-~ f_
~L~E ~
~
—“
N-~
—-.~E -
‘~,
I
.7
~::,
—‘- -
Figure 3.3. Equilibriunmim mmutio.s of a hydrocarbon mixture at 322 K (120°F).SPE-AIMECopyrigbni. Reproduced fnnnn 171 winlr permission.
l’he preslictedequmilibriuurn ruttios,usiung Raoult’s law, Eq.(3.5l).arealsoshownin Figure 3.3.As thesystemrmtenrpermmlurcis conss(usnt,hence,tire vapoumr pressureof all (Ire components, thelmsgumri(lnmnrncplmrts of tIne K—v:ulumc.s witis pressureareall parmullel straight lines witis a slopeof — I,as deterrmmimmed by Eq.(3.5l). lIne deviationsof predictedvalues by Raoult’x law grosslyincreasesat high pressurecommditions, particularly where K-values tend to increase withpressureasopposedto Raoult’s law.
17
0a
E
cm’00
‘0 mO -
Pressure,psia
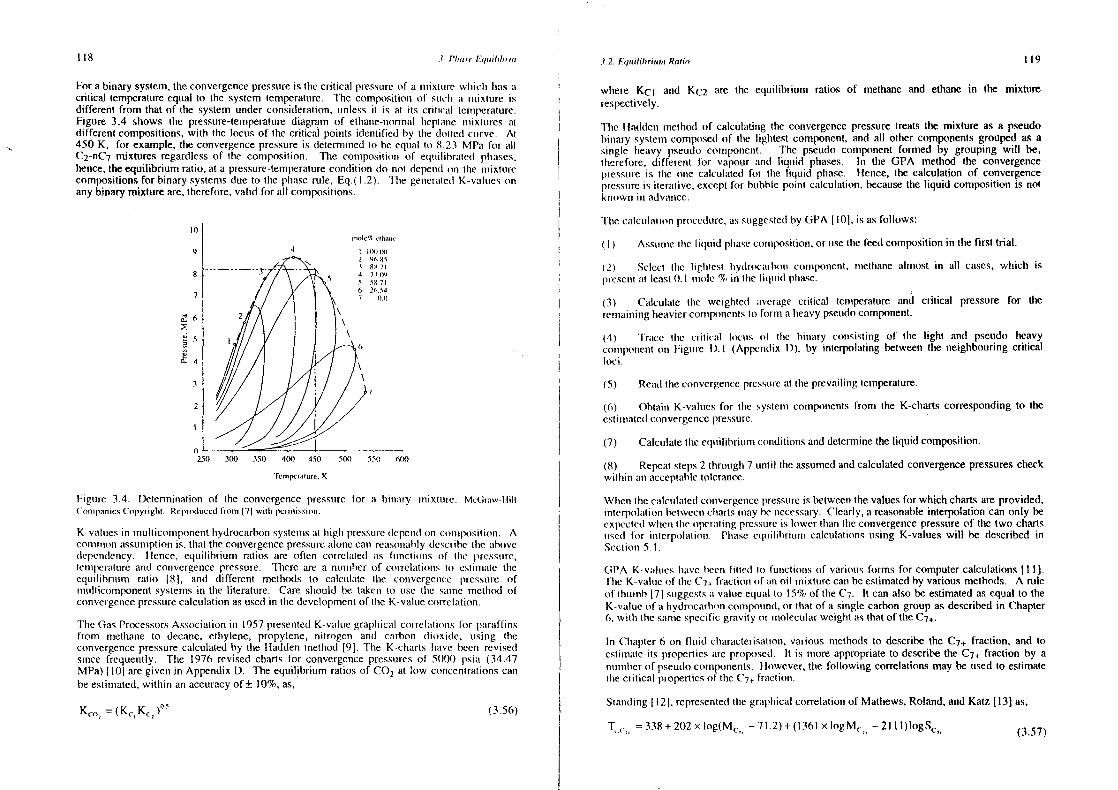
118 1 P/nameLiinninb~ma .5.2. b.qnuihhriumRatio 119
Fora binary system,theconvergencepressureis tirecritical pressureof a nrnixltnre wlniclr lrmrs mucritical temperatureequal to the systemtenmperature. The compositioim of sunclr us umuixture isdifferent from that of the systemunder consideration,utiless it is at its critical teursperaluire.Figure 3.4 shows the pressure-temperawrediagr~mof ethane-nrormmsiIreplmmnie nnnixlumres mitdifferentcompositions,with the locusof thecritical points identilned by the slotted cturve. At450 K, for example,theconvergencepressureis deterrsninedto he equal to 8.23 MPmr for allC
2-nC
7mixtures regardlessof the composition. The composition of equnilibrated phases.
hence,theequilibrium ratio, at a pressure-temperaturecondition do not slepetidon the irnixtuiccompositionsfor binary systemsdue to theplnaserule, Eq.(I .2). ‘lIme genmerumlesl K-vuulimcs nmanybinarymixture are,therefore,valid for all compositions.
Figure 3.4. Detemmination of the convergencepressurefor a hinmurry mixtunme. McGraw-IIIII(‘oummpmunicsCm~pyriglnn. Reproducedfrom 171 wimh perunnissionn.
K-vmmlm.mcs in multiconssponenthydrocarbonsystemsmut inigh pressuredepenrslon comnmpositionr. Acomrmmonassumptionis, thuut theconvergencepressurealonecan remrsomsmuhly describetIme mmhovcdepcnsdency. I knee, equilibrium ratios are often correlmuned mus ftunctioin.s usf lIre pressure,teimuperaturreand convergemmcepressure. Tlnerc are a nummsherof corrclmutioiis lun cslinsmuu(e timecquunlihriunm ratio 181, and different methods to calcunlate the convergetseepressunre ofmulticomponentsystemsin the literature. Care slsould he takcnn to usethe smmnne metlsodofconvergencepressurecalculationasusedin thedevelopmentof theK-valumecorrelmrtiun.
TIme GasProcessorsAssocimmtionits 1957 presentedK-valuegraplsicmul corrclmutiomis for1
nmrraffirs,sfrom metlnane to decanme, ethylene, propylene, nitrogen ansI carbon dimnxisie, using tImeconvergencepressurecalculatedby the 1-laddennnetlmod [9]. The K-charts lrmsve been revisedsince frequently. The 1976 revised cimarts for convergencepressuresof 50(8) psiut (34.47MPa)[10] aregiven in AppendixD. Theequilibrium ratios of CO
2at low concentrationscanm
beestinmated,within ann accuracyof±10%,as,
= (KC,KC.5
)03 (3.56)
wisere KCI and KC2 are the equilibrium ratios of methane and ethanein the mixturerespectively.
l’Ise Iladden rtrethod of calculating the convergencepressuretreatsthe mixture as a pseudohiisary system composedof the Iiglrtest component,and all other componentsgroupedas asimrgle iseavy pseudocomnipomrent. The pseudocomponentformed by grouping will be,therefore,different for vapour mund liquid phases. Iii (Ire GPA method the convergencepressureis the (Sine calculatedfor the liquid phase. hence,the calculation of convergencepressureis iterative,exceptfor bubblepoint calculation,becausethe liquid compositionis notknrown in aslvance.
‘lIre cuilcuilmution proceduure,as sumggestcdby GPA 1101. is asfollows:
(I) Assunnmnettse lis1
unid plrasecotmsposition,or usetIne feedcotnmposition in thefirst trial.
(2) Select tIne liglutest luydrmst’umrhotn compssmlent.mmrcttrane alnmrost in all cases., which is
presemrtumt least0. I nuole % in One liqunid plma.se.
(3) Cmslculmrte the weighted urvermuge critical temperature and critical pressunre for tine
remaining hemsvier commrponents to form a heavy pseudo component.
(4) ‘Irmuce tIre crinit-mul locums of lIne hinmuury consisting of tIre light and pseudo heavyconnuponent on Figumic 1). I (Appendix I)), by interpolating betweenthe neighbouringcriticalloci.
(5) Readtheconvergeumccpressunremut time prevaiiinmgtensiperature.
((r) Obtain K-vmultmcs for tlue systenrcomponentsfrom the K-charts correspondingto theestimnrmiteslconvergencepressure.
(7) Calculateline equilibriumconditionsanddeterminetheliquid composition.
(8) Repeatsteps2 throsngh7 uumtil theassumedandcalculatedconvergencepressurescheckwi(hin anacceptabletolerance.
Winen tIre calculalcslconsvcrgennccpressureis hetweemrlime valuesfor which chartsareprovided,interpolmutioms betweencharts uurmuy he tueccssmmry. Clearly,areasonableinterpolationcanonly becxpcctedwlrens tine rpcmumting pressure is lower Iluans (Ire convergence pressure of lire two chartsumscml for interpolmmtioim. Plsmsseeqmnilibriunnr calculatnomrsusing K—values will be describedinSections 5.1.
(it’A K-vuulnnes ismuve been fitted to funsclionrs of vmmrioums forms for computer calculations 111.1.‘rIme K-valumc of tIre C
71fraction (nf mm oil irsixture earn beestimatedby variousmethods. A rule
of thumb[7~smuggests mu vahime equmul to 15%of time C7
. It can also be estimated as equal to theK-value of a Imydrocuirhonconspounmmd,or (hal of a single carbon group as described in Chapter6, wills tIre smmnne specific gravity or molecunlar weight as that of the C
7~.
In Clmmrp(er 6 on fluid clsaracterisation,variousnsethodsto describethe C74
fraction, and toeslimmmuntc its propertiesare proposesl. It is nmsoreappropriateto describethe C
74fraction by a
nunnrher of pseudo c(rtrrp(rnents. However, tIre following correlations may be used to estimate
nIne critical properties of theC7~
frmsction.
Standing[121.representedtIre grmmphical correlationof Mathews,Roland,andKatz. [13] as,
4
no
9
8
7
0.4
,,monesn cilia,,,-
mlii me2 ‘5585.5 887!4 7709S Ssin(, 25.547 00
300 350 400 451)
Tcuu,pcranucc.K
500 550 1500
= 338÷202x log(M~, —71 .2)+ (1361x IogM~ —211 I)1ogS~ (357)
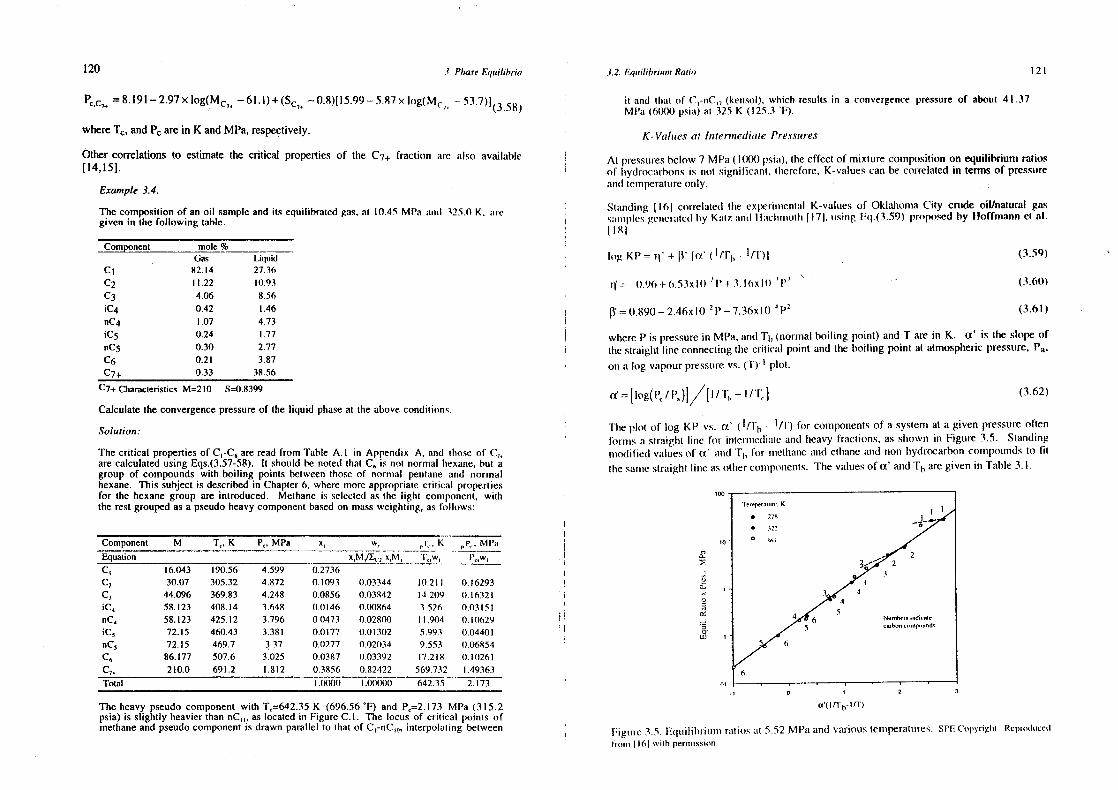
120 3. P/mace Equilibria 3.2. Eqnmilibriuuun Ratio 121
= 8.191—2.97xlog(M~,—61.l)’s-(S~5—0.8)[15.99—5.87 x log(M
5- —
whereT~,andP~arein K andMPa,respectively.
Othercorrelationsto estimate the critical properties of the C7
÷fraction arc also available[14,151.
Example 3.4.
The compositionof an oil sampleand its equilibratedguns. at 10.45 MPa armul 125.0 K. miregivenin the following table.
Component mole %
Gas LiquidCI 82.14 27.36C2 11.22 10.93C3 4.06 8.561C4 0.42 1.46nC4 1.07 4.73IC
50.24 1.77
nC5 0.30 2.77C6 0.21 3.87C~÷ 0.33 38.56
C74
CharacteristicsM=210 S=0.8399
Calculatetheconvergencepressureof the liquid phaseat theaboveconditions.
Solution:
The critical propertiesof C1
-C5
areread from Table A.l in Appendix A, and mlnsmse of C~,are calculatedusing Eqs.(3.57-58). It should benoted ihat C
5is not msormal Inexane,hut a
group of compoundswith boiling points betweenthoseof normal pentanemumrd msormalhexane. This subjectis describedin Chapter6, wheremore appropriatecritical propertiesfor the hexanegroup are introduced. Methaneis selectedas the light conntr(rnent.withthe restgroupedasa pseudoheavycomponentbasedon massweighting,asfollows:
Component M T,, K P~.MI’a s w, r K
1,.,w,MPmu
1’~,’x,I2quation xM,I~.2
x,M,C
116.043 190.56 4.599 (1.2736
.
C2
30.07 305.32 4.872 0.1093 0.03344 1(1.211 0.16293
C3
44.096 369.83 4.248 0.0856 0.1)3842 14.209 0.16321IC
458.123 408.14 3.648 0.0146 0.0(1864 3.526 0.03151
nC4
58.123 425.12 3.796 0.0473 1)02801) 11.904 t).I(s629IC
372.15 460.43 3.381 0.0177 0.01302 5.993 0.04401
nmC, 72.15 469.7 3.37 0.0277 0.021)34 9.553 0.06854
C4
86.177 507.6 3.025 0.0387 0.03392 17.218 (1.10261C
752t0.0 691.2 1.812 0.31156 0.82422 569.732 1.49363
Total 1.0000 .00000 642.35 2.173
The heavy pseudocomponentwith T~~642.35K (696.56‘F) and P,=2.l73 MPa (315.2psia)is slightly heavierthan flCn,. aslocated in FigureCI. The locus of critical poimsts ofmethaneand pseudocomponentis drawnparallel to thatof Cn’nCni. interpolatingbetween
it and tinat of C-nC,7
(kensol), wInch resultsin a coirvergencepressureof about 41.37
MPa (6(8)0psimu) at 325 K (125.3’l).
K- Value.s at luter,nediate Pressures
At pressunresbelow7 MPa (1(8)0psium), theeffect of mixturecourrpositionon equilibrium ratiosof isydrocumnhonssis not significant,mlmercfore, K-valuescan be correlatedin terms of pressureand temperaltureonmly.
Stuundimrg 1161 correlutted (he experinusemstuml K-valuues of OklahomsmaCity crudeoil/natural gassuuummplcsgcmncuumlcdIry Kunli, uunr(I I lmuclnminulls 1171. musing Fm
1.(3.59) proposedby Hofftnannci nil.
hl8l.
log KP = r~’+ [~‘ ha’ (1~~
h-
= —0.96 .f 6.53x10 I’ + 3.16x 10 I~2
= 0.890— 2.46x10 7 P — 7.36x10tm
P2
(3.59)
(3.60)
(3.61)
wlmereP is pressurein MPa,andT1
, (normal boiling point) and T are in K. a’ is time slopeoftire strusiglstline connectingtine criticuul point and the boiling point at atmosphericpressuure,Pa.on a log vapourpressurevs. (T)
1plot.
a’ = [log( P5/ P,)J // [I / Tb — I / T
5] (3.62)
Theplot of log KP vs. a’ (1~
fb-1
/T) for conrmponentsof a systemsiat a given pressureoftenformsms a straight lure for inlernnmedimnlcatrsi heavy frumctuons,asshowms in Figuure3.5. Standingnmodilied vmsluesof a’ mmnsd l~,for nmrclhanemmmd etimmune munsd unon-irydrocarboncoismpoumndsto littImesamestraight line mus othercomsnpounenrts.Thevaluesof a’ anndTb aregiven in Table3.1.
0,
0,
0
or
Figure 3.5. Equmilihriunmrn rmutios mut 5.52 MPmsandvarioustemmmpermnlurcs. SPECopyrmglun Repmodumccdtronru Il 6j wimh perurnussummmn.
a(rrr5
-nrr)
122 .5 P/mace Equilibria .5 2. Equmhhrusun Raiuo123
Thevaluesof a’ andTb for C7
+fractionscanbeobtainedfrom:
a’ = 563+ l8On - 2.364n2
= 167+33.25n-0.539n2
(3.63)
(3.64)
wheren is thenumberof carbonsof the nornmal paraffin that has the sanrme K-value astlmmul ofthe C
7+ fraction. It can be estimatedby cotnmparingtire molecularweight of tIme C
74frmuction
with thoseof normal paraffins, Table A. I in Appendix A. Standiimg correlated n for tlseOklahomaCity crudeoil samplesby.
n = 3.85+0.0I35T + 0.2321P
whereT is in K andP is in MPa.
Table 3.1.Valuesof a’ andTb for usein Standing’sequilibrium ratiocorrelation.
Tb, K
61Cummpound a’, K
Nitrogen 261CartxnnDioxide 362 108HydrogenSunlphide 63l 184Menhane 167 52Euhane 636 168Propane 999 231iso-Butane 1132 262n.Rutane 1196 273iso-Pennanc 1316 301n-Penuane 1378 309iso-tlexanes 1498 335n-Hexane 1544 342Hexanes(lumped) 1521 339n-Hepnanre 1704 372n-Ocuane 1853 399n-Nonane 1994 424n-Decaume 2127 447
(3.65)
Alnhouugir the equilihriuimm ratio correlation was based on a limited nunrrber of dmmta, it Irums beensirown to be reliable for crude oils from various regions of the world, sonune constainingssmbstantialamountsof non-hydrocarbons[19].
OthergeneralisedK-valuecorrelations,eilher neglectingtheeffect of mixtureconsmposition[20,211 or using a singleparametersuchasthe convergencepressureto characterisethe mixture122.231 have alsobeen developedby various investigators. These correlations would bemainly valuablein generating initial guess values for using in an equation of state to calculatefugacities, as described in Chapter 5.
Wilson [20] proposedthe following equationto estimatethe equilibrium ratio below 3.5 MPa(500 psia):
K, = (P5
/ P)exp[5.37(l+ w,)(i — T5
,IT)] (3.66)
where00 is the acentric factorand ‘F~ansd P~are the ahsoluntecriticuul teurspcrmttunremmnd pressuirerespectively. The Wilson equationbasically uses Raouilt’s law, with tIre vapour pressurerelatedto thecritical propertiesusingthedefinitionof theacentricfacor, Eq.(1.9).
TIme Mollerup equation[211to estinnrate K-values, as initial guessesin flash calculations, isequivalemrlto theabove,hut for aconstantacentric factorof 0.01.
The Wilson equation generally provides reliable estimation of K-values for sub-criticalconsponents,huut overestiurmatesthoseof the supercriticalcomponents(24]. The equationhasbeenextendedto higlserpressures[22] as,
K = (P5
/ P1
)‘5 ‘(P5
/ P)exp~5.37A(l+ 00, )(l — T5
IT)]
wlmere
Awl -1(1’- P~)/(P,-
mmnsd Pk is tIne comrvergenscepressure,mis correlmmtedby Stmmnding[12].
P1
0.4
l4
Mç 29.0
(3.67)
(3.68)
wlncre i’k is ins MPa. ‘rise expurnremntn variesbetween0.5 and0.8, dependingon the fluid, withus sicfmuultvalueof 0.6.
The urhove modification to the Wilson equnation may lead to unrealisticvalues resulting tonon-convergemrcein plmasebehaviourcalculationrs.
!~xatunpie 3.5.
Estinmrane cquuilitmrimunn ratios of tIre guns-oil systemdescribedin Example 3.4. using theStandinug nnnetiuod amid the Wilsuin equation. Connpare the results with the experimentalvalues.
,Solum(tam:
The critical propertiesof C,-C5
are read from Table A.I in Appendix A. The properties
unf C~,arecalculatedas follows.
StaumdingCorrelauion
SuhsmimuilinngtIme pressureamnut tempermnluirein Eq.(3.65), the equivalentcarbon numberofC,, is deternmnimucut cqnnal to 10.66. wlniclr results in (X’22l 3 K and Tb=
46O.
2K, using
Eq.(3.63) mmnd Fs1
.(3.64),respectively.
The coefficiemrnsof Eq.(3.59)at 10.45 MPa are calculatedas.
r~’=0.067465,umsimrg Eq.(3.60)
3 = 0.5526,usinrg Eq.(3.62)
The resultsare given in ihe following table,
Wilson Equation
‘flue esninnmationof criuical propertiesof a pseudocomponent,using its specific gravity andnrrolcculmrr weight, is describedIn Section 6.2. A simpleapproachis to representC
7, with a
nrornral alkamre with tIre samenisolecunlarweight. In mInis case,C,1
. with a molecular weightof 212 is consideredto reprcsenrt C
7,. The critical properties of C.,. are, therefore,
esimatedequal ~mT,=736K, P5
=l.340 MPa, and w=0.7697.
124 .~. l’/,a.ce Fqniilmbrum .5.2. Equmi!ihrimmnn Ratio 125
Component a, K T5
. K K5
K~ K,,~ K,Equation 3.59 3.66 3.67 -C, 167 52 3.4601 4.1626 4.60993.01)22
C2
636 168 1.1454 0.6666 1.4170 .0274
C3
999 231 0.549(1 (1.1731 (1.5947 0.474’)
iC1
1132 262 0.3245 0.1)693 1)32911 1)2855nC
41196 273 0.2727 0.1)499 11. 2669 (1.2268
iCm 1316 301 0.1686 0.0207 (1.1517 (1.1351
nC3
1378 309 0.1478 0.1)162 0. 1292 0. 1111)1C
41521 339 0.1)874 0.01)57 0.0661 (1.0539
C7
, 2214 460 0(1088 (1.00(8) 0.00(15 0.0086
Note that althoughthe pressureis abovetheworking rangeof the Standingcorrelation, itpredicts theresultsmore reliably thanothers. TIme modificatious Immus inrpnsved the Wilsurnequationin. general,exceptfor predicting the equilibrium ratio of nretlsamrc.
All the aboveK-value correlationscan be usedto check the interrsmml consistetrcyof mmreasumredequilibriumratios.Figure~.6 comparestheHoffnmannplot with that of mnodilned Wilson plot.where log K~hasbeen plotted vs. (I + (0, )( I — T,,/T) at coisslmmnt pressuireIor initenmscdimmtecompoundsof anoil sample. A straight line can clearly fit thedata, including non-paraffins,by theWilson method,which usestheacentric factor, moreclosely thanthat of the Hoffmannmethod.
‘lime equmilibriumnnratiosof consponemslsof am oil measuiredin a test,sinrsulumtingoil vaporisuitioninreservoirby usmethumneiunjection us tlnrcc contuuct stagesat courstantpressureaumd iennperature.aleshownin Figunre3.7. TIne vmuriation of K
1for eachcomsrponentis solely due to clsammges in the
ursixture compositionby gasc(rnlaclinmgoil, TIme resultsclearly indicate thrat the correlationsigimoring tire compositionaleffect cmumummot provide relimmhle estimatesof tine equmihihritnmnr rmltio atisigis pressureconditions. ‘lIme measumreddmsta at umny overall consposition can, irowever. berepresenstedreasonablyby a straiglmt line.
(t+tO)(ilITr)
Figure 3.7. Measuredequilibriums rmmtios in a test simrmulating oil vaporisationby methaneat34.58 MPa and 373K.
Altisouglm tIme data at Inigln pressuremnmay umot fall on mm straight line, one would expect them tofollow a nronotonoustrend. Therefore,any mmseasuredpoint tisat is completely outside thegeneraltrendcouldbe suspect.The iloffmannorWilson plot is thus a good tool for checkingtheintegrity of themmmeasuremenrts.Other linear plots betweenlogK
1andcomponentproperties
sumch asid2
, ThI’ [25] mind the mniolecular weight 1261 have alsobeen proposedwhich canbeusedto evalumatennscmusureddatumamsdestinrnmmteequilibriunsratios.
3.3 REFERENCES
- Prausniti,J.M., Liclmtentlmaler,RN. andde Azevedo,E.G: “Molecular Thermodynamicsof Fluid-PhaseEquilibria”, 2nd Edition, Prentice-HallInc., NJ (1986).
2. Snurimln, J.M. munrd Vmuus Ness, I iC: “listrodunction 10 Clmennicurl Fnginseering‘l’lmernnirdymnaunsics’’. ihuird Edit ions, McGraw—I lill (1975).
3. Miciselsen,ML: PrivateConrsnsmunications.
4. Clmmro, K.C. aimd Seader,3D.: “A GemmeralCorrelationsof Vmipour-Liquid Equmilibria inIlydrocarboimMixtures”, AICInE J., Vol. 7, No. 4, 598-605(Dec.. 1961),
5. Krichevsky, lR amnd Kmmsumrmsovsky, JS:”ThernrodynansicalCuilculationsof SoluhilitiesofNitrogemsand Hydrogenin Waterat High Pressures”,3. Anu. Clsensm.Soc.,57. 2 168(1935).
The convergencepressurefor the modified Wilson equation is cimlculmuted frurnn Eq.(3.68).equalto 57.94MPa, with thevalueof A=0.644.
The calculatedequilibrium ratiosusing Ihe Standinngmenirod. K,. mIne Wilsous dtummnlion, K~,andthe modifiedWilson equation,K,,~.mire cormrpmiredwith tIre e.’uperiusseuntmul vuilues, K,, unthe following table,
0
ci
me:C0
.0
00’or
to
.1
.01
.001
0
...•• ‘PGo~
01
q°cm
00
00 ContaciSmage
.u0201
-2 —l
Hoffmann Plot
0
0,~
‘C.0.0
00’
n11
0~3a:
.0
‘,0
a~
-0.8 -0.6 .0.4 -0.2 0.0 0.2 0.4
log(l-TblT)/(l-T~)
Modified Wilson Plon
0.4
0.4-1.0 -0.9 -0.8 -0.7 -0.6 -0.5 -0.4
(t#0))(l’lIl’r)
Figure 3.6. Equilibrium ratios of intermediatecompoundsof a gas-oil mixture at 20.79 MPaand373 K.
I 26 .5. l’ha.ce F.q,uilibria
6. Kohayashi,R. andKatz, DL: “Vapour-Liquid Equilibria for Binrary ilydrocarhoms-WurlerSystenms”,tnd. Emsg. Chem.,45, 440 (1953).
7. Katz, D., etal: “Handbookof NaturalGasEngineering”,MacGrawhlill (1959).
8. Lawal, AS. and Silberherg, IF!: “A New Correlationsof Vmupour-Liqunid EqunilibriummnsRatiosInternally Consistentwith Critical Behaviour”,SPE 10287, Proc. of 56lIs Ann. Connf..(Oct., 1981).
9. Hadden,S.T: “ConvergencePressurein HydrocarbonVapour-Liquid Equilibria”, Clmem.Eng. Symp.Series49. No. 7, 53-66(1953).
10. Gas ProcessorsSuppliers Association, ed.: “SI Engineeriumg Datum Book”, l’ulsa,Oklahoma (1980).
I I - MacDonald, R.C: “Reservoir Simn.ilationm wills Interplmunse Mass‘I’nmunsk’r”. Report No.UT 71-2,TheUniversity ofTexasat Austin (1971).
12. Standing,MB: “Volumetric umnrd PhaseBelrmrviour of Oil Field llydrocmnmhons Systemsss”.9th Printing,SPE,Dmmllas. Texas(1981).
13. Mathews,TA., Roland, C.H., and Katz, D.L: “High PressureGas Measurennient”,Proc.NGAA,41 (1942).
14. Rowe, AM:”lntemally ConsistentCorrelationsfor Predicting Phasecomrrpositions forUse in Reservoir CompositionalSimulators”,SPE Paper 7475, Pres. at the 53rd Ann. FallTech. Conf and Exh. of the Society of Petroleum Engineers. l!ounston, Texas, Oct. 1-3(1978).
IS. Ahmed, T: “Hydrocarbon Phase Behaviour”, Gulf Publishing Courspany, llounston(1989).
16. Standing M.B: “A Set of Equations for Computing Equilibrium Ratios of a CrudeOil/NaturalGasSystemat PressuresBelow 1000 Psia”,JPT, 1193-1195(Sept., 1979).
17. Katz, DL, and Hachmuth, D.H: “Vaporisation Equilibrium Constantsmm a Crude Oil-NaturalGasSystem”,I & EC,29, 1072-1077(193.7).
18. Hoffmann, A.E.. Crump, iS. and Hocott, C.R: “Equilibrium Constants for Gas-CondensateSystems”,Trans.AIME, 198, 1-10 (1953).
19. Glaso, OS. and Whitson, Cli: “The Accumruucy of PVT Paramsieters(.‘mulcuuluuted fronrmComputer Flash Separation at PressuresLess Tlsumn 1000 Psia”, JP~F 1811-1813 (Aug.,1982).
20. Wilson, G: “A Modified Redlmch-Kwong EOS, Application to Getreral Plsysicmd DuumaCalculations”,PaperNo 15C, presenstedat tlre AtClrE 65tIm NationrmulMeelinsg(Mmuy. 1968).
21. Michelsen,ML: “Calculationof PhaseEnvelopesandCritical Points for MimlticotnsponentMixtures”, J. Fluid PhaseEquilibria, 4, 1-10(1980).
22. Whitson, C.H. and Tou’p, SB: “Evaluating ConstantVolume Depletions Data”, SPE10067, Proc.of 56th Ann. Conf. (Oct., 1981).
23. Voratsis,N: “A Robust PredictionMethod for Rapid PhaseBehaviour Calculations”,SPE 16943,Proc.of 62nd Ann. Conf. (Sept., 1987).
3.3. Referent-e.c 127
24. Miclselsen,Ml,: “PhaseEqumilihriuunnrCalculationrs,What is Easyand What is Difficult?”,ComrupninersClmenm.Fng’nmg.. I 7 No. 5/6, 431-439(1993).
25. Cmnmnrphcll, J.M: “Gas Conrditiunmninrg ausd Processing”, Vol. 1, Cannpbell Petroleum,Oklaluonnmu(1976).
26. Dammesh, A.. Xn.n, D.-H. ammd Todd. AC: “A Grouping Method to Optimise OilDescription for ConrposilionalSiniunlationsof Gas-InjectionProcesses”,SPERes. Eng., 343-348 (1992),
27. Sage,3.11. amrd Lacey, W.N: “Pirase-Equilibriaus HydrocarbonSystems”. Ind. Eng.(‘tsemsr., Vol. 34, No. 12. 1526-1531(Dec. 1942).
3.4 EXERCISES
3.1. ProveEq.(3.35)
3.2. tine vuupotnruunnd I iqu i,I plummscsof ur hitrmury nrsixttmre are at equmilibriuns at T=300 K and 12MI ‘mm. ‘I Inc nnnolc lrmmcl ionr o I cm nnrnlrtsnucnnl I mnr line equmiI ibrumtcd gas ammd liquid piruises is 0.9990munsd 0.2500,rcspectivclv. ‘I’hc connn~nrcssihiIityfmnctor of comrrponcustI as a pure gasat 300 Kcmmn be relatedto its pressureas,
Z=l—5.45xI02
P—6.35xl0~P2
whereP is in MPa.
Calculmstetlre fugacity coefficientof componentI in theliqunid phase.
3.3. A mnnixture of C, mind nC4
is fimnslscd at 423.1 K amnd 7.093 MPa. Use Raoult’s law, tImeStamsdingmetlnod. tIre Wilson equationand the GPA chart to predict the equilibrium ratio ofmuretlnmmnreaurd nornnruul clecanmeat tIre umbovecondutmons.TIme measuredmole fractionof methaneintheequilibratedgums andliquid ptrasesis t).949amsd0.229,respectively. [Kohn, J.P., Bradish,W.F., J. Cheiss. Emsg. D:uta, 9, 5, (1964)).
3.4. The measuredcouurpositionof equnilibrated vaporurand liquid phasesat 10.45 MPa and324.8 K aregiven in tIre following table.
Con~pomncnu,nnotc%Gas~qwdC02 7(1.98 5(1.15N2 0.59 (113(‘I 18,18 726(‘2 5.16 39’)
245 378(‘4 (1.31 072
nC4 I) 88 2.41CS (523 059
,,C5 ((32 5 St
(6 ((.31 271(‘7+ (5.59 26.69(lasconrp.Iacu,mr 0.578Lig. dcnsiny.kglm’ 765.9C’7+ Ctuaracuerisnics,M~208.S=0.8382
Predictthe equilihriuum ratios at tine aboveconditionsusing GPA charts, theStandingmethodanndtheWilson equations. Counparetheresultswith measuredvalues.
128 129
3.5. An equi-molarbinary gasmixture composedof etlraneand C02 is us equilihriumss witlnwater at350 K and 30 MPa. Assume(he gasfugacity coefficientsequal to one, and useHenry’slaw to estimatethegassolubility in water.
4EQUATIONS OF STATE
TIme equualityof funguncily of emiclu conrnpomnemsttlsroughountall pisaseswasproved, in Chapter3.to imc tIre requireunsemsl for u,’Incmsuical equilibrium ium mntulticonsspomrenslsystems. ‘lIre fumgurcitycoefficiersi,4r
1, defiured mis tlsc rumtio of fumgacity to pressure,of eachcomponentin umtly pisaseis
relatedto pressure,temperatureammd volutne by Eq.(3.3I),
ln4. ±.j .~ —RT/V dV—lnmZ i=1,2,...N (3.31)Ri’ V l,,,~)n,)~vnj.,
The fumgacity coefficient can, therefore,bedeterminedfrom the abovewith the aid of anequationsrelatimmg pressure,temperature,volume and conspositions,that is, anequationofstate(EOS).
Ins genermsl,anyequationsof statewhich providesreliablevolumetricdataover thefull rangeof theintegral in Eq.(3.3l) can beunsed to describethe fluid phasebehaviour.Severaltypesof EOS havebeensuuccessfullyappliedto hydrocarbonreservoirfluids.
130 4 Iqs~i(ic’nsof .Sh,(e 4, 5. Virial EUS and ill Modmfleotio?u.c 131
Thesimplest,and higirly successfulequation,us tIme semi-enrpiricuulvansdcr Wmrmuls type EOSwith two or threeparameters. Since 1873, when vats der Wauuls iussprovedtine ideal gasequalion by including parametersthat representedthe attracliveanrd repulsive inslermnnolecunlumrforces, the equation has beets revised and nnodified by numimerous investigmmtors. Otlncrequationswith manyparametershavealsobeentusedto describe(Ire plrurse heirmnviotmr, sotrsewith reasonablesuccess, Amongst tlseseequations,tire Bencdnct-Wehh-Runhins(BWR)typeEI], which is an empirical extensionto tIme virial EOS,can he uupplicd to boIls liqumid amsdvapourphasesof reservoirfluids, Theseequnalionsprovideno additionsalreliuuhility its plrmmsehetsmmviourstudies,its spite of their conmplexity.in conruparisonwulir tire vmrnr der Wmmals typeEOS. They are, however,valuable tools to describevolu,mrretric hclu:mviotmr. pmurnicumlmurly ofpumrc conmpounds,dueto their largenumrnherof paransseters,hence,lmngim llexnbiliny.
Fqunationc of state mmrc hasicmully dcveloped for pore curnrnl)ourcnsl.s. 1mm :mppliu’d tonrruulnmcmsnusponenlsysne’mnrsby ennnployingsonrmc nnnixnnrgmules to mlctcrnnuinre tlucir pmmn’anmut’tcn’c fornmixlumres. ‘lIne mnsixinng runlcs mrre comnsiulcmi’d 10 dn.’scmitrc tIme put’vmnilinmg lonucs liu’Iwcu’mrmusoleculesof duflerctst sunhstancesformsning tire mixtumme. Sinsuplenlumxinsg muiles, stmclu mis tisoseIlsal unssummne comnpounulsare ruumsdonrrly distributed wntlsun tIre mnnixtuure.mmmc (lumIe mrdcquumnle Rudescrnbcirydrocarbomm mrmixturesof reservurir flunds. More conmiplex msnnxnnmgrtmles. lsowcver.urrerequired to represent theiruteractuonbetweenlmydrocmmrhonsmmnd musynmrnnclricconmspoumusulssuuclras water, which is present in reservoirs, or nmetlmanmol which is sonmetumnres mudded to rcscrvsirfluids asa lsydrateinlsihitor.
Al tlmouuglm tlsermodynaimsics ngoroumsly describe tine equilihriuunss conmdnl ours ummrd relmulc tluennm tovolumtrrctric data, ums given by Eq.(3.3 I), it is tIre cmmpurhility of EOS mmmsd tIre mmssocimutcd mmsixinngrules Ilnat determinestine successof phaseequuilihriunsrprediction. mms will bedescribedins lbsclrunptcr.
4.1 VIRIAL EOS AND ITS MODIFICATIONS
The virial equation is based on theories of statistical mssechmmnnics )2), anrd canm he expressed umsan infinite seriesof eithermolarvolume (molardensity), or pressure,
Z= I + B/v + C/v2
+ Div3
+
(Z=l+BpM+Cp~+Dp~,+
or,
Z=l+B’P+C’P2
+D’P3
+....
(4.1)
(4.2)
whereZ is thecompressibilityfactor, v and p arethe molar volmunne and tIme nusolardensity.respectively, and P is tIne pressure.B, C, D. etc., arecalled tine secommd,tlsird, fourth, andsoon, virial coefficients,anddependonly on temperatunrefor eaclm compoumnd.
The coelficjenstB muccounnulsfor tIne itrteractiomr betweenIwo mmmolecrules.svlncnemms (‘ is tluan fortirree nrroleculesand so onm. For exausmplc,if tIre effect of a tlmird ummolecule (run tIme prevailingforcesbetweentwo moleculescan be ignored, tlse third and Imigiser termscuun he neglected.As the fluid becomesnmore dense,the highertermsbecomemore significant muumd cannotheignored. The equation reducesto Z=l, that is tIne ideal gas equation,wlsen pressummeapproaches7,ero.
Nurmreroustheoreticalandexperimentalstudieson deterimiinatiomsof virial cocfficiemsts, mostlythe secondvirial coefficient, have beenreported. As higlr order coefficieustsarc hard todetermine,the equationcanbe applied to the vapourphaseonly. It is, therefore,of little
valtne to reservoirfluid studies,wirerea singleequationsof stateis to describethebehaviourof both vapour and liqunid pisases. It is, however, very useful in showingguidelinesforapplying setni-etsipirical EOS to mnmixtuures, as the virial coefficients can be describedrigorouslyfor mrmixturesusing statisticumlnrsechmumnics.‘I’lmis subjectis describedin Section4.3.
Starling Modification ofBenmedict-Webb-Rubin EOS (BWRS)
lIme l3cncdicn.WehhRtnhinmEOS (E1WR) [I) is anempirical extemssionof the virial EOS. Ansrm-,dificumliomr of lIme Benedict-\Vclrb-Rubin EOS as proposedby Starling [3) witis IIpmrrmmmmsetersImuts heeurmupplied successfunllyto petroleuumnreservoirfluids,
I’ p51
RT (lt,l~l. - A,, + ~ ~ )p~,+ (lI~I.-. mm - + u(a +
+~s!.(I÷yp~)exp(—’yp~,)T
2
(4.3)
wlucrePM is tIre molmmr dctrsity uunrd tIne II coefficientscan heevaluatedfrom the followinggenre rmnl iscd equnumt n ours:
p~U,, = 0.443690+ 0.115449o
= 1.28438 0.920731(n)R’1~.
= 0.356306+ 1.7087hoRT’,
= 0.0307452+0.179433o
t).006450— 0.022143(m)cxp(—3.8(0)
p~h= 0.528629+ 0.349261(i)
= 0.484011+ 0.754130o
= 11.0732828+0.463492ooRI’,.
= (1.0705233 - ().044448m
= 0.504087+ 1.322450)R’l’
= 0.544979-0.270896(0
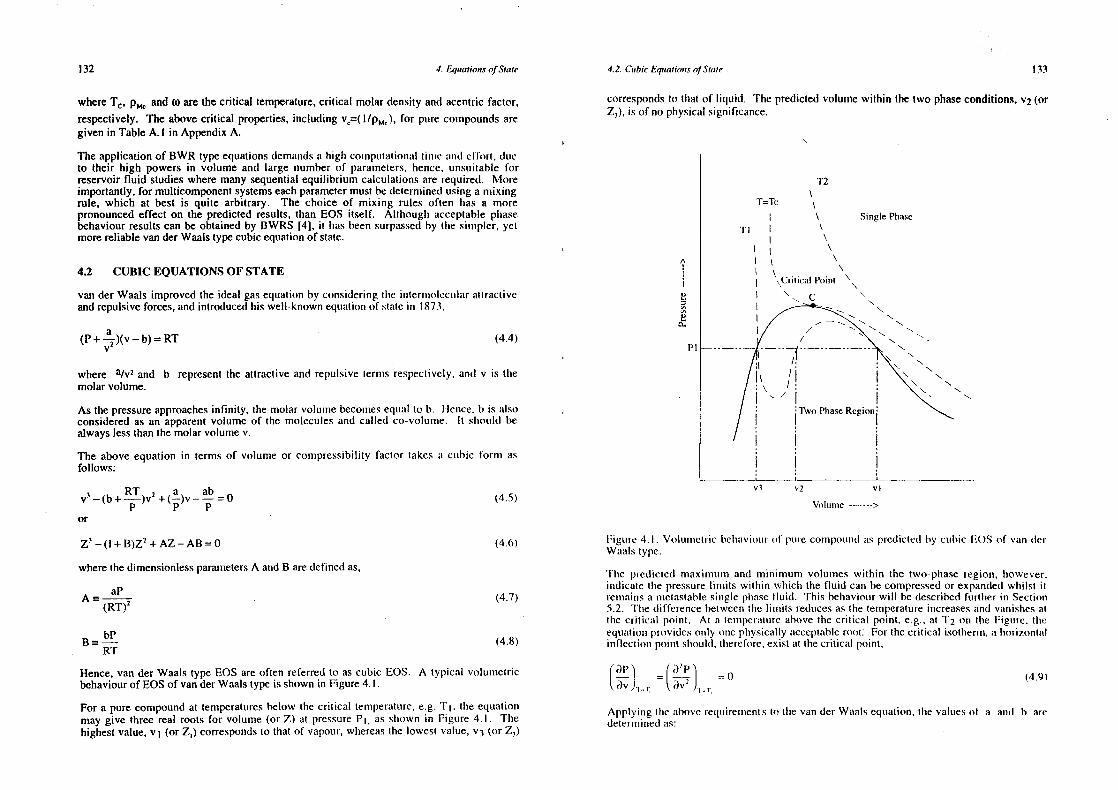
132 4. Equations ofState 4.2. Cubic Equations ofState 133
whereT~,p~andCo arethecritical temperature,critical molardensity andacentric factor,
respectively.The abovecritical properties,including v~=(I/PM~)~for purecompoundsaregivenin TableA. I in Appendix A.
Theapplicationof BWR type equationsdemuundsahiglm counpulaliomsaltunic ummrd effort, dueto their high powers in volume and large numberof parameters,hence,unsuitableforreservoirfluid studieswheremanysequentialequilibrium calculationsarerequired. Moreimportantly,for multicomponentsystemseachparametermustbedeterminedusing amixingrule, which at best is quite arbitrary. The choice of mixing rules often has a morepronouncedeffect on the predictedresults,than EOS itself. Although acceptumblephasebehaviourresultscan beobtainedby BWRS [41, it has beensurpassedby the siusspler,yetmorereliablevanderWaalstypecubicequationof state.
4.2 CUBIC EQUATIONS OFSTATE
vander Waalsimprovedthe ideal gasequationby consideringlIne inlermsrolectulusrattractiveandrepulsiveforces,andintroducedhis well-known equmutionof stmmteirs 1873.
(P+-’)(v—b)=RT (4.4)
where a,V2 and b represent(he attractiveandrepulsiveternnsrespectively,andv is tImemolarvolume.
As thepressureapproachesinfinity, themolar volume becotnesequal to h. Heumce.h is mulsoconsideredas an apparentvolume of the moleculesand called co-volumsse. It sisoumldhealwayslessthanthemolarvolume v.
The aboveequationin terms of volume or compressibilityfactor takes mm cubic forums asfollows:
RT ~ a abv’ —(b+—)v +(—)v——=0P P P
or
Z1 —(I+B)Z1 +AZ-AB’=O
wherethedimensionlessparametersA andB aredefinedas,
A aP(RT)2
Bsu-~-RT
(4.5)
(4.6)
(4.7)
(4.8)
Hence,van der Waalstype EOS areoften referred to ascubic EOS. A typical volumetricbehaviourof EOSof vander Waalstype is shownin Figure4.1.
For a purecompoundat temperatuuresbelow the critical temperature,e.g. ‘F1
, tIne equationmay give threereal roots for volume(or Z) at pressureP
1as simown in Figure 4.1. TIme
highestvalue,v I (or Z1
) correspondsto that of vapour, whereasthe lowestvalue, v~(or Z3
)
correspondsto that of liquid. The predictedvolume within thetwo phaseconditions,v2 (orZ~),is of no physicalsignificance.
A
0
.3
0~
P1
Im
iguun’e 4.1. Voluimmctric tsclnmtviotirof l’°~coisspounmdas predictedby cubic FOS of vumms derWusalstype.
The predictedmaximnunin and minimunrn volumes within the two-phaseregion, however,immdicate time pressurelimits within svlnich the fluid can becompressedor expandedwhilst itremnmainsa mclastahlesimrgle phrasefluid. This behaviourwill he describedfurtlmer in Section5.2. TIre differencehetweenmlIme limmnits reducesasthe tensperatureincreasesmmd vanislsesatthe critical poimst. At a tensmperatureabove tIme critical point, e.g.. at T
2on the Figure, tIme
equalions providesonly oneplmysically acceptableroust: For thecritical isotherm,a horizotntuslinflectioms pniumt slson.nld,tlrerefore,exist at thecritical point,
(~ =1~~!’l=0 (4.9)
Applying tIme umbove requmirennuentsto time vander Wamulsequation,tIme valuesof a atsd h aredeterunniuredmis:
T2
T=Tc
\Critical Point \\
SinglePhase
\N
N
NN
N,
NN,
NN
NN N
vi 52 vi
Vortunne >
134 4 Equations ofState 4.2. (‘uhic Eqimation.c of Statr 135
9 27( R2
T2
~ Suuhmsnimuitimsg the umbove vunluics inn Eq (4.6), resmults inn the following cunhicequationfor Z,a = RT~v,= ~ (4.10) ‘/.‘-I.90257 Z
2+I .55625Z- 1.40463=0
willr smuly onereuml roustI IRT
h=~-v =_(..._u~) (4.11) Z=l.49069
- . Snuhstitmnnimrg nIne above vumlnic of tIme comnupressihilimy factnsr in the fougurcity expressionresultsin.where thesuuhscrmptc, refers to thevaluesat tIme crnlncalpoInt.4n=Q97779
‘The van der Waalsequatuonof state(vdW) givesa cmulncunlcomrrpressnhulntyfmmctur of 0.375 forall conspounds,whereasvery few connpounds,sunch mis quummntuurr gmnscs,lummve A grcmutcm Itnmnmm0.3. I lcnscctIre c,sirccnsurmnniunmrof dissu,Ivcdnscmtn:nnreinn wmnter. correctedfor ilre fugacity coefficient,
us.
Example 4.1.f,Y1 =Pxn*=65 x(I.97779 Ml’~m= (I .4378x10’ Mt’a/mnnol fraction) xx,:
In Example3.3. the solumbility of methanein water was calcumlaled by asstnminrg tIne n,mctlrmmnrefugacity coefficient equal to one. Use vdWto eslinmate tIne fugacity csefficienrt amrd imnmprove
- - x =4.42x10 nuuolc frunctnonr of urrethamre inn water.theaccuracyof predictedgassolubmhmty.
Solution:A simple equnation,suchas vdW, eannmot accuratelymodel tine behaviourof densefluids
Substituting the pressurein the fugacity expressionrfor pure compounds,F.q.(3.35),onsing particumlarly Ilmat of cotrsplex fluid mixtures. Nunmerousmodificationshave beenmade tovdW, we oblain. imnmprove ifs capahilily by flso(lifying the attractiveamndrepumlsiveterms. The two parameters
of mm mrmsd h us tire origimsal vdW c:nn ire determsnitredsimply from theboundaryconditionsat
I ~( R’F ‘~ lIre criticmml poinmt, wlrercmusin nrnosdificdversions,mndditionalto theabove,experimentaldataonltrm~= (Z I)— In Z+ —J~— — P)dv = punre flunids Irurve umlsohecir usedgennermully to deterissinetIre parameters.Theseequationsare,
RT v Ilnercfone,setnni-emrrpnmicmul.
= (Z — I) — In Z + _Lj(.~I— —~--~--+ -~--~dv hluurd splnerefluid usmordelsIrunve hcemn selected[5) to describerepulsive forces. TIne equationRI’ ~. v v—b v
2) proposedby Cartrmrlsmmn anrd Starlinmg [6] imas beenusedextensivelyto developnew formssuch
mis perturbedIsardclsmmin [7], andcinumims of rotators[8). In spiteof recentefforts[9] to simplifyIntegrationof theaboveequationresultsin, , tine earliermodifications in orderto mn’rake themmore practical, theyhavenot receivedmuclm
unllenmtusnasemmgnncernngtools.
lno~= (Z — 1)— In Z + _!_IRT In ~ Although vannder Wmumlsconsideredthat Iris representationof repulsiveforces,expressedby aRTL v—b vj,., constantb. required mmnore imniprovementthan that of the attractive term, in practice the
mnmodification of tIre latler ismus beersnusorcrewardimng. Almost all popularvander Waalstypelrnpienrentnngthe Inmnmts, and making the equanmondmnremssmonlcss,using Eqs (4.78), we EDS lrmrve improved tlmeir cumpahilities by modifying the attractive term. They can beo lain, expressed by tIme following gemrermml form,
ln~ =(Z— I)— In(Z— B)—A/Z
The parametersof vdW are calculated,using Eqs.(4.9-It)) amrd mncthanecritical properties P = —~.—~--.— —~—-——-— (4.12)
given in TableA.l in Appendix A. as. v—li v2
-I- nuv — w’27 (R
2T2 ‘~ Inn mu two-pmsrumiimeterfosrnsm of mIsc equmulion in and w are related to h whereasin a
a = —[ —s.- j=(27/64)x(0.0083t44xl90.56)’/4.599=0.230274Ml’mn.(m’/kgnnoI)~ tlmree-p~nranneterforum on, and w are related to) h, and/or a third parameterc, In a four-64~ P~ j parumrureternrodificalion u and w more relatedto b and/or c anda fourth parameterd.
I RT ‘FIme abovegeneraleqlnmmtionin termsof tIre conspressihilityfactor is,b = —(——-~-)=(l/8)x0.0083I44x190.56/4.599=0.304254m’/kgmol
8 ~ . z’(l+lt)z2
+(AB~JtJw2
)z(ABr3w2
w2
)=o (4.13)
with thedimensionlessvalues,definedin Eq.(4.7-8).asfollows,where the dumnmensmomslessparannetersA and B arethe sameasthosedefinedin Eqs.(4.7)and
A=I.55625I B=0.902574 (4.8), respectively,anrd
136 4. F?qmuatuomn.rofState 4.2. ( ‘nmbic &/mmati.’n?i.u (nl .St~ir 137
RT
RI
Thereis hardlyanytheoreticalfoundation,orstrongly convincingarguinments.for selec(iisgaparticular form of EOS amongstnmany describedby the general form of Eq.(4.l2). Timesuccessandpopularityof certainequationsarensoredue to) featmuresotherthan tine selectedform in mostcases. For example,the methodusedto determinetIme EOS putraimmeterscouldhavea higherimpacton thepredictedresults,thanthe mathematicalform of theequation.
Although EOS primarily provides volumetric (density)data, its msuijor contrihuition as anengineeringtool is throughits coumplingwith thermodynamicrelationsin predicting phunsebelmaviourandphysical propertiesof fluids. As tIne parmmmrmetersof mm sermmi-cmnnpiricmulBOS miredeterminedby matchingits predictionto experinmeumtaldata,time inchusion of nmmore pmmrametersin EOSmakesit moreflexible. Whereasa two-parameterEOSwould suffice to predict tIrevapourpressure,hence,phaseequilibria,the inclusion of atlmird paratmmcterwill gemsermnllyimprove the predictionof density along witls reliable vapour pressure. Two (Sr tlsrecparameterEOS areconsideredadequatefor all applicationsin thepctroleuumsitmduistry.
The main departurefrom the original vdW, which hasresulted in the successof tniodifiedequations,is not the revision of the attractivetermsm functional forums, hut treating it as mmtemperaturedependentparameter,
a=a,a (4.19)
whereaexpressesthedependencyof theparameter,a, on temperatureandacdependsonlyon thecritical propertiesof thecompoundas givenby,
lnmi~=(Z — I)— ln(Z — B)+
(4.14) , —p (4.20)
(4.15) Witlm tIme exceptionof Redlicln mmmxl Kwong [10) who originally proposedthe temperaturedepensdencyof a in 1948 asu=Tr’°’5recentinvestigatorshaveuisedvapourpressuredatato
The two-parameterEOSarethe mostpopularequations,wherethe parametersmure expressed tleternmmineaby,
‘Fine abovediscussionlmighhiglrts tire siurnilarity betweenall tire comssmmionlyumsedequationsof
R2
T 2 state and suggeststlmat tlsere is very little fundamentaldifferencebetweenthem. All thea = ~ c lwo-paransretcrequmationshusveselecteda fomm of Eq.(4.12), assumed,a, to hetennperatnrc
(4.16) du’pendemmt, ammd lmmmve detcrnmntnedlime tenmperalurc dependencyby matching tIme vapotirpressuiredmmta. lIme mudditioms of tIre Ilmird parammmeterhums increasedthe flexibility, wheretIme
RT ‘ inrvcstigmutosrsImurve dctermmninedit gcnmemmmlly by rmratciring saturusledliquid data, ‘Fhe van derb = ~ b ‘p’” (4 17) ‘oWmnuuls type E()S Immuve bccmm cosinnpuclucnrsivelyreviewed in literature111—161.
Note that theexpressionsfor theparametersins tine mnodificd equumutioumsare siunnilmur to llutssc orf Euannnple4.2.the original vdW, but the coefficients lmave been generalisedas ~
1a and ~ i’Ime ollmeu
parameters,in EOS which usemore than two, are generallyof co-volume usunture.Imcmmcc, - ProveIhat the mureashetweemm tine saturationpressurelure andthe predictedvolunme isothermexpressedby anequationsimilar to Eq.(4.17),hut with differentcoefficients, Imy acmnhic equationsof statemrre equalfor a pure substance.The aboveequality,knownasthe
Mmrswell equmml murea nile, is counsideredequivalentto equality offugacitiesof saturatedvapourThesubstitutionof Eq.(4.l2) into theexpressionfor fugacity of a puresuuhsluunce,Eq.(3.35). mmmd luqumud ilsmuses.lnemrce,mupplmcmmblein determmsimmingtIme parametersof anempirical POS.resultsin thefollowing generalisedexpression,usingthesameapproachasin Exanmple4.1,
A I 2Z,t,U_,[U2+4W2
,1U2 n i~i-j3-:~:‘Jii~4W2
n. .~:::::::::::::::.~ vnv t:::::::::::::~:s v
/
(4.18)
3.) S
Volume
FigureE4.2. Pressure’voluunseisottsermrsof apure fluid aspredictedby cubic EOS.
Solumt,o,n:
IntegratingEq.(3.22)from thesatnmratedliquid to tire saturatedvapour,weobtain,
Jd~=JsdT+JvdP=~ ~L ~
138 4. Eqomotuonms o~fState 4.2. Cubic Equations ofState139
becausethevapourandliquid areurn equilibrium.
TheintegraloverdTisequal to zero at the isotlmerm. ttemsce.
J vdP= Jd(Pv)_J Pdv= 0
or,
P(Vv _VL)_JPdv=0
Which is only satisfiedwhen thetwo shadedareasmmre eqummrl.
4.2.1 Two-Parameter EOS
RedlichandKwotmg [10) modifiedtheattractivetert3mof vdW as,
P=RT/(v’—b)—a/[T~v(v+h)] (4.21)
The valuesof ~a and~b were consideredto heconstatnt,imence,detcrnsnimmedto he 0.42747and0.08664respectively,usingEq.(4.9).
Zudkevitch and Joffe [17), andJoffe et al. [IS] assumedtlmat ~a and ~b in Ilse Redlich-Kwong equationof state(RK) were temperatumre-dependent.lIme valuesof ~�a and ~h for
eachpure substanceat any temperaturewere obtainedby matchingthe predicted liquiddensity data to the measuredvalue, and equalisationof saturatedliquid and vapoumr phasefugacities. Above thecritical temperature,the parameterswere taken asconstantsandeqummtlto their valuesat ‘Fr = I. The aboveapproachwas necessaryas two equilibrated phasescannotexist for a purecompoundabove thecritical poinmt. Figure 4. 2 showslIme varimmtion of
~a and~ with Tr asderivedand correlatedwith the acentric factor by Yuurhorougim [19).‘rhe sharpchangeof both parametersneartIme critical point clearly rnnled ounl the extrapolationof therelalionabovethecritical point, an approachwhich is generallyusedin otlnerEQS.
Manchming of the predicted data to mnmeasuredvmmluuesat saturmution to (IctcrnmsinseE()Spmnr:mismelershasbeen used almost by all recent investigators. Wlnereas Zumdkevitch-Jotfesuggesteddeterminingtheparameterswhen requiredat tire prevailingconditions,othersIsurvegeneratedgeneralisedcorrelationsfor parametersby applying tire method. ‘I’ime useof correlationstodeterminetheparametersdefinitely simplifies thecalculationtask,hut reducesthe accuracyasany generalisedcorrelation is bound to havesome deviationsfronri line cmrrelated duntmu.The mmiellmod suggestedby Zudkevitch and Joffe does not significanmtly inncreaseslImecalcumlationaleffort when applied to a petroletmmreservoirwhere the tennupermntulreis treatedmostlyconstant,and tIme parametersarecalcomlatedonly once. Ansy reliablecorrelationinliterature[20), suclm asthoseof Lee-Kestler,Eq.(l.lO), and modified Rackent,Eq.(l.I2), canbe usedinsteadof experimentaldatato calculatevapourpressuremmmd saturatedliqumid densityrespectively.
The approachesof Rediich-Kwong,andZudkevitch-Joffeto imnrprove vdW, that is nnakingthe parametersof EOS tenrperaturedependentand usingthe smsturateddata to determmsinetimeparameters,have beenadoptedin all the successfulmodifications of vdW. A few of thecunrrenntlyprevalentEQSwill he presentedhere.
0) 50
(0.45
(1.40
tta 0.35
a. no
Ii 25
0)201
015
Acenrnric Facnor
Figure4.2a. (Iemrermulusedvaluesof U5
in ZJRK. Reprinnedwith permission[191.Copyright(1979)AmmuerucanChemnricalSrcicuy.
oh
00, tO
0,09
006
0) 07
(00)1’,
005
(0(0
01(01
0020.0 0)2 0.4 0.6 0.8 1.0
ReducedTemperamnice
000) 00.2 04 moo os 1.0
Reduced ‘remi,erauure
Accnnr;c I’acnor
Figunre4.2h. Generahisedvaluesof Ub in ZJRK. Reprintedwinlm perummission1191, Copyrighu (!979)AnncrncanI’Incunuicat Sot’ieuy
140 4. Eqmmaticn,u.c ofState 4.2. Cubic Equation.s of State 141
P, 0.5 1.0 2.0 3.0Z, RK 0.952 0.907 0.834 0.798Z,Fig.2.22 0.950 0.903 0.823 0.778
Soave-Redlich-KwongEQS(SRK)
Soave [21] replaced the temperature dependencyof the attractive termmm un RK, TrMS, by mm
more general function a:
P=RT/(v-b)-aca/[v(v4’b)] (4,22)
where
= 0.42747R2
T~2/ P~
b =0.08664R T~/ P~
and
a=[1 +m(1 Tr°’5
)12
(4.23)
The function a was selected,and m was correlatedwith the acentric fmmctor by equatingfugacitiesof saturatedliquid andvapourphasesatTr =0.7.
m=0.480+I .574o-0.1 76&’ (4.24)
Soaveet al. [22], later suggestedto divide tIme value of m determinedfrom the aboveequationby 1.18 to improvetheresults.
Grahoski and Daubert [23] used the API vapour pressure data and modified Eq.(4.24) toimprovepure-conspomsentvapourpressurepredictions,
m=0,48508+1.55171 to- 0.15613~2 (4.25)
SRK in termsof time compressibilityfactorZtakesthefollowing form.
Z3
-’L2
+(A-B-B2
)Z-AB=O (4.26)
wlmcre tIme definitionsof A umusd B umre given ins Eqs.(4.7)umnd (4.8) respectively.
(‘oil mpuurm ung SRK wit Ii I luu’ gemrcm’uml I ~()S , I ~q.(4. 12). I Inc val ties of tm=h mind w=0.
SRK is ulummtc capableof predictimugvapoumr—Iiquid equilibrium, hut it doesnot provide reliable
liquid density.I’eng-Robin.so,uEQS(PR)
Pengand Robinson1241 modified tine attractiveterm mainly to improve the prediction ofliquid densityin comparisonwitir SRK,
P=RT/(v -b)-a~u/[v(v+h)+b(v-b)J (4.27)
where,
ac= 0.457235R2T~2/ p
and
b = 0.077796RT
c /15
c
Example 4.3.
A classof equationsrelating volumetricpropertiesto temperatureandpressure,is that basedon the correspondingstatesprinciple, which considersthat fluids behaveidenticmmlly atconditions of equal reduced properties. Reducethe Redliclm-Kwomng EOS to a correspondingstatesform of ZZ(Tr, Pr)’ Comparetheresultfor T=l .5, overa P
1rangeof 0.5-3, with that
ofthegeneralisedcompressibilitychartshownin Figure2.22.
Solution:
The Redlich-KwongEOS in termsof theconmpressihilityfactor is tIme smmuime asFq.(4.26).wiiti
the following expressionsfor A and B according to Fs1
s.(4.7)and (4.8), respectivt’Iy.A = aP/(RT)
2=(0.42747T,.’°
5R
2T~ / P~)I’/R
2i’7
0.427471’,‘~I~
B = bP/ RT = (0.08664RT~I P,~)P/RT = O.O8664T,~mP~
Substituting the abovetwo expressionsin Eq.(4.24), results in,
zm— + [(o.42747~/ ‘F~’
5— 0.08664P,IT, — (0.08664P,/ ‘I’, )2~Z— 0.037036I~2/ T~=0
SubstitutingT,=l.5 andvariousP, valuesin theaboveequationresultsin a ctmhic equations, withtheresultsasfollows. Thecomparisonwith thevaluesof Zread fromFigure2.22 is alsoshown.
They useda sirniiuur form of a as proposedby Soave,Eq.(4.23), but used vapour-pressure
data Irons the nornmmal boiling point to the critical point, and correlated m as,
ins = 0.37464+ 1.5422o- 0.26992u2
(4.28)
Thecorrelationwaslater modifiedto improve predictionsfor heaviercomponents[25),
in = 0.3796+ 1.4850)- 0.1fl44~2+ 0.01667& (4.29)
PRin termsof thecommspressibilityfactorZ takesthe following form,
- (l-B)Z2
+ (A -2B -3B2
) Z - (AB-B2
-B3
) = 0 (4.30)
PR is obtainedby substitutingu and w in Eq.(4.12)by 2b and h, respectively.
VolunneS/uuft
A comparisonof time predicted liqunid molar volume by leading two parameterEOS withexperimmmemmtnuidataof pumre consspoundsgenerally slsows a systematicdeviation. The deviationis almost constant over a wide pressure range away from the critical point. Hence,subtracting the predictedmolar voslume by a constantcorrection term can improve the
142 4. irquaoonn.c ofState 4.2. Cuuhin- Equation.c ofState 143
Table4.1.Vmuluesof slsift parummmneterinn Peng-Rohinsommequmationof state.
cnnrnnpunnenn Ci C2 (‘3 IC4
nC4S~ .01540) ~0.IO02 ~0O65Ol -0.07935 -0.06413
lIne unutlsors correluutcdtine slnift pmrrunnrieter to themolecumlarweiglst as,
Sn. = I
‘i’mthlc 4.2.C’ocfficienmtsof slnift parunmnsctcrcorrelation,Eq.(4.36).
..Connuponncnmmjy,pe . NL_.l’armuftins 2 258 0.162.)Nmn
1uhotnenscs 3 0)004 u 2321
Atonnnummtics 2.516 0.2(6)8
Jlmumveri andYonnngren1271, sinsril:mrly to Penelounxet al., applied thevolume shift conceptto
i’R, munrd relumtedc to lIne paraumseterIs. by defining ml dimensionlessshift parameter,S5
.
S5
t~’h (4.35)
was determinedby matchingtIne predictedand nmmeasuredmolar volumes for varioushydrocarbons.Theshift parammsetersfor light compoundsaregivenin Table4.1,
predictedliquid density. Theeffecton thepredictedvapourvolume is generusllyinsugnificantdueto its largevaluerelativeto that of liquid away from thecriticmul point.
PenelouxetaI. [26] were the first who iumtrodumcedthe voltunrie slunfl comnrcepl. u’. slnnftunmg tImevolumeaxis,andappliedit to SRK,
vcor=v_c (4.31)
where vCor is the correctedmolar volume, and c is the correction terum’s delermunedbymatchingthemeasuredandpredictedsaturatedliquid volumesat Tr = 0.7.
EOS are applied to multicomponentmixtn.nres by introducing fluxing runles to determniimemixtureparameters,as will be describedin Section4.5. The following mnxmnmg rule is usedto determinec for mixtures:
c = ~x,c, (4.32)
where,x1
, is themole fractionof component,m, in thenrmixturc.
The inclusion of the third parameterin EOSchangesthecalculatedfiugacity coefficient usingEq.(3.3I). as,
•ncor = ~uexp (- c1
P/ RT) (4.33)
where ojs~Cunrand ~i are the nnmodified and original fugacity coefficienstsof componcimt n.respectively.
Wimen the fugacity of eachconmpommentis calculatedby lIne sammueEOS ins both vapouir andliqunid ptmases,theabovemodification will not affect thepredictedequmlibriuniconditmons. Itonly multiplies the fugacity of eachcomponentin both phasesby an equal ansmoumnt.resultingin the same value of equilibrium ratio, Eq.(3.43). Hence, the thmrd parametercan heemnployedmerely to adjuns( the predicted vohumme. and need not he mnciunded in EOS forcalculatingthevapour-liquidequilihriumsmratio.
Time volums’se shift generallyimprovesthepredicledliquid density,and lrums a mninnimnmaleffecton the vapourdensity at low and immoderatepressunresas its molar volummie us relatuvelylargecomparedto the valueof c. At high pressurecondition, theinclusionof c puirmuimnetermaynsotnecessarilyimprove the predictedgasdensity as it is just a correction ternn fosr the liqumiddensity. However, it is advisableto adjust tIme gasphasevolume by the third parametertomaintainconsistency,particularly nearthe critical point wherepropertiesof the two phasesapproacheachother.
Penelounxetal. correlatedthevolumne translatnonparammieterc as,
= 0.40768(0.2944I — ZRA) R.T~ (434)
wiscre ZRA is the Rmmckettcompressibility fuuctor mrs develolsedby S1
memrcermnnnul t)mnmsner ins tImemodifiedRackettequation,Eq.(t.I2).
iC5 nC~ _________-0.04350 -0.04183 -0.01478
wlmere s~iandx are positivecoefficients. Stmggestedvaluesfor thecoefficientsare giveninTable4.2.
(4.36)
Tire valueof x for lmemmvy fractiomrsof a reservoirflunid canbeusedasa tuning parametertomurtcts tIne predictedto mmmeasumredsatumraledliquid densities,as will be describedin Section9.3.
Matlsias et al. 1281 pointed out that umpphication of the above method to PR raises thecalcuulumted liqomid voluusncabove lime cxpcrinssemitalvaluefor almost all testedpurecompoundsmmbosvc mm reducedtensrpcrumturcof umrotund0.85, and tire uleviatioms reachesits mnaximumat thecritncmml point. Therefore,an additionnutl voluusnecorrectiontermscaledaccordingto proximityof the prevailinsgconditions to tine criticuml point. was proposed,
= v — c + (437)
wimere ~3,is the volume correction,additional to c, to matchthe critical volume by EOS,deternsminedusing experinm’mentaldata,and~. is a dimensionlessdistanceto the critical point.~, is a cusnslmnmml,determinmedby regrcssionrof saturatedvapourandliquid volumes,and foundto he 0.41 for PR. lIne dimnren.sioirlessdistance, A, was related to the slope of theprcssuure-denrsmtyisotlrerisuas,
A = (I / R’I’.) (~)P/nJp)r (4.38)
A sinmnilmur uuppromncln, to mnnnprovc tIme lnrcdicted demnsity near time critical point by EQS.wasalso.suuggesledimmdepemsdentlyby Cisoum and Prausnsitz[29]. who applied it to SRK and found avalue of 0.35 for ~. The proposedmethod was extendedto binary mixtures, with anadditional term relatedto derivativesof time molar Helmholtz energy. It was, however,v
3=(RTC/PC)ZRA (1.12)
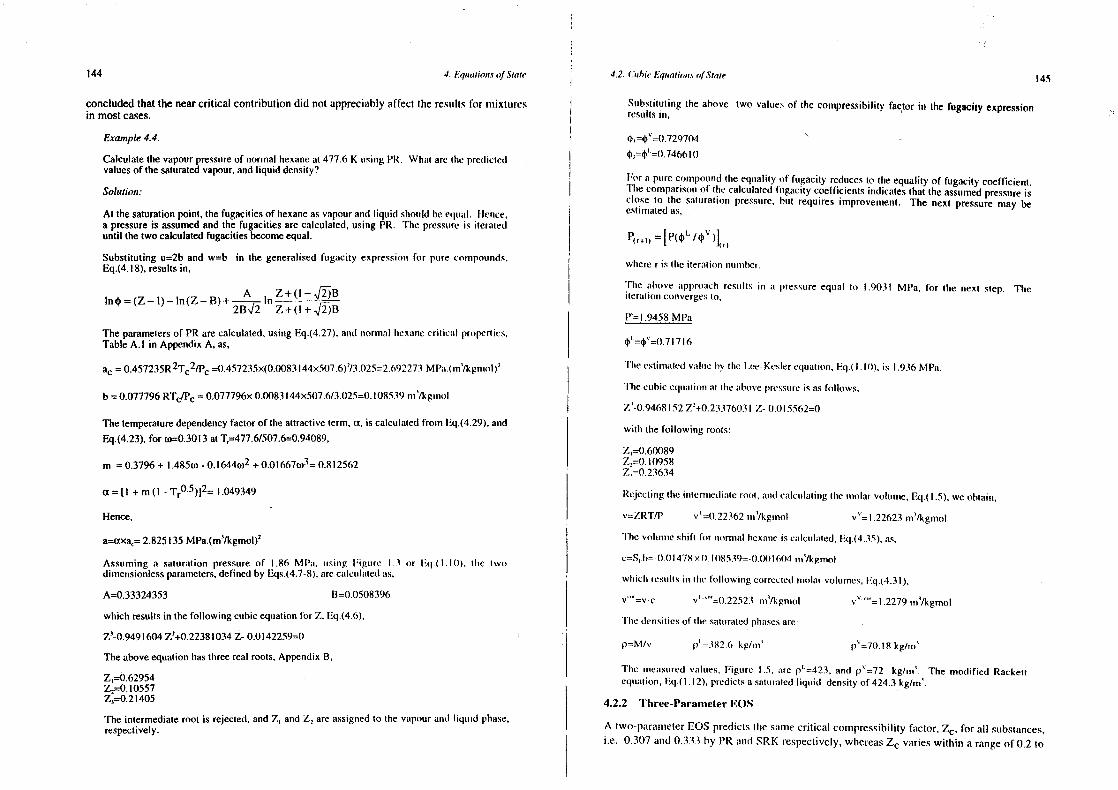
144 4. l~qmuutio:n.sofState 4.2. Cmthic Equations of State 145
concludedthat thenearcritical contributiondid not appreciablyaffect therestults for imsixturesin mostcases.
Example 4.4.
Calculatethe vapourpressureof normalhexammeat 477.6 K usingPR. What aretIne predicted
valuesof thesaturatedvapour,and liquid density?
Solution:
At thesaturationpoint, thefugacitiesof hexaneasvapourandliquid shotmldbe eqtu~tI.Hence,a pressure is assumedand the fugacitiesare calculated,using PR. The pressureis iterateduntil thetwo calculatedfugacitiesbecomeequal.
Substitutingu=2band w=b in thegeneralisedfugacity espressiourfor pure conmmpoumnds.Eq.(4.l8),resultsin.
ln4 =(Z— I)— ln(Z— B)+’—~—lnZ+(l — ~J~B2B-f~ Z+(l+..f2)B
The parametersof PRarecalculated,usingEq.(4.27),andimormuml hexmmumecriticuml pusperties,TableA.l in AppendixA, as,
= 0.457235R2
Tc2
1Pc=0.457235x(0.0083l44x507.6)2
/3.025=2.t’s92273MPmm.(mmr’/kgmmrol)~
b = 0.077796RTc/Pc= 0.077796x0.0083144x507.6/3.025=0.108539nm’/kgmnol
The temperaturedependencyfactorof theattractiveterm, a, is calculatedfrom Eq.(4.29).and
Eq.(4.23),for 0)=0.3013 at T,=477.6/507.6=0.94089.
m = 0.3796+ 1.485w-0.1f44w2
+ 0.01 667&=0.812562
a=(I +m(I Tr0
’5
)]2
1.049349
Hence,
a=axa,=2.825135 MPa.(m’/kgmol)2
Assuminga saturationpressure(sI 1.86 MPun, musing Figure 1.3 or Fq.( I It)), tIme twodimensionlessparameters,definedby Eqs.(4.7-8).arecalcimluntedas.
A=0.33324353 B=O.0508396
which resultsin thefollowing cubicequationfor Z.Eq.(4.6),
Z5
-0.949l604Z2
+0.22381034Z- 0.0142259=0
Theaboveequationhasthreerealroots,AppendixB.
Zna:0.62954Z
2=0.10557
Z3
=0.21405
The intermediateroot is rejected,andZn and Z, areassigmredto thevapouramid liquid phase.respectively.
Stibstituting the above two valunesof thecompressibilityfactor in the fugacity expressionresultsin,
4,=op’=0.729704m~n~4n’=0.746fs1(1
For a purecompounsdtheeqtuality of fugacity reducesto the equalityof fugacitycoefficient.The comparisonof the calculatedftmgacmty coefficiemmtsindicatesthat theassumedpressureischoseto the sumturaliomnpressure.hut requires improvenment. The next pressurenmay beestimsmatedas,
~(r+O) = [P(~’,~V)jwherer is tIme itenaliomn mmuirniser.
TIme aimove mnppromuch restuits un mm pressureequal to 1.9031 MPa, for the next step. The
iteruutiomn convergesto,
1.9458MPa
071716
‘I’he cstiummalcdvaluneby lhc 1_ce-Keslerequmulioum, Eq.( 1.10), is 1.936 MPa.
The cubiceqnummtmonr at tine mmt,ove pressureis asfollows,
Z’-0.9468 152Zm
+0.2337603I Z- 0.015562=0
with thefollowing roots:
Zu’~0.60089Z,=0. 10958Z,=0.23634
Rejccnnmngthe ummlernsnedimuteroot, amdcmmlcoilalinrg tine mrmolar volume, Eq.( 1.5), we obtain,
v=ZRTIP Vu=0.22362mmm’/kgmnot v”=l.22623 nm’/kgmol
‘Fire volnumnme shift fusr unonmmmml Irexanneis cmilctmlmuied, Fq.(4.35),ums,
c=S,.ts=.t).0l478xt).It)8539=.0.0()lt’u04 mns’Ikgmol
wtnucin resullsin tIre knlkswinng correctedummolar volunnes,i~q.(4.3I),
v.=~=0.22523ns’/kgnmol v’~”=l.2279m’/kgniol
TIre demmsmtiesof tIme suutuuratedplmasesare:
p=M/v p’—)826 kg/nun’ p5
=70.IRkg/nun’
1’Ine unmeasuredvmuluues, Figure 1.5, more p=423, and pV=72
kg/mn’. The modified Rackeitequation,Eq.(I.12),predictsasaturmmtedliquid densityof 424.3kg/rn’.
4.2.2 ‘lhm’ee-Parameter EOS
A two-paranmelerEQSpredictstine susmmsecritical commipressibilityfactor,Z~,for all sumbstances,i.e. 0.307 ammd 0.333by PR mnmsd SRK respectively,whereasZc varies within a rangeof 0.2 to
146 4. Equuatiunru.c unf.Stuuta’ 4,2. ( shun !qunatnuu,u.cof State 147
0.3 for hydrocarbons. Although the inaccuracyof predictedvolummmmemit thecritic,sI point, trot wlrere mi is lIne critucalcomsnpressibililyfumctor, as predictedby Eq.(4.39),and is relatedto thenecessarilyleads to unreliable volumetric data at all conditions, it dcisionstruites tlnc correlatingparuuusletcrq. byinflexibility of two-parameterEQS for matchingboth time vapour pressuremmmd volunrme. ‘FIreinclusnonof a third parameterrelaxesthe above liminmmtismi. ‘fIre tlnird parumumuetcris gcnrerunlly ii = I / 13 (I + q(o)[ (4.42)determinedby employingvolumetric data.
mmmd q. defnmmedasb/vt, is tIne sminallestpositiveroot (sf lire following equation,Sc)nnmidt- We,izelEQS(SW)
(6m+ l)q3
+3q2
+3q- I =t) (4.43)Figure4.3 showsthe deviationof liquid density at T
1=0.7 predictedby SRK mind PR for mm
numberof pure substances.Note that SRK is more reliable for suuhstanrccswitlm smnmmll witlm an approximnsuntevalue of,acentric factors,whereasPR gives reliabledata for conmrpoundswills urcentric fmuctosrs umrotnnmd(1/3). Basedon the aboveobservation,and amn error analysisof tlue genscruulEQS. Eq.(4.9), = 0 25989 0.0217(0+ 0.00375(02Schmidn and Wenzel [30] incorporatedthe acentric factor as the tlnird pumramnneterin tIreattractivetermas, Sclrnnnnuit umurd Wcmni.cl selecteoltIme sumnluc fosrurn of a mrs proposedby Soave,Eq.(4.23), html
curium.’Ianed, inn. w tIm I Inc mcemrtmc lunclu nr un rd reoltucedIcunuperatuireby msmatchingvuipourpressureP = RT / (v — b) - a~a/ [v
2+ (I + 3m) by - 3mb
2] (4.39) (luntun of ~nnrccomsmpnsunmds.
Substitutingacentric factor valuesof zero and ~/3
in the Scbnmsmidt-Wenm7,eIEQS (SW) will urn mm1
= mnnn + 0.01429(STr - 3mm,, - 1)2 form� 0.4 (4.44)reduce it to SRK and PR respectively,where theseequationspredict lIne liquid demmsityreliably. SW can,therefore,be considereda generalform sfSRK urnd PR. nnu no
2= m,, + 0.71 (‘r, - 0 779)2 form� 0.55 (4,45)
wlsere,20
o non, = t).465+ 1.347w- 0.528os2 for (0 � 0.36710
tO SRK ~O 0 nmi,,=0.536l +0.9593w form>0.367100
0
0 mmmd for unmtcrmsncdiumtevaluesof 0.4 < ons <0,550000 I
I mrs =[(0.55 -cm)) / 0.15) inn1
+ 1(w-O.4)/0.51 m2
(4.46)• ISC • PR
> -~ ~ For supercriticalconsupotunds,
cx = I - (t),4774 + 1.3280))In T~ (4.47)
-20 ‘ ‘lIre nmrclumsiots of m in EQS as tIne Ilsird paraunneterby Schmidt and Wenzel resultedin a00 0,1 02 03 0)4 I vumrimmhmlc calculatedcritical cornurpressihility,accordingto the value of acentric factor. The
AcennmncFzucnor I predictedvaluesare, inowever,mihout 15% hmigimerthan tine true valumes. This wasknownto theumutlrors, Isut wmrs uuccepted as tIre pricefor an overall optimumaccuracyin predictedvolumes,
Figure4.3 The deviationof predictedfromn nseasuredliquid demmsity by SRK uund PR [30). Sunhslituting um=(I+3cn))h. andW2
=3(n)h2
in tIme generalisedEOS,Eq.(4.i2), will reduceit toSW.
The authorsused theboundaryconditionsat thecritical point. Eq.(4.9) ts determineuse,and Patel-TejaEQS (PT)b,as,
t’mmtcl utund l’cjui [31[ mnnodilmed tIre attractiveternr by incltndiumga moreflexible third parameter.R’T,
2I c, mrs.
a~ ~‘, 1~ac= [I - 51(1 - qfl3
(4.40)P
P = RT / (v - h) + a~a/ (v(v + h)+ c (v - h)] (4.48)
b = ~ ~. = ~q (4.41) wheretIne paramrmeterc is definedby,La,,
148 4. Equations of State 4.2. Cuthic Equation.s ofState 149
c=Q cPc
v”” = v+ö.
(449) nu = 0 for Tr> I
Time uthovecorrelationsweredevelopedby matchingpredictedand experimentaldata without
dan, being restrictedby time conditionsmit thecritical point, Eq.(4.9). This appearsto he a major
step mr igusoring time muctumul behmmviourof puire fluids in favourof anoverall improvementimm
= I - 3~ , (4.50)predictedvaslucsby EQS. It has,isowever,acimievedits objectiveasdemmmonstratedin Section9.2 wimeretime pcrforimmanceof variousequationsareconmpared.
1 is an adjustedcritical compressibility factor, determinedby nmatcImingthe predictedaisd The volumeshift conceptcanalsohe applied to three-parameterEOS. The improvement,ifmeasuredsaturatedliquid densities. It wascorrelatedwith tine acentric factoras. any, will beexpectedto heminimsnal,astime saturateddensitydatahave beengenerallyusedto
deternminetine third puiraimmeter. It was poimmted ount, imowever,that the prediction of these
= 0.329032— 0.076799w+ 0.02119470)2 (4.51) .
~C(ltimutim)mss deterioratesnear time criticuul point. Timis deficiency can hc correctedusing timeaupproumchdescribedby Eq.(4.37).hut witIsout including theconventionalshift, C.
The authorsfoundthat theuseof true criticunl com’npressihilityfactorwill resuult iii theoveruslIlossof accuracyin predicteddensity,aconclusioumalsoreacimedby Sclmmsmidtumird Wcni.cI.
.
Applying theconditionatthecritical point,Eq.(4.9), theothercoefficientswerederivedas,
‘1 2 2 3+ (2 - 351)~h + 3~
1~h-1’ = 0 (4.52)
‘fire muhovecorrectioncmrmm he mmppiicd to VPT, hut thedistaisceparameterA is not zero at thecriticuml poimmt, asVP’l’ doesmcml smmtisfy time houmndarycomsditionof Eq.(4.9). Hencea correction
.
~b is takenasthesmallestpositive rootof theaboveequationwith anapproximatevalueof
tcrns for time distancepumrammmeterneedsto he inclumded[34).. -
Time dimensionlessdistancegiven by Eq.(4.38)representstheapproachto thecritical point
= 0.32429~- 0.022005 (4.53))
for pure fluids. Its extensionto multi-componentsystems, however, is questionable.Fuurthernsorein nmost reservoir engimmeeringproblems, the critical point is approachedby
and.
coimnpositionuul variations,and not by changesof pressumreand temperature. Hence,all thestatepointsalongthepathhavediffem’ent compositionsanddifferent critical points.
~ac = 312 + 3(1 -2
51)~h+ ~b2
+(l 3m’1) (4,54) An alternativedinnucunsionlessdistanceto the critical point, which is as valid for variable
The Patel-TejaEOS (PT) reducesto PRor SRK by substituitingthevalue of 0.307,or 0.333for ii, respectively. Note that thesevalumesare predictedby the two equationsmis lime criticalcompressibilityfactorsfor all substances.Hence,PT canalsobeconsidereula generalformof SRK and PR which will reduceto either of themn at their prevailing constantcriticalcompressibilityfactors.
,
.
~.
compositioncasesis the relativevalue of theequilibrium ratios of the mixturecomponents[34]. At thecritical point, all K-valuesareequal to one, hencethe proximity to (lie criticalstuste cumn heexpressedhy.
A = (Kt/Ktn) - I (4,61)
.The temperaturedependencyfunction of (he attractiveterm in PT is similar to Ihat proposedby Soave,Eq.(4.23). The authorsdeterminedirs, usmng time vapouur pressuredata of purecompounds,andcorrelatedit with theacentricfactor,as,
whereKi, aurd KIm aretime equiIibriumsm ratiosof the lightestandthelmeaviestcomponentsof themixtureat mummy statenoint,.
Figure 4.4 showstine insmprovemnentiii predicteddensityof a binary mixture by including the
m = 0.452413 + 1.30982w- 0.2959370)2 (4.55) ,
nearcritical corrections[34] in VPT. Both definitions of the distanceparameter.i.e., thepressurederivatives(PC), andtheequnilibriumratio (KC) havebeenused.
Substitutingu=b+candw2
rrcb in thegeneraiisedEQS. Eq.(4.I2),will reduceit to PT.
ValderramaandCisternas132] and later Valderrama[33] modified PT by using the criticalcompressibilityfactor,Z~,to correlateits parameters, .
~
It sinould benotedtlnmml time inclusion of variabledensitycorrectiontermin EOSchangestimepredictedequilibrium conditiomms,contrary to the constantvolume shift, and increasesthecomplexity of thematlsematicalexpressionsof thefugacity coefficient. Hence it is advisableto useit only for adjustingthepredicteddensity by theoriginal EOS,insteadof including itmnEOS.
~ac = 0.66121 - 0.76l05Z~ (4.56) 4.2.3 Attractive Term Temperature Dependency
= 0.02207+ o.2o868z~ (4,57)I
As imsdicatedby Wilson [35]. a reliablepredictionof vapourpressureof pure compoundsbyamy EQS is a prerequnisitefor its reliability in estimating vapour-liquid equilibria of
0.57765- i.87080Z,, (4.58).
I mmsuilticoumnponcntsyslenms. Tlmis lsuus beenachieved,alnsostwith no exceptionin all recentmrmodificmutiomnsof vdW, by adjumstiusgtime relationshipbetweena mind the reducedenmmperature
m = 0.46283+ 3.58230wZ~+ 8.I9417(wZ~)2
for T~<1 (459) to mmnmrtch tise vunpourpressuredata.
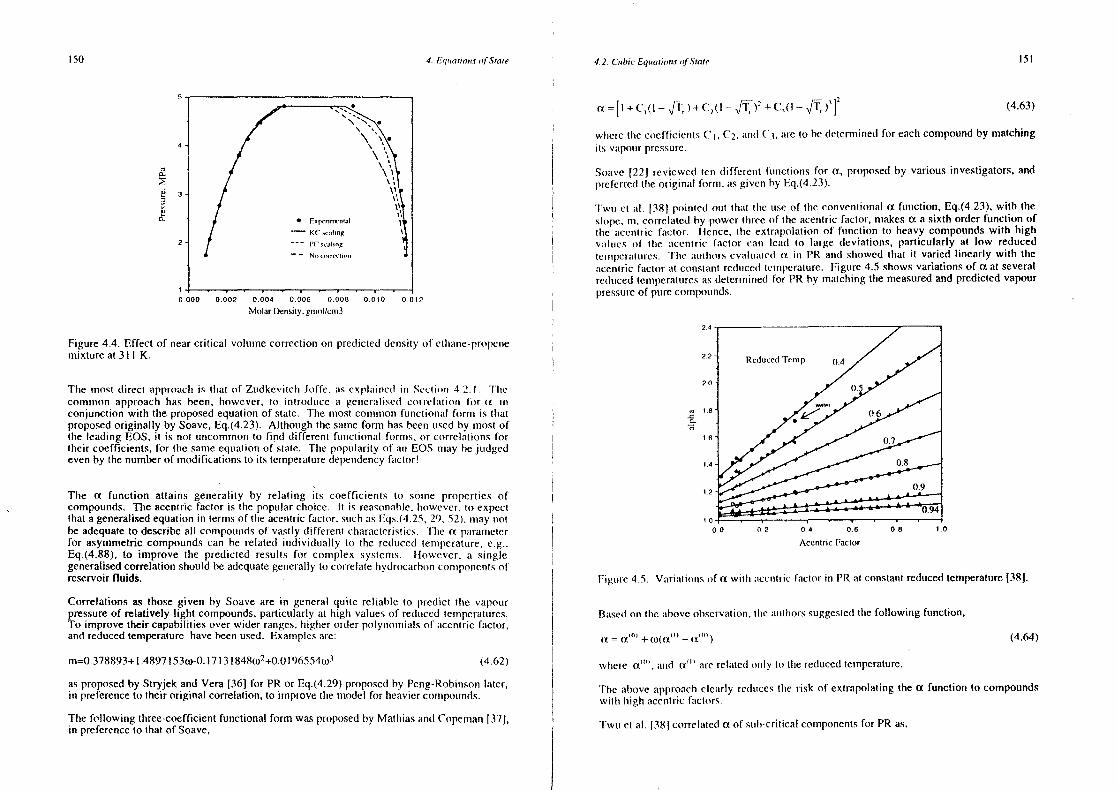
150 4. Equa:no,u.s ofStat,’ 4.2, Cunbic Equaiionus ofState 151
0,
a
2
0.000 0.002 0.onO 0.0n 2
Figure4.4. Effect of nearcritical volumecorrectionon predicteddensity of etlrurmmc-propcuremixtureat 311 K.
lime most direct approaclnis tlsuut of Zudkevinclm-Joffc.mis cxplmninrcd inn Sectinnmn 4.2. I. ‘tInecommon approach has been, irowever, to imrtrodsnce mm geircrumlnscdcosmn’elmmtnomn fnsr a mumconjunctionwith theproposedequationof state. Themost consussonfumnctionmumi form is thatproposedoriginally by Soave,Eq.(4.23). Although thesameform hasbeenusedby mostofthe leadingEQS. it is not unncommonto find different funirctionuml formirs, or correlationsfortheir coefficients, for the sameequationof sturle. Time popularity (sf an EQS nmnmmy he juidgcdevenby thenumberof modificationsto its temperaturedepenmdencyfmsctor!
The a function attains generality by relating its coefficients to sonnme propertiesofcompounds.The acentric factor is thepopular choice. It is reasonable,however,to expectthat a generalisedequationin termsof theacenmtricfactor, sunchasEqs.(4.25,29, 52).may notheadequateto describeall conmpoummndsof vastly different characteristics. I’iuc a pmumanssctcrfor asymmetriccompoundscan he related individually to the reduced tem’umperature,e.g.,Eq.(4.88). to improve the predicted results for complex systems. However, a singlegeneralisedcorrelationshouldbeadequategenerallyto correlatelsydrocarhsnconmmponcntsofreservoirfluids.
Correlationsas thosegiven by Soaveare in general quite reliable to predict tlre vapourpressureof relatively light compounds,particularly at high valuesof reduced tctrmperatures.To improvetheir capabilitiesover wider ranges.higlmerorderpolymxsmmmialsof uucentric fumctor,andreducedtemperaturehavebeenused. Examplesare:
m=0.378893+i.4897l53w-0.17131848w2
+0.0l96554co3
(4.62)
asproposedby Stryjek andVera [36] for PRor Eq.(4.29)proposedby Peng-Robinsonlater,in preferenceto theiroriginal correlation,to inrprovethe muodel for Ineaviercomrmpotunds.
a = ~i + C,(l — ~‘l~) +C,(l — ~)2 +C,(l — ~)5]2 , (4.63)
where tIre cosefficicmrts C1
, C2
, and (~,areto he determined for eachcompounmmdby matchingits vump(surpressure.
Somuve [22] reviewed lemm differemmt functions for a, proposedby various investigators,andpreferredtheoriginal form. asgivenby Eq.(4.23).
‘l’wtn ci url. f 38} poimmlcd out mhmmt hue useof lIre conventionala fuumction,Eq.(4.23),with theslope,on, correlatedby power tirrcc of lIre acentric factor, makesa a sixth order functionofthe mucentric furctor. ilence. the extrapolationof function to heavy compoundswith highvumltncs of lIne unccntric factor earn lead to large deviations,particularly at low reducedIc unnlsemmultin’cs. ‘tIme mount hors cvmml ummntcd a in PR aurd showedthat It varied linearly with timeutcentricfactor mmt constusntreducedtcnmspcrature. Figure4.5 shows variationsof a atseveralredsucedtemmmperatumrcsasdeteruirinedfor PR by nmmatching thems’ieasuredand predictedvapourpressureof purecomnsposmnds.
Figuire 4.5. Variatinrnmsnsfa witlm muccurlric factor in PR at constatrtreducedtemperature[38].
Bussedon tIme aboveobservation,theautlmorssuggestedtime following function.
a= a” + co(a’’’ — a’°’) , (4.64)
whmere a”, mmnnd a’’’ mire relatedonmly to tIne reducedtemsmperature.
Tlmc aboveapproaclmclearly reducestIre risk of extrapolatingthea function to compoundswit Ir Irigim umccnstric factors.
us
a-C,
• F.xperunueona)— XC ucanung
— — — n’C sc.uhuug— — N,,c,,nc’u’I,o,,
0.004 0.006 0.008Murlar Densiiy,gumvrl/cnn3
00 0.2 04 0.6 0.8 1.0
Acenriric Facior
The following three-coefficientfunctional form wasproposedby MathiasansdCopeman[37],in preferenceto that of Soave, ‘rwun etal. [38] correlateda of stmh-criticalcomponentsfor PRas.
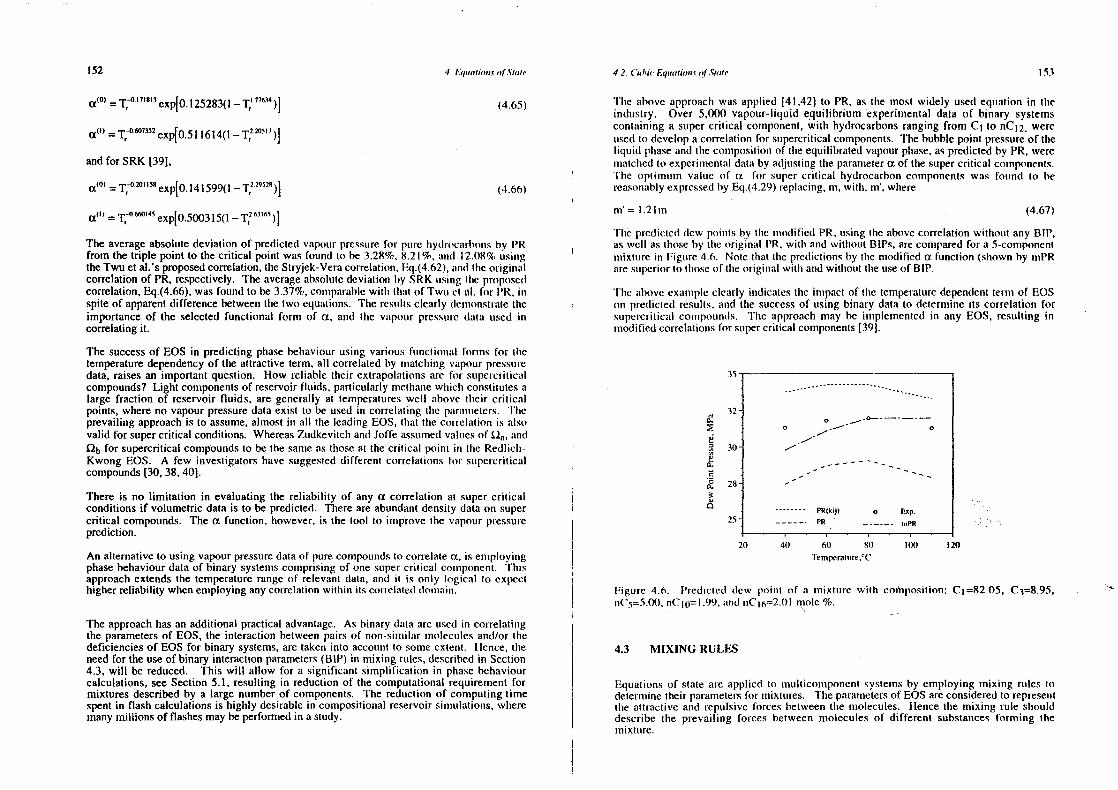
152 4. hqunatnomn.c of SlaIn’ 4.2. (‘un/ui,’ Eqniation.s of Stair 153
atou= T,~~i7n8u3exp[0.125283(1— T ~‘~‘° )~ (4.65)
a0) =T~°”~exp[0.511614(1_T,aasmml)J
andfor SRK [39),
amom = T~o.20nussexp[O141599(1— T,229526
)] (4.66)
a~mu= T,”~°m45
exp[0.500315(1 — T~6Suss)]
The averageabsolutedeviationof predictedvapotnr pressurefor pure hydmrcarbonsby PRfrom the triple point to thecritical point wasfoundto be 3.28%,8.21%, msnrd 12.08% usingtheTwuetal.’s proposedcorrelation,theStryjek-Veracorrelation,Eq.(4.62),amid time origin~mlcorrelationof PR, respectively.The averageabsolutedeviationby SRK usitmg the proposedcorrelation,Eq.(4.66).wasfoundto he3,37%,conmpurrabicwills thatof Twu Ct mil. for PR. inspiteof apparentdifferencebetweentine two equations.The resultsclearly demonstratetheimportanceof the selectedfunctional form of a, and lime vmipour pressuretiusta tused incorrelatingit.
The successof EOS in predictingphasebehaviourusing various functiommuni forms for timetemperaturedependencyof the attractiveterm, all correlatedby mruatchingvapourpressuredata, raisesan important question. How reliabletheir extrapolationsare for supercriticumlcompounds?Light componentsof reservoirfluids, particularly methanewhichconstitutesalarge fraction of reservoirfluids, aregenerally at temperatureswell mthovc tlmeir criticalpoints, whereno vapourpressuredataexist to be usediii correlamiing the pmiruumnuelcrs. limeprevailingapproachis to assume,altnost in all the leadingEOS,tisat time correlationis alsovalid for supercritical conditions,WhereasZudkevitchandJoffeassumedvalumesof ~a’ and
~b for supercriticalcompoundsto be the sameasthoseat the critical point in the Redlicis-Kwong EOS. A few investigatorshavesuggesteddifferent correlationsfor supercriticalcompounds[30, 38,40].
There is no limitation in evaluatingthe reliability of anya correlationat super criticalconditionsif volumetricdata is to bepredicted. Thereareabundantdensity dataon supercritical compounds.Thea function, however,is the tool to improvethe vapour pressureprediction.
An alternativeto usingvapourpressuredataof purecompoundsto correlatea, is emmsployingphasebehaviourdataof binary systemscomprisingof one supercritical component. Thisapproachextendsthe temperaturerangeof relevantdata,and it is only logical to expecthigherreliability whenemployinganycorrelationwithin its correlateddomsmain,
The approachhasanadditional practicaladvantage.As binarydataareusedin correlatingthe parametersof EOS, the interactionbetweenpairs of non-sinnilarmolecumlesand/ortinedeficienciesof EOS for binary systems,arctaken into accountto someextent. Hence,theneedfor theuseof binary interactionparameters(BIP) in mixing rules,describedin Section4,3, will be reduced. This will allow for a significantsimplification in phasebehaviourcalculations,seeSection5.1, resulting in reductionof the computationalrequirementformixturesdescribedby a largenumberof components. The reductionof computingtimespentin flashcalculationsis highly desirablein compositionalreservoirsimulations,wheremanymillions of flashesmaybeperformedin astudy.
l’ise above approachwasapplied [41,42)10PR, asthe most widely usedequationin theindustry. Over 5,000 vapour-liquid equilibrium experimentaldataof binary systemscontaininga stipercritical compomment,with hydrocarbonsrangingfrom C1 to nCl2 wereumsed to developa correlationfor supereriticalcomponents.The bubblepoint pressureoftheliquid phaseand thecompositiomrof tIme equilibratedvapourphase,aspredictedby PR,werematcimedto experitmientaldata by adjusting theparansetera of thesupercritical components.The optimum value of a for suiper critical hydrocarboncomponentswas found to hereasonablyexpressedby Eq.(4.29)replacing,m, with, m’, where
m’=l.21m (4.67)
Time predicteddew poimmts by time tmnodified PR,using the abovecorrelationwithout any BIP,aswell asthoseby the originuil PR, with amid ~vitimoutBIPs,arecotnparedfor a 5-conmponentmmsixttmre in Figure4.6. Note that tire predictionsby lime nmodified afunction (shownby rnPRaresuperiorto timoseof theorigimsal witim andwittmout time useof BIP.
‘Fhc mmhove cxaimmplcclcumrly indicatesthe immmpact of tIne temperature dependent term of EQSon predictedresults,ammd the successof using binary data to determineits correlationforsupercriticalcompoummds. The umpproachmay he immnplemnentedin any EOS, resulting inmodifiedcorrelationsfor supercritical components[39).
.5)
320
0 .-“ 0
30
28 — —
PR(kijl a Eng.25 . Pro ..,._._.
20 40 60 81) 100 120Tempcranure.~C
Figure 4.6. Predicteddew point of a mixture with composition: C1=82.05,C3=8.95.nCs=5.00,nCj~p1.99. mind nCl6=2.Ol mole%.
Equationsof state areapplied to multicomponentsystemsby employing mixing nmles todetermitmetheir pam’arnetersfor mrmixtumres. Theparametersof EOSareconsideredto represeumttime attractiveand repulsive forcesbetweenthe tiiolecules. Hencethe mixing rule sisoulddescribethe prevailing forces betweenmoleculesof different substancesforming themixture.
a-
a-Ca0~S0
4.3 MIXING RULES
1 54 4. Equnation.c ofState 4.3. Musing Run/es 155
4.3.1 Random Mixing Rules a = ~ . a,)°’ (4.73)
As pointed out in Section 4.1, the coefficientsof virial equmation (Eq. 4.1) describe timenon-ideal behaviourof a real fluid due to interactionamongst various comnmhinatiomssofmolecules. Statisticalnsechanicscanbeemployedto derivemiximmg rules for lIme coefficicnmts h = ~ x I’m = ~ (h + h )/2 = ~x h (4.74)of virial equation. It can bearguedthat the nsixing rule tnsed in umny EQSshounld attaimm tine , ‘ , q , ‘ usameform asthatof thevirial equationat conditionswisereboth equationsurre vuulicl.
For gasesat low pressures,the third and higher virual coefficmemilscan he mncglecled. Tbse A mnmixiurg rule simmnilar Its tlmmrt of h is alsoused for otlmerpumrametersin EOSthat containmoresecondcoefficient,which representsthe interactionbetweentwo neighbouringmolecules,is than Iwo parameters,wlsen theadditional parammsetersareof theco-volumecharacteristic,sufficient to describethevolumetric behaviour. Tine mixing rule for tine second coefficient,B, is of thequadraticform,
c=~x,c, (4.75)
B=~~x,xB, (4.68)Sinnunhmmrly, tIne mmtsunvc mnnolmmr nnrixinng ruulc is’,rlso umsed Err auxilmuury paranreterssuich as tInevsl mm nrrc crrrcct mum , er,. dcfi mmcd mr I ~qs.(4.37). ‘tIme suggestednmsi x inrg rmnle for tire aeermtric
wlmereB1~
is thecoefficientdueto interactionbetweenurroleculcsm mmmd j. tmuctmr, usedmrs lIre tlmird pmmrmummuctcn ins tIne Sclmnrmidt-WcnrzclEQS.by theauthorsis,
EmployingEq.(4.I), thesecondcoefficient is deternsinedas,On) ~ (4.76)
B=Iim(aZ/ap)
l’ime urhove mixing rules, known astire vandcr Waalsmimixing rules,treatall thecomponentsUsing a van der Waalstype equationto describeZ at low pressures,tIre above equation similuurly, imence, referredto astime random nnixingrules. For reservoirhydrocarbonfluids theresultsin, random mixing rules (whicim oumly considertime interactionbetweenpairs of neighbouring
mrroleculesmmd neglectinteractionsbetweenthreeor moremolecules)areadequate.B = lim(dZ/~p)=b—(a/RT) (4.69) .
p-.O It is comssmonto incorporateair additional parameterin Eq.(4.71) to expressthe attractivetermms betweenpairsof nnomm—simssnlarimmolecules,
hence,the mixing rulesfor a and b, at leastat low pressures,shouldhe compatiblewitlmthat in Eq.(4.68). i.e., it shouldbeof quadraticform. a,, = (a,a,)°
2(l— k,,) (4.77)
The attractiveforcebetweenmoleculesi andj. representedin EQSby paranmneter.aij. whichis of anenergynature,can beexpressedin a simplegeometricaveragefornsr [43] as, wlmere k
1~is kirown mus tIne hinurry interactionparameter.
a, = (a a,)’’1
(4.71)) tJsinnghIre umbove descriptions,lIme rumnrdomnsmixingrule of theattrachivetermbecomes,
‘lime repulsive force betweenmoleculesi andj, representedin EOS by parulmsreterh11
. winch a = ~ x (a a )~(l — k ) (4.78)hasthecharacteristicof volume,canbedeterminedby arithmmmetic umverage, ‘ , , ‘ ,
hnj = (b1 +h~)/2 (4.71) TIne cisc of lsinary insteractionparaunneterfor the repulsive term, particularly in mixtureswith
Imiglu conscentratiounof C02 [44i, lsas alsobeensuggested,but hasnot gainedpopularity,Eqs.(4.70)and (4.71)describingthe interaction betweena pair of differennt msmoleculesarensore intuitive thanrigorous. Otlmer forms,perhapswith equally valid argunirents,catsuslsobe b~= Rb +h,)/2Rl-k’~p (4.79)considered, For example,consideringthe distancebetweenthe two molecules,immstcadofaveraging their volumes results in. wlnerc k’~
1are the repulsive BIP.
h’’ + h” ~ ‘l’lre binary intermuchionparaummeter(RIP) is generallydeterminedby minimising thedifferenceb = ‘ ‘ (4.72) I betweenpredictedanmdexperinmnentaldata,nnainly time saturationpressure,of binary systems.
2 A RIP slsotnld,mherefore.he consideredas a fitting parameterand not a rigorousphysical
ternnm. ilenmce, tIre imnterumction paramsnctcrsdevelopedh’or any EOS should generallybe usedApplying thequadraticmixing rule for the parametersof EQS , we obtain, only for that EQS.
156 4. Equoiion.c of State 4.1. Mixing Run/es 151
.S’oInitnon:
l’hc fnngmmcity coelficicustis cuulcuilmmted fnssnnn Eq.(3.3I),
lui~=~-J ~ -RT/V dV—InZR’l’ v ~mr
1)r.v.,,,,,
Is = ~lii
We obtain.
msRT n2mm— V_mlh(V+~nimb)(V+~,tsh)
‘~
~~ )T.VM,,,
n2a= ~ ~n2x1x~a,= ~ ~nn5a~i~u j~u i~n
where, ~ and. ~2. are constantsequal to I and0 in SRK, and Ii’ ~ and i-~J~in PR,respectively.
Provethat thefugacity of eachconnponentin a mixture,usingtheaboveEOS andtherandommixing rules is givenby,
lno~=~-(Z- l)-ln(Z-B)-
(E4.5)
As the effect of third and highermoleculeson the interactionbetweentwo moleculesisassumedto be insignificant,thebinary interactionparameterso determinedis coissideredtobevalid for multicomponentsystemstoo. The interactionparanmetersbetweenhydrocarbonswith little differencein sizeare generallyconsideredto he zero,hut the valuesof k1~fornon-hydrocarbon-hydrocarboncomponentsandalsolight-heavyhydrocarbonsarenon-zero.Valuesof BIP for theEOSdescribedin Section4.2 aregiven in TablesA.4 in Appendix A,wherek,~= k~1,and~ =0.
Correlationsto estimateBIP for specificEQS, suchas SRK[45] andPR[461, as well asgeneralones[47,48,49)havebeensuggested.Themostcommonlyusedcorrelation[47] is,
2(vn/avuhl) ~k11 = 0, I — ~ + ~ (4.80)
wheretheconstants ~ and0, aredeterminedfor cadsEOSusing time availumhlebinary data,oradjustedin tuning of EOS for a particularfluid system,aswill be describedinn Section9.3.A default valueof 0=6 maybeused[50).
Thereis no doubt that theinclusion of binary interactionparametersin EOSmixingruleswillprovidesmoreflexibility, and in most casesreliability at leastwithin a limited workingrange. It is particularly a powerfultool to tune (calibrate)EOS for a reservoir flumid againsttheavailableexperimentaldata. Additional flexibility canalsobe obtainedby makingBIPtemperature[46], pressure[51], andcompositiondependent[521. It shosuidhe notedthatmaking BIP dependenton pressureor compositioncausesadditional comnmplexity in theexpressionfor fugacityof eachcomponentasthepressurederivativesin Eq.(3.3l)areonly atconstanttemperatureandtotal volume,andnot at constantpressureorcomposition.
The flexibility achievedby inclusion of BIP, particularly variable ones,can he quitemisleading,asexcellentresultscan be obtainedfor binary systeumis. That, however,onlydemonstratesasuccessfulcurvelilting. Theresultsfor mumlticomponentsystemnsparticularlywithin wide ranges of temperatureand composition may he quite disappointing. Acomparativestudyof tenEOS[53] indicatedthat thePatel andTejaequationasmodifiedbyValderrama,without any BIP was more successfulin modelling of the phasebehaviourofreservoirhydrocarbonfluids than otherswith BIP. An improvement in EQS or a morethoroughfluid characterisationshould reducethe needto useBIP for hydrocarbonfluidswhich do not contain compoundsof vastly different characteristics. An exampleonimproving EOS instead of using BIP was shown in Figuire 4.6. TIne reduction ofcomputationaltime for flashcalculationsin tine absenceof BIP will he describedin Section5.1.
The applicationof mixing rules in EOS, will allow tine calculatisnof commaponentfugacitycoefficients, as given by Eq.(3.3l). The expressionfor fuguucity coefficietst, using thegeneralisedEOS, Eq.(4.I2),andtherandommixing rules is givenits the Appeirdix C.
Example4.5.
The Soave-Rediich’Kwong,andthePeng-RobinsonEOS arethemostwidely usedequationsin thepetroleumindustry. It is commonto expresstheseequationsby the following generalform,
~RT a
v—b (v+3,b)(v+~2b)
wlnere V is the totmul volume. ilence, theequuumionof stateis written in termsof total volutnreby suhstitcutimmgv=V/us, wheren is thetotal numberof nmshes,
(3.31)
The derivuutivcof pressureat eonstuuumttotmml volunmme,pressureand all mole numbersexceptn,is calculatedas,
— RT + nR’l’[nJ(mmh)/an1
] ~(n2
a)/an(n2
a) +
— V — bin (V — nmh)2 (V + ~~umh)(V+ ~2nh)
{~rn~s[~(nts)2/~n(mmh)2
]+(es, + ~
[(V + ~nt1b)(\”+ ~32nsb)12
Applyimrg tire rmnumdomru mnniximmg tunIcstr calculmmtea and b, Ec1
.(4.78)and Eq.(4.74)respectively,
mb = ~nx1b~ =
lime derivmmtivesof tIre two paraunnelersumre obmaitmedas,
158 4. Fq,uatioursof State 4,3, Muxnnng Rules 159
[~(nb)/~fl~1TV~, =
[a(n2a)/anjl = ~ = 2n~x~a~1
Substitutingthe abovecalculatedtermsin Eq.(3.31)and integratingit hctwcemsthue two limnninswill resultin.
ln~ =—lnZ(l—nb/V)+~~~+ ~u 2~nrum. /nuu—h /b xV—nh RT(~mö~)h 1,,
I V + mnö~h nmnVh,n V+~1
nb RTb(V+önmmb)(V+ö2
nb)
a” = ~ — x,)x,x,(a,a,)’’’
where l~j=-l~i.s tine himruury intcrurctnon coefficient for time asymnmmetricterm.
(4.82)
‘the abovemixing rule is quite flexible, partncsnlarlywmth tensperaturedependentinteractioncoefficients,andcapableof describingtIme behaviourof unulticomponentmixturescontaininghiglmly asymmetriccomnponemrt.swlsenumsedin us cubic EOS.
‘Flme tssixing rule, Imowever, is not consistentwith the quadratic form of the secondvirialcoefficient.Sclmwmurtzentruherand Rcnonm1551 have sirownthat the aboveinconsistencycanhe unvoidcd by i nit rsdnncinng ann addit isnummI lmmmrmmmmmc’hcr. y~. inn tIre generalEQS.Eq.(4. 12), as,
v—b v’4unv~w
wills I lse furl lowing nrr ix inrg rmnIc for tIre a(ldnI ionnuul parannrcterof EQS.
(4.83)
Suhsnituting
—an2
nRT= P — , i.e., theeqsuatnonof state, ansd V= nv = nhZ/B
(V+~nnh)(v+~2
nb) V—nb
in theabovewill result in Eq.(E4.5).
Non-Random Mixing Rules
The van der Waals mixing rules are quite adequnateto describeisydrocarhoumnriixtsurcs ofreservoirfluids. They cannot,however,representthe interactionbetweenlsydrocarhomnsandasymmetriccompoundssuchaswater,or methanolwhich is oftenaddedto reservoirflumids asa hydrates inhibitor. Although additional flexibility that is achievedby increasingtimenumberof coefficients in binary interactionparameters,may provide acceptableresumEsforbinary nmixtures containing these compocmnds,tine model cans fail conrupletely formulticomponentsystems[541.
The assumptionof randommixing in systemsc(ntumining higtmly polar mund asymmrmcnriccompoundsis not justified as the existenceof pam’ticsular forcesbctwccmm snrnrnc unsuslecculcs,such as thosedue to permanentdipoles, may restult ins non-unmiform distrihcutiomm unt tImemolecular level. Local composition mixing rules addressIlmis beImavitsuir by rclmmtitrg lireattractivetermin EOSto compositionwith a higherorderpolynromialsthats quadratic.
Themajority of mixing rulesfor theabove termcanbe representedby thefollowing form,
a=aC+ a’s’ (4.81)
wheretheattractiveterns is separatedinto two pumrts. use, wimich is tire conventionsalraurdoms’s
mixing termgivenby Eq.(4.78),and~ which is,tlme asymnmns’retrictcrn’m clime to polarity.
Variousexpressionshave beenproposedand successfullytestedto himsumry systcmsrsbr tIneasymmetricterm. Schwartzentruherand Renon[55] havesimown that most of them can heexpressedby thefollowing generalform,
= ~
andtime conventionalrandommixing rulesfor theremainingparameters.
(4.84)
l’lse mmhove mmmodification sahisfiestine mixing rules of the virial coefficients,as ajj expressestheinteractionbetweentwo nnoleculesby a quadraticform, andXujk representstheinteractionbetweenthree moleculesby a cunhic form, similar to parametersof B and C of time virialequation, respectively. It also appeurrs to have mmnaimntained the dependency of the attractiveternim to powerthreeof concentrationrcqsmiredby the localcompositionmixing rule,
a” = X/(v — b) = (~~~,x,x,xkx,k)/(v — b) (4.85)
‘the utboveeqsummtion bussically beionsgsto a classof mixing rules, known as the densitydepemmdemmtmixing rsnles. Time asymmmnmelricterm becomesnegligibly small as the pressuremrpproachies 7.ero, with time voltumne uuttaimring a largevalue,reducingthe mixing rule to theconmventionalramsdourrmrmixing rule amsdconsistentwith that of thevirial equation. Thecubicformmn of conscentrmmtinrnis, inoweverdeceiving, asthe volumme of a mixture dependson thecomrccnstrmutionof its conmrponcmrts,tummtcsstheir partiuul nmnolarvolsmmesarevery sinmilar, wimicheI’fcchivcly reduceslIre asynnmnssctrictcrumm to mm qtmurdrumtic forum [55j. This hasbeenobservedinprunctice by varioums immvcstigators [56,57). It is perlmaps a sounderengineeringpractice to usennnixing rumles of lire type of Eq.(4.82).arrdnot hequite consistentwith thevirial mixing rules,tlmamm lose reliahilily of resultsby adherimmgto them.
TIne mixing nile, Eq.(4.82),with time cubic dependencyon compositionsuffersalsofrom theinvariance condition 1581. that is, if one of the componentsis divided in two or morecomn’uponenmtsidentical to it, differemmt expressionsfor tire attractiveterm are obtained, Thisdefect is of practical insterestfor umnixtures containingsignificant amountsof very similarcommlponenhs. Matiriaset al. [59) testedthe mixing rule of Panagiotopoulosand Reid [60],wlmiclm is of ur fornrs simmsilar to Eq.(4.82), amid demonstratedthat this deficiency causescnrssmnemrmmsprcdictionrsof wmmhcr soluimility in henzcume-cyclohexanennixture. ModificationsoftIme cunhic mnmiximmg rules ho avoid this deficiency for mmmulticomponentsystems.,whilst reducingtisemto tIne samm’se formms asEq.(4.82)for binary systetmis.havebeen~roposed[55.59).
Avlonitis et al. [57], proposeda mrmixing rulesimilar to Eq.(4.82)asfollows:,
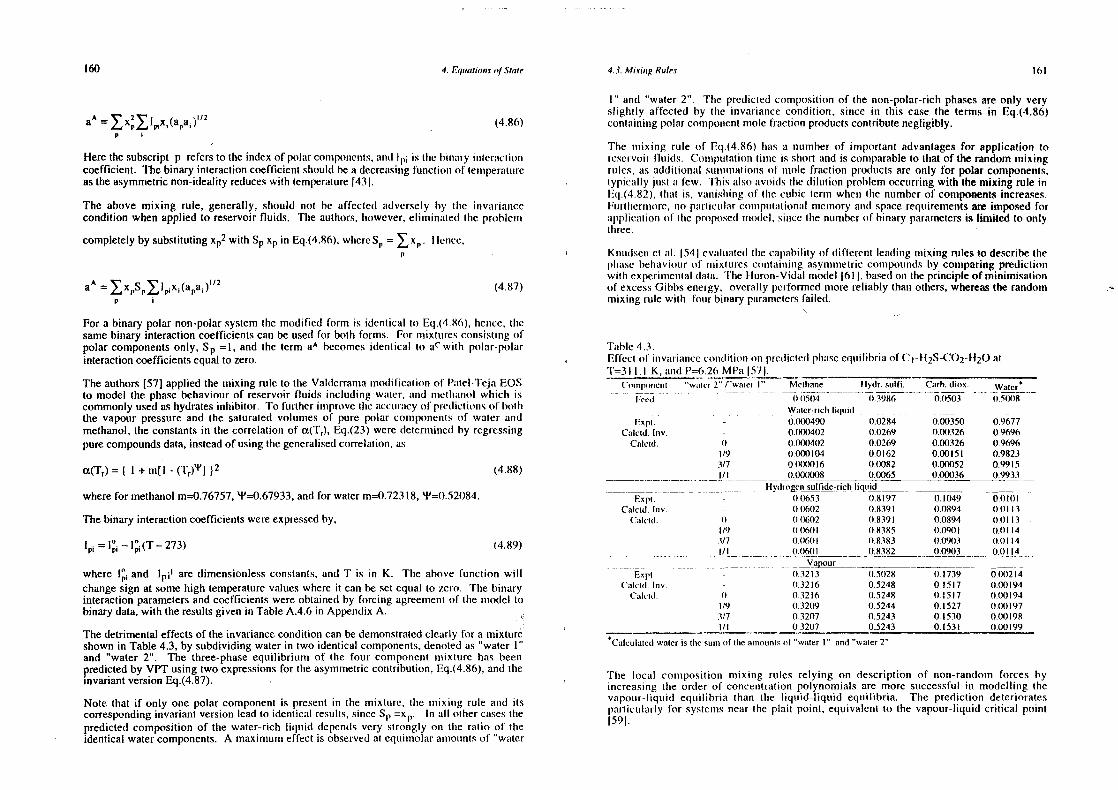
160 4. Fqunasionn.r a/Stale 4.3. Miximig Rides 161
aA = (4.86)
I-Iere thesubscript p refersto theindexof polarconsponcnls,amrd is tine biurmury iustcruictioncoefficient, Thebinary interactioncoefficientshouldbea decreasingfuimctiomm of temmnperattureastheasymmetricnon-idealityreduceswith temperature[431.
The above mixing rule, generally, should not he affected uudversely by the immvmmriancccondition when applied to reservoirfluids, The authors,however,eliminmutemi lIme prohletmi
completelyby substitutingxp2
with S~,Xp in Eq.(4.86),wimereS~= ~ ilcmmce,
aA =
P
(4.87)
For a binary polar-non-polarsystemthe modified form is identical to Eq.(4.8(r), lmcmmcc, timesamebinary interactioncoefficientscanbe usedfor both forms. For mirixtures consistingofpolar componentsonly, S~,=1, and the term aA becomesidentical to aCwitlm polar-polarinteractioncoefficientsequalto zero.
The authors[57] applied themixing rule to tine Valderransamnnodificationof Puitel-TejaEQSto model the phasebehaviommrof reservoir fluids including water, mind nmnctlnmumsoi which iscommonlyusedashydratesinlnibitor. To furtlscr immnprove tine muccuummucyof pu’c(lictiounsof boththe vapour pressureand the saturatedvolunmes of pure polar commmponemstsof water andmethanol,the constantsin the correlationof a(T
5),Eq.(23) were determmminedby regressing
purecompoundsdata,insteadof usingthegeneralisedcorrelation,as
a(Tr)= (1 + m[I - (Trft’J j2
wherefor methanolm=0.76757,‘!‘=0.67933, andfor waterm=0.72318, ‘Y=0.52084.
Thebinary interactioncoefficientswereexpressedby,
I =10~ ~—l~(T—273)
(4.88)
(4.89)
where l and Ut are dimensionlessconstants,and T is in K. The abovefunction willchangesign atsomehigh temperaturevalueswhere it can besetequal to zero. The binaryinteractionparametersand coefficientswere obtainedby forcing agreementof the mmsodel tobinary data,with theresultsgiven in TableA.4.6 in AppendixA.
The detrimentaleffectsof theinvarianceconditioncanbedemonstratedclearly for a mixtureshownin Table4.3, by subdividingwaterin two identicalcomponents,demnotedas “water I”and “water 2”. The three-phaseequilibrium of the four componentmixture has beenpredictedby VPT using two expressionsfor theasymmetriccontribution,Eq.(4.86),andtheinvariantversionEq.(4.87).
Note that if only one polar componentis present in the mixture, the mimiximig rule amsd itscorrespondinginvariant version leadto identicalresults,sinceS~,=x~. In mill othercunscstirepredictedcompositionof the water-rich liquid dependsvery strongly on tIne ratio of timeidentical watercomponents.A maximumeffect is observedat equuimmiolarannotmntsof “water
I” anmd “water 2”. The predictedcompositionof the non-polar-richphasesare only veryslightly affected by the invariancecondition, since 1mm this casetire termsin Eq.(4.86)containingpolarcomponentnmole fractionproductscontributenegligibly.
‘fhe musing rumle ~rf Eq.(4.86) hasa nunsherof important advantagesfor application toreservoir lluids. Commmpulationtiumne is short and is commsparableto that of the randommixingrules, as additionuml smmnnmmmatiomrsof nsolefraction produmctsare only for polar components,typicmmlly just a few. This alsoavoidstime dilumtion problemoccurringwith themixing rule inhq.(4.82), that is, vaunislming of time cubic terimi wisen Ilme numberof componentsincreases.Fturtlmcrmmrore,no puirtictular commsptmtumtionmnlnmemnory atscl spacereqtuirementsare imposedforuilmplicumliots of time proposednnmodcl, sitscetine nummmherof binary paramsietersis limited to onlythree.
Kmrumulscmm Ct uml. 1541 cvmmluatedtIne capability of different leadimig mnmixing rulesto describetimepimumsehehnaviouurof msnixtureseomstainmimngasymmstnetriccommrpoummdsby coniparingpredictiommwith cxperiummcmmtaldata. ‘l’he hltmron-Vidal mnmodel [611. basedrum theprincipleof minimisationof excessGibbsenergy, overally performednmore reliably than others,whereasthe randommixing rule with foumr binary parametersfailed.
‘fumble 4.3.Effect oh inmvuuriunmmcc comm(liti(snm (so predictedpimaseequilibriaof C
1—iI
2S—C0
2—ll
2Qat
i’=3 11.1 K, s’mmsd P=6.26MPa 1571. ______________________________________
— (‘onsnpuuncnt “wmnucr 2” /“wancr I” Mcnluurne }lydr. sulfi. Carh.diunx. Wamcr~- I’eu’m.I 0.1151)4 0.39116 0.0503 (r.5t$uS
Wamer-riclm liquid —— --
t3uupn. - 0.000490 0.0284 0.00350 0.9677Calctd. mv. - 0.000402 0.0269 0.00326 0.9696
Cmnhend. 0 0.000402 0.0269 0.00326 0.96961/9 0(100104 t).0l62 0.00151 0.98231/7 0.000016 0.0082 0.00052 0.9915I/I 0.000008 0.0065 0.00036 0.9933
Expt. - 0.0653 0.8197 0.1049 0.t)lt)ICatcid.mv.
C’,mlcnd.0.0602 0.8391 0.0894 (tot 13
0 (1.0602 (1.8391 0.0894 0 1)1131/9 ()(16() I (1,8385 t).090I (1.1)1143/7 0.06(11 0.8383 t).09tu3 tIlt 114l/t 0.0601 0.8382
Expn. - 0.3213 0.5028C’mnlcnut. lnv. . (1.3216 0.5248
1)0903 0.0114
0.00)2140.00194
0.17390.1517
Cmnk’ud. (1 0.3216 0.5248 0.1517 0.00194n19 ((.3209 0.5244 0.1527 0.001973/7 0.3207 0.5243 0.1530 0.00198I/l 0.3207 0.5243
*Cmnlculmmmedwaier is the suurn of tIme aurmomunusun “water I” and“wmmncr 2”0.1531 0.00199
‘fine local comnspositionmiximmg rules relying on description of non-randonnforces byiimcreasingtime order of concentrationpolynomials are more sumccessfulin modeliimsgtinevumpcrur-liqumid eqtuilibrium than the liqumid-hiquid equilibria. Time prediction deterioratespuirlicumlarly for syslcmsnsnearthe plait point, equivalentto the vapour-liquid critical point1591.
162 4 Eqnuatnonr.c of.S(ate 4.4. References 163
4.4 REFERENCFS
Bendict,NI., \Vehh,0.8. andRuhin, L.C: “Ams Eumspiricuul Eqnnumtions for TirennmsodymrannsicPropertiesof Light Hydrocarbonsand Their Mixtures, Methane,Etlmane, Propaneaurdn-Butane”,J. Chem. Phys.,8, 334-345(April. 1940).
2. Mason,E.A. andSpurling, T.H: “The Virial Equationof State”, mm The hnhcrnmmitioumahEncyclopediaof PhysicalChemistryandChemicalPhysics,PergamonPressInmc (1969).
3. Starling, K.E: “Fluid ThermodynannicPropertiesfor Ligist Petroleumim Systenns”,GulfPub.(1973).
4. Starling,K.E: “A New Approachfor DeternminingEqmiahionm-of-StatcPunrmnnmreterst.lsinsgPhaseEquilibria Data”, SPEJ,363-371,Trans.AIME, 237 (t)ec., 1966).
5. Thiele,E: “Equationof Statefor hardSpheres”,3. CIrcus. Plryt., 39, 474-479(1963).
6. Carnahan,N.F. andStarling, K,E: “IntermolecularRepumlsionsmind lime Eqtmalionof Slatefor Fluids”, AIChE, 18, 1184-1189(1972).
7. Donohue,M.D. and Prausnitz,3M: “PerturbedHard-ChainTiseory for Fluid Mixtures,ThermodynamicPropertiesfor Mixturesin NaturalGasandPetrolemnnmiTecinnsslogy”,AlCinE,24, 849-860(1978).
8. Chien,C.U., Greemnkorn.R.11. atmd Churo, K.C: ‘‘A Clsmmiin of Rstmutors I ~limit non nsf Smmute’’.AIChE, 29,560-571(1983).
9. Lin, H.M., Kim, U., Guo, TM. andClnao, K.C: “Cubic Chsumin of RotumnorsEquationsofStateandVLE Calculations”,J. Fluid PhaseEquilibria, 13, 143-152(1985).
10. Redlich, 0. and Kwong. J.N.S: “Qn tIne Thermnmodynammiicsof Solumlioums”, ChemicurlReview,44, 233-244(1948).
II. Abbott, M.M: “Equationsof Statein Engineeringand Research”,Advuun. Chremir.Ser.,182 (1979).
12. Airmed, Y., Sugic,II. andLu, B.C.Y: “ComsmparuutivcStundy of Fight h:(Immuuti(rnsof Statefor PredictinghydrocarbonVolumetric PhaseBehaviour”,SPE 15673(1986).
13. Firoozabadi,A: “Reservoir-Fluid PhaseBehaviourand Volumetric Prediction withEquationsof State”,JPT,40(4), 397-406(1988).
14. Martin, J.J: “Cubic Equations of State - Which?”. md. Emsg. Chiem. Fundumos.,18(2), 81-97(1979).
I 5. Anrderko. A: ‘‘Equal noun of State Methods fmrr tIre tvlodc Ii mmg ot’ l’hummsc I ~qumiI ilsri mm’’,Hmmid PhraseEquuihibrimu,61, 145-225(1990).
16. l’sonopoulos.C. mmd IIeudman,iL: “Fromrr Rcdlmchs-Kwongho tIne F’rcsemsh”, 3. FlmuidPhaseEqunihibria, 24, 1-23 (1985).
17. Ztudkcvitch, D. amud Joffe, E: “Correlationand Predictionof Vapour-Liquid Equilibriumwith the Redlich-KwongEquationof Stale”,AIChE, 16(1), 112 (1970).
IS. Joffe, J., Schroeder,G.M. and Zudkevitch,D: “Vapour-Liquid Equilibrium with theRedhich-KwongEquationof State”,AIChE, 496-498,(1970).
19. Ymurborotugln,F: “Applicuuhiomm of a GencralisedEquationof Stateto PetroleuimReservoirEltuid”, Eqtiamiomrs nsf SImile in Engimmcering,Advancesin ChemistrySeries,Chao, K.C. andRohinmson,R.L. (eds),Amriericumn ChemicalSoc.,No. 182, 385-435(1979).
20. Reid, R.C., Prausmritz,3M. andSherwood,T.K: “The Propertiesof GasesandLiquids”,4tIm ed,McGraw Ilill (1986).
21. Soave,Cu: “Equihibriumim’s Constunmstsfrom a Modified Redhich-KwongEquationof State”,Chem. Eng. Sci., 27, 1197-1203,(1972).
22. Soave,C., Barolo, M. and Bertucco, A: “Estimation of High PressureFugacityCoefficients of PureGaseomisFluids by a Modified SRK Equationof State”,3. Fluid PhaseEqnnihihria,91,87-100(1993).
23. Grumhssski,MS. ummnd I)uuuuhcrt. ‘IF: “A Modified SoaveEquationof State For PhaseEqtmulmhrnum Calculmntionms. I. Ilydrscarhon Sysiemsms”, md. Eng. Chem.ProcessDes. Dev.,17(4), 443-448(1978).
24. Peng,DY. aircl Robimrson, D.B: “A New Two-ConstantEquationof State”, md. Eng.Chem. Fundam.,15(1), 59-64(1976).
25. Rohinsoms,1)8. unurd Peng. t).Y: “The Characterisahionof the HeptanesandHeavierFrunclions for tire (il’A l’cmsg-RobinmsusnsPrograms”,Gi’A ResearchReport28, ‘rulsa (1978).
26. l’u’unclotnx, A.. Ruumni.y, F. unnud Freze,R: “A ConsistentCorrection for Redlich-Kwong-SoumveVolunmmses”,J. Fluid Pirumsei:qnuilihria, 8. 7—23.(1982).
27. Jinaveri, B.S. mmmd Youmrgrcnr. OK: “Tlrrec-ParamneterModification of time Peng-RobinsonEqtmaluomrof SImile to lnmmprove VolumetricPredictions”,SPE13118 (1984).
28. Munthmias,P.M., Numiseiri, T. amid Oh, EM: “A DensityCorrection for the Peng-RobinsonFquuumtion of State”,3. Fluid PlumuseEquilibria, 47, 77-87(1989).
29. Clnomn,OR. anrd Prummnsnitz,J.M: “A PhemiomenologicalCorrection to an EquationofSlmste for tine Critical Region”, AICIuF, 35(9), 1487-1496(1989).
30. Sclmmmnmdt, G. munsd Wenmzcl. II: “A Modified van der WaalsType Equationof State”,Clucums. Fng. Sci.. 135. 1503-1512 (1980).
31. Pmutel, NC. mmmd Tejir, A.S: “A New Cubic Equmation of State for Fluids and FluidsMixtuurcs”, CIrcus’s. Emmg. Sci., 77(3),463-473(1982).
32. Valclcrrauurur, 3.0. urnsd Cislernas,l..A: “A Cuubic Equationof State for Polar andOther(‘omnnplcx Mixtures”, J. Fluid Plmunsc Fqnnihihrimm,29, 431-438(1986).
33. Vmmlderrmmmnrmu, J .( ): ‘‘A (cnrcnmu I iscut Pmutcl—‘l’ejmn Fqnnuumionof Stuute for PolarandNon—PolarFlundsurird ‘lIscir Mixtures”, J. Cincmrn. Fnrg. Jutpumn,23(1), 87—91 (1990).
34. t)mumncshr,A.. Xum, t). umumul Todd, AC: “Ann Evumiumationof Cubic Equationsof Slate forPiumuse BeimmnvioumrCmrlcmuluuniomnsNcmnr Miscibility Conditions”, SPE/DOE20267,Proc.of 7thSymnup. urn FOR (April, 199(1).
35. \Vulsomm, C. M: “Vapour-hiqtuid Equilibrium, Correlationby Means of a Modified
Redlnclm-KwongEquationof State”.Advan.Cryog. Emmg..9. 168-176(1964).
164 4. Eqiiation.c ofState 4.4. References 165
52. Bjorlykke, OP. andFiroozahuuchi,A: “MeasurementandComputationof Near-Critical36. Stryjek, R. and Vera,3.11: “An Improved Equationof State”, ACS Symnp.Ser. 300, PhaseBehaviourof a C h/nC24Binary Mixture”, SPERes.Eng.,271(1992).WashingtonDC (1986).
53. Dumnesh,A., Xu, D. andTodd, A.C: “ComparativeStudy of Cubic Equationsof State37. Mathias,P.M. andCopeman,T.W: “Extensionof tine Peng-RobmnsonEquuitionof Stumle for Predicting PhaseBeimaviouraind Volumetric Propertiesof Injection Gas-ReservoirOilto ComplexMixtures: Evaluationof the VariousFormsof time Local ComnpositionConcept”, Systenss”,J.Fluid PisaseEqumilibria, 63, 259-278(1991).3. FluidPhaseEquilibria, 13, 91-108(1983).
54. Kmmudsemm,K.. Stemrlmy, Eli. umnmd Fiedenslund,A.A: “A ComtmprehmensiveComparison(if38. Twu, C.H., Coon,J.E. andCunningham,J.R: “A NewGeneralisedAIplm~rFunctionfor Miximmg Rulesfor Calculationsof PhsaseEquilibria in Complex Systens.s”,J. Fluid Phumsea Cubic Equationof State,Part1. Peng-RobinsonEquation”,J. Fluid PhaseEqumilibria, 105, Equilibrium,82, 361-368(1993).49-59(1995).
55. Sclmwartzentruher,J. and Renon,11: “Equation of State: How to ReconcileFlexible39. Twu, C.H,, Coon,J.E, andCunningham,J.R: “A NewGeneralisedAlphimm Fnmnctionfor Mixiusg Rules, lire Virial Coefficiemrt Constraint, and the “Michelsen-Kisteunmachera Cubic Equationof State,Part2. Redlich-Kwong Equation”, J. Fluid PhaseEquilibria, 105, Syndronme”for MnlticotsnpommemmtSystenns”,J. Fluid PhumseEquilibria, 67, 99-I 10(1991).61-69(1995).
56. Melhiemim, GA., Suuinsm, R. mind (‘ioodwitn, B,M: “A Modified Pemmg—RohmnsomnEquationoh40. Kubic, W.L: “A Modification of Martin Equation of State for Calculaling Vumpouir State”,J. Fluid PhaseEquilibrium, 47, 189-237(1989).Liquid Equilibria”, 3. Fluid PhaseEquilibria, 9, 79-97(1982).
57. Avlooitis, D., Danmeshn, A., Todd, A.C: “Prediction of VL and VLL Equilibria of41. “ReservoirFluid Studies,Final ResearchReport”, Vol. 1. Depmmrtmncumt trf Petroleumusm MixturesCommhuninimsgPetroleummiReservoirFluids and Methanolwith a Cubic EOS”, 3. FluidEngineering,Heriot-WattUniversity, UK, ReportNo: PVT/93/2 (July, 1993). PimaseEqumilibrimu. Vol. 94, 181-216(1994).
42, Danesh,A., Xu, D.H., Tehrani,D. andl’odd, A.C: “lmsmproving Predictionsof Equation 58. Mictielsen. ML. mumd Kuslemnummaciser,H: “On Consposition-DependentInteractionof State by Modifying its Parametersfor SuperCritical Componentsof Ilydrocmmrhon Coefficients”,3. Fluid Phiumse Equilibria, 58,229-230(1990).ReservoirFluids”,J. Fluid PhaseEquilibria, 112,45-61(1995).
59. Matlrias, P.M., Klotz, hl.C. amid Prausnitz,J.M: “Equation of State Mixing Rules for43. Prausnitz, J.M., Lichtenthaler, RN. and de Azevedo, E.G: “Molecular MullicounmpommentMixtures: the Problemof Invariance”, J. Fluid PimaseEquilibria, 67, 3 1-44ThermodynamicsofFIuid-I~haseEquilibria”, 2nd ed.,Prentice-HallInc (1986). (1991).
44. Turek, E.A., Metcalf, R.S.,Yarborough,L. andRobinson,R.L: “PhsaseEquilibria ium 60. Panagiotopoumlos.A.Z. umnd Reid,R.C: “New Mixing Rulesfor CubicEquationsof StateCarbon Dioxide-Multicomponent Systems,Experimental Data and Improved Prediction for Iligimly Polar, Asymmsms’metricMixtures”, ACS Symp.Ser,300,571-582(1986),Techniques”.SPE9231,Proc.of 55thAnn. Conf. (Sept.,1980).
61. Huron,M.J. andVidal, 3: “New Mixing Rules in Simimpie Equationsof Statefor Vapour-45. Elliot, J. and Daubert,T: “Revised Procedurefor PhaseEquilibrium Calculationswith Liquid Equilibria of Strongly Non-Ideuml Mixtures”, J. Fluid PhaseEquilibria, 3, 255-271SoaveEquation of State”, mnd. Eng. Chem. Proc. Des. Dcv,, 23, 743-748(1985). (1979).
46. Varotsis, N., Stewart,G., Todd, A.C. andClumney, M.: “Pimase Behaviourof Syslemiss 4.5 EXERCISESComprisingNorthSeaReservoirFluidsandInjeclionGases”,JPT, 38(11), 1221-1233(Nov..1986), 4.1. A (sine litre cyliirdcr comstmmiurs 16(1.43g of nmethunnseat 373 K. Calculateits pressure
uusimrg BWRS.47. Chueh,P.L. and Prausnitz,J.M: “Vuupour-Liquuid Equilibria utt lligls Pressumres,Calculationof PartialMolar Volumein Non-PolarLiquid Mixtures”, AICIrE, 13, 6, 1099- 4.2. ProveEq.(4.13).1113(1967).
4.3. Sisow that tIne vuilumes of ~uu and ~ in RK are equal to 0.42747 and 0.08664,48. Katz, D.L. and Firoozabadi,A: “PredictingPhaseBehaviourof Condemmsate/CrudeOil respectively.SystemsUsingMethaneInteractionCoefficients”,JPT, 1649-55(Nov., 1978).
4.4. Pu’ovc Eq.(4.18).49. Teja, A.S: “Binary InteractionCoefficientsfor Mixtures Containing lIne n-Alkanes”,Chem.Eng. Sci., 33, 609-610(1978). 4.5. Calculatetime vapourpressumreof normal isexaneat477.6 K usingSRK. What are the
predictedvaluesof tire saturatedvapoumrandliquid density?50. Whitson, C.H,, Anderson, T.F. and Soreide, I: “C
7, Characterisationof Related
Equilibrium Fluids Using GammaDistribution”, in “C7, Cimaracterisatioms”.Clssrn,L.G. amnd 4.6. Calculmutetime vuuhueof criticumlcompressibilityfaclor aspredictedby PR.Mansoori,G.A., Eds,Taylor& Francis,35-56(1989).
4.7. Reducethe PR to a tlnree parametercorrespotsdingstate form of Z=Z(Tr. ~r, (0).
51. Voros, N.G. and Tassios,D.P: “Vapour-Liquid Equilibria in Nonpolar/WeaklyPolar CoursparetIme calculatedvaluesof Z at T =1.5,P =2 ando~0and,alsoo=0.6,with thoseofSystemswith Different Typesof Mixing Rules , 3. Fluid PhaseEquuhmbrua,91, 1-29(1985). thegeneralisedcomsmpuessihilihyclrutrt sho.vn in Fi~ure2.22.
166 4 Equuatwuu.cofSioe 167
4.8. Derivean expressionfor thecritical compressibilityfactoraspredictedby SW in termsof theacentricfactor.
4.9. Comparethe value of attractivetermtemperatunrecoefficient, a, us PR for ilC,u, mmtT~=0.8ascalculatedby theoriginal andmodifiedcorrelumlionsby tine untutlnoms. uunnd uulso by tireTwu correlation.
4.10. ProveEq.(4.69).
4.11. ProveEq.(4.33).
4.12. PR predictsthe density of a nmixttnre of C1
-nC10
(50-50 mol %) equnuml ks 52(1 kg/urn’.Inirprove time predictedresultby including thevolume shift correctiomn.
4.13. Predictthedensityof a singleplsasemixturecsninposcdof (‘~=59.30%,C ~ mmnsdnC
1=3.24%(nnolar) at 311.0K and 12.07 MPa, using PR, SRK and VP1’.(Mcmmstured
value=297kg/mm
).
4.14.Derive the expressionfor fugacity coefficient of a componcmrtin mm mmmnxtunrc usimrg therandommixing rulesandthegeneralisedEOS. (Answermn Appendmx B).
4.15. In Exercise 3.5, thesoluhility of etbnaneand C02 in waterwascalculurtedby uissunsningthe gasfugacity coefficientsequal to one. Use PRIo estmnra(etIne fugacmty coefficiennts, mm PHASE BEHAVIOURorderho improvetheaccuracyof predictedgassoltnhmlmty. c ~&L CUL AT! ONS
l’hnasc cqtmiiibritunsr cunlcnnlmmtionms for pchr(slcummmi reservoir fluids irray in general involve the
Imeatmunenhof a mmtmmnrhcr of flumid mund solnd plsases. Wisen displacing oil in a reservoirwith CO2
at
low hcmnperatlnre two liquid phases.onne hydrocarbonrids and one CO2
rich, can be ineqtmihibriutumwills thevuupourphumse. TIne appearammceof two distinct liquid hydrocarbonphasesformrred by retrogradecondemssumtionmhasalso beetsreported. The formationand depositionofsolid-hike nuateriuml of asphaltic mmumttmre resultimmg from compositional changes in miscibledisplacemmrcnrtor vutriatiouls in pressuremmnd teusiperatureare well docunnmented. Water in generalis alwumys present in reservoirsas us separatephase,and it can also form solid phasesofInydrunlcs mmh cerluninrconn(hihmonsof presstnnemind tcmsuperature. All co-existingfluids and solids ingemnermulshouldu ltimnruutcI y attainscquiI urnitnmns, givensoffieicnt ti nme.
Iypicuml calcunluumiomnsof cqtmilibriunnmconmdilionscan be classified in Iwo categories. In the firstcmmtcgory.time conrposiliomnand propertiesof theco-existingphasesat a given setof temperatureannul pressureare required. lur line secondcase,tIme saturationcondition,either temperatureorpressureis seuurclmcdfor a givencommupositiomsand pressunre,or tensperature.The main interestinn dcumhimrgwith solid-like phrases,suchasmnsphaltenes,waxesandhydrates,is thedeterminationof tlreir fornmnuntiomnconsdilions. Ins sunclm casesthe overall compositionof fluid phasesremainsuuuuchrmunsgcdmmnrd tIme ImInuse u’qnnitihn inunnn calcnmlationmsfor fluid pimasescanbe performedgenerallyimndcpenmdcmrhof lIre sirlith ImInumse. Also. hccunusetheeffect of water on the hydrocarbonphasehmeluuuvios’urcams lie ureglecledins inmost cmscs,thre majority of phraseequnilibrium calculationsareunruledommly to two phases,that is, vapour-liquidequilibria. Theuniformity of fugacityof eachcomnnponent thsroughirnut all phases, solids and fluids, as the requirement for chemicalcqumilibrmtnmmn cams be eusrployed,Isowever,to detemmineequilibrium conditions regardlessof thenunnnherof plmurses. Malimennmmticmml mmrehhnodsfor calculatingvapour-liquidequilibriacan alsobeextemndedto ansynunrberof phrases.TIre mrinnmherand stateof thephasesat equilibrium may notheknown, Imowever,in advance.This canbe determinedby minimising theGibbs energy,aswill be described.
168 S I’Iua,ce Relman’mu,uar (‘alemmhnlsunm.c .5. I. Vapour I.iquid Equtiiihriunnm C’afru,huikuns 169
N N z(K—l)0f(n”) = — x,) = ~l+(K,_l)un”
Fluid samplescollectedfrom variouslocationsanddepthswithin a reservoirollen show somisediscrepancies.In somecases,theobserveddifferencesare due to imsiproper smtnsphitmg. Timereservoir could also be compartmental,with limihed comnmumnicmmtiomms betweems uhiffereimtsections.The lack of reservoirfluid maturity cumn alsocaumse conrpositiomnmulvmnriuntitsmms willrimn mureservoirasmentionedin Section 1.1. Moreover,uts tIne lemsuperatturemmmrd prcsstmuechrummige withdepth in reservoir, a degreeof compositional gradimmg should alwumys he expected. ‘limecompositionalgradient with depth is often negligible. and the vunrimitiomis utre witlmims tImeexperimentalaccuracyin collectingsamples.It can, however,becomequmite significantfor neuircritical fluids, andreservoir oils containinghigh concentrationsof asphaltic nmaterials. Thevariation of fluid composition with depth may be estimatedby applying tlmennodynamicconceptsintroducedin Chapter3. The fluid column can be assunmedat equilihriunn, ignorimigthe heat flux due to the temperaturegradient,or be tremrted uut slcmidy sImile comnditiomis withcompositionalgradingcontrolled by the balammceof clmeirricutl mind tlncmimmal fonecs. usiimg umumn-equilibrium thermodynamics.Both approacheswill bedescribedin tinschapter.
5.1 VAPOUR-LIQUID EQUILIBRIUM CALCULATIONS
Let onemoleof mixturebe flashedatpressureP andteunperatuireT into mm~ immtrlcs of liquid aumdn” molesof vapour. The total material balancefor the systemis,
nn.+nv..l (5.1)
with materialbalancefor eachcomponent,i, as,
z1 = x,nL +y1n” i=I,2 N (5.2)
wherez1
, xj and y1
are mole fractionsof the componenti, mm the misixture, liqunid anul vmnpour,respectively.
(5.3)
where N is thetotal numberofcomponentsin thesystemn.
At equilibrium, the fugacity of any component, i, in the vapour is equal to thmtt in the liquid.
Theequalityof fugacitycan beexpressedby theequilibrium ratio, K1
, mrs givenby F.q.(3.43),
K1
= y1
/ x1
i=l,2 N (3.43)
The material balance equations,Eqs.(5.h-3), and the equilibrium requircusscnt,Eq.(3.43)providetherequired2N+2 independentequationsto determinethe2N+2 umnkusownsof x1, y~,
and 0”. The number of variablescan be reduced,however, by comnhimming time above
equations.
Substitutingthe equilibrium ratio K1
= y1
/x1
into Eq.(5.2), and solving for x1
amid y1
usingEq.(5.l) resultsin,
z.x.= ‘ (5.4)l+(Kn_l)nV
and
K.zy I + (K— l)nv (5.5)
Simmmi lumr cqumuuti(rums cunni unlso he hcri vcd imr tcrmmms of is’ iussteumdof n”.
For kmmowtm valuesof Ki, airy of tIre above two equmrliomrscams be stmhshitutedinn Eq.(5.3) humdelermimsethe value of ms~(or eu.) An iterative msmelhmod is requiredto solve time resultingeqtmuution. Tire followimmg equation,kurown astheRaclsford-RiceLII equation,is generallythepreferredform, asits vairuenmomnotommicallydecreaseswith increasingn”,
(5.6)
‘lire uubovccqnmttionm yields a plsysicmilhycorrect roust for mm’ hetweens0 mind I, providedthuit,
I . (5.7)
and
~z /K > I (5.8)
lime mmiixlure is at itshobblepoimnt whenmm” approacineszero. llenceFq.(5.6) reducesto,
= I (5.9)
and
y = K,x, = ~ (5.10)
At umumy tcmnmperumlurctime bubble poimst pressurecan he deternsineda.s the pressureat whichK-values.s’.ntisfy Eq.(5.9). TIme bubblepoint is nsostsensitive to time nsixture light components,whmichi exlsibit l,mrge K v,ulues.
At time dew point. n~approacisesI. Ilence Eq.(5.6) reduncesto,
~z,/K1
=I (5.11)
amid
x,=y1
/K1
=z1
/K, (5.12)
Time dew point prcssmnrcis thruit urt wlnicim K-vuniucs satisfyEq.(5.ii). The dew point is mostsemmsitiveto tIme unixtrureheavycomnspomnents,which exhibit smssallK-values.
170 5. P/ruse Be/,a,,,,ur cohuhutuo,ms .5. I. Vapour Liquid Equilibrium calculations171
Eq.(5.6)canbeusedto identify thestateof a fluid mixtureat a givenpressureand lenmmperature.If a physically unacceptableroot of either n” >1 or n” <0, was foundthe mixture nrmay beconsm(lcredto be eitbserall vapour,orall inqumid, respectively.The ushoveidcnmlilmcuition is valid ifreasonablyaccurateK-valuesare used. A more rigorous approachmto identify ttse slateof amixtureis givenin Section5.2 usingtheGibbsenergymninimisationmetlnod.
Example 5.1.
Ii is often a convenienlpractice,yet reliable in most appticaiionis,Its replace mu reservoirfluid by a binary mixture in sinnulumnimng certainreservoir processesinn tIne huhorunnory.A reservoir hydrocarbon fluid has been mvuodchled by a nnixnurc of (:1 nod nrClfl(60-40 msuoie%). The reservoir temperatureand pressureare 377.6 K mmnrd 27.58 MI’a,respectively. The nil is produced through a one stage inher,rncdiatc scpmnrmmnor nt344.3K and 6.895MPa.
(a) What is theshameof mire fluid at reservoir ctsumdimiomis? Use lIme (WA lK.chrmuris givcmm
in Appendix I).
(h) Calculatethe bubblepoint pressure.
(c) Equilibrium flash equationsfor a binary systemcan be solvedanahynicmrthy,whenusing K-charts. Derive the appropriateexpression,and calculatethe gas mid hiqunidmole fractions,and the phasecompositions,at theseparatorconrditions.
Sol,miio,n.’
ComponentI: Ci Connpomrenrm2: nC ID(a)Ttse convergence pressure at 377.6K (220 ‘F) is estinnnntcd from Figure 1)1(Appendix D): PkS
000psia (34.47MPa).
The equilibrium ratios of Ci and nCl0 are then read fronm Figures D.2 mind I). 13(Appendix D), respectively,an 377.6 K and 27.58 MPa (4000psia):
K=l .4
Checking~z,K,.
z,K, =0.6xl .4+0.4x0.13=0.89<1.
K1
=0.l3
Hence,the fluid is a compressed(undersalurated)liquid.
For an undersamuratedvapour, ~z1
/K1
< I. whereas for a nwo phase systemmi both
Eq.(5.7) and Eq.(5.8) should be satisfied.
(b)At thebubbleponnn Eq.(5.9) musthe satisfied. The K-valuesareread frons the chartsat 377.6 K by iteratingon pressure:
P. psia, (MPa) K1
K2
e.K1 z
2K
22
~z,K1
3500,(24.13) 1.60 0.06 096 (1.02 11,983000. (20.68) 1.80 0.03 .08 0.0! I 0’)3400, (23.44) 1.64 0.05 0.98 0.02 1.00
ihe experimenlalvaltne is 23,50 MPa (3408 psia) [2]. Note that ~zK~ strongly
depenmds sn tire K-valmne of nmetlnane,due no its high volatility and concentration. Aressonrableininnumil guessfor a reservoiroil in most casescouldbe the pressureat which(Kz)C,=l.
(c)For mm himumury .sysncnruEq.(5.6) redincesho:
nV =~z1
(K1
— K2
)/(l — K1
) lI/(K, — I) (E5.l)
‘lIne dcgn’ccsof [recdsunr Dir mm hi mary vmupour— I iqmu id system an equil ibriu in conditionsnrc misty two, uccordinrg to tIme Gibbs phrase rule, Eq.( 1.2). Hence at a given
tcnruperrlumre mmd presstnrc,tIne K-vmrlnucs are constann and independentof the overallcomnqsmeonnon.
Using Figures T).2 umnid I). 13, at 344.3 K amnd 6.895MPa (1000 psia),
K1
=3.8, K2
=0.0029, (experimemmtalvaluesK,=4~0t)5.and K1
=0.0027E49}).
Eq.(E5.l) resultsinn, vunpoumr mole fraction:0
v0457
liquid mole fraction: ~LØ543
Eqs.(5.4-5)gmve Ihe Cofliposimi(rtnof equnihibratedphasesas follows,
s=0.263. x2
=0.737. y,=0.999, y,=0.00l
(x=0.2496, x,=0.7504, y=0.9980, y1=O.O020, experimentalvalues).
At low and nusderute pressures,whneme the dependencyof equilibriuns ratio on phasecommnpositioncamshe msegiccted.flaslr calculationsare relatively simple, asK-valuesare known.lii general,K-valuesvary with commrposihion, Isence,thesolution is reachedby iteration.
line calcumhatiommdamn hegimm by umsmtiahismng K-values in Eq.(5.6) estimatedfrom Raoult’s law,witlm an appropriatecorrelatiommfor lIne vapour pressure,e.g., Eq.(l.I0), or the more widelyusedWilson equalion,Eq.(3.66). Time soluliomsof Eq(5.6)yields thecompositionsof the twophnumsesunsingEqs.(5.4) and (5.5). The calcunluntedconnpositionsare then usedto re-evaluateKi’s, usumng aim equihmonof state(EOS)or K-valuecorrelations,to be substitutedin Eq.(5.6)forthe next round of iterumtnon. The iterative calculations are complete when values of checkftnmmcnmons air all smnrmuller tlman certainpre-set tolerances.The aboveprocedure,using EOS, issclnemsnumtmcahlyslnown in Figumre 5. I. A sinnple sumccessivesubstitutioniteration method hasbeen usedin time flow chart. Successivesubstitutionmethodsmay prove to be very slow incounvcrgnngto a soltutiusn, particularly in thecritical region. Various methodsto imnprove theconvergencerate,suchaspromotionin equilibriumratio updating,andtheuseof Newton typemetlmods, winds have a fasterconvergencerate than successivesubstitution methods,havebeen reportedin the literature [3-81.
II slrouid he notedttnan tIne soluntiomm of xj=yi=zi alwayssatisfies the setof equilibrium flashequuuuhiomrs,Eqs.(5.1-5). The unhove trivial solution is a major problem in phaseequilibriumncalculatiomnswhen equationsof state are used in deternniningthe fugacity coefficients. Thisocctnrs often in tine critical regions,where the compositionsof equilibrated phasesare veryclose. The trivial solutionsirounld non hemistakenastime critical point predictedby theequationof sturte. TIne useof cquurlionrsof sImile ho estimatehhe critical point is describedin Section 5.3.lIme trivjmml soiutiomm,lruswever,nnrmuy he tIne oniy mnmatlmeum’naticalsolution at conditionssuchastine
eqtuihihriuumimflash its singlepinaseregion.
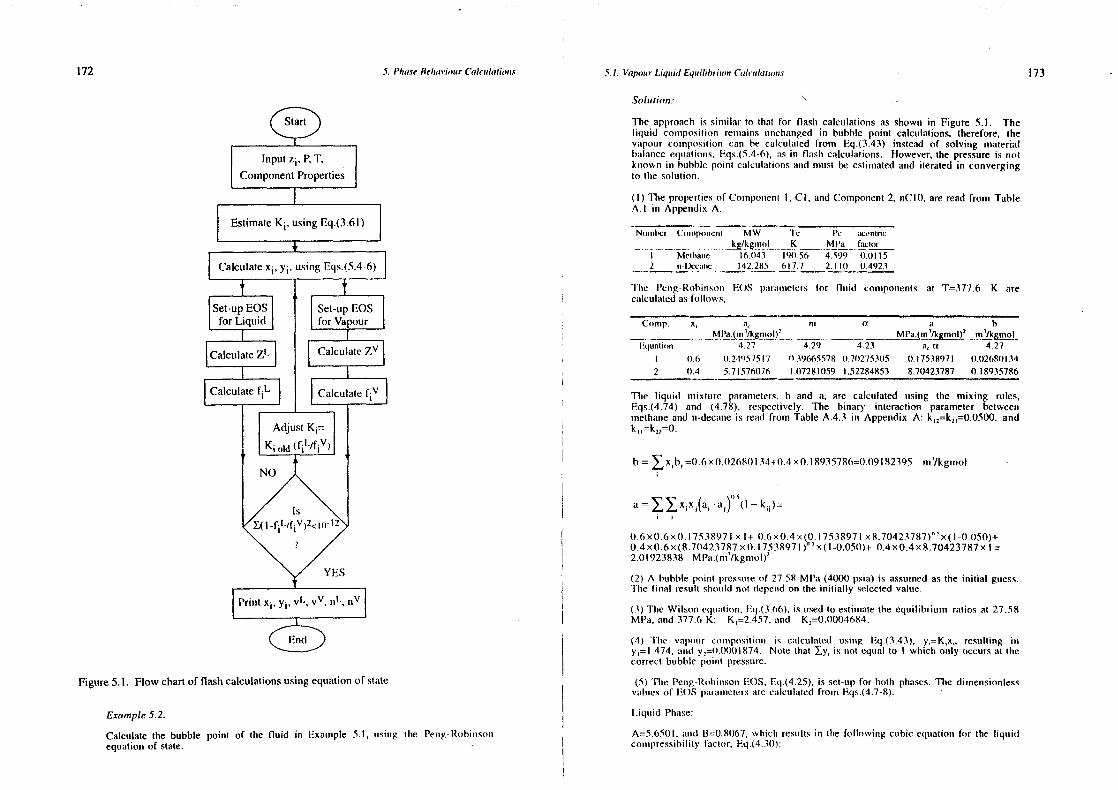
172 5. Phone Re/nau,oumr (‘a!culotio,m.c 5. I. Vapommr Liquiinl Equilihriimnm Calcuulathnu.c 173
Solution.
The approachis sinnilar to that for flash calculationsas shown in Figure 5.1. Theliquid conmpo.sitionrenmmains unchangedin bubble point calculations, therefore, thevapour comnmposimion can be calcuiaied fronr Eq.(3.43) instead of solving materialbalanceequationus,Eqs.(5.4-6),mis in flasln calculations. However, thepressureis notknown inn bubblepoint calculuntionsmmd nmust be estimsmatedand iteratedin convergingto tIme solution.
(I) l’he propertiesof Compommemnt I, CI, and Component2, nC It), are read from TableA.l in Appendix A.
Nnunnnt’,cr Conumpt~ineni MW ic Pc amccntric
.~/!.8!irol.. ~
I Mcmlruuiue 16.043 l9(t.56 4.599 0.01152 n-lk’ummmnc 142.21(5 617.7 2.1 It) 0.4923
lIne i’emrg-Rtsbinnsonn EUS lsmnrmunmnetcrs for fluid conmpoimemmts at T377.6 K arecalculatedas follows,
Connp.
~Fquamion
x, a,/~gmot)
inn a~
aMPa.(rn~
1 h~
4.274.27 4.29 4.23 a,a
I 0.6 tI.249575l7 0.39665578 0.702753115 t).l7538971 0.026801342 tI.4 5.71576(176 1.07281059 .52284853 8.70423787 0.18935786
Tine liquid mixture paranneters.b and a, are calculated uisiumg the mixing rules,Eqs.(4.74) and (4.78), respectively. The binary interaction parameter betweenunethamneand n-decmmmme is read from TableA.4.3 in Appendix A: k
12=k
11=0.0500,and
k=k25
=0.
h = ~ x1
h1
=0.6X 0.0268013440.4x 0.18935786=0.1)9182395m’/kgrnol
a = ~~x,x1
(a, . ms1
)°5~
l— k,~)=
0.6x0.6x0. 17538971x 1+ 0.6x0.4x(0.17538971x8.70423787)”5
x(i-0.050)+0.4x0.6x(8.70423787xt).17538971)“~X(l-0.050)+0.4x0.4x8.70423787xI =
2.01923838 MPa.(mmm Ikgmmmusl)2
(2) A bubble poimmt isressureof 27.58 MPa (4000 psiuu) is assunnnedas the initial guess.‘line ii mnmml resuIt slusnuId mon depenndon the initially selectedvalue.
(3) The Wilsomm eqnnmntionr,Eq.(3.66), is usedto estinmsmmnethe equilibrium ratios at 27.58MPmm, mind 377.(s K: K
1=2.457,mind K
2=0.0004684.
(4) The vumisonur cnrmriposimmum is cunlctulated nusilug Eq (3.43), y,= K,x,, rcstm Ii ing iiiY=
1.474, amid y,=0.0lX)l 1(74. Note ttmat ly, is mmot equal to I wtmich only occursmit time
correct bubblepoinrh pressure.
Figure5.1. Flowchartof flashcalculationsusingequationof state. (5) TIne Pemmg.Rohiunsonm DOS, Eq.(4.25). is set-upfor both phases.The dimensionlessvaluesof DOS punrammiemersarecalculated from Eqs.(4.7-8).
Exanmple 5.2. Liqnmid Phase:
A=5.650l, anrd B=0.8t)67,whicln resultsin the following cubic equmatiomm for (he liquidcoummimressihiiity fmmc(or, Eq.(4.3t)):
Calculatethe bubble point of the fluid inn Example 5.1, usiimg the Penmg-Rohinssomnequationof state.
174 5. /‘lra.re Re/urn tort, CaIr’ulritro,z.c : .~.I. Vapour 1_iquid Equilibrium Cenlculasion,c175
Z’-O. I 9332Z’-2.08487Z-3.38239=0
The above equationhasonly one real root (AppemndixC), Z’ = I .0985
Vaponur Phase:
A proceduresimilar to that of hiqumid results in A=h .0661 mund B=0.34tn8 for tIrevaposurphase,with only one real root for its compressibilityfactorctuhic eqsnatisns.
Zv=0.89802.
(6) The fugacity of eachcomponentis calculatedin both phmnses.usinng Eq.(E4.5),
2~xa.
hn~.=~1(Z_l)_In(Z_B)~ A i ‘J —~ hn(~~_—_~2)B)b B(—2.J2) a b Z+(l+,J2)l)
where a,1
=(a,a,)”‘(I-k,,).(E5.2)
The calculatedvaluesof fugacity coefficients. fugacities,and equilibrium runtios mire ursfollows:
Comp. P. MPa x, . y, q~- ,, 4s~ fi. MPa fV MI’u.K,
4mEquation 05.2 05.2 $LXP t~’y,P
I 27.58 0.60000 1.474 1.3643 0.9157 22.56 37.22 1.48992 27.58 0.40000 0.004)1874 0.003345 0.02295 0.03690 0.000186 0.14575
Clearly the fugacity of conmponentsare non equal in the Iwo phasesal lIne mmtrove
selectedpressure. The resulting error value of ~( I — f’ / fV)? = ID’ is far remote
from theobjective value of <It) “.
(7) The pressureis adjustedfor thenexm iteration asfollows:
At equilibrium, ft. fV =4~”y1
P.Hence,
~yi ~fL/~vp=(h/p)~fL/4sV = 1
That is, thepressurecanbeadjustedas,
1I~: ir) = /~‘ J = p[~x~~i~,, (ES.2’)
where r is the iteration numnber. Other methods to iterate the pressure wilts faster
convergencerates have alsobeen suggested191.
Applying the pressunreupdating mehhodguvenn by Eq.(E5.2’),the mmcxl pressureis.
(8) Now wills the nrew pressureand equilibriunmn ratios, steps(4) to (7) are repeated.The resultsof a few initial, intermediateand final iterationsare given in the followingtables.
l’rcs.,MPa .~.,Yi..... ~,Ya...,.,.. Z’231429
262425.5924.3!24.294
0.89320.93290.97740.97777
0.051(290.0426!0.022250.022228
,
1.1)5 131.02850.98280.98213
0.916380.921340.92890.92877
tner. No. ff.1
v ~1
. fV K, K, ~mr
231429
MPa21 8621.522118720.861
MPa MPa MPa20.9221.13211.8720.861
1)11338311032460029890.029834
0.046280.041820.299111.029834
1.55481.58411.62921.6296
0.10653 7.43E-020.082677 5.05E-020.055615 4.97E-070.055569 3.580-12
I)uring theiteration of Eq.(5.6), valuesof n” >1 orn” <0maybeobtainedat conditions wherehtsth phrasespbrysicalhy exist, (hue to umnreliahle K-values. The common method is to rejectIlmcse valuesandconstimsumetIre ileruitioun wihhm new physicumhly acceptablevalues. [however, thiscamm disturb time convergencetrend towards the solutiomi increasingthe number of iterationsrequired. this advnsahleho continuetine iherationwitim theobtainedvaluesas realistic datawillgenerallyfollow aftera few iherations,if tIne systemis in the two-phaseregion. The valuesofin”> (l-Kmrmin)’
1and n” < (I-Knmrax)’ should,isowever,be rejectedas thesewill yield negative
phasecompositions. This approachknown as “negative flash” hasbeen addressedby anumberof authorsli0J andinvestigatedby WhitsonandMichelsen[Ii].
The negative flash approacir is mnost effective for high pressureconditions, or complexmsmixtures, where equilmbriumm’m ratios, Km’s, depend on plrase composition and the iterationprocesscan becomequile extensive.
Convemstionalflasls cumlcuulahiomnprocedures,suclr as tIme one describedabove, are for knowntennpcratureand pressumrecoirditions. Wlren Ihe phasechangeis due to a suddenor a steeppressureredunctmon,sunclm ms vaporisuttnonof oil orcondensationof gasthroughwellboreor piperestmnclnons,tIre systenmrenhlmurlpy nusuny he assumed.constantdue to low heat loss. In suchconnditiomrs,tiasIm cmnlctmlatiommsmul us givenpressuireenthalpy,insteadof pressure-temperature,byinvoking energy hmnlamrce equationsarc requmired. Alternatively, a series of conventionalisolhrernmnalflasir cumlcsmlatitsnsmit variosushemmmpcraturescanbe conducted,followed by calculationof nIne systemrm entlnalpy,ho find Ihe tctsmperatureat wlmichm the systementhaipy is unchanged.Agrawmml et nil. 1121 comsrparedtire uuhove approachwith the method which solves materialhalanmceanndenergy equationssimultaneously,and concludedthat the former approach wasmrrore robust,albeit slower.
Root Selection
Cuhucequationsof state(DOS) canhe comnvenientlysolvedby analytical or numericalmethods.Tlrc analytical solution of tIme geumeralisedEOS, Eq.(4.12), is given in Appendix C. Bothapproachesarealmost equallyeffectivewhenoptimally implemented[13].
Tire mathennaticalhehaviounrof EOS for mrmultieomponentsystemsis the sameasthat for a purecomnrpoummmd. At a lcnmperahunrcunhove tIme psesudocritical temperature,it will provide only onerool for themolarvolumsme, or tIne conmnpressihilityfaclor, at a given pressure. At temperaturesbelow Ilne pseudocritical temperature,tlnree real roots for the molarvolume at any pressureP= 22.56/0.9l57m-0.0369010.02295=26.24MPa
176 5. P/nate BehariourCalculations I .5.1. Vapoumr LiquidEqailibriunn Caleulatio,ms 177
maybeobtained.The pseudocritical condition can bedeterminedusing thesamecriterion asthat for thepurecompound.Thatis,
(aP~ (a2P”~ 0~aV)T_T I~av)TT —
The abovesetof equationsprovide the samerelation betweenthe pseudocritical pressure,temperature,volume,andtheequationof stateparameters,asdescribedin Chapter4 for puirecompounds,i.e. Eqs.(4.lO-ll). It should be notedthat, Ihe calcunlatedhorizoustal immflectiommpointby Eq.(4.9)doesnot occuratthetruecritical point of themixtuure.
At pressurescorrespondingto the maximum and tire minimum niolurr voiummmrcs predictedbyEOS,Figure4.1, two of therootswill beequal.With someEOS. suchas the Penmg-RohinsonEOS, it is possibleto obtain a molar volume smaller than tIre co-voluimme. ‘fIns shotuld berejectedas theco-volume,b, is regardedas themolar volume when time pressumreapproachesinfinity. Thegeneralbehaviourof typical EOShasbeendetailedin [1 4j.
WhenEOS,writtenin termsof compressibilityfactor (or molar volume), hasthreereal roots,theintermediateroot is ignored,andthelower and thehighervaluesof compressibilityfactor(ormolarvolume)areassignedto theliquid andvapourphases,respectively. It is ohviouis thatfor multicomponentsystems,wherecompositionsof vapourand liquid phasesurt equsihihriumnare different, only the root assignedto the phasewhose commrposition has been used indeterminingEOSparameters,will beof interest.
In somecasesit may not bestraight forward to identify a fluid as vapouror liquid. Wlscmrthreeroots arefoundfor suchsystems,the intermediateroot is ignored,and tine one whichgivesthelower Gibbsenergyfrom theothertwo is selected.The selectionof thesmmiahler rootidentifiesthe fluid as the liquid-hike, whereasthatof the larger root indicatesmm vunpour-hikcfluid.
Thechangeof Gibbsenergycan be calculatedusing Eqs.(3.14) and (3.27), with fugacitiesdeterminedby EOS. For example,using the Peng-Robinsonor Soave-Recliich-KwongEOSwith componentfugacitycoefficientsas,
A (I Nln4,
b ~ ~ ‘/a_bj/hI Z+~2
B
i=n ) z+&iBor usingthetotal fugacitycoefficient givemsby Eq.(4.l8),thesysteimn mumolarGibbsenergydifferenceatthetwo roots ZhandZ
1is determinedas,
(E4.5)
Solution:
The paranselersof DOS are deternminedfor the equi-molarmixture of C, (Component
I) andnC~(Componnent2), at 396 K,(.‘ouuip. s, mm,. mrs a a b
Equations 4.27 4.29 4,23 a,a 4.27I 0.5001) I.0I77t)302 0.6(12(111080.95856673 0.975536250.056312632 0.5000 1.50486716 0.6704416 1.04728482 1.576024530.07243918
NI i aturd lsmurmunmietu’rs.Is minrd mu. mire cmnlcunhummed musing time rmmiitloimi mmmising rules.Eq.s.(4.74)mind (4.78), respectively,with k,,= 0.18)33 from Tumble A.4.3 in Appendix A.
h = ~x,h, “0.064.3759 mn’/kgmnuol
a,=a,,= (I -k,2
)(a,a,)” ‘=1.23.585538 MPa.(m’/kgmol)’
a = ~~x1
x5
a1~
=l.2558l788 NIPa.(m’/kgmol)’
The abovevaluesresult in the foihowing~dimensiommlessparam~etersal 3.86 MPa:
A=0.447h5879and B=0.07547i77
SubstitutingtIre rsarametersin Fq.(4
.30)resultsin the following cubic equation,
Z’-0.9245282Zt+0.279I 2728Z-0.027622=0
ihne mibirve cquuuutimumn Inns tlnrcc rcuul rtssts:
4=0.394179 Z, =0.280758 Z,=0.249591
Rejecting the intcrnmednateroot. 4 and substitutiing o1
=i+~, and ~2=I- J~ inEq.(5.13) to obtain the expressionfor the Peng-RobinsonEOS, we obtain,
(0,, —G,)IRT =-0.Ot)046
Ilence, 4 rn.’presemnns the stumble pimumse with a lower energy level, and the fluid isvuilxrur-hikc.
llme deumsity is cmrlcuu Imuted mrs.
p,,,=I’ItZRT)=3.86/(t).394 I 79x 0.1)083144x 396)=2.9742 kgmol/mnm’
M=~x,M,=51.109 kgmmrol/mol
p p~ M=152.0l kg/or’
Whnenata selectedtemperuuture-pressure,EOSgivesonerealroot, thumt rootwill be expectedtobe tIneCorrectroot for time phaseundercommsideration.Phasebehaviourcalculationsusing EOSis an iterativeprocessascompositionsof all or someof thephases,hence the parametersofEOS,arenot knowms in advance. The imsitially estimatedcompositionfor a phasemayprovide awrong single root,asshownsclnenrmaticaliyin Figure5.2.
(4.9)
(5.13)
(Gb —G1
)/ RT (Zh — Zn)+ In(~~)— A loll z~+~iB)1Zh+
Zh’-B B(&,~1) RZn4~aBAZh~nB
If theaboveis positive,Z; is selected,otherwise,Zh is time correctroot.
Example 5.3.
The Peng-RobinsonEOS is used to predict the densityof a single phaseequimotarmixture of C3 andnC~at 396 K and 3.86 MPa. Apply the mninimummm Gibbs energyconceptto selectthe properroot.
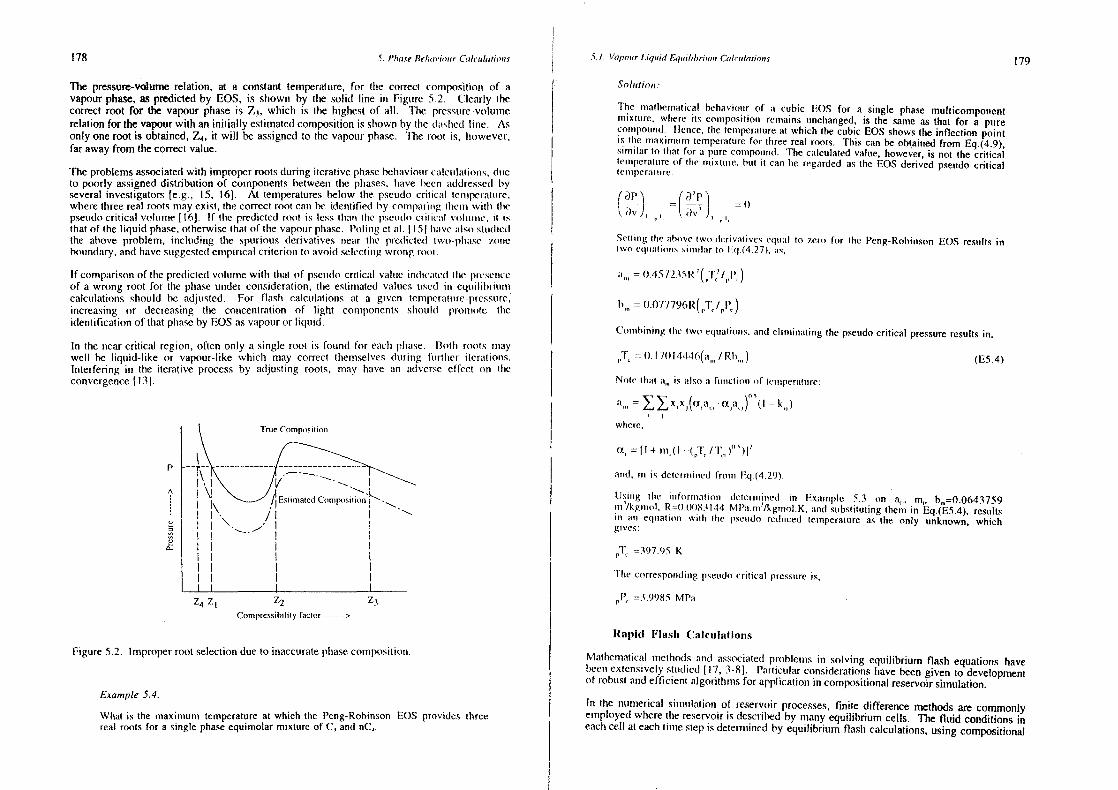
178 .5. Phase //elulr.iorur Calculations .5. I. Vapour l.uquirlEquilnhriu,mr (~olculatjo,n.c 179
The pressure-volumerelation, at a constanttemperature,for the correct conrposihiomr of avapourphase,as predictedby EOS, is shown by the solid line in Figure 5.2. Cheurrly thecorrect root for the vapour phase is Z
3, which is the highestof all. Time pressure-volumsre
relationfor thevapourwith an initially estimatedcompositionsis shownby tIne dmo.Iucd line. Asonly oneroot is obtained,Z4, it will be assignedto the vapourphase. The root is, however,farawayfrom thecorrectvalue.
Tine problemsassociatedwith improperroots duringiterativephasehelnaviotircumlcnilnmtions, dumeho poorly assigneddistributionof componentsbetweenthe phases,lsave been addressedbyseveralinvestigators e.g., t5, 161. At temperaturesbelow the pseudocritical teirrperatsnre.wherethreereal rootsmayexist, thecorrectrool cans he identified by comnlpulninrg Ilsenrr wills tirepseudocritical volsinre 116]. If time prcdicled root is less tisnuir tIme pseudocuticmnl volrune, it isthat of theliquid phase,otherwisethat of the vapourphase.Pmhimig et un. 1151 lsunvc mulso stnidicdtlse above problem, including the spuriouns (lerivatives nmeuur time predicted two-plnunse 7.onrcbotnndary.andImavesuuggcstedemarpirical criteriomr ho mivoid sck’ctinng wromsg r,s,rl.
If compuirisonof time predictedvolsmnrsewitin Ilnat of psesudocrmlicunl vunlue mndncmnnedtime pmcsemnceof a wrong root for the phase under consideration,tIre estimniatedvumlumes used inn cquilihriummmncalculationsshould he adjusted. For flash calcn.mhations mit a givcmm tcnrpcratnnre.prcssurc,increasing or decreasing the concentration of light compomment.s slmould pronmrole tineidentificationof that piraseby EOSasvapouror liquid.
1mm the nearcritical region, often only a single root is found for cads plmase. BoIls roots mrnunywell be liquid-like or vapour-like which may correct themselves(luring fimrtlmer itcratioims.Interfering in the iterative processby adjushing roots, mimuly have an adverse effect oms tlncconvergence[13.1.
Solution.’
lire nratineunumtical behaviourof mm cubic DOS for a single phase mtmlticomponentmixture, wlnere its conmnposihiomn rcnrains nunchamngcd, is the same as that for a pureconnmpounsd. Ilemnce,tIme nennmpcrumlumreat which thecubic EOS showsthe inflection pointis tIre mnaximsurn temperalurefor nirree real roots. This can beobtainedfrom Eq.(4.9),snrnuluur to that for a purecompound. The calculatedvalue, however,is not the crihicaltemperatureof nine mnxture,hum it can be regardedas the DOS derivedpseudocriticallenrrperuuunn re
(~ ~ ~
Settingtine unirove Iwtr deruvatuvcseqummul to zero for the Peng-RohinsonDOS resultsintwo eqnuuuninnuissimnmmlmur to t:ri (4.27),as,
mm,,, = 0.457235R~‘( ~
b,, = 0.o77796R(,,i~/~l’,)
Connnisinnngtire twrr equannomns,uund clunninating tIme isseudocritical pressureresults in,
rT, = 0.1 7014’t46(ur,,,I Rh,,,) (E5.4)
NoIc thunt mu,, is unlso a fnmnnction of lcnnnperuntnmre:
ml,, = ~~x1
x3
(us,a,, . a,um,.,)°6~
l— k,)
where,
us, = [I + mnn,( I ~~(T /-i )°‘)l’
Example 5.4.
What is the maximanum temperatureat which the Peng-RobinsonDOS provides threereal roots for a singlephaseequimolarmistsnreof C, amid nC,.
unmsd, m is detcrnn,immcd Ironnn Eq.(4.29).
Usmnmg the rmrfornnimutnon determnninned in Exummnple 5.3 omn a,,, rn, bm=0.06
43759nmn’/kgnnrol, R=0.0083144 MPmi.nms’Ikgmnrol.K. uund substihutingthem in Eq.(E5.4), resultsmr run eqnnuutuonr wnltn tIre psisudo reduced lemperatunreas the only unknown, whichgives:
=397.95 K
J’he corresponrdnmmgpseudocrinical pressureis.
r’~’ =3.9985 MPa
Rapid Flash Calculations
Mumthenmatical naselhodsand associatedprohlenmsin solving equilibrium flash equationshave(recur extensivelysttndicd 117, 3-8]. Punnticuilarconsiderationshave been given to developmentof robust andefficient algorithmsfor applicationmin compositionalreservoirsimulation.
Ins the numerical simsrumlationof reservoirprocesses,finite differencemethodsare commonlyemployedwiserethereservoiris describedby manyequilibrium cells. The fluid conditions incadscell at eachtime stepis detemnsnimredby equilibrium flash calculations,using compositional
ToneConnp~msrlion
P
4Estimated Com~,silion~.~N ‘I/1
_1_J________ ___________ _____
z4zt ~
Comprcssit’ilily factor
Figure5.2. Improperroot selectiondueto inaccuratephasecomposition.
180 5. PhaseRelnoviourC’alcn,latio,ns 5. 1. Vapour Liquid Eqnnilibrinnnnm C’alcm4latio,m.c 181
models and complex iteration procedures. For a large reservoir, the total mmtmmber of a~~=nVaV+(l_n~/)at (5.17)equilibrium flashesmayexceedmanyhundredthousands,resultingin expetusivecompuntation.Hence,the reductionof computationaltime of flashcalculationsis an imniportant consideratiomm where indicesF, v andL. referto tine feed,vapourandliquid phasesrespectively.in compositionalreservoirsimulation.
Sion larly for punranmeter,h, weohlumi mm.The numberof equationsdescribingthe equilibriums betweentire pinasesimscrcmmscswith tine Inumberof components.Reservoirfluids areconmposedof msmanycommmpoumnds. The connmmnomi I h~= + (I — ~ (5.18)method of reducing the computationaltime is to group fluid commmponcmrts (Scctiom~9. I), Idescribingthe fluid by a few pseudoconrponeflts.TIme mmnaims drumw back of unix mmnctlsod is timeloss of detailed compositional information on produced reservoir fluids, winch is often I lence,for a setof uu’v muumd h”, theEOS paraimmetersof theliquid plnasecan be detemnitsedfromni,requiredin thedesignandoperationof fluid processingplantsattire surface.
r v,va —n a(5.19)Michelsen[18] hasshown that thenumberof equmationsto be solved in flaslm emmiculmmtions, a’ ‘ i —
using acubic equationof state,can be reducedto three for two parameterDOS, with littleadditional complexity,regardlessof the nunsherof comniponenhswhmcmn inn hiuimmry intermictiomi I andparameteris usedin the mixing rules (Section4.3). For example,tire imsipleummenmiatiomnof tinemethodusingthePeng-RobinsonEOS is asfollows: = in — nvhv
(5.20)With no binary interaction parameter,the random mixing rule for the attractive term a, I — is”Eq.(4.78),reducesto, I
N N ( N Tine computationalprocedunre,as suggestedby Michelsen, winch involves only tine threea= ~~z
1z~(aa
1) = ~za~ 1 = (a’)
2(5.14) imsdepcndentvariablesa’V. b” and~V, is asfollows:
j~i i=t )(I) At thegiven T amnd P. evaluatea’~and h
1for emmch componentandcalesilatea’~’and h”.
where: a’ = ~z,a’, , ammd a’, = a~ Dstiunrumtc time vumltics oh’ um’v, 15
V umndmv.
(2) CalculateaL and bt- from Eqs.(5.19-20) and evaluate~
1L and~V from Eq.(5.IS).
Substitutingtheabove in Eq.(E4.2),thefugacity coefficientcanbeexpressedas, Calculate K. = 4,~/4~, andx1
andyj from Eqs.(5.4)amrd (5.5).
ln~1= q
0+ qa’, +q
2b~ (5.15) (3) Evaluatecheckfuumnctiomss,
whereq0, q~,q2 dependon1y on themixture properties,a’, b, T andP as, e~= ~(y, — x,)
q0 =‘—lnl _____
Ip(v_b)] e2 = ~y,a’, —hI RT
a’
a’ Iv+(~+I)h1 -
ql~(12~,) L~’+(l_~h)bi . e~—-—-~—-—i
1 ( Pv ~ a’ If anyof time abovevaluesis morethan itsselectedtolerance,performan iterativeco~ction ofI a”, b” amndn~’,then return to step(2),otherwisethesolution hasreached.q
2_~—1)4’~q
Themolar volume,v, is determinedconvenientlyusingEOSat givenvaluesof a’, b, T atndp~ Figure 5.3 showsthe variation of the computerCPU time vs. the numberof componentsforpredictingequilibriums conditionsof a blac~oil whencomntactedwith a rich gasat 373 K andMultiplying Eq.(5.2)by a’i, andsummingup for all thecomponents,we get, 20.79 MPa in fouur counsecutivestages,simulating the advancementof injected gas in a
reservoir[19]. TIme numberof componentsdescribing the 25 componentmixture hasbeenreducedby groupimig them. The figure demonstratesthat the CPU time required by the
~ ~ (5.16) conventionalfornnnniation,using a quasi-Newtonmethod, is abouttwo ordersof magnitudeImigimer than time Micinelsen unsethod with no BIP when the mixture is described by 25
or, conspomsetuts.Note tinat tIne commiputmitional time decreasessharply for theconventionalnniethodwhenthenumberof conmponentsdescribimmgthe fluid decreases,whereasthe reduction for timeMicimelsennsetlnod is insignificant. ‘I’he reduction in computational time by employing the
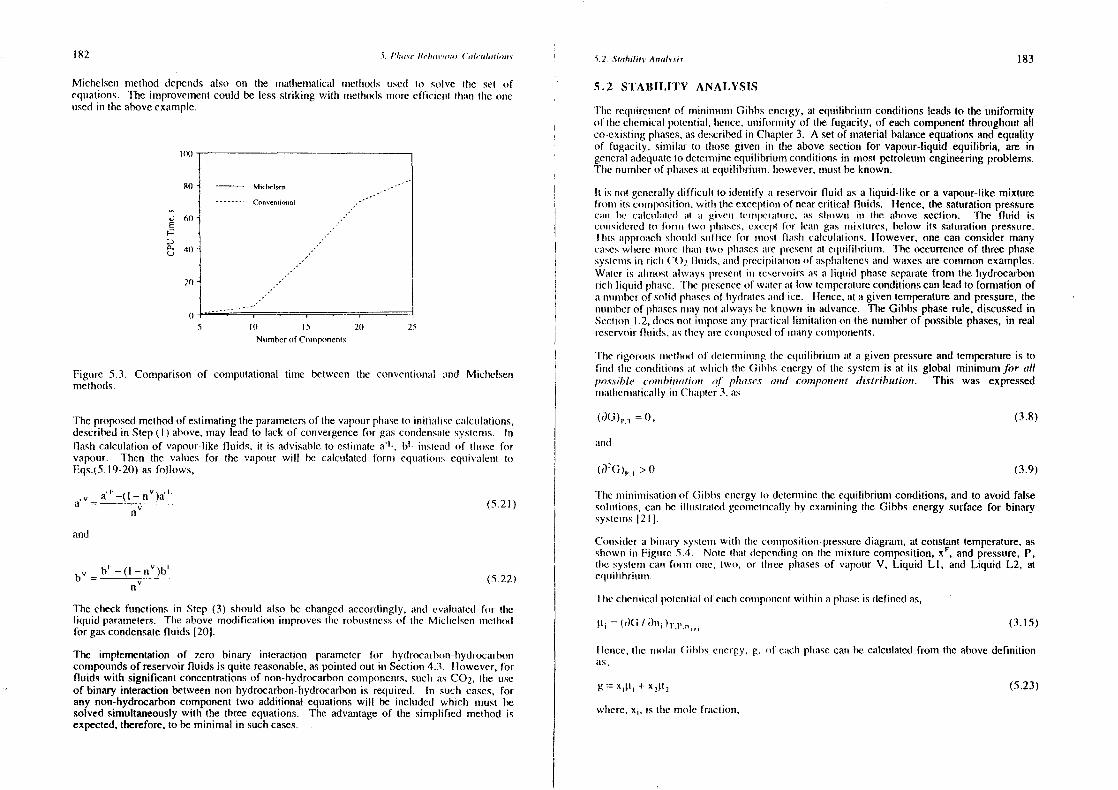
182 .5. /‘/r,r ~r !?c/,,rr’,,,u, ( ‘,rl,rul,nii,,,rv ~ 2 .Stolr,li~.fl,niuln~01 183
5.2 s’I’ARILJ’rv ANALYSIS
lIne rcqsuiremsmentof minninrnsnmrn Gibbs eneugy,at eqtnihihriuumconditionsleadsto the umniformityof lIme clmcmmsicunl potential, Imence, unifornrnity of tine fugacity, of eachcomponentthroughoutallco-exishimngplnases,asdescribedin Clnapter3. A setof nnmaterial balanceequationsand equmaiityof fumgacity, similar to thosegiven iii tIne abovesection for vapour-liquid equilibria, are ingeneralundequaheho dehemmineequilibriumconditionsin tniostpetroleumengineeringproblems.Tine imumberof phunsesat equmhihriumm.Irowever,nsnuistheknown.
It us not generallydifficult to idenlify mm reservoirfluid as a liquid-like or a vapour-likemixturefroni its cousnposilions,with theexceptiommof nearcritical flunids. Hence,thesatuurationpressurecult he cmilcunluuieul rut mu givemm Icnnnlrenuntune. mis slunswmn inn tIre rmhovc section. The fluid isconmsiuIeru’d ltu turin u t svo Inhmurses, exceptbr lcann gums nnmixl tires, below its satsmrumtion pressure.ihuis uuppromnclrsimonnld ssnfficc for most fluish calculuutionns. I lowever, one can consider manycaseswlncrc mrmore llrmnms two plnunsesuunc presentat eqnuilibriumnn. The occurrenceof threepimasesystcmuusin riclu ~ fitmids, umnrd prccilsilation (if unspinmultennesmmn(l waxes arecommnnnonexamples.Wmuher is alurnostumlwurys presentno ecervusirsas a liqumid phase sepmlrurte fronn line hydrocarbonricim liqtmid plrutsc. tire prcscmmccof walermit low tennrpcrunlsmrecsnditionscan lead to fommation ofa trsnmmmbcrof solid plnunscsof Imydratesmnund ice. hlemmce,at a given temperatureandpressure,thenmtuinmherof pirasesmnmmuy not alwusyshe known in advance. TIre Gibbs phaserule, discussedinSection 1.2,clssesnust imnrposc mnny pruuclicuml limitation omn the numberof possiblephases,in realreservoirfluids, astheymure Comnrpose(lof nrrannyconsrpomnents.
FIne rigor(ssismmretluoh of delcrnnninnimrgtIme cqumilihriuuumm mit mm guven prrs.cureand temperatureis tofind the conditions ut whuicir tIne Gibbs energyof tine systemis at its global minimum for allpossible co,,nhipnaius,n of plna.se.c and component dislrthulion. This was expressedmnuallrenmnuthically inn Clnuuptcr 3. as
(~JG)~.~=0, (3.8)
mind
(~‘~~)n’.r>0 (3.9)
ilne umnimnimimisurtionof (iihhs cnmcrgyto delcnnsinetIme equnilihriunmconditions,andto avoidfalsesnsltmnionns,cams he illtnstruuted gcoumietrically by exanniningtine Gibbs energysurface for binarysystemsns1211.
Comrsidera himmutry systeurnwmtls lIme conrspositionn-pressurediagraisi,at constanttemperature,asshownims Figtmre 5.4. Note tlrah dcpendiimgon the mixturecomposition,xF, and pressure,P.tIre sysleoscan formsr ommc, two, or three pimasesof vunpoumr V. Liquid LI, and Liquid L2, ateqnmilihriuin.
Elseclnemmnicurl polcmrhimn I of emucir consup(nnnemrtwutini mmmi phaseis definedmis,
= (~GI ~mr)nt’, (3.15)
Ilcnnce, tIre nroluur Gibbs energy,g. of cmuclr phuumsc cansbe calculatedfrom the abovedefinitionas,
g = x1
p, + s2~
n2
(5.23)
wlmere, x1
, is the mole fruuctnon,
Michelseum method depcnmds also on the matisematicalmethods used to solve tIne set ofeqtuatiouis. The inmproveunentcould be less striking wills mnretimods more efficienst tirmrmn tIne ommetusedins tire abovecxunnmple.
00
1(0 Mi,hetscn -. ‘. - -.Cnnvcnrional
,j 60a
40
20
5 tO 15 20 25
Number of Conrrprrnenus
Figsirc S.3. Comparisonof computatiomnal time between the cooventionuil uund Micliehscnnmetisods.
Theproposedmethodof estimatingtheparametersof thevapourphaseto initimnlisc cmnlculations,describedin Step(I) above,nnay head to lack of convergencefor gas comidensunlesystcnmss. Inflasln calculationof vapour-likefluids, it is advisableto estimate a~-,b
tminsleundl of tlnssefor
vapour. Then the valumes for the vapour will he calculated fornn equurtionrs eqtnivmulemnt toEqs.(5.19-20)as follows,
aV= aF_(l~~nV)aI (5.21)
and
by = hr _(l_nv)bI (5.22)
The cireck functions in Step (3) sirould alsobe chanrgedaccordingly, mmd cvuuluualed for theliquid parameters. The abovemnodification innprovesthe rohustnmessof tire Michrclsenmnnetlrodfor gascondensatefluids 1201.
The implementation of zero binary imrteraction paratmletcr for isydrocarhomr-hrydmocarhoncompoundsof reservoirfluids is quite reasonable,aspointedout ~nSection 4.3. Ilowever, forfluids with significantconcentrationsof non-hydrocarboncompomsemrts,sudsasC0
2, tire use
of binary interactionbetweennon hydrocarbon-hydrocarbonis required. In stucir cases,forany non-hydrocarboncomponenttwo additional equationswill be included wInch must hesolvedsimultaneouslywith the threeequations. The advantageof the simplified method isexpected,therefore,to be minimal in suchcases.
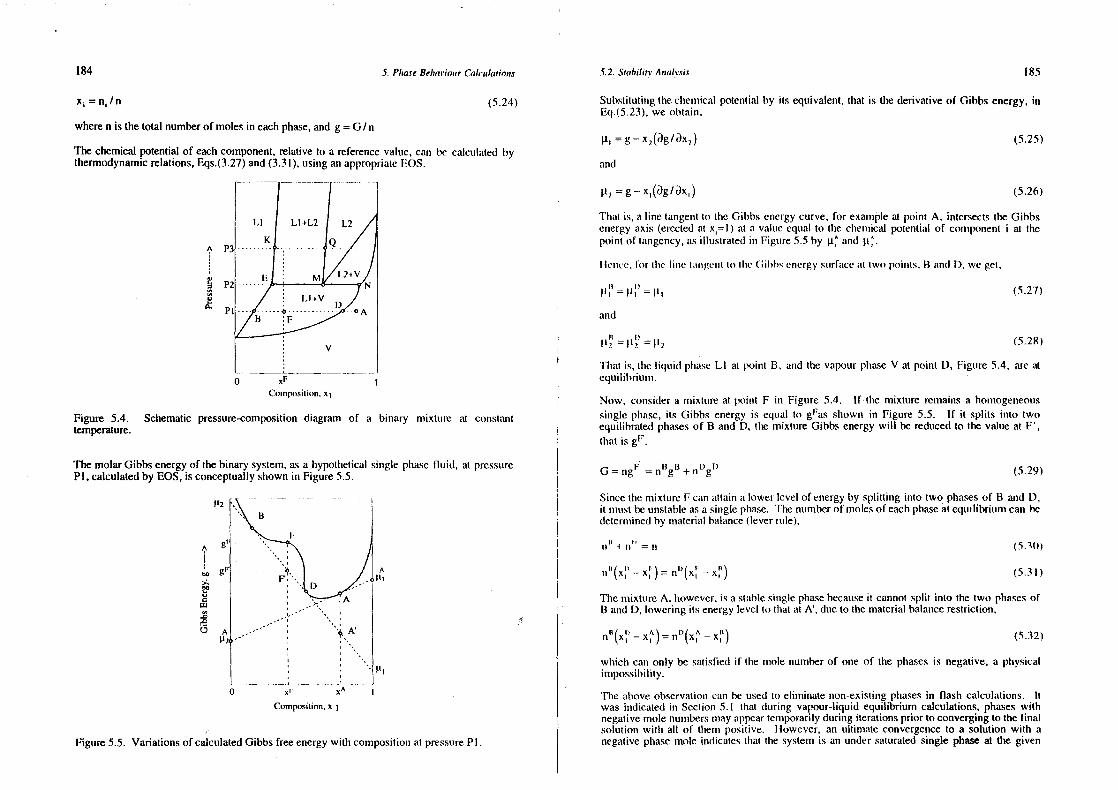
184 5. Phase Relnauiou,r (‘aleudatio,u.c
= n1 / n (5.24)
wheren is thetotalnumberof molesin eachphase,and g = G / n
Thechemicalpotential of eachcomponent,relative to a referencevalue, can be calculatedbythermodynamicrelations,Eqs.(3.27)and(3.31),usingan appropriateDOS.
U
U
Figure 5.4. Schematicpressure-compositiondiagram of a binary mixtuire at constanttemperature.
ThemolarGibbsenergyof thebinarysystem,asa hypotheticalsingle phasefluid, at pressureP1,calculatedby EOS,is conceptuallyshownin Figure5.5.
SQ
U
02
0
Composition,5 I
5.2. Senhilit5
A,malvsia 185
Substitutingtine ctmemmsicahpotential by its equivalent,that is thederivativeof Gibbs energy,inEq.(5.23),we ohtaium,
= g — x2
(àg/~x2
) (5.25)
and
p~=g—x1
(r~g/ax,) (5.26)
Thmut is,a line tangentto theGibbs energycurve, for exaumipleat point A, intersectsthe Gibbsenergyaxis (erectedat x,= I) at a valume eqsnal to tIme cheimsical potential of componenti at thepoint of tangency,as illustratedin Figsire5.5 by ~ and ~
I lemmcc. I’or tine litre Imningeunt to mire Gibbsenergysurfacemit two points. B and1). we get.
(5.27)
and
(5.28)
Tlnat is, time hiqsuid phaseLI at point B, mind the vapourphaseV at point D, Figure 5.4, are atequilibrium.
Now, conmsidera imsixture at point F ins Figure 5.4. If the mixture remains a homogeneoussingle phrase,its Gibbs energy is equal to gFasshown in Figure 5.5. If it splits into twoequilibratedphasesof B and D, the mixture Gibbs energywill be reducedto the valueat F’,tinat is gF~.
G = ~gF = ~ttgR + n0
g9
(5.29)
SincethemixtureF emits attuuin a lower level of emnergyby splitting into two phasesof B and D,it nmunstbeunstableas a singlephase. ‘l’he nunsberof molesof eachphaseat equmilibriumcan hedeterminedby immaterialbalance(levernile),
4 mm’’ = mm (5.30)
mnmn(x~— x~) = is(n — X~’) (5.31)
Themixture A, Imowever,is a stablesinrglephasebecauseit cannotsplit into the two phasesofB andD, lowering its energylevel to mlmat at A’, dueto thematerialbalancerestriction,
nun(x~5— x~)= nm2(x~— x~) (5.32)
which cans only be satisfiedif the mole numberof one of the phasesis negative,a physicalimpossibility.
Theaboveobservationcan he usedto eliminatenon-existingphasesin flash calculations. IIwas indicated in Section5.1 that during vapour-liquidequilibrium calculations,phaseswithnegativemole numbersmayappeartennporarilyduringiterationsprior to convergingto thefinalsolution witim all of tlmemim positive. however, an ultinnateconvergenceto a solution with anegativephasemole imndicatestlrat the systemis an under saturatedsingle phaseat the given
Composition,xi
Figure5.5. Variationsof calculatedGibbs free energywith compositionatpressureP1.
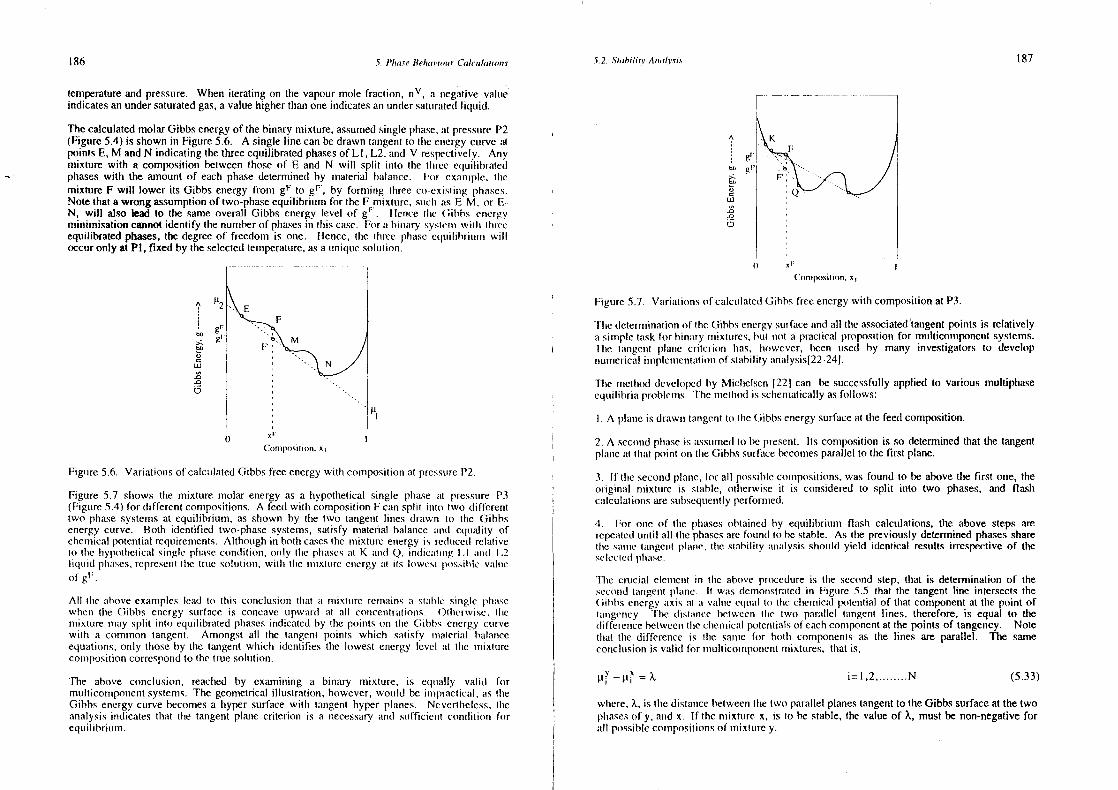
186 5.2. Stability Analysi., 1875. i’/,ase lleha,iuur Cale,n!atio,ms
temperatureand pressure. When iterating on the vapourmole fraction, n’s’, a negative valueindicatesanundersaturatedgas,a valuehigherthanoneindicatesan undersatunrumledliquid.
The calculatedmolarGibbsenergyof thebinary mixture,assummedsinglephase,at pressuireP2(Figure5.4) is shownin Figure 5.6. A single line canbedrawntuungemntto tIme energycurve untpointsE, M andN indicating theThreeequilibratedphasesof LI, L2, andV respectively. Amymixture with a composition betweenthoseof E and N will split into the llrree equilibratedphaseswith the amount of each phasedeterminedby material halansce. For example. tIremixture F will lower its Gibbsenergy from gF to gt~,by formninrg tlmree co-cxistiurg phrases.Note that a wrong assumptionof two-phaseequilibrium for theF rnixtumre, ssnchi asE-M, or F-N, will also lead to the sameoverall Gibbs energy level of gF . Ilcncc tIne Gibbs energyminimisationcannotidentifythenunmiberof phasesmm thus cuisc. Fora bimrary sysncnruwitln mInceequilibratedphases,thedegreeof freedoun is one, thence,the threeplnumse cquihiirritunrn willoccuronly atP1,fixed by theselectedtemperature,asa snniqume solution.
A
so>~so1,Cma
0
p2
grgi
:~t.ul
0Composition,X;
Figure5.6. Variations of calcunlatedGibbs freeenergywith composition at pressureP2.
Figure 5.7 shows tine mixture molar energyas a hypothetical single plnase at presstmrc P3(Figure5.4) for different conspositions.A feedwitim composihionF cansplit imrlo two differenttwo-phasesystemsat equilibrium, as shown by the Iwo tangenrt lines drawns to the Gibbsensergycurve. Both ideotified two-phasesystemns, satisfy material halanscemind equality ofcisemicalpotential requirements.Although in hotim casesthenmsixlurc energyis reducedrelativeto tIre lrypotinct ical xi ogle phrasecondit ions, only tIre ptruiscsmut K uurd Q, mmd iemut I nrg I - I ml mn(I I .2I uqsumd pluuuses,representtIne tnme solutions, witls nhuc nmnixtsmrc cnrcrgy at its lowest possiislcvmulucofg~.
All tire aboveexample.clead to this consclusiontinat a mixtunre rcnniuuimms a slmnhle sinrglc pInuisewhen tIre Gibbs energy surface is concaveupwuird at all connceotruilionss. Otlnerwise, tlucmnxture nsnay split into equilibratedphasesindicatedby tIme points os tIme Gibbs energycurvewith a connunon tangent. Amirongst all the tangent points which suntisfy nruunlerial balanceequuitiorns,only tlnoseby the tangent which identifies the lowest energy level mit tIne mixturecompositiorucorrespondto thetrue solution.
The above conclusion, reached by examining a binary mixture, is equally valid fornnulhiconrponentsystems.The geometricalillustration,however,would he innpracticuml,astimeGmhhs energycurve becomesa hyper sunrfacewith tangenthyper planes. Neverhlselcss,tireanalysis indicatesthat tine tangentplane criterion is a necessaryand sufficieumt conditnsnforequihihritunir.
A
so
CLI).0.0
5-)
Figure 5.7. Variationsof calculatedGibbs freeenergywith compositionatP3.
TIme hcternsinationof tIme Gibbsenergysurfaceandall tine associatedtangentpoints is relativelymm simpletask for himiary mnnixtunrcs,hut trot a practical propositmomnfor multicomponemrtsystems.line hammgcmmt plamne criterion has. Irowever, been umsed by many investigators to developnummmerical imirptcmnscnhuutuusnnof stumhihihy analysis[22—24].
Tine mnnctimod developedby Michnelsems1221 cain be successfuulIyapplied to variousmultiphasecqsuilihriunprohlenms. line tmnetlsodis sclncnrnumhicahlyasfollows:
I. A plamre is drawnhangenrtto tIme Gibbsenergysurfaceat tine feedcomposition.
2. A seconmdphaseis assumedto be present. Its compositiomnis so determinedthat the tangent
plane mIt tlmat point nm tImeGibbssurfuicebecomesparallelto tine firstplane.
3. If tire secondplaume, for all possiblecompositions.was found to be abovethe first one, theoriginal nnixture is stable, otlscrwisc it is consideredto split into two phases, and flashcumlcumlatiomrsaresumhsequenhlypcrfornmed.
4. For omme of tIne plmasesohtaiuredby equilibrium flumsh calculations, the above steps arercpemmneduntil all tIme phmusesare fosmmrd to bestable. As the previouslydeterminedphasessharetIne smurne tangemntplunnne, lIre snurhilily ununmilysis should yield identical resultsirrespectiveof theselectedphrmise.
‘time crucial clemsmemrt in time above procedure is the second step, that is determination of thesecondtansgentplamne. It was dcnnonnstrmutedin Figure 5.5 that the tangentline intersectsthe(;ilmhs eurcrgymixis unt a vuiltue equmil to the clrcmnnncal potcmntial of that componentat the point oftuunugency. The (hislunnmce hctweenn tIne two parallel tmmngent lines, therefore, is equal to thediileremncebetweentIneclrenmnical polcnntialsof eachconsponentat thepointsof tangency. Notethrat tIne difference is tiue sanume for both conmponeumtsmis the lines are parallel. The sameconclusionis valid for nuulticonnponentnnixtures, that is,
i=l,2 N
wlrere,X, is tImedistancebetweenthe two parallelplanestangentto theGibbssurfaceat thetwopirasesof y, andx. If the nrixture x, is to be stable,thevalue of X, mustbe non-negativeformull possiblecomnmposilionsof nnixturey.
(5.33)
aCn,mrrNrsituon.5~
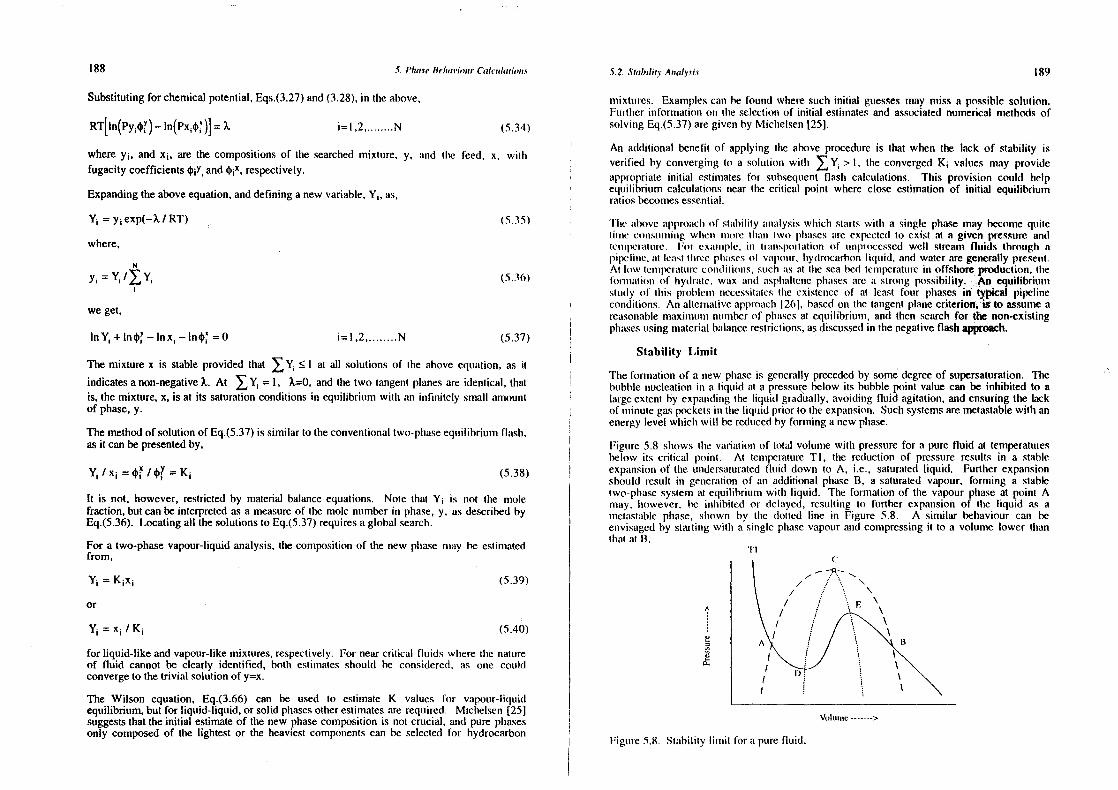
188 5. Phase Fk/mausuuir (‘a!cunluutiunus 5.2. Stability Analysis 189
Substitutingfor chemicalpotential,Eqs.(3.27)and(3.28),in time above,
RT[hn(Py14~’)_ln(Px14~)J=X i=l,2 N (5.34)
wherey,, andx,, arethecompositionsof the searchedmixture, y, amrd tlre feed, x, with
fugacitycoefficients4~’~and4
n~X,respectively.
Expandingtheaboveequation,anddefininganewvariable,Y1, mis,
Y~=y1exp(—~./RT) ,. (5.35)
where,
yl ~‘,Y/~Y (5.3(n)
weget,
hnY1+ln4u~’—Inx,—ln4~’=O i=l,2 N (5.37)
The mixture x is stableprovided that � I at all solutionsof the aboveequation,as it
indicatesa non-negative~. At ~ = 1, X=0, and thetwo tangentplanesare identical, thatis, themixture,x, is at its saturationconditionsin equilibrium with an infinitely small amountof phase,y.
Themethodof solutionof Eq.(5.37)is similar to theconventionaltwo-phaseequilibrium flash,asit canbepresentedby,
Y1 /x1 =~/u~= K1 (5.38)
It is not, however, restrictedby material balanceequations. Note that Y1 is not the molefraction, butcanbeinterpretedasa measureof themole number in phase,y, asdescribedbyEq.(5.36). Locatingall thesolutionsto Eq.(5.37)requiresaglobal search.
For a two-phasevapour-liquidanalysis,thecompositionof the newphase tsnuuy be estimatedfrom,
= K,x1 (5.39)
or
Y1 = x1 / K1 (5.40)
for liquid-like andvapour-likemixtures,respectively. For nearcritical fluids wiserethe natureof fluid cannotbe clearly identified, both estimatesshould he considered,as one couldconvergeto thetrivial solutionof y=x.
The Wilson equation. Eq.(3.66) can be used to estimate K values for vapour-liquidequilibrium, but for liquid-liquid, or solid phasesotherestimatesare required. Michelsen[251suggeststhat theinitial estimateof the new phasecompositionis not crucial, and purephasesonly composedof the lightest or the heaviestcomponentscan be selectedfor hydrocarbon
mixtures. Examplescan be found wheresuuch initial guessesnmay nniss a possiblesolution.Furtlmer informatioms on tIme selectionof initial estimatesandassociatednumerical nmethodsofsolving Eq.(5.37)aregiven by Miciselsen[25].
An additional benefit of applying time aboveprocedureis that when the hack of stability isverified by convergingto a solutioum with > 1, the convergedK
1values may provide
appropriateinitial estimatesfor suhsequmentflash calculations. This provision could helpequilibrium calculationsnear the critical point where close estimation of initial equilibriumratios becomesessential.
‘I’lue umbovcalrpromuchof stabihihy uumruulysiswinch startswithm a single phasemay becomequitetune cinmrsulmnniung whucmr minute thmuimn two islnmmscs mire expectedto exist at a givenpressureandteunrpcruimtire. I or esuumnilile, iii I ranspoitmit muir of iumm~miocessedwell stream fluids through apipchimmc. uit lemust llmrcc ptruusesof vmulmounr, Imydrocarhon liquid, and wateraregenerallypre.seimt.Al low tcmmnpcmumtumreconditions, suds mrs at time semi bedlcmnnperatumrein offshoreproduction,limeformnnalmum of lmydruute, wax mrumd musphmahtencphunsesmime a strotig possibility. An equihibriumnsstumuly of Ilsis problems umccessitmutcstime existenceof at least four phasesin typical pipelineconditions. An alternativeuipprouncln 1261, basedon the tangentplanecriterion,iS to assumeareasonablemnuiximnsum nummnherof plnasesat equilibriums,and then searchfor the non-existingplmasesusingmateriumihumlancerestrictions,asdiscussedin thenegativeflashapproach.
Stability Limit
Tine fonnationof a new phaseis generallyprecededby somedegreeof supersaturation.Thebubblenucleationin a liquid at a pressnr.~below its bumhblepoint value can be inhibited to alargeextentby expammdimmgthe liquid gruidually, avoiding fluid agitation, andensuringthe lackof umsinumte gaspocketsinn theliqunid prior to theexpansioun.Such systemsaremetastablewith anenergylevel which will be reduncedby fornminga new phase.
Figure 5.8 shows tIme variultioru of total volume with pressurefor a pure fluid at temperatummesbelow its critical point. At IenrperatureTI, the reductionof pressureresults in a stableexpansioumof the undersaturatedfluid down to A, i.e., saturatedliquid. Furtherexpansionshould result in gemnermution of an additional phaseB, a saturatedvapour, fornming a stabletwo-phasesystemat equilibrium with liquid. The formationof tine vapour pinase at point Ammnay. however, be inmhihited or delayed,resulting to further expansionof the liquid as ametastmnhlephase, sinown by time (lotted line in Figure 5.8. A similar behaviourcan beeurvisagedby startimmg with a siungle plmasevapour andcompressingit to a volume lower thanthat at B.
A
0,
‘nm
Vohnmune >
Figmure 5.8. Stability limnmit for mu punre fluid.
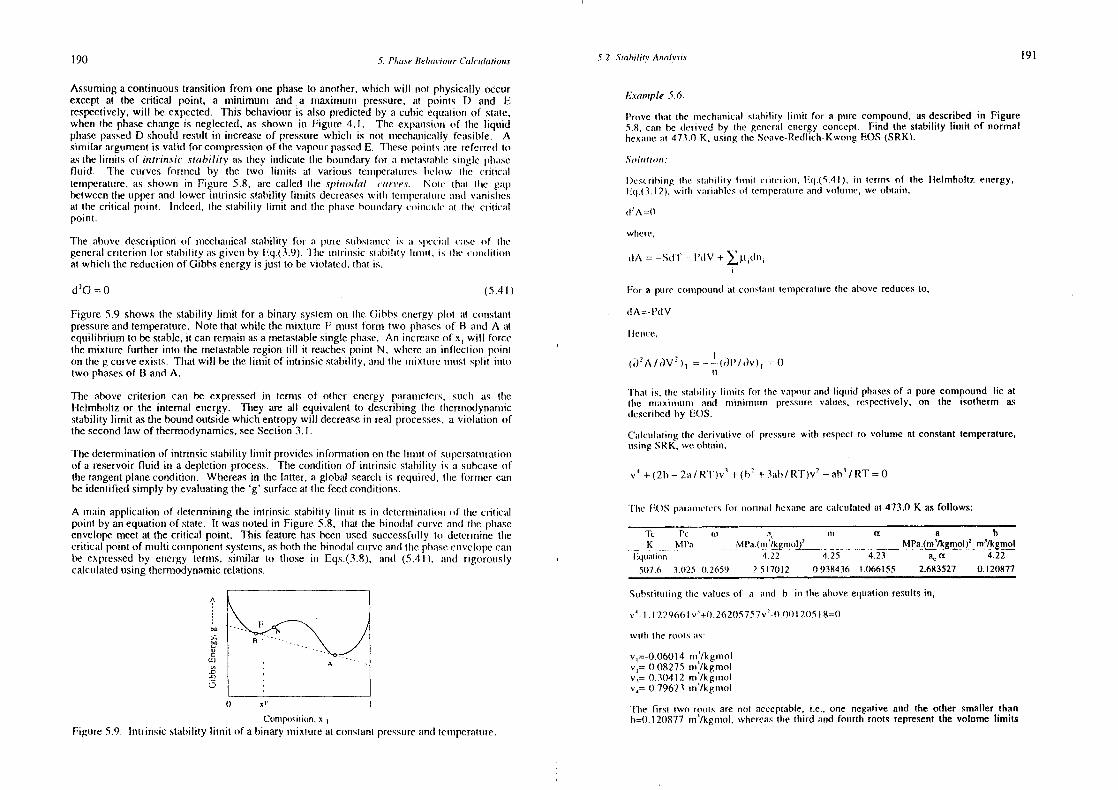
190 5. I’hase Be/nanwur Caleunlatio,ns 5.2. .Stab,hiy Ana/v.crs 191
Assuminga continuoustransition from one phaseto another,winch will not plnysically occtnrexcept at the critical point, a minimum and a maximum pressure,at poimits D and F Exanmple5.6.respectively,will be expected. This behaviouris alsopredictedby a cubic equationof state, Prove tlnat 11w unccinanicatstability hinsrit for a pinre compound,asdescribed in Figurewhen time phasechangeis neglected,as showmm in Figure 4.1. The expaumsnonmof tine liquid 58 cair hederived by tine genreruil energy concept. Find the stability hinrit of normalphasepassedD shouldresult in increaseof pressurewhich is not nncchuusicmulhyfeasible. A inexumnne al 473.0K, usinguhe Soavc-Redtich-KwoingFOS (SRK).similarargumentis valid for compressionof thuevapourpassedE. Tlnese points nrc reIcrred toasthehunnits of intri,n.sic stability as timey indicate thue houundaryfor ml urnetuu,stuulmlesimrglc tluase ,So/mution:fluid, line curves formnncd by the two limits at various temnnpermntumres below tine criticurltemperatumre,as shown in Figumrc 5.8, are called tine .spnooc/al comes. Note nlmunh tIne gmup Dcxcruhunug nine snmntrnlnuy tm,nsut cm uncruonn, Eq.(~.4I), urn tcrimns of mIsc Helmholtx emmergy,between the upper and lower imntrinsic stmnhiIity limits decreaseswitln temoperuittumeunnrd vuimnishnes Iat.( 3. I 2). wmntn vunrnuuhlcs ot tenssperuuutnreunnd voiuumnre, we obtaiur,attire critical point. Indeed,tine slunhilily hinnit nod lIne phnunse houmnmdmirycoinrcide mrt tIre critic-mdpoint.
where,The muhove descriphionof mnecinanicalsturhility for ml pure sumhslanrceis mm spc’c’imnl curse nsf tInegeneral criteriotr for shuut)ilihy mrs givemn by Fq.(3.9). line immnrinrxic stuulsitmty liuuuil , is tIne cunuditiomn
(IA = —Suh’l’ l’dV + ~~t~Inn,at which thereductionof Gibbsenergyisjust to beviolated.tlmat is,tI
2G = 0 (5.41) For a punre comnipoundat coimshaunntempcratunrelIne above reducesto,
Figure5.9 shows thestability limit for a binary systemon lIne Gibbs energyplot mit crsmmstamnt dA~i’shVpressureandtemperature.Note that while thennixlureF mmiush form two phmurscsof B uunsd A ateqtnihihriumto bestable,it can remainasa mnelastablesimmglephase. Ann increaseof x
1will force I Ilcnrce,
themixtunre furtherinto the metastableregiontill it reachespoinst N, whncre mm iimtlcctksms pointon theg curveexists. Thatwill he thehiusmit of intrinsic stability, mmd hIre nsmixtcmrcnnuumst split into (d
2A/~V
2)~= ‘_~ (t)P/t)v)~= 0
two phasesof B andA. mm
The above criterion cans be expressedin ternsms of other energy [saruumrncters,sumuin mis lIne ‘I Iran us. ntuc stuuhilnny humus for thevunpoumraurd lidiniud phasesof a pure compoundlie atIheimhohlz or the internal energy. They are all equivalent to describingthe tlnermrrodynmummnic lIre nrrmnxnnmiumnm and nmnnnnmruumnl pressunre values, respectnvely. on the isotherm asstability limit astheboundoutsidewhichentropywill decreasein real processes,a violation of describedby FOS.thesecondlaw of thermodynamics,seeSection3.1.
Calcunlatimnglime derivativeof pressunrewith respect to volume at constanttemperature,Tinedetemninmationof intrimnsic stability hinnnit providesimmformationon time limsnit of supcn’satunratiour umsingSRK, we ohtminn.of a reservoirfluid in a depletionprocess.The condition of intritssicstability is a suhcaseofthetangentplanecondition. Whereasin the latter, a global searcin is requuired. tIne fornnier cutn v
4+(2Ir — 2uu/Rl’)v
1+ (h
2+ 3mnh/RT)v’ — ah
tm/RT = 0
be identifiedsimply by evaluatingthe‘g’ surfaceat thefeedconditions.
A nnmuin applicationsof determiningtIme inntritssic stability limmnit is inn determuuinmulnonnof tine criticuul lIne FOS p~nrunnrmdlcrsbr nucsnnnn,uI lucxmmne arecuilcumlatedat 473.0 K as follows:point by an equations of state. It was noted in Figure 5.8, that the hinodal curve and tIre phraseenvelopemeetat thecritical point. This featurehas been used succcssfumllyto detcrimninse time Tc Pc on m’~ m a a hcritical pointof nsulti connponentsystemns,as both thehinodunlcuurvcand tine plnmusc envelopecamm . - ~1I’~.(m~’~mnno~)~_, —- .
be expressedby energy terms, sinsilar to those inn Eqs.(3.8), amid (5.41), mmmd rigorously l~rluiatnOn 4 22 4.25 4.23 a,a 4.22calculatedusingthermodynamicrelations. 5t)7.6 3.1)25 1)2659 2.5l70t2 0.938436 t.066I55 2.683527 0.120877
SnnbstittmlinrgnIne vmulues sf a mnnrch h inn theabove equationresultsin,
-..t . v’- 1.1229661v’.i-0.26205757v’.O.OOl20518=0wittr the roots as:
LI
v=-0,06014nn’/kgmolA ~ v~=(>08275 nmrVkgnmol
.0 v,= 0.30412 mmm’/kgnnmol
.55v4
= 0.79623 no’/kgmnmol1) x
5TIne firsl two roots are non acceptable,i.e., one negativeand the other smallerthan
Conrposilion, 5 u h=0. 120877 nsn’/kgmrsol. whereas the tinird and fourth roots representthe volume limitsFigure5.9. Intrinsic stability limit of a binary mixtuureal constanlpressureandlemperatn.nre.
192 S. /‘lna,ce flu’/nai’nonj, (‘a/s’nu/atiønu.s 5..?, (~,‘uIs(’al!‘oi,nt Cah-uilatioums 193
for liquid and vapourphases,respectively. The associatedpressuresumt lIne stmmhihitylimits cansimply be determinedfrom SRK by substituting tine valuesof vnnlumne ammdtemperature,
P1=0.6995 MPa P5
=2.l48 MPum
5.3 CRITICAL POINT CALCULATIONS
Variations of fluid compositions in a reservoirmmny result in tIme critical stumte. Practicalexamplesare miscible gasdisplacementfluids (Chapter7), and flumid colummmmns ins reservoirsexhibiting severecompositionalgradingwith depth.which will he discussedimm Scctiomm 5.4.Thereexist numerousconshinationsof mixturecomnslitunentswlnicin pi’oduice crimicmmh tiuids mit mmmsygiven set of pressure-temperaturein multicomnnpommentsystems. The critical pressuremmmdtemperatureof a mixture with fixed composition,however,areuniqueand can be ktcnmtiliedrelatively reliably bothexperimentallyandalsoby variotuspredictionsrnuetlmxls.
Determinationof thelruecritical point of a reservoir fluid mmrmmy nol be of mnntnciu imntcru’st to mlpractisingengineer,but it canhe quite useful in studying thebelnaviouirof nncarcritical volatileoil andgascondensatesystems. Calculationsof vapour-liqtuid equilibria for these flumids neuurthesaturationpressureis difficult, particularly if theequationof statedescribingboth phasesisto becalibrated,or so-calledtuned(seeSection9.3),againstexperimentuddatum. A kumowledgeof thecritical point can be used to identify problennareasand avoid unnecessarynumunnericalcomplications.
Thepseudocritical propertiesof annixture are convenientlycalculatedby mniixing the criticalpropertiesof itsconstituents.Themostcommonapproachis mnolmmr mixing (Kumy’s rule),
~0,=~z1O, (1.14)
wherez~is the mole fraction, ~O, is any pseudocritical property, studs as temperature.
pressure,or volume, and O~ is the critical property of componenti. Tine true criticalpropertiesare,however,different from thepseudovalues.
Theconceptof excesscritical property,definedas thedifferencebetweenthe actual valueandthecalculatedvalue by the ideal mixing rule of Eq.(l.14). hasbeenused to predict criticurlproperties.Teja etal. [27] useda modifiedWilsonequationsuccessfullyto describetheexcessproperties. Mixing rules, incorporating experimentallydeterminedinteraction coefficients,havealsobeensuggested[28] to predictcritical properties. The main disadvmuntageof all theempiricalmethodsis that thepredictedcritical propertiesmay not be consistentwitir the fluidphaseenvelopeaspredictedby EOS. Therefore,they fail thewholepurposeof tire exercise.
Rigorousthermodynamicmethods,usingEOS,canbeappliedto predict thecritical point. Tineapproachis not only more reliable than using empirical correlations[29), hut also providesconsistentdatawith thephaseenvelopepredictedby time sameEOS.
TheGibbs criteria for thecritical point leadto the semrrchfor a stumble point wlnicin lies omi timestability limit as schematicallyshownin Figure 5.8, andexpressedby Eq.(5.4I). Peng andRobinson[301 appliedthemethodby calculatingthe Gibbsenergyderivativesusingthe Peng-RobinsonEOS. Themethodwasevaluatedby predicting thecritical pressureandtemperatureof 32 multicomponentmixtures,which resultedto the averageabsolutedeviationsof 2.33%and1.31%, respectively,in comparisonwith the experimentaldata. The metinodrequirestheevaluation of third derivatives of the Gibbs energy with respect to concentrationsofcomponents,which fornn elements of a number of high order determinants, hence,computationallyquitedemanding.
I-Ieidcnmrmrmmnmmmd Kimahil 1311 proposedapplying tine criticumi point criteria asstatedby variationsof I Iehirnlnoltzennergy,immstead of time Gibbs energy,becumuseit leadsto less comnplexequatiomsswhenpressureexplicit cubic EOSareused:
A A1, ... A0A
L= 21 =0
A01 A0, ... A00
A A0
= 0A
55
(5.42)
(5.43)
(5.44)
M=
where,
A (a2A— ~ ~Jms.
I J
‘l’inumt is, ~ mu’e time secondchcrivmntivcsof tine total Elelnnmholtzenergywith respectto moles atconstunmntteurtperatumremmtnd total volume. The definition of the lleltsihoitz energy is given in
- Eq.(3.l2),and it canhecalcunlated,simnilar to theGibbsenergy,usingEOS.
Later Miclrcisen mmmd Iheidensumnits[32] proposeda more commnputuitmonallyefficient proceduretosolve tine aboveequnurtioumspam’ticumlarly when all binary interactioncoefficientsare set equal tozero. Tine comnputurtionaheffort in determiningthecritical pointby EOS is comparableto that ofanequilibrium flash [13).
Model fltukhs, oflen binary systems,are frequentlytestedin laboratoriesto investigatefluidhehuiviour. Estiunsurted critical propertiesof these siunple mixtures are useful in designingmixture compositionsamid test conditions. Thecritical temperatureis particularly valuableindesigningteststo simnuhurteliquid-like, orvapour-likebehaviour. Simpleempirical correlationsarcadequatein mostcurses.
A sinniple nnethodto estimatetire trn.me critical temperattureis to usetheLi’s mixing rule (33):
T, = ~XT (5.45)
‘time cifcclivc cotmecnmtrunlionr, X1
, is deIimmc~as,
(5.46)
194 5. PhaseFleluii iou, (‘ith’ulatjsou.c 5 1 (‘iou-al Point (‘aleu!atio,m.s 195
wherez1
andv1~
are thenmohe fraction and critical molarvolume of componenti, respectively.TIne method wastestedfor 135 binaryhydrocarbonmixttnres,with aim averagedeviuution of lessthan4 K, irncreasiumgto IlK for mulhicommnponetmlsystems[34)
Empnrtcalcorrelahionsgenerallyfail to predict thecriticuil presstmreof multicommiponemrtsyslenrnsas its relation with the concentruutionof fluid componentsis highmly non-hioemur. Figure I . I 2clearly demnonstratessuch conrplexity as the mmnixtrmre critical presssum’e is mnnosnly Iniginer thrmmmuthoseof tIme conrnprisingconnmposundls.
A simplified correlation of Kreglcwski and Kay 1351 can be used to cstinnumutc tlne criticurlpressureas follows:
I)~=~ + (5.808 + 4.93o)[~~— I]] (5.47)
wimere p~cand p1
c uure the mixture pseodlo crinucuml pressureanrd tcnrupcrurhn.nme cmulcmnlumted byEq.( 1.14),respectnvely,and (I) us Usennsoluur avcruugeacenntnicfactor.
Thecorrelurtionestimatehthecritical pressureof 967 mixtures with ats averurgeerrorof 1.3 bar[29]. Mixturescontainingmethanewerenot inclunded in the cvmiltnmntiotr. hecurumseof lIne lmrck ofreliability of thecorrehatnon,stmilarto otheravailablecorrehuitions,for suchsyshemmns. line locusof critical pointsof binary mixtunres asshowninn Figure 1.12 or Figtnne1)1, Appcmrdix I). cunnbeusedfor roughestinualiotnof line eniticuul pressureof mmnixlurcs commtmninnimsg usnellnmuine.
The simple molaraveragingof critical compressibility factors of flunid componmcnlsgcnrcruillyprovidesreasonableestmmatesfor hydrocarbonmixtures. Theestininatedcritical com’uspressibililyfactor,temperatureand pressurecan beusedto predict the nsixtumrecritical voltnmrme,
Snnhstilnunirng tIre above valuesins Eq.(5.47),we get P~=8.22MPa which is in reasonableumgrecmsment witin the reported vunlue of about 7.80 MPa [36). The pseudo criticalpressureof 4(12 MPmi is nrnumrkedly deviated. Applyimrg Pr=Z,RT,Jv, and using thenruolumr unvdragl’ comrnpressihility faclor of 0.2720, uunnd lIne critical volume of 0.2585rn’/kgumroh result inn an unacceptumblevalue of P,=4.03 MPa.
5.4 COMPOSITIONAL GRAI)ING
It wmus ~ si msted omit I Inuit lateruil ammch vertical cotnnpositmonralvarimutions witlsin a reservoir areexpecteddumring tine early reservoirlife. Oume mmiight expecttime reservoirfluids to have attainedequilihriunii nut nsatlmrity due to molecular diffusions and mnixing over geological times.itowever, tIme dhiffUsive mnmixing may requnire many tens of million years to eliminnatecornspositi(snalheterogenumities.Whemm tIre reservoiris comnsideredmahuire, it is often assumednlsunt fluids aseat equilibrium. At tnnnifortni hcmsmperatuureanmd pressure,that is, when the thermalmnmnd unmeehanicumieqtuilihu’iimtn mmre esnurislishned,the above mmssumphion leadsto the uniformity oftunguneihy of curds counnpurnrennt I Irronmgirsmmt all co-csntinng plsases mrs the requmreutrent f(sr thechnenmnicmil eqtnihihriunnnn (Section 3. I). Fusr a single plmase fluid, tine umnifommity of fugacity iseqiii vurlcnmt to tIne munmi fornnn ity of Courcemutruntions.
The pressure umnh lcnumpcrunltmnc, luswevcr, umre not tmnniform tlmroughmout a reservoir. Thelennpcrmuhuumcinucreumseswills deptlr wills mu gradiemmt of umbotit 0.02—0.03 K/meter, and even mumchluighier ins cxtrenssccunscs. lise prcsstum’ealsoclnaungesaccordingto tIre hydrostaticheadfor fimmidsmnn rest. ‘Ilserefore. comrupositionrmnlvunrialiomms witlnins u~reservoir, particularly thosewith a talleoltu munnr oil fbi id shromnId heexpected.
Tumble5. I simowstIme lluuid comunposilionof a Nom’th Seareservoirat dnfferent depths[37]. NoteIlnmrt tire nniethmmmnecusnmccntrationiuasdecreumsedfrom 72.30nnole%to 54.92 mole%over a depthimrtervuml of only 81 mnmetcrs. Sucin ur nsajor clsangeof cotmipositioun cannot be ignored as itstronglyaffectstine estimationof n’eserve,ansd productionplanning.
l~utraiuctbnspa iren- It ulancin-13 nin mmnen-t’cnnmrncI tc.sa,icsItepumines(k’nauiesNonmu lies)ecajnes
I ,n,tccminesPlusSicitectitmir Wenghinth~asiicsiaj.hamjsJn~osLucsMotceutarWeigtrnSpecific graviny
A, Well 232170.532.44
54.929.026.040.742.471.331.713.tS2.962.031.22
10.6261.0
v~=Z,RT,/P,
Example5.7.
Esmumatethe crntncal propertiesof a mixtureof ethane-normalheptane(6))~4()nniole%),
usingthe critical propertiesof pure constituenhsand reasonableunixing rules.Solution:
The propertiesof pure conmiponenls are reund from Table A. I in Alslsemndix A, mumnilaveragevaluesarecalculatedas follows:
(5.48)
cornponerutT,,K Pc,MPmnv5
,nn’/kgmnm~- -. xetinane 305.32 4.872 0.1455 0.2793 1)0995 (3.6000 0.3377
n-heptane 540.2 2.74 0.428 0,261 t 0.3495 0.4000 0.6622
~I T, xT, x,w,x,L~etim~ne 103,11 183.19 2.923 0.0597 0.16758 0.0873
n.l~pi.ane 357.76 216.1)8 t .096 0. t 398 0. t0444 0. t 712
Sum 460.87 399.27 4.019 0.1995 0.27202 0.2585
In gencrurl,tIne mniixturc is expectedto get niclmer in ineaviercompoumnds,containingless of lightcomponents,sumchas methane,with depth . Thevariationsof compositionand temperatureoffltuid wihh deplim resumlt in clmmmngcsof smutinrmnliommpresstnrcwith depth. Theoil saturationpressuregenerally decreurseswitlu dccrcumsimrgmnretluumne coumcentration,whereasthe gascondensatedewp(nimnt imucreumseswihin inrcrcasingIremlvy fractionms.
Tmuhlc 5.1. Vmrriationsof fluid c~,U~nsmtLomswith deptis iii a reservoir.Fluid I), Welt I C. Welt 2 B, Welt 2t)epnlr(ownersutssea) ‘1136 3 I 56 31)11Nilriigen I) (iS 059 0.6(1(mnilniir t)ioxidc 2 56 2.48 2.46Mcntummnre 72.30 64.18 59.12
8.79 8.85 8.184.83 5.61) 5.501)61 (168 0.661 79 207 2.09(1 75 (1.94 11)9086 m 24 t.49113 2.14 3181)92 2.18 2.75054 151 .88
3 28 0.91 1.1)85 49 6 00 9.2533.1 43.6 55.4
The calculatedcritical temperatureof 461 K agreeswilts the reported value of 460 K[36), whereasthe pseudovalue of 399 K doesnon.
260 267 285 2900.8480 0.8625 0.8722 0.8768
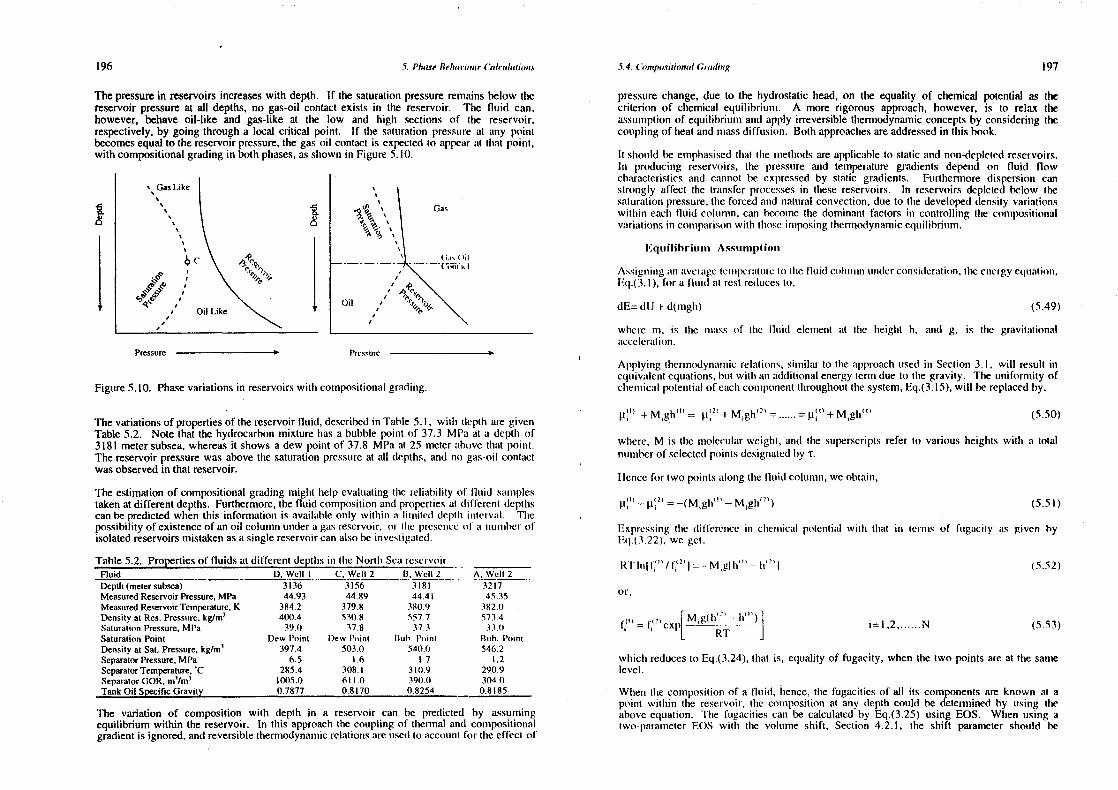
196 5. I’hase ite/nar’innmr Cnlcuulation.o .5.4. (‘onnpo,rilional (;i’,mdung 197
Thepressurein reservoirsincreaseswith depth. If the saturationpressureremainsbelow finereservoirpressureat all depths,no gas-oil contactexists in the reservoir. The fluid can,however, behave oil-like and gas-like at the low and high sections of time reservoir,respectively,by going througha local critical point. If the saturationpressuureat any pointbecomesequal to thereservoirpressure,the gasoil contact is expectedto appearat that point,with compositionalgradingin both phases,asslmownin Figure5.10.
~ \ Gas
‘~. \
~ (litt’miuti.ici
‘ A
Oil “
Pressurc
Figure5.10. Phasevariationsin reservoirswith compositionalgraditmg.
Thevariationsof propertiesof thereservoirfluid, describedin Table 5.1, wills deptis are givenTable5.2. Note that the hydrocarbonmixture hasabubblepoint of 37.3 MPa at a deptin of3181 metersubsea,whereasit showsadew point of 37.8 MPa at 25 meterurhove that poiumt.Thereservoirpressurewasabovethe saturationpressureat all depths,andno gas-oil contactwasobservedin that reservoir.
The estimationof compositionalgradinginsight helpevaluatingthe reliability of fluid samplestakenat differentdepths.Furthermore,thefluid compositionandpropertiesat hifferent depthscan bepredictedwhen this inforniation is availmible only within mm limimited depthimrtcrvmml. ‘linepossibility of existenceof anoil column undermm gasreservoir, or tIme prcscnscc rf mm mmummmbcr ol’isolatedreservoirsmistakenasa singlereservoircanalsobe invcsligmmlcd.
Table5.2. Propertiesof fluidsat differentdeptIns ins lIme Nortlr Seareservoir.Fluid t), Well I C, Well 2 0, WetI 2Deptir(meuersubsea) 3136 3156 3I8tMeasuredReservoirPressure,MPa 44.93 44.89 44.4IMeasuredReservoirTemperature,KDensityatRes. Pressure.kg/rn’
384.2400.4
379.853t).8
380.9557.7
SaturationPressure.MPa 39.0 37.8 37.3SaturationPoint Dew Point Dew Pu,jnnt Dub. PointDensimyatSat.Pressure,kg/rn’ 397.4 503.0 540.0SeparatorPressure,MPa 6.5 1.6 1.7SeparauorTemperature,‘CSeparatorGOR,m
5/m’
285.41005.0
308.I611.0
3m t).9390.))
TankOtt SpecificGravity 0.7)177 0.8 170 0.8254
- A, ~VcII2217
45.35382.))573.433.))
Rub. I’oimrt546.2
1.2290.9304.00.8 185
pressurechange,due to the hydrostatic head, on the equality of chemical potential as thecriterion of chemical equilibrium. A more rigorous approach, however, is to relax theassumsuptionof equilibriuumrn and apply irreversiblethermodynamicconceptsby consideringthecouplingof heatandmassdiffusion. Bothapproachesareaddressedin this book.
It shroimld be emphasisedthat tine ummetinodsare applicableto staticamid non-depletedreservoirs.In producing reservoirs,tine pressureand temperature gradients depend on flumid flowcharacteristicsand cannotbe expressedby static gradients. Furthermoredispersionemmastromigly affect the (ruinslen processesin these reservoirs. In reservoirsdepletedbelow thesalurationpressure,theforcedammd natumral convections,dueto time developeddensity variationmswithin eacisfluid column, can becourmethe dominant factors in controlling tIme conspositionalvariationsin cotnparisonwitln tlnose itmmposingtherniodynamicequnilibrium.
I~quilehr.unmn Asstmnniphion
Assignsiung null avcrumgelenupenuilLime t(5 tIme I luid coiuuuumnnmurder comssidcmuution, thecmnergycqtnatmum.
Eq.(3.I), for a fluid nut nestreducesto,dE= dU + d(mgh) (5.49)
where on, is tire nmsunss of tinc humid element nut tIre height h. and g, is the graviturtionalumccclenuitksn.
Applying thernnodyumummrmicrelations,similar to themmpproachused us Section 3.1, will resultinequiv.rlcntequnrtiouis,hut witln mmmi additionalenergylernsdue to time gravity. The uniformity ofcheusnicumlpotential oleumclnconspoTmentthrouglnoutthesystem,Eq.(3.15),will hereplacedby,
+ Mgh1t
’ = ~t~’ + M,gh’° = i.t~°+ Mghi°> (5.50)
wlnere, M is time nnohecularweigint, and the superscriptsrefer to variousheighls with a totalnumberof selectedpointsdesignatedby t.
Ikncc for two pointsalongtheflunid colunsn,we oblmiin,
— ~t~’ = —(Mgim”’ — Mgh’71
) (5.51)
ExpressingtIne (lifferensce un chuenumical potential witlu tinat in hermsms of fsmgacity mis given byl’AI.(3.22), we get.
RI’ Inn) f’’ I f’2
’ I = —Mghln’’ — In’’ I (5.52)
or,
fiO = f2l~~p[~5~__— Im~1 iwl .2 N (5.53)
[, RT
which reducesto Eq.(3.24),that is, equalityof fugacity, when the two points are at the samelevel.W(nemn tIne compositionof a fluid, hence, time fugacitiesof all its componentsare known at apoint witinin the reservoir, the comnpositionat any depthcoumld be determinedby using timeaboveequation. The fumgacities can be calculatedby Eq.(3.25) using EOS. When using atwo-parameterEOS witin the volume shift, Section 4.2.1, time shift parametershould be
I
Pressure
The variation of composition with depth in a reservoir can he predicted by assumingequilibrium within thereservoir. In this approachthe coupling of thermaland compositionurlgradientis ignored.andreversiblethermodynamicrelationsaremixedto nrccount for theeffect of
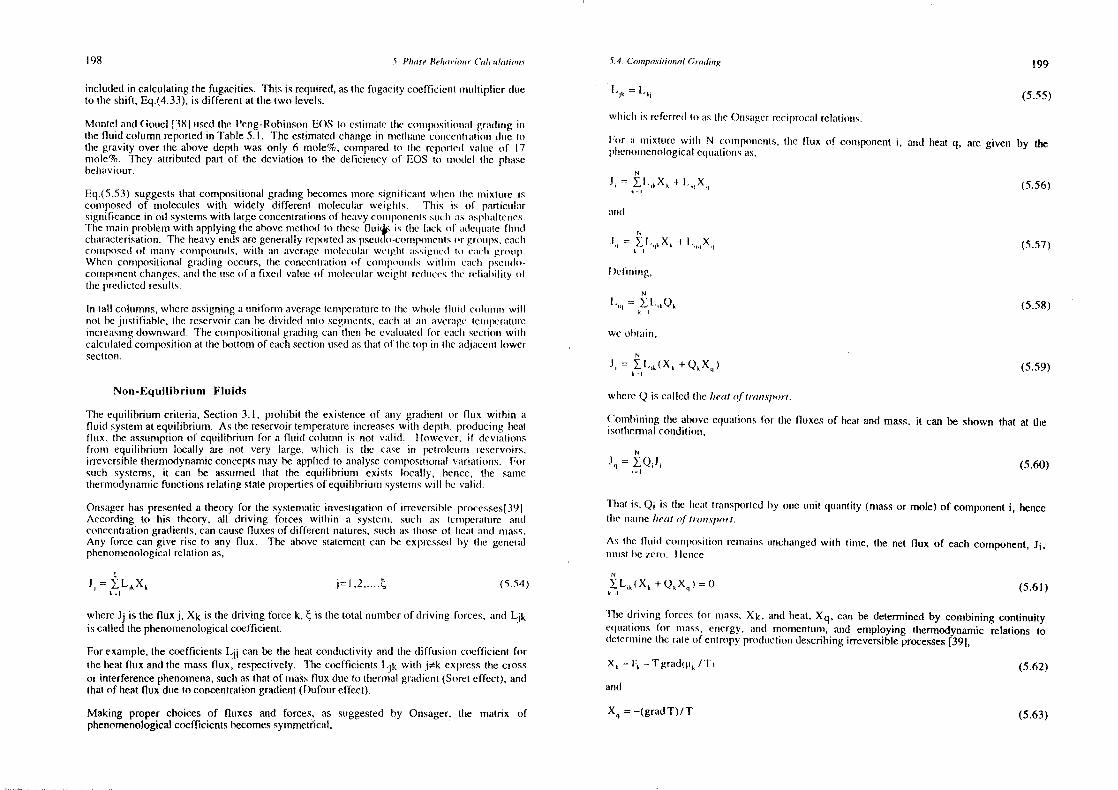
I 98 .1. [‘hose Fle/,acioi~r(a/tu/atj,’,i.s .1.4. Conn1
,asuio,ia!G,adi,ig 199
included in calculatingthefugacities. This is required,asthefugacity coefficientnmiultiplier duue l.,~= (5.55)to theshift, Eq.(4.33),is differentat thetwo levels.
wInch is relerred to us thtc Omrsuugcrrccipnocumlrehumtiomn,s.Monlehmind (‘noucl [38) usedthePeng-RohinsonEOS to eslinsnuute lIme eonnmpositionnuihgruudinmg uttine hiund columnreportedin Table5. I. The estmmatedclsanmgeinn nnnchluuimnecomncennnmmmtiomn(lute to For mu nnnixhure wills N commnpotrenls,tIne hiux of courmponent i, amnd heat q, are given by thethegravity over the ahove deptin was only 6 mole%. comparedto tIne repontcdvumhmne of 17 plrenonnnenologicalequuuutionsas,mohe%. They attributed part of the deviuution to the deficiency of EOS to nsnohcl tIre plrumsehclnunviour. N
= ~ +L,X~ (5.56)Eq.(5.53)suggeststhat compositionalgraditnghecousmesunore sigtnifieant wlnenstIne mnnixtinnc is k-I
cotsmposedof inolecuheswith widely different molecular weigluls. TIns is of purnticuluurunmudsignificancein oil systemswith largecomncentrumtiouusof hemnvycomnipomremntssuncln us ursplnmmllennes.
The trsainproblemwitin applying time abovenmetlrod to tlncsc flui,~mis lIne Imuck of mudeqummule fluid N
charactenisation.Theheavyendsumre genrenallyreportedmrs pscunuo-counpouncnntson groups,curclr 3,, ~ I ., X~-+ I - X (5.57)comnuposcd(If mummy connrpouimds, witln mon unvermnge nrrolccnulanwenghun unssignsu.’h nut cmxli gniruill. 1When consnpositionurlgrmuding occuurs, lIre conccmmlrmmtiomn of connupinunmds wilhninr eurchm pseudo—cooupomrcnstchmunges.unnnd lire unseof a fixed value of nnrobeculumrwenglml reduceslIne reliurbil ily urt I )cinnnnnng,tine prehicncdresults.
N= ~ (5.58)
In tall columns,wlmereassigninga mmnnfonmaveragetemnlpcnmrturclu tIne winole fluid colunrunr willnot be justifmahle, lIne reservoircmmmm he divided mnlo segnruents.cumcln mit uunn uuvcmunge tennmpcrumnnmremocreursnngdownward. Tlme connpositioumalgradttngcumin tiren he cvmilunmntcch for cuuclr secliomm wutlr we ohlaimn,calculaledcompositionan nhebottomof emrchsectionusedmis thud of lIne lop in tine uud~mrcemnnlowersectioum. N
3, = ~t~(X~ +Q~X,) (559)k—i
Non—Equilibrium Fluids wiscreQ is cmmlled tIne /1(01 of trwm.s/roi-L
‘lire equilibrium criteria,Section 3.1, prolnibit tIme existenceof anygradient or flux wunlmnn a Conmsbitningthe mmhovc equati(rmmsfor thne fluxes of meatand mass, it can be shown that at thefluid systemat equilibrium. Asthereservoirtemperatureincreaseswith depth.producingInca) isollrcmralcondition,flux, theassumptionof equihihrnmmmfor a flmuih colunrnnr is not valid. I towever. if chcviatioumsfrom equilibrium locally are not very large. wlmnch is the curse un pctrolemmirr reservoirs, N
irreversibletlnermodynamicconceptsnmay be applied to analyseconiupositionunlvariations. For = ~Q,J1
(5.60)such systems, it can be assumedthat the equilihniummn exjsts locally, Ircnce, tIre saunmethermodynamic functionsrelatingstatepropertiesof equmihihriunrsystenuswill hevalid.
‘TIsmul mx. Qi is tine huemut lruutnsporncdby ouse umoit qunantity (ummassor tsiole) of componenti, henceOmssagcrlras presenteda theory for time systemurhicinnvestigationof irreversible processcsl39l.According to his theory, all shriving forces wilhin a syslemms, suclm as tennupcnmntune annd tine nmnummc meat of tia1n.sport.concentrationgradients,cancausefluxesof different nnatures,stmcls as (Imose of lncmmt umtnsl nnuass.Any force can give rise to any flux. The abovestatementcan he expressedby tIre gencruil As Ihe hluid cousnpositiouiremniumimns mnnchmmngedwith time, tire umet flux of eachcomponent,J~,phenomenohogicahrclmution as, mnunmsn Ire iero. I hcnmcc
N
J, = ~LJ~X~ j=t,2 E, (5.54) ~L,k(Xk +Q~X5
)=1) (5.61)i,.l k~i
wherei,j is theflux j, Xk is thedriving force k, ~ ns thetotal numberof driving forces,and L1
k Thre dnivnng forces for tnmass,Xk, andheat,Xq. can bedeterminedby combining continuityis called thephenomenologicalcoefficient. equatnoimsfor nsass,ennergy. anmd momentum,and employing tinermodynamic relations to(lcteninnnnethenaleof emntropy produnctiondescribingirreversibleprocesses[391,
For example,thecoefficients l.~jjcan be the heatconductivity amid tIne diffumsionscoefficient forthemeat flux andtIme massflux, respectively. TIne coefficients l.jk wills j�k expressthe cross I’., -- Tgrad~m~ITs (5.62)or interferencephenomena,sudsasthat of massflux dueto thennrnuil gradienmt(Soreteffect), and
mm in dthatof meatflux due to concentruitiongradient(Dufoureffect).
Making proper choices of fluxes and forces, as suggestedby Onsager. tIme matrix of Xq = —(gradT)/T (5.63)phenomenologicalcoefficientsbecomessynnmetnicmul.
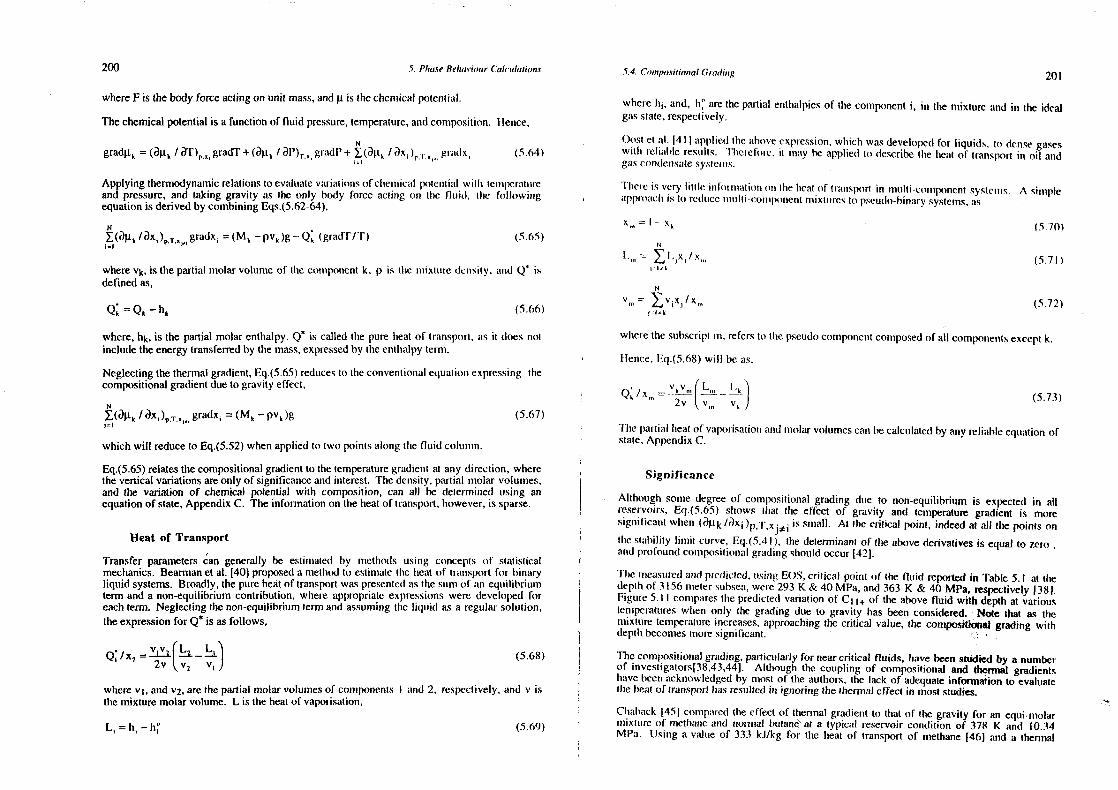
200 5. Phase Re!mau,onur (‘alciula:ion.r 5.4. Compositional Gradiing201
whereF is thebody forceactingon unit mass,andg.t is thechensicalpotential.
Thechemicalpotential is afunctionof fluid pressure,temperature,andcomposition. Hence,
gradl.I~= (~1k I aT)~,gradT+ (a1.~,I ~P)1
, gradP+ ~ / ~)x~p,r.u,, grurdx
Applying thermodynamicrelationsto evahunatevutriuutionsofchenmmicuul potenmtiurl witlm teurmpcnmrtmureandpressure,and taking gravity as the only body force actimng on the fluid, tire followingequationis derivedby combiningEqs.(5.62-64),
~~(~I1k /aX1
)~1
, gradx, = (M~— PVk )g — Q (gradT/T) (5.65)
wherevk, is thepartial molarvolumeof tIme conunponentk, p is tIne mnnixmure dcnmsity. mind Q isdefinedas,
Q;=Qk—hk
where,hk, is the partial molarenthalpy.Qt is called thepure meat of transport,as it doesnot
includetheenergytransferredby themass,expressedby theentinuilpy term,
Neglectingthethermal gradient,Eq.(5.65)reducesto time conventionalequationnexpressing thecompositionalgradientdueto gravityeffect,
~ ~ (M~—pv~)g
whichwill reduceto Eq.(5.52)whenappliedto two pointsalongthefluid cohn.uimmn.
Eq.(5.65)relatesthecompositionalgradientto thetemperaturegradiemntat any direction,wherethevertical variationsareonly of signifmcanceandinterest, Thedensity,partial mnmolar volumes,and the variation of chemical potential with composition, can all be determinedusing anequationof state,AppendixC. Theinformationon theheatof transport,however,is sparse.
Heat of Transport
Transfer parameters~an generally be estimated by nmethods usiung conceptsof statisticalmechanics.Bearmanetal. 140) proposeda methodlo estirmsmmtethe heat of Irmunsport for hiusuiryliquid systems.Broadly, thepureheatof transportwaspresentedmis tine sumof an equnihibriumterm andanon-equilibriumcontribution,where appropriateexpressionswere developedforeachterm. Neglectingthenon-equilibriumtermandassumingthe liquid asa regularsolution,theexpressionfor Q* is asfollows,
Q’/x2 2v~v
2Vu
wherev~,andv2, arethepartial molarvolumesof connponentsI mind 2, respectively,andv isthemixturemolarvolume. L is theheatof vaporisation,
xi,, = I —-
I.,, = ~i -i,k
v,~= ~v~x~/x0
,n~k
Hence,Eq.(5.68)will beas,
2v vi,, v~
(5.64)
(5.66)
(5.67)
whereIi,, and, ls~aretine partial eusthalpiesof theconsrponenti, un the mnuixtureamal in the idealgums state,respectively.
Oosl et al. 1411 appliedtheurboveexpression,which wasdevelopedfor liquids, to densegaseswitlm mehiumblcresumhis. ‘l’lmercforc. it lnmiy he appliedto describetlne heatof transportin oil aundgums commdensuutesy.slemnns.
‘There us very lilt he inn fonmmrmrtionm omn I Ime Incat of tramnsporl in unulti—coumiponentsyslemnms. A simpleuupptounchmis to reducenmnulti—comnmpoumemmtumnixtunresto pseudo—biumarysystems,as
(5.70)
(5.71)
(5.72)
wlseretIne subscriptmm, refersto tIme pseudocomponemntcomposedof all componeurtsexceptk.
(5.73)
‘line partial heatof vaponisationmrmnd minolar volumescanbecahcunlatedby any relimible equationofstate.AppendixC.
Significance
Although somedegreeof conmpositknnalgrading dune to non~equilibriumis expected in allreservoirs, Eq.(5.65) shows that the effect of gravity and temperaturegradient is nsoresigmmificantwhen (~ktk/ax
1)i.T.xj�j is small. At the critical point, indeedat all the points on
lIne stability limit curve, Eq.(5.4I), the determinantof theabovederivafivesis equal to xeroandprofoundcommmpositionahgrmndimrg shounldoccur[42).
‘Fine mumea.snnredmmmd piedicled,usingEOS,critical point of (he flumid reportedin Table 5. I at timedeptin of 3i56 umietersubsea,were293 K & 40 MPa, and363 K & 40 MPa, respectively138).Figure5.11 connparesthepredictedvariationof C
11~of the abovefluid with depthat various
tennperammreswhen only thegradingdue to gravity hasbeen considered..Note that as themixture temperatureincreases,approachingthecritical value, the compositkmalgrading withdepthbecomesmoresignificant. .
Thecompositionalgrading,particularlyfor nearcritical fluids, havebeenstrAdicdby a nunmberof investigators(38,43,44].Although thecoupling of compositionaland thermal gradientsImavebeen nrcknowledgedby mostof theauthors,the lack of adequateinformation to evaluatetime heatof transporthasresultedins ignoring thethermaleffect in moststudies.
Clmmrhmmck [45) conmparcdthe effect of thermal gradient to that of the gravity for an equi.nmolarmixture of nmmelhnuumne mind normal butane’at a typicunl reservoircondition of 378 K and 10.34MPa. Usimmg a value of 333 kJ/kg for the heat of transportof methane146) and a thennal
(5.68)
L, =In~—h~ (5.69)
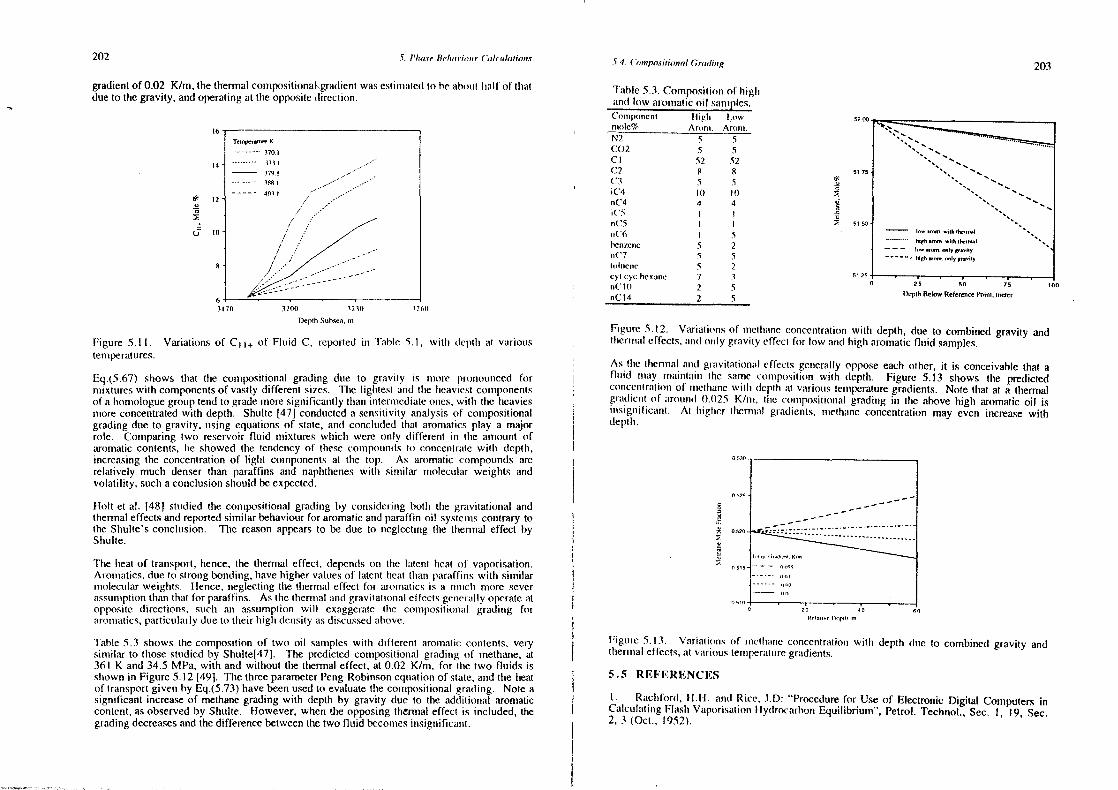
202 5. F’/iase Re/i,iiioii, CaIu-uulaiion.c ¶ 4 (‘ompo.mitio,mal(;radiiig203
gradientof 0.02 K/m, thethermalcompositionaF~gradientwasestinmnmrtedto he abotul Irutlf of thnatdueto thegravity,andoperatingattheoppositedirection.
6—5~70 3200 3250
De0
mti Subsea.m
Figure 5.11. Variations of C1
1+ of Fluid C, reported in Table 5.1, witln heptln at vmmnioustenmperatures.
Eq.(5.67) shows that the compositiomnalgrading due to gravmty is nsore pronnouncedformixtureswith componentsof vastly different sizes. Tine ligintest mind tine iremrviest counlpommentsof a Inonrohoguegrouptendto grademoresignificammtlythanintermmnediateounes,withn tIne imeaviesmoreconcentratedwith depth. Shulte [47) conducteda sensntivnty analysisof cotnipositionalgradingdue to gravity, using equationsof state,and conclundedthat aromatics play a majorrole. Comparingtwo reservoir fluid mixtures which were only different in tIme ummount ofaromaticcontents,he showed the tendencyof theseconnpoundsto concenlrmntcwitim depth,increasingthe concentrationof light componentsat the top. As aromaticcompoundsarerelatively much deunserthan paraffins and naphtheneswith similar molecdmlar weights andvolatility. sucha conclusionshouldbeexpected.
IioIt et al. [48] studied the compositionalgrading by consideringboth the gravitational andtisermaleffects andreportedsimilarbehaviourfor aromaticandparaffin oil systennscotntrary totheSInulte~sconclusion. The reasonappearsto be due to neglectingthe themnal effect byShulle.
The Ineatof transport,hence,the tinermal effect, dependson tine latent meat of vaponisation.Aromatics,dueto strongbonding,havehighervaluesof latent ireat tiran paraflinswith similarmolecularweights. Hence,mmeglectingthse tlscnnuil effect for arommiaticsis a umrtncls more severassumimptiontlman that for paraffins. As tlmc thiermmnahurmsd gnavitatiousaleffects gemnerunllyoperateatopposite directions, such an assunmptionwill exaggeratetIne counposiliomnunl grading foraromatics.particularlyduneto theirhighmdensityasdiscussedabove.
Table5.3 shows the compositionof two oil sampleswith (hifferent aromaticcontents,verysimilar to thosestudied by Shulte[47]. The predictedcompositionalgradingof methane,at361 K and 34,5 MPa, with and without the thermal effect, at 0.02 K/m, for lIme two fluids isshrownin Figure5.12 149]. ThethreeparameterPeng-Robinsoneqummtionof state,andthe heatof branrsportgivenby Eq.(5.73)havebeenusedto evaluatetheconunpositionalgrurding. Note asignificant increaseof methanegradingwith depth by gravity due to the additional aromaticcontent,as observedby Shulte. Flowever, when the opposing th~ninaleffect is included, thegradingdecreasesandthedifferencebetweenthetwo fluid becomesinmsigmmificamst.
Tumble5.3. Counpositionof Iniglimmmd low aromaticoil sarmuphes.(‘ompiincnn Iliglu Low ______________________nni,lc% Arorn. Aronnn,N2 5 5C02 5 5Cl 52 52C2 8 8C3 5 5iC’4 It) nonC4 4 4(‘5 I
nC’S InC6 I S
hen,.cne 5 2ni(’7 5 5iiituucune 5 2cym cyc.trexmmne 7 3n(.lO 2 5
nCt4 2 5
Fngumrc 5. 12. Vmu-immtionsof nsictlrunne concentrationwith depth, due to combinedgravity andllnerniuuul effects,amndonuly gravity effect for low aundhigh aromaticfluid samples.
As hIre thcnntmal amnd giunvnlationunl effects gemnerallyopposeeachother, it is conceivablethat afluid nununy nnnutnmntuniun Ilne suttmmc counsposition with deptis. Figumre 5.13 shows the predictedcotrcemrirmrtuonof tnnetlnancwulln dcptls al various lemnperaturegradients. Note timat at a timermalgradient (ml muromnund 0.025 K/urn, tIne d’omnnpositionmalgrading in tIne above higlr aromaticoil isnmrsignificaumt. At Iniglmer thnernrmrl gradieusts,nnetliane concentrationmay even increasewithdepth.
0 2’o -
RO,,i,o iiopuli
Fngumc5.13. Vurrnuntmotrs of unretlrummne concentrationwitim depthdue to combined gravity and
thrermnsaleffects,at varioustensperaturegrmmdients.
5.5 REFERENCES
I. Ruicltford, hill. mrimh Rice, ID: “Procedurefor Use of ElectronicDigital ComputersinCalcunl.utimsgFlurshVaporisatiotsI tydrocarbounEquilibriunn”, Petrol. Technol.,Sec. I, 19, Sec.2, 3 (Oct., 1952).
Is
4
noC)
Teiuper.flii~ K
— ~0i3731
3798 ..~- -
388i -
405!Ca
S13
5l 75
5150— ~ ~ithIhum,,i
h,~h.na,, .6!, h,,,,i,i
10..,,,,,
-, hi~h,n,,,,o~~iyp.OOy
25 50 75
Oepih Reiow Refrmnsce Poinn.meici100
0525
-~ 0520
o s,s :
204 5. Phase Rehuni-ionsr (.‘a!cudations
2. Sage,B.H., Lacey, W.N: “Volumetric and PhaseBehaviourof Hydrocarbomns”,GulfPublishingCo. (1949).
3. Fussell,D.D. and Yanosik,J.L: “An IterativeSequencefor PhaseEquilibria CalculationsIncorporatingtheRedlich-KwongEquationof State”,SPEJ., 173-182(June, 1978).
4. Nghiem,LX., Aziz, K. andLi, Y.K: “A RohunstIterativeMetinod for Flurshm CalcmulmntionsUsing theSoave-Redhich-Kwongor the Peung-RobinsonEqumurtiour of State”,Sl’E J., 521-530(June,1983).
5. Mehra,R.K., Heidemann,R.A. andAziz, K: “An AcceleratedSuccessiveSubstitutionAlgorithm”, CanadianJ. Chem.Eng., 16, 590-596(Aug., 1983).
6. Pedersen.KS., Thomassen,P. and Fredenslund.A: “Tiserniodynmrrtmics of PetrolesimMixturesContainingHeavyHydrocarbonns;3 Efficient FlashCalcmulurtion ProceduresUsing timeSRK-Equationof State”, I & EC Proc. Des. Dev., 24, 948-954(1985).
7. Gosset,R., Heyen, G. and Kahitventeff. B: “An Efficient Ahgoritimusn to Solve CubicEOS”, J. Fluid PhaseEquilibria, 25, 51-64(1986).
8. Abhvani,A.S. andBeaumont,D.N: “Developmentof aim Eflicient Aigoritlnurm for 2-PhaseFlash Calculations”,SPERES.ENG.,695-702(Nov., 1987).
9. Xu, D., Danesh,A. andTodd.A.C: “An AcceleratedSuiccessiveSubstitutionMethod forCalculationof SaturationPressureof MulticomponentFluids” Fluid PhaseEquilibria, 72, 15-24. (1992).
10. Li, Y.K. and Nghiem, L.X: “The Development of a General Plnuise EnvelopeConstructionAlgorithm for ReservoirFluid Studies”,SPE 11198,Proc. of 57th Ann. Conf.(Sept., 1982).
II. Whitson, C.H. and Michelsen,ML: “The NegativeFlasin”, J. Fkmid PhraseEqunilibria,53, 51-71 (1989).
12. Agrawal, R.K., Li, Y.K., Nghiem, LX. and Coomnbe, D.A: “Mu.mlti-Plsase Multi-ComponentIsenthalpicFlashCalculationswith aCubicEquationof State”,JCPT,30-3. 69-75(1991).
13. Michelsen,ML: PrivateCommunications.
14. Edmister,W,C: “Applied HydrocarbonTlmernnodynannics”,Gulf Punh.(l9l~4).
15. Poling,B.E., Grens 11, E.A. andPrausnitx, J.M: “ThermnodynmmnmicPropertiesfrom aCubic Equationof State,Avoiding Trivial RootsandSpurious Derivatives”,lund. Eng.Chem.Proc. Des.Dcv., 20, 127-130(1981).
16. Asselineau,L., Bogdanic,0. and Vidal, J: “A Versatile Algorithm f(rr CalcuIating~Vapour-LiquidEquilibria”,). FluidPhaseEquilibria, 3,273-(1979).
17. Rijkers, M.P.W. andHeidemann,R.A: “ConvergenceI3ehavioumrof Simmglc-StagePlasmCalculations”, Equationsof State Tlseories and Applications, ACS SymposiumsSermes300.476-493(1985).
18. Michelsen,M.L: “Simplified FlashCalculationsfor Cubic Equatiomusof State”,Imid. Eng.Chem. ProcessDes. Dcv., 25(1), 184-188(1986).
5.5. Reference.c 205
19. Danesh,A., Xii, DII., Tehrani, D.H. and Todd, A.C: “Improving Predictions ofEquationof Stateby Modifying its Parannetersfor SuperCritical Componentsof HydrocarbonReservoirFluids”, J.Fluid PlraseEqumilibria, 112,45-61(1995).
20. Gozalpoimr,F., Danesh,A., Todd, AC. andTehrani,D,H: “IntegratedPhaseBehaviourModelling of Fluids in Reservoir-SurfaceProcessesUsing Equmationof State” SPE 39630,Proc.of time SPEJDOEltsrprovcd Oil Recovery Symnmposiumm.Tulsa, Oklahoma, 19-22 April(1998).
21. Baker,L.E., Pierce,A.C. aundLuks, K.D: “Gibbs EnergyAnalysisof PhaseEquilibria”,SPEJ., 731-742(1982).
22. Miclmelsen ML: “Tine lsollnermal Plasm Problem, Part I, Stability”, J. Fluid PhaseEquilibria, 9, 1-19 (1982). -\ - -
23. Micinelsemm M.L: “The lsotimermal Flasim Pmobleun,Part II, PhaseSplit Calculation”. J.Flmnid PhaseEquilibria. 9,21-40(1982).
24. Nghienn, LX., Li, Y.K. amsd Ileidennanum, R.A: “Application of the Tangent PlaneCriteriomm to Saturmrtiotr Pressuremind TemunperatureComputatiomms”.J. Fluid PhaseEquilibria,21, 39-60(1985).
25. Miclncisens,MI,: “l’inase Pqumilibriumri Calculatiomrs,What is Easyand Wisat is l)ifficuli?”,ComputersChenss.Ensg’ng.,17, No. 5/6, 43 1-439(1993).
26. Avlonitis, D: “Thermodynamicsof Hydrate Equilibria”, PhD Thesis, l)epartnnentofPetroheumsiEngineerimig,tleriot-Watt University,Edimnburgh(1992),
27. Tejui, AS., Garg, K.B. urnul Smnith, R.L: “A Method for time Calculationof Gas-LiqumidCritical Temperaturesand Pressunresof Muiticomponent Mixtures”, md. Eng. Chenn.ProcessDes.Dev., 22, 672-676(1983).
28. Chueln, P.L. amid Prausnitz, J.M: “Vapour-Liquid Equilibria at High Pressures:Calculationof Critical Tenniperatures,VolumesandPressuresof NonpolarMixtures”, AIChE,13(6), 1107-1113(1967).
29. Reid, R.C., Prumusnitz,J.M. andPoling, B.E: “The propertiesof Gasesand Liquids”.4th Ed.,McGrmiw-Ilihl Book Conmnpany, 121-136(1987).
30. Peung. D.Y. mmmd Rohimnsomm, D.B: “A Rigorouus Metinod for Predicting the CriticalPropertiesof MutticouunpoumemmtSystenmmsfrom an Equmationof State”, AIChE, 23(2), 137-144(1977).
31. lleidemanmn,R.A. andKhahil, A.M: “The Calcumlationof Critical Points”, AIC1mE, 26(5),769-778(1980).
32. Michelseun,ML. amndlieideunann,R.A: “Calculurtion of Critical Points fronru CubicTwo-ConstantEquationof State”, A1ChE,27(3),521-523(1981).
33. Li, C.C: “Critical l’eunperatureEstimation for SiunipleMixtumres”, Can..1. Clmem. Eng.,49(5), 709-710, (1971).
34. Speurcer,CF., Dauhert,T.E. and Danner,PD: “A Critical Review of (‘orrelatiomis fortIneCriticmrl Propenliesof DefinedMixtures”, AIChE, 19, 522 (1973).
206 5. I’hasr !.khaiioiir (‘aleulations
35. Kreglewski, A. and Kay, W.B: “ The Critical Constantsof Conformuml Mixtures”, J.Phys.Chem.,73, No. 10, 3359-3366(Oct., 1969).
36. Katz, D., et al: “handbook of NaturalGasEngineering”,McGrurw-Ilihl Book Comiupatsy(1959).
37. Neveux,AR. andSaktlnikuniar,S: “DehimucationandEvaluationsof aNortln Scum ReservoirConluminingNearCrilical Fluids”, SPE 15856, Proc. of SPEEmropeanPetroleunnsConference,London,(Oct., 1986).
38. Montcl, F and Couch,P.L: “Predictionof Comnspositionnuml(‘unuudiurg inn mu Reservoir FhtmidCohninirun’’, SPE14410, Proc. ol fiOtIn Aumur. (‘omit. (Sept., 985).
39. 1k ( root,SR ‘‘hlnerumrodynummmuics(ml Irmeversiblel’rocessei.’’, Nurutln--I un1
I:uurd Pimlrhishninig(‘a., Auunsncrdumnnm(1959)
40. Bearmumn Ri., Kirkwood, J.G. amid Fixuisan, M: “Slurlistical-Meclrumnnicuul Theory ofTransportProcesses,ttne Heatof ‘Irurmrsport in h3nmsanyLiquid Solmmtiouns”,Advuunucesinn ClncmmmicmmlPhysics, I, 1-13(1958).
41. Oost, WA., Los, J., Cauwenbergh,H. and van Dale, W: “Thcrmnmurl I)iffmusion inModerately DenseGas Mixtures and the Pair-CorreluitionFumnctiomr”, Physicun, 62, 409-426(1972).
42. Lira-Galeana,C: “Discussionof Treatmentof Vmuiationsof Connpositionnwitlm Depth inGas-CondensateReservoirs”,SPERES.ENG.,158 (1992).
43. Whreaton,R.J: “Treatmentof Variations of Compositioun witln Depthr in Gums-CondensateReservoirs”,SPERES.ENG.,239-244(1991).
44. Ilmrscberg. A: “Role of Asplsaltenesin Compositional (irmsdinrg of a Reservoir’sFluidColumn”, JPT,8-94 (Jan., 1988).
45. Chaback,J.J: “Discussionof Treatmrsentof Variationsof Cominpositionwillr Depthin Gas-CondensateReservoirs”,SPERES.ENG., 157 (Feb.,1992).
46. Rutherford, W.M. and Roof, JO: “Calcmmlahionnof Thcrnnruml 1)iffmnsiomr Factors for theMctlmumne-n-Butamiesystemsin tire Critical andLiqmuid Regions”,AICIiE, 841 (1963).
47. Slmulte,AM: “CormmpositiomnalVariations within a HydrocarbonsColummn Dune to Gravity”,SPE9235, Proc. of 55th Ann. Conf. (Sept., 1980).
48. Holt, T., Lindeberg,E. and Ratkje, S.K: “The Effect of Gravity aund ‘TemperatureGradientson MethaneDistribution on Oil Reservoirs”,SPE umussohic. paper 11761, (March,1983).
49. Danesh,A. and MovagharNezhad, K: “An lnvestigumtionn on Compositional Gradientwith Depthin PetroleumReservoirs”,Journalof Facultyof Engng., TehranUniversity.30-I,59-68 (1997).
5.2. TIme coniposulnonof anoil sannmpleis givenin tine following table.
Cump~jnok%
Ct 27.36C
210.93
C. 856iC’
4.46
nC4 4.7377
ir(6 7 77
11)1
38.56
7u (tiuii;uincui’,inc’ M -21)).!) N:)) Si’)’)
The oul is flurslned mit 3 MPur aund32S() K. Use theStmnrmdingnmetlnodto estimatethe equilihriumnruntuosumnnd cuilcu mute tlsc conmmposut noun umnid nurolc fruich four of equil ibruntedgasandIi qmnid plmascs.
5.3. Most reservoir, svellhore, mmd surface processescan he simulated by a series ofcqimilihrmumin IhasIr cuulctmluutmons. Write ann algoritiunmm to simulatea constantvolume depletiontesttusingFOS.
5.4. Whnat us the. mnmmxmmrnmmns pressureat which tIre Peng-RobinsonEOS provides threerealroots for anequinniolarfluid comrnposcdof C
5-nC
4at 380 K.
5.5, Calculate tIre (hewpoint of a guus uunixhtnreconnsposcdof 90mol% methaneand 10%normaldecuumieurt 377.5 K, tmsinrg SRK (nircasmnredvalue P
4=33.72MPa).
5.6. Derivean expuessionto select tine properroot of generahisedEOS for a fluid, basedontIne nsmimsimmrummnGibbsennergy.
5.7. TIne oml in Exercise2 ms to be stahihisedby oneinternrediateseparatorat325 K. Find theophinnnuurm separalorpressure10 ohtmnun tIre mnnaxinnumn (nil volume at the stock lank conditions(0.1 MPuu mimic! 288 K).
5.8. t3stimmnuute tIme crinicuml pnopernucsof us mnnixtmure of methaneammd n-decane,40-60 mole %,mmsmnrg tIne cruticuil propertiesof pmmrc consstituentsandreunsonablennixing rules.
5.9. TIne comrspmcssihnhity fmmctor, Z, is consnnmnommly plotted as a function of tIre reducednemnmperurmtnre.T,, ummrd reducedpressunre,1’,, asstmowmi inn figure 2.22. Prove that theextensionof amny tuongent line to conslmumnt redinceterniperaturecurves sirould not cross theZ axis at anegativevurlue.
5.10.Cunlcinlumte (Inc reservoir connrpositionrurt 500 nnmetcr below that given in Example 5.1assmnmtninsgurns averagelcnnrperurlureof 377.6 K for the fluid colunrmn.
56. Exereise,s 207
5.6 EXERCISES
5.1. A fluid mixture consistsof methane(30 % mol) and normal heptane(70 % mol) at338 K and6.5 MPa. What is thestateof the flunid 7
209
6FLUID CHARACTERISATION
Seunmi-empiricalcumbic equationsof state(EOS), thoughdevelopedusing experimentaldata ofpumre compounds,aresttccessfullyappliedto predictphrasebehaviourandvolumetricpropertiesof multiconmipomment systenssby emmmploying mixing rules, as described in Chapter4. Realm’eservoir fluids, however,counld hecomposedof thousandsof cotsnponentswhich posetwormnajor restrietiotns:
(I) A full descriptiornof tIre fluid by idcçtifying mill its constituents nmiay not bepossible.
(2) Pimurse hchiaviouurcurlcuulatmoumsfor systenusdefummed by a large numberof comnsponenmtsare
timmre connsumnmingaumdparticularly immnpracticalin compositionalreservoirsimulation.A reservoiroil or cousdensateis commonly describedby discretehydrocarboncomponentsupto C
6andthe non hydrocarbongases,suchas N
2, C02, 112S and hydrocarbongroups for
Ineavierfractions. Tine concentrationof certainmajoruron-paraffin constituents,within time C6
to C9
groups,sucir mis, hcnzenc,toluene,cyclolmexamuesand xylemse,nmay also be identified.The Imydrocarhon groups are gemmerally determinedaccording to their boiling poimrts by(listihlation aumd,or, gaschirournatograplny.
l’isc distilled hydrocmrrhommgroumpsareclmaracterisedby measuringsomeof tlseir propertiessuchas(lie averageboiling poimmt tennmperatumre,molecularweight anddensity. Thesepropertiesareusedin generahisedcorrelationsto estimateother properties,such as thecritical propertiesandthe acentric factor, wliicin are required for EOS application. In somecasesan extendeddistillusnionof heavyfractionsmayIrave notbeenconducted,hence,therequireddataneedto beestimnmatedby othsermethods.
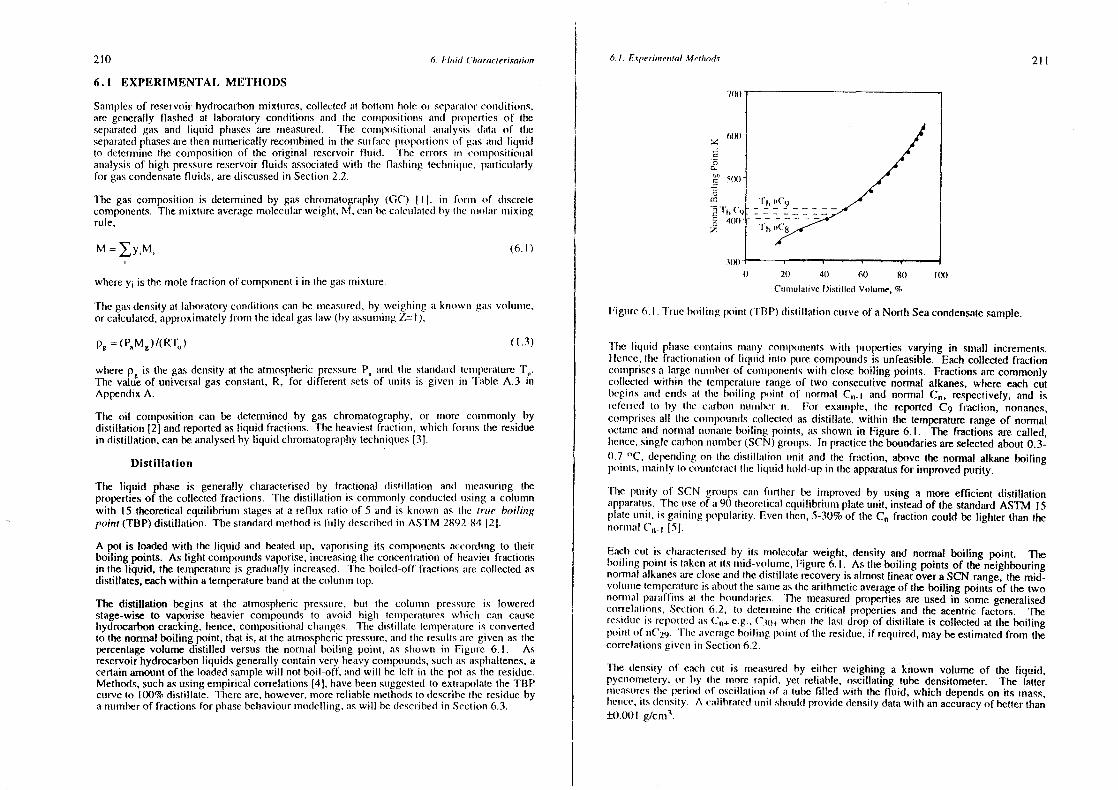
210 6. Fluid C/,araeteri.(ation 6.1. Exper.’nmentalMet/nods 211
6.1 EXPERIMENTAL METHODS
Samplesof reservoirhydrocarbonmixtimres, collectedmit bottom lsole or sepmmrmrlorconditions,are generally flashed at laboratory conditions atsd the conmnpositionrsumn(l properties of tireseparatedgas and liqunid phasesare mneasuured. TIre comnsposmtionral anmurlysis durhum of tIneseparatedphasesaretinen nummericallyrecomrmbincdin (Inc surfaceproportiomusof gums uuurd Iiqmidto detenninethe composition of the original reservoir fluid. The errors inn cousnpositiouralanumlysis of high pressunrcreservoirfluids associatedwith the flumstnimrg hcclruniqcue, pumrticutlarlyfor gums condensatefluids, arediscussedin Section 2.2.
The gas composition is determinedby gas chromatograplry(GC) ]lj, in firrmmr of discretecomnponents.The nnixhunreaveragemisohecularwciglnt, M. curn be cuulctnlumtcdtry lIre nnuuihuur ummiximigrule,
M=~y~M~ (6.1)
where Yn is themole fractionof componenti in thegasmixtuure.
The gasdensityat laboratoryc(nnditions cuin he nnieasunred,by ~veugInmnnga knownn guns volumnne,orcalcuihated,approximatelyfrom theidealgums law (by missumnnimsgZ= I),
Pg =(PaMg)/(RT0) (1.3)
whereP5
is thegas density at the atmosphericpressureP~and tIre standardtenmiperalureT0
.The valueof universalgasconstant,R, for different sets of uunits is given ins ‘lable A.3 inAppendix A.
The oil composition can be determinedby gas chromatogrunplmy,or nnnorc comnnonly bydistillation [2] andreportedasliquid fractiomss. Theheaviest frmrclion, wisich fornmrs tIne residuein distillation, canheanalysedby liquid chronrratogrmrpliytechniques131.
Distillation
The liquid phase is generally charactenisedby fractional distillation and nrieasturing thepropertiesof thecollectedfractions. Tine distillation is commonlyconductedusing a columnwith IS theoreticalequihibriunmstagesat a reflimx ratio of 5 and is known as the true boilingpoint (TBP) distillation. Thestandardniethod is fully describedinn ASTM 2892-84]2].
A pot is loadedwith the liquid and heatedup. vuiponising its cotnponentsaccordiungto tlmeirboiling points. As light compounndsvaporise,increasingtheconcentrurlionof heavierfractionsin theliquid, thetemperatureis gradually increased. The boiled-offfractionsmire collectedasdistillates,eachwithin a temperaturebandat thecolumn top.
The distillation begins at the atmosphericpressuire,but tine cohunnn pressureis loweredstage-wiseto vaporise heavier compounds to avoid higls temnrpcrmutureswhich can causehydrocarboncracking,hence,compositionalchanges. Thedistillate lenmperuuluureis convertedto thenormalboiling point, that is, attheatmosphericpressure,and thmc resunltsmire given as tImepercentagevolume distilled versusthe normal boiling point, as shown in Figunre 6.1. Asreservoirhydrocarbonliquids generallycontainvery heavycomsipounds,suchmis aspinaltenes,acertainamountof theloadedsaniplewill not boil-off, mmdwill he left in the po
tmis the residue.
Methods,suchasusingempiricalcorrelations1 4], have beenstnggestedto extrapolatethe TBPcurveto 100%distillate. Thereare,however,more reliableunrethodsIn describetIne residuebya numberof fractionsfor phasebehaviourmodelling,aswill bedescribedin Section6.3.
0 20 4)) 60 80 tOOCunurutuumiveDim/lIed Volume,%
Fmgumre(n.h. True bonhiungpoint (IBt’) distillation curveof a North Seacondensatesample.
i’lse liquid phrasecourhaimns mriununy comnuponnenntswitlm propertiesvarying in smmrll increments.Itence,time frmnctnommaliomrof hiqumid into pumre compoundsis unfeasible. Eachcollectedfractioncomsspriscsmm largenuniberof comuiponentswith close boiling points. Fractionsarecommonlycollected witlrin tIre temperaturerange of two consecutivenominal alkanes,wlrcre each cuthegmnms uuumd endsmit lIme boiling point of mrormal C~.t and normal C~,respectively,and ismclemued to by line cuirhroun urunmurher mm. For cxmmumnple, tine reported C9 fraction, nonancs,comnrprisesall time counrl)oundscollectedas distillate. withini the temperaturerangeof normaloctamneand normal nonnaneboiling poinls, as shownin Figure6. 1. The fractions are called,Incncc,siurglecmmm’hon number(SCN)groumps. In practicetheboundariesareselectedabout0.3-
0.7 °C.dependingour time distillation unit and the fraction, above the normal alkaneboilingpoitnts, nnaunrly to c(,unlermrcttime hiqinid Isold-upin tire apparatusfor imnprovedpurity.
‘Tire puruty of SCN grounpscamu further be improved by using a more efficient distillationapparumtuns.TIre tnseof a 90 theoreticalequmihibniuniplateunit, insteadof thestandardASTM 15plale unnut, is gainiung popimlarity. Even then,5-30%of theC~fractioncould be lighter than theunormsrurh(in- I [5].
Each cml is elnaracterisedby its uiroheculmrr weight, density and normal boiling point. Thel)oihing pounrt is takenmit its mid-vurlumune,Figuure6.1. As tine boiling points of the neighbouringnormalalkanesarechoseandtlne distillaterecoveryis almostlinearover aSCN range,the mid-vohuuunretemperatureis aboutthe satireasthearithnneticaverageof theboiling poiurts of the twononmnmrl paraffunsat the boundaries. The measuredpropertiesare usedin somegeneralisedeorrclumtuonns,Sectuomr 6.2, to detennminethecritical propertiesand tIme acentric factors. Thenesuduncis reportedmrs Cnm+ e.g., C3))~wiren tIme hasn dropof distillate is collected at theboilingpoinrl of nnC
29. TIne urvemagehoilnurg poimrt of theresidue,if reqn.nired,mayheestimumtedfrom the
correlationsgiven in Sections6.2.
TIre density of each cunt is mrseasumred by either weighing a known volume of the liquid,pycnonrietery,or by tire more rapi(I, yet rehiumble, oscillating tube densitometer. TIre lattermrseasuureshIre lneriixl of oscillation of mm tumbe tilled with tIne fluid, which dependson its mass,lsennce.mIs ulenrsity. A cuuhihrr,mednunit slsouldprovidedensitydatawith anaccuracyof betterthan±0.001g/clms3.
,,Ia
600
C
00~
0
.~ t1
, (~~ 400z
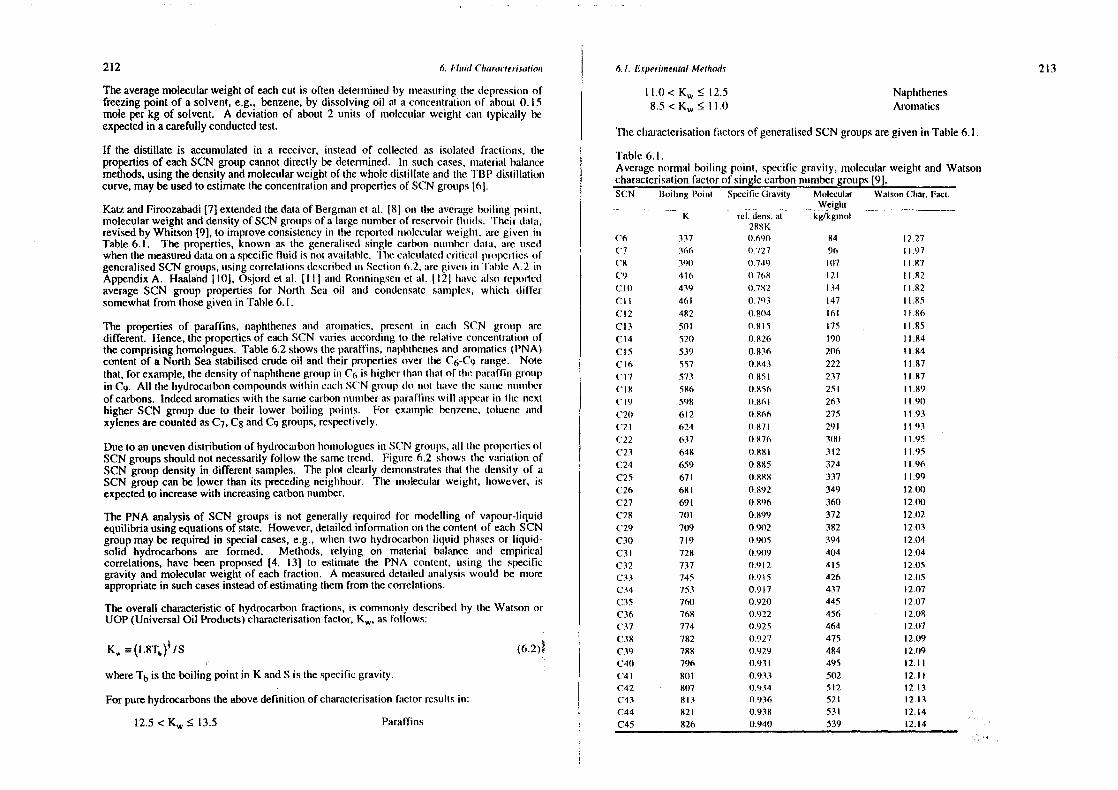
212 6. Iin,nd Cluarauleri.ruutio,n I 6. I. Experimental Met/nods 213
Theaveragemolecularweightof eachcut is often deermmiinedby trremistmring tire depressiond)f
freezingpoint of a solvent,e.g., benzene,by dissolvingoil at a concemntrmmtion(ml about 0. ISmole per kg of solvent. A deviationof about2 units of molecumlarweiglnt cumn typically beexpectedin acarefullyconductedtest.
If the distillate is accumulatedin a receiver, instead of collected as isolated fractions, thepropertiesof eachSCN groupcannotdirectly be determined. In suchcases,unaterialbalancemethods,usingthedensity andmolecularweightof thewholedistillate andthe TBP distillationcurve,maybeusedto estimatetheconcentrationandpropertiesof SCNgroups161.
Katz andFiroozabadi[7] extendedthedataof Bergmanet al. 18] our the averageboiling point,molecularweightanddensityof SCNgroupsof a large nunsberof reservoirflumids. Theirdata,revisedby Whitson [9], to improveconsistencyin the reportedunrrlecularweight, aregiven insTable6.1. The properties,known as tire generaliseclsiurgle emtrhon numnmsber ulatmu, mire umsedwhenthemeasureddataon a specificfluid is notavaihmubhe. ‘lime cuulcmmlumtedcritical propertiesofgenerahisedSCNgroups,usingcorrelationsdescribedun Scctiomn6.2. mmmc giveum inn l’umble A.2 inAppendixA. Haaland[10], Osjordet al. [III andRonningsenct mrl. (121huive mmlscs reportedaverageSCN group propertiesfor North Seaoil and condensmilesanriples, winds differsomewhatfrom thosegivenin Table6.1.
The propertiesof paraffins, naphthenesand aromatics, present in each SCN group aredifferent. Hence,thepropertiesof eachSCN variesaccordingto the relative eonmcentrationofthecomprisinghomologues.Table6.2 showstheparaffins.napinthenesand aronsatics(PNA)contentof a NorthSeastabilisedcrudeoil andtheir propertiesover the C6-C9 range. Notethat,for example,thedensityof naphthenegroupin C
6is higherthumn tliurt of time putrmrffinr group
in C9. All thehsydrocmmihoncommrpoumsdswitinin eumchnSCN gromip do nnot lmuuvc tire sumunue mrtuummlwrofcarbons.Indeedaromaticswith thesamnnecaubonntmmsnberaspuiruiflins will uulmpeumrinn tIme nexthigherSCN groupdueto their lower boiling points. For exanisplebemrzemrc. toluenc andxylenesarecountedasC7,C8 andC9 groups,respectively.
Dueto anunevendistribution of hydrocarbonImomnologumesin SCN groumps,all time propertiesofSCNgroupsshouldnotnecessarilyfollow thesametrend. Figure 6.2 showsthe variation ofSCN groupdensity in differentsamples. The plot clearlydemonstratesthat the density of aSCN groupcan be lower than its precedingneighbour. The mmnolecuhar weiglrt, imowever, isexpectedto increasewith increasingcarbonnumber.
The PNA analysisof SCN groups is not generallyrequiredfor modellingof vapour-liquidequilibriausingequationsof state. However,detailedinfornmatinnorsthecontentof eachSCNgroupmayberequiredin special cases,e.g., when two hydrocarbonliquid phasesor liquid-solid hydrocarbonsare formed. Methods, relying on material balance and empiricalcorrelations,havebeenproposed[4, 13] to estiniate the PNA content, using the specificgravity andmolecularweightof eachfraction. A measureddetailedmrnalysis would be moreappropriatein suchcasesinsteadof estimatingthemfrom thecorrelations.
Theoverallcharacteristicof hydrocarbonfractions, is commnronlydescribedby tire WatsonorUOP (UniversalOil Products)characterisationfactor, K~,asfollows:
K,, ~(l.8Tb)~/S , (6.2)~
whereTb is theboiling pointin K andS is thespecificgravity.
Forpurehydrocarbonstheabovedefinitionof chiaracterisationfactor resultsinn:
Tirecisaracterisationfactorsof generahisedSCNgroupsaregivenin Table6.1.
Table 6.1.Avermmge normalboiling point, specificgravity, uniohecularweightandWatsoncharacterisationfactorof singlecarbonnunmbergroups[9].SCN Boiling Pin/nt SpccifmcGravity Molecular WatsinnChar.Fact.
- We~Iu ____
K rel. dens. am kg/kgmol288K
(‘6 337 0690 84 1227(‘7 366 0727 96 It 97
(‘8 391) 0749 1117 1187C9 4ft 1)768 121 1182
CII) 439 0.782 I 34 II .82CII 461 0793 147 1185C12 482 t).S))4 161 1186Cl3 51)1 1)815 175 11.85
Ct4 520 1)826 190 11.84Ct5 539 0.836 206 1184C16 557 0.843 222 11.87
(‘17 573 0851 237 11.87
(‘18 586 1)856 251 11.89(‘19 598 0.861 263 11.91)C20 612 0.866 275 1193(‘21 624 1)871 291 1193(‘22 637 0876 300 It .95
C23 648 t).88I 312 11.95C24 659 0.81(5 324 11.96
C25 671 (1.888 337 11.99C26 681 0.892 349 12.01)
C27 691 0.896 360 1201)C28 7(11 0899 372 12.02
(‘29 709 0.9(12 382 1203C30 719 0.91)5 394 12.04
C3t 728 0.909 404 (2.04C32 737 0.912 415 1205C33 745 (i.9)5 426 1205C34 753 0.917 437 1207
C35 760 0.920 445 12.07C36 768 (1.922 456 1208(‘37 774 t).925 464 12.07
C38 782 0.927 475 12.09(‘39 788 0.929 484 12.09C40 796 0.931 495 12.11C4m 81)1 0.933 502 12.11C42 - 807 1)934 512 1213(‘43 813 0936 521 12.13
C44 821 0.938 531 12.14C45 826 0.940 539 12.14
11.0< K~� 12.58.5< K~� 11.0
NaphtimenesAronnatics
Paraffins12.5 < K~� 13.5
214 6 1/mid ( jlariiite,j.cUtjo,s 6. ,‘ f~efm’r,?nrei:fa/Ales/rods 215
Table6.2,Paraffins,naphihenesandaromaticscontentof singlecarbonnutribergrommpsof C6to C9 of atypical NorthSeaoil [III. -. ___________Component Wcngtn(% - Motc% Votumric%
1.886 0.8360,185 0.059
MoIW86270.1
liens. gui’
t)6630750
HexaneGroupParaffmnsHexaneGroupNaplrthenes
06470.052
HeptaneGroup ParaftinsIlepianeGroupNaphihcnesHepuaneGroup Aromanics
0.71309300355
1.7872.6821.140”
1)8891)34
0343
11)0.287.1781
1)6861)7690884
OcianeGroupParaffmnsOcnaneGroupNaphthenesOcuaneGroupAromatics
08701.4040.958
1.9123.435261(1
11)54I 5560941
114211)2692.1
1)7(171)7721)871
NonaneGroupParaflinsNonancGroupNaphitncncsNonaneGroup Arornatics
073906461042
141613i12464
1)8771)699
(122
128 522))
11)6.2
1)721))
1)872
enC
0.90
0.88
0.86
084
082
0.80
078
076
0 74
Figumre 6.2. Densitiesof SCN groupsof fluid samniplesfronn vuurious Northu Seareservoirs.
Huthmig-FachnveriageCopyright. Reproducedfronir [Ill wills pernsnission.
The characterisahionfactor for a mixturecanbeestimatedby time weightedaveragemnnixing rule,
K,,, ~ (6.3)
wherew~is theweiglnt fraction.
A mixtureof arornmnticsandparaffins,therefore,mayappearasnaphtinemseevalunatedby its K~.ilowever, it is a useful single factordescribing the characteristicsof pelrolcuurs factions. Amore reliable characterisationfactor, especially for complex fluids, may he obtained byincluding a third physicalproperty,suchas theviscosityortherefractive index. Tiresedataare
not, however,comiunmionlyavailablefor petroleumfractions. Other characterisationfactors, notwidely used,havealsobeenproposed1141.
Ilnc Wumtsorn cismrrumcterismnlion factorcuimn he relatedto propertiesotlser thanthe boiling point andspecificgravity,usingcorrelmmtiommsgivenin Section 6.2. For example,it can he relatedto themnolecuharweight (M) and specific gravity (S) [9], using the Riazi-Daubert correlation,Eq (6.4),
K = 4. 5579M°°‘~s 84571 (6.4)
TIne aboverelatiomn is particularly useful for the last fraction, referred to as the plus fraction,whereits boiling poinrt is trot known. TIreaboveequationbecomeslessreliableat M>300.
FIne variationsnih K~5ns ueIuutivchy smnmmmll lou dnfferenrt fractions,particularly for Incmmvy fractionsin
nuuisst cases. It cann Ire nssnnnnndI. lhucrc’Iusre. mm conmstuntrl for lreumvy frmuclions to evurhmmmute tIneinuterunuil coursislenscyut uuiemusuircil(lanun, orno estinmruutenmnissingiunfnrunatinn,aswill be describednun Seclinsin (r3.
(;as Chromatography
Tine guns comnrposimionr is determmnimned, innvuirimuhly, by gas clmromnmatography(GC). Recentmmdvatmcesins gaschromnialograplnyhaveenabledlaboratoriesto extendthe nnethodto oil analysiswith a conrpuirahlemrccuuracy. Wtnilst urn extendedoil analysisby distillation takesmany daysmiund requiresrelmslivchy mm lunrgc vohiuumseof sample,gaschromatographycams identify componentsu.s ineunvy mis (‘5)) 115! inn ui urumnller of Isomursusingonly asmunll fluid sample.
Tine smiusiplcis injectediuilo mu Ircumted inure, vaporised,andtransportedby a carriergas, usuallybeliumxn, into a columnun packedor iurtenmallycoatedwith a stationary liquid or solid phase,rcsuluinrg ins partitioningof tIne innjectedsampleeonstituuents.Generalpurposecolumnspartitionconrponenhsmostlyumccordingto thucir boiling pOints, Imencecomsipoundsare elutedin a similarorder mis in distillations. TIne eluntedconrpoumndsare carried, by thecarrier gas,into a detectorwlscre tIne conmnpomsentconiceumtratiouris relurtedto tire areaundertiredetectorresponse-timecurveas shownrinn Figtnre 6.3. htrdivtchunmnl peaksmsnaybe idenstifiedby comparingtheir retention timiresiunsi(hc tine coltinnnmn wills those of kunowus compoundspreviously analysedat the satire GCcomnditiomss.
lIre Iwo mostconrinsnounlyumseddetectomsare lhc flunnure ionisationdetector(FID) andthe thermalconnduichivihy clclector (TCD). TIre FID respourse is almost proportional to tIme masscomscentrmrtioumof tIne ionnisechconnupounnnd. In, however,cannotdetect non—hydrocarbonssuchasN
2uuusd CO
2. llennce.1(1) is ofnems umsed for urnmnlysis of gaseousmixtures tlrat contairs non-
Iiy(lr(rcarh(nmr connupouncurts.
t’uuckech colunnimurs, witlu ann efficiency ruungimrg fronnn lemns to hundredsof eqmmilihrium stages,arenIne unuost versmrtile unund frequenrtly imsed devices. Tinese columnsare capableof base linesepmmrumtiomr of gaseirtus comsnpirnumnds, hensce, dchcrnnining their concentrationsas discretecourspolnn(ls.TIne iuntcumxrediurlc ununh lrcuuvy lrurctionnsarcehrmtcd,however,as acontinuousstreamof oven Imnppimrg comnrpouuirds.Fugnunc6.4. ‘ilmis is very simiunlarto the fractionationbehaviourin adistillation mnnit andlreatedsimmuilumrly. ‘l’hmmt is, all tIre counponentsdetectedby GC betweenthetwo ureighrhouringtrormrral paraffimrsarecomrimonhygroupedtogether, measuredandreportedasmm SCN eqnnunl to llral of the IrigIser noniral paraffin. The GC operatingconditions may beadjusted]h6]. Ihummt is. its efficicuicy lowered, ho siustunlale the 15 tray TBP distillation. Tireresulls, known as lire simmiuluiled distillation, are quite comparableto tlmose generatedby tineTI3P nneihnod [2], asslmown in Figure 6,5. The percemntageareaunderthe FID responsecurveluasbeentmikeunto he eqimivaleurt to time percentagevolumnedistilled [17].
CarbonNumber
216 6 Flair! (‘/n(una(gerjc,:fjo,u 6. 1. Erpe,iinerusal Metluod.c 217
A
8C
a0
0
cm
RenenusonTime >
uu~mine
Figure6.3. Gaschromatogramof agassample,usingapackedcoluumsnn.
The accuracy in compositional analysis can he improved by cahibruiting GC, that is,determining the detectorresponserelative to the concentrmrtionm of emmch counpoument mit tireoperatingconditions, known as (he responsefactor. The courmimmon mnetirod is to ammurlyse agravimetricailypreparedmixtureof componeistswitis known concentrations,as time staindard.Normal alkanesareoften usedto representSCN groups. It is known that the responseofdetectorsto paraffinsand aromaticsare different. Hensce,the unse of typical SCN groups,insteadof normalalkanes,in preparingstandardsappearsto bemore mupproprimmie. Time effect,however,is minimal [5] in mostcases.
4)
C00~4,
0(‘I
C
0ci,,soC
0
a
0z
800
701)
600
501)
404)
301)
0 C’,C Sinrniaiedm)isn,nn4ni,n
CuunnulauiveVolume,%
60
Figuure 6.5. Comparisonof TBI’ distillation curve amndsimulateddistillation restult, usinggaschrounatography,of aim oil sarirple.
A nrajordrawbackof GC analysisis time lackof information,such&s the molecularweigist anddensity,on theidentified SCN groups. Tine lack of molecularweightdata is quite limitinmg asthe responseof FID, used for oil analysis, is proportional to the mass concentration.Molecular weight data are needed,therefore,to convert the mass fraction to molar basisrequiredfor conrpositionaistudies.
Time very high hoilimmg constittmemrtsof a reservoiroil samplecannotbe eluted, inence, tiseycanmmotbedetectedby GC, Timecomnsonumietlsodof estimatingthenon-elutedfraction is to unsean internal standard,winereoneora few fully detectablecompounds,preferablynot present intIre oil, are addedto the oil at a knsown mass ratio [161. Thecomparisonof nnassratio asdetectedby GC wittm tinat of graviusretricahlypreparedmixture,givesan indication of tine ansmountof noms-elutedfractions. TIne nirethod,knowna.sspiking, relieson certain hiunitimig asstumrmptionswinds nmnuy leadto largedeviatiomrsin measuredconcentrationof non-elutedfractions[5(.
A1
rplicustiommof mm eomrtimmtmotmsfumnction to describetIme componeuntdistribution(seeSection 6.3)mimrd extemndingtine mrrcursumredcomrcenntrationnof eluted fractiomssto uleterumsinetime non-eluitedpuurt ismrlso anoption [5]. highs tensmperaturecolumns [IS] are capableof almost connnpleteelumtion oflight conndensatefluids. However, theconcentrationof tine plus fraction (last reportedgroup)determinedby GC,sinouldalwaysbetreatedwith caution.
Capillmrry columns,equmivalentto manythousandsof theoreticalequuilibriunmstages,canbe usedin preferenceto packedcolumns, to improveseparationand peak recognition,as showmn inFigure6.6 for a North Seacondensate.Table6.3 presentsthecomponentsasidentified by thepeaknunsbersin Figure6,6, aird tineirconcentration,molecularweightanddensity.
l’ire molecularweightanddensityof componentsideustifuedin eachsingle carbongroupcan beusedto estinratethepropertiesof that group,by thefollowing materialbalanceequuations:
ci
nC4
nCS
nd?
Ce
0.
0.
0
I0•
01
OS
0•
0
0
0S
20 40
nC9
nCuo
80
Time >
Figure6.4. Gaschromatogramof aNorthSeaoil sample,umsingapumckedcolunnum.M = (~w~))/~(w
1fM) (6.5)
NJ
NJ
NJ
NJ
—0%
-N
J9
.00
’so
-J0
’.4
,5
~a
aa
at..
~N
)N
JN
JN
JN
JN
JN
J9
.0so
-40
’4
,a
4.N
J—
9.0
so
—4
0’
—~
so.9
NJ—
9-.
40’
La
a.9
NJ
—
4/’~
NJn
1’~
2,~
4.a
,‘rN
J—
r~~ ~
~0’
0’
0’
0’
(‘)
~)
‘~
-IL
aLa
~ r ..<
Za
~—
—-~
~‘u
9~
~‘~
a7”
)“
1%—
‘~<
‘~a
‘~~-
Jnrir
~,,,
.~0
~a
a’~
L, 9
,,’.a
...J
~a
~cm
.~
,~~
~‘4
,0
0.
La,
7’.)
7’.)
-~L
a‘r~
(‘)u
~-°
co
~
n C .4 ~ o ~ ~.
a’)
L,.4
’<N
,)0
’~ ~
~ ~)
a4
.
%j~ ~. — ~ ~ 0 ~ ~“
a~
-~
r~
‘N
J~
)4
.I’~
i.a
’°’a ~ ~ ~ .9
03
39
99
39
9©
99
00
99
09
99
—3
-’3
’O3
9~
39
~3
.0—
—N
J-J
’C‘0
c~
La
NJ
NJ
—.9
0N
J*
‘flN
J3
.9—
JL
J~
so
La
C,...so
NJC
-40
0
—9
99
99
99
93
39
3.0
—a
09
9—
---a
.,~
...0
-.~
94
.L
a9
NJ
—S
so.9
~..
4~
Lfls
oNJO
NJ0
~3~
4.Lf
lJ,*
.0 C
93
99
39
NJ~
~J_
_9
99
.99
0’
NJ
La
—..
.NJt4
,NJN
J
3 ~4
‘0 NJ
93
33
99
9T
0N
J’.3
95
~0
0so
Sso
La-4
5a’
La
00
3C
NJ-J
-
~
‘~‘0
’~N
J~
~
99
~~
33
33
93
*3
9~
9_
99
93
NJ—
—3
3C
30
33
33
3—
—~
00—
—0
’0
.=
0,
NJ
—N
J‘4
,0
7.9
—N
J4
~—
——
—~
,J—
49
9—
so
—r.
49
9—
0.
~.J
99
39
93
39
3
NJ
NJ.9
93
9~
.9,,
J3
e~
C’—
3tO
.9i=
4,
‘4.5
NJ
0,
—0
.-.4
~,a
J~,4
,.’03
N.—
3soL
..,C
N,
,33
33
33
33 so .0 4
,
a—
NJ3
30
,.9
—.,J,a
—a
t’..tL
a
— —4
~<3
33
33
99
!2,
~4.
NJN
J39
aso
‘.4
‘4N
J—,
00
’—4
0’s
oN
J..Jl()
——
‘0—
NJN
JN
J,.4
,,).
9.9
,0.,4
NJN
Ja
aa
Jo
so
NJso
NJC
JN
JD
JN
,,N
4N
JN
JI.4
—N
J,J
NJN
JN
J—
N.,—
.4-.
’4.4
.so
—so
0’0
’0%
0’O
’NJt’JN
J0
%.9
O’N
4N
NJN
J
———
——
soR
C’0
C9
’0_
4so
C.,..S
so
so
so
tso
50
,so
SJ,,
aN
J?
4—
——
r.)—
t.4
——
NJ—
NJ
9=
soso
00=
so3
0’—
Ct0’
C0
’C0
’La
.9C
CC
J,G
J,N
J.9
La
M’..,
00 .0.
‘4 0. .0
soO
c-so
so--
JOC
C-C
’0’0
’30
’—
-4-.
4-4
-,.‘~
-.4
so
so
so
so
.0so
0’
‘..., 3 .0 C,)
—4
-J..4
4,4
,4.L
,J’
NJ’4
NJso
so
0..
~r
—3
=.a
La
a,.j
C—
——
.9.9
-43
93
09
93
3~
39
93
3.4
00
4,.4
..J0
’-4
.4-4
.J‘.4
“.1
-40
%.,4
=0
—-)
.4La
a—
.0N
J-)
.d~
-40
’3
.0—
0’
05—
-.ja
a-4
3N
J.9
SS
Sso
—‘0
‘04
.‘0
a~
o—
La
-4...
00
0’
‘.4
39
99
93
~-J
0%0’
0’—
J0
’--4
so
-0’-J
toso
00
La
Laa
.c‘~
soC
cso
-~~
a‘
00
La
L4
.C—
.0N
J..
a-4
NJ
59
.0N
J’.,)
La9
.0—
C,)
—0
.
9 0’ 0’ so
-4
0’0
’0’0
’-4
0’
0’
0’La
0’i,
La4
.so
‘.J0
’‘4
.so
so-J
NJ
NJ’0
La ‘t 0’
4.
0’0
’’,a
4,L
aL
aa
.9.9
‘9.0
00
0’
=.9
9.9
0’
0.
.9‘-4
so
‘00
’-4
‘4.9
0’
9,
20
;~‘;:~
~,
09
”,,
.~.2
:
~ ~_~
JJ
~: H
0’
(5 ~ ‘. 1.
~
‘T3 It ~:;~
~ ~ ‘.‘~
NJ
~ ~
3 0 -‘ em 3 B .9 9 0 (5 0
0. .i
3’
0
Co 02 ‘1.
0 C B ~0”
(5 ‘M 00 C em 3’ C’
0%
Fig
ure
6.6.
Gas
ch
rom
ato
gra
mo
fa
co
nd
en
sa
tesa
mp
leu
sin
ga
ca
pill
ary
co
lum
n.
Pe
akn
um
be
rsco
rre
spo
ndto
com
pone
ntsin
Tab
le6.
3.H
uth
ig-F
ach
veria
geC
opyr
ight
.R
ep
rod
uce
dfrom
[11]
with
pe
rmis
sio
n.
0) C 3.
C) C C) C) 0)
8’
.4
‘03
04
0
Tim
e,M
inu
tes
50
04
NJ
‘.0
220 6. F! mild Cluaracierisatio,m 6. 1. Experio’nenla! Methods 221
Table6.3 (Cont.).Individualcomponentsidentifiedby peaknumbersin Figure6.6.
Octanestotal 3.231 7.957 3.551 101.978 0.7791
Tumble 6.4.Conrmparisonof singlecarhomrnuumrhergrouppropertiesmeasuredby distillation andcapillary(ic analysis.
Disnillation —
-- ~ Wdgta% ~ Den /mn’~5 0.886 65 621
PeakNo. Component Weight% Mole % Votumnne% Mol. W.
112,216Dens., g/cnn’
0.770043 DM.Cy’C6 0.031 0.069 0.03444 1.trans-2-DM.Cy-C6 0.089 0.199 0.098 112,216 0.779945 nC8
UnspecifuedC80.4340.086
0.9540.190
0.5260.105
114.232114.232
0.70650.7000
46 Unspecifiednaphtlrene 0.047 0.094 0.1)5 I 126.243 0.79(8)47 2,2.DM-C7 0.009 0.018 0.011 28.259 0.714448 2.4.DM-C7 0.017 0.033 0.020 128 259 0.719249 . I,cis-2.DM-Cy-~6 0.024 0.t)54 0.1)26 112.216 0.801)350 E-Cy-C6#t.l,3.TM’Cy-C6 0.281 0.599 t).105 I t8.uuoO 0.79(8)51 Unspecifiednaphthenc 0.047 0.1)93 1)1)51 126 243 ().790()52 3,5-DM-C7 0.017 0.034 0.020 128.259 0.726253 2.5.DM-C7 , 0.003 0.tX)6 t).004 28.259 0.720854 Ethylbenzene 0.114 0.270 0.112 106.168 0.871468 Unspecifiednaphthcne 0.027 0.t)54 0.029 126.243 (1.7918)55 m-+p.sylenc 0.697 1.649 0.687 106.168 1)868356 4-M-C8 0.020 0.039 0.024 128.259 0.724257 2-M-C8 0.054 0.106 0.t)64 128.259 0.717358 Unspecifiednaphthene 0.009 0.018 0.010 126.243 0.790058 Unspecifiednaphthene 0.082 0.163 0.089 126.243 0.790058 Unspecifuednaphthene 0.007 0.014 1)008 126243 0.790059 Ortho-xylene 0.230 0.545 0.223 11)6.168 0.884460 3-M-C8 0.023 0.045 0.027 128.259 0.724261 I.M.3-E.Cy.C6 0.078 0.155 0.1)83 126.243 0.800062 I-M.4.E-Cy-C6 0.034 0.068 0.037 126.243 0.790063 Unspeciluednaphthenc 0.006 0.013 0.01)7 126.243 0.790063 Unspecifiednaphuheune 0.004 0(107 0(8)4 126.243 0.790064 nC9
UnspecifiedC90.4710.124
0.9230.243
0.5590.148
28.259128.259
0.72140.7200
6 0.7377 2.37111 2.8259 2.539
#0+ 90.642
10 2.479It 1.91612 2.35213 2.09114 3.667IS 3.72216 2.(u3417 4.13518 3.77219 3.407
~ens~
597669754779799
82 69591 751103 778116 793
306 869
112 798t41 803163 107175 836190 84321)5 849215 863237 844251 846262 857
885 -
31)0 868
GCWeigtnu % Mol. W.
0.792 630.699 852.000 893.237 1(122.429 116
90.846
2.437 1342.191 1482.523 1623.106 1753.124 1903.984 2053.383 2184.244 2353.201 2503.523 261
59.130 422
Nonanestotal
81)1803812827840845851842845854
888
2.427 5.241 2.598 116.277 0.7995
A comparisonofthecalculatedpropertiesof singlecarbongroupsusingGC dataandtheabovemethod,with thosedeterminedby 90equilibrium tray distillation on a condensateis showninTable6.4. Thedifferencesareof thesamemagnitudeas typical deviationsin measuringtheproperties.
A highly useful column for hydrocarbonreservoirfluid analysisis the wide bore capillarycolumn, alsoknown asthemegaborecolumn. Thecolumn which providestheversatility ofpackedcolumns, whilst maintaininga high resolution capability, can be usedsuccessfully incompositionalanalysisof live fluids, without anyneedfor flashingthefluid intogasand liquidsamplesfor GC application[18]. Thepreferenceof direct samplingand analysisof highpressurelive samplesrelative to the conventionalblow down method is discussedin Section2.2.
Thearomaticcontentofanoil mayalsobedeterminedby gaschromatographyusing a columncontaininga stronglypolarstationaryphasecolumn whichelutesthecomponentsaccordingtotheirboiling points. Thecombinationof resultsfrom polar andconventionalcolumnsarethenusedto determinePNA [8].
20+ 61.057 426 ________________________
6.2 CRITICAL PROPER1’IES
Time critical temperature,Tc, pressuire,P~,volume, Ve, compressibility factor, Z~,and tIreacenrtuic fuuctor, w, of siunglecarbon numbergroups andthç last (plus) fraction of reservoirfluids, siusnilar to tiroseof discretecomponents,are requiredfor phasebehaviourmodellingusing EOS. These propertiesare determinedfrom generirlisedcorrelationsin terms of thespecificgravity,S. boiling point, Tb,or themolecularweight,M. of singlecarbongroups.
Severalnnet.hsodsto calcunlmtte tire critical propertiesof petroleumfractionsare available. Timemetinods have mostly used measuredcritical propertiesof pure compoumsdsto developcorrelations,either in graphicalformsor asequationns. Tire majority of thesecorrelationsarereportedin L h9~.Tine mostwidely used,or pronmising methods,are reviewed in this section.‘lime correlationsin threir original formsuseField Umnits, andaregiven as suchin Appendix B.hun ilsissection,tIre correlationsurrepresentedwills SI units. The unitsof P. T andv are MPa,K amsdnm’/kgnnol, respectively.
Lee-Kesler Correlations [20,21]
so 189.R+450.fiS-1-(O.4244-4-0.ll74
S)Th +(o.l44l — l.0069S)xl05
/T5
(6.7)
humP. = 3.3864—0.0566/S_(0.436394-4.l2h6/S+0.2l343/S7
)xlO”3
T5 (6.8)
+(o.47579+ 1.182/ S +t).15302is1) x I (Y6T~—(2.4505+ 9.9099/Sn)x I 0’’°T~
222 6. Fluid (ha,mlerj.caiiom 6.2. (‘, ,i,cal Propet lu’s 223
() 01 ~2c lb S
‘t~ M SP~ l~, SP~ M S
(vcfM) ‘I’~~S(vc/M) M S
M1
h S
1)~ M S
(71) < M <3(11) 3(111< ‘I’~<61)) K)
I) C d e I
- 9.3 t4OF-04 - 0544.14 6.4791E.04 0.811)67 0.53691I .1478b.04 - ()(,l(,4 I 0.00001ij38) 0.2998 1.0555
- 85oS(it~l0 - 4.81)14 5.7490l~.03 - 0.4844 4.1)846
I .8078E-03 - 0.31184 0.000t)E+00 . 0.8063 1.6015- 2.642212.03 .0.2641)4 l.97t0E-03 0.7506 - 1.2028
- 2.657012-03 0.52117 2.601212.03 0.21)3711 - 1.30369.775412-04 - 9.533114 t.9990I3.03 0.97476 6.512743.774)12-03 2.984036 - 4.252912-03 0.401673 - 1.58262
(6.9) 0=a [exp(h91
+c02
+d0105)}0~0
wlmcre,a to 1, arccomnstumunlsfor cadsproperlyasgivems in Table6.5.
‘Fable 6.5Constantsin E2c
1.(6.15) for T~,P~,v~,M andTb.
(6.15)
9,523312+00
3 1510011+02C 1)5102+114
3.)6 0-19012.05
7 5211812-04I .1) C 2 I 11+033.765912÷1%)
o =(ln ~hr — 5.92714+ 6.09648/T÷,+ 1.28862 lflTbr —0. l69347T~)/
(15.2518—l5.6875/T+,— 13.4721 lnT~+0.43S77T1~
)forTh, ~O.8
= —7.904+ 0.1352K — 0.007465K~~+ 8.359Th(6.10)
+(l .408 — 0.0l063K,,)/Th, for T5
, >0.8
where Phr=PbIPC.Tt,rTt/rc, Ph is tIre pressureuut which “h is measured,e.g. tIme uronrialboilimmg point at 0. lOt 3 MPa (1 urtrirosphcre)unnid K~us tIme Wunlson -Imuirmn&’Icrismut ions factor.
Eq.(6.2). ‘I’he estimmsatcdacentric factorsby tIne abovetwo corrclaliomms at l’~,,=0.I~duller umbomit2%.
The acentric factorcorrelation,Eq.(6.9) is simply a re-aiTangeunneuntof lInc Lee-Keshervapourpressurecorrelation,Eq.(1.10).
Thecorrelationsof Cavett [22], given in AppendixB, for T~and P0
arc alsooften usedinphasebehaviourmodellingof hydrocarbonsystems. The Edmister correlation1231 for timeacentric factor is commonlyusedwith tlse Cavcttcorrelatnon,
w={~[log(~/P4
)]4(1y’rb)_l]}_t (6.11)
where13 is time atnunosplmcricpressure,0. It) I 3 Mt5
un, mit wlmuch time nsom’mmmal hom lmnmg pounil. i’~,. mumemustmred. Timecorreluniion is derivedby crmbiisiumgtIne vapour pn’esstun’erelmul imruu. I iq.( I .8), munsdtire definition of acentric factor,Eq.(I.9).
Theabovemethodsdo not provide immformationon thecritical volumeorcompressibilityfactor.i~hecritical volume canbecalculatedfrom.
P0
v0
=Z0
RT0
(6.12)
with thecritical conmpressibilityfactorestiusmatedfrom thePitzercorrelation,
Z0
so 0.290l—0.0879tma (6.13)
Riazi-Daubert Correlations
Riazi and Daubert [24] developeda simple two parameterequatmors for predicting physicalpropertiesof hydrocarbonmixtures.
Oa Oh 0<n 2 (6.14)
where0 is the property to be determined, and 01 and 02 cams be any two parameterscharacterisingmolecularforcesandmolecularsizesof a component.Any pair sucin as (Tb. M)or (Tb, S) maybe usedfor 01 and 02. Propertiesstuchas tIre mrnolecularwemght, refractiveindex, critical properties, density, heat of vaporisation urnd llremnal conductivity weresuccessfullycorrelatedby theaboveequation124].
PerturbationExpansionCorrelations
Tlnese nsretlsodsimnitiumlly correlatelIme propertiesof rrormal paraffins as time reference,and thencxtemmd thesee(srmelatioumst(r pclroletmmmm fractions. ‘lIme correlationsdevelopedby Twum 1261,wlmo nisedlIne differencebctweeir Ilme specificgravity of time Irydrocarhonfraction umimd tlmat of tinemmom’ummal P~’aff1 us wit lu I Ire sameI uoi I insg poinil mrs I Irecoruelatingl)aruumeterarcasfollows.
Nor,,,ul /‘araJ]rns
‘flie propertiesof rmornmmal paraffins arecorrelatedwills tine normalboilingpoint temperature,
= 140.533272±1)343831(11)1
)i’, +2.526167(107
)T~(6.16)
— I.65848(I0 ‘°)i’~+ 0.04607741(1’, / I 0O)°J
P~= (0.318317+ 0.099334t~+ 2.89698r~t+ 3.00546W2+ 8.651~ )2 (6.17)
v,.~,= [0.82055+ (1.7154
68
W+ 2.21266v~+ l34
Il.Iry~J~ (6.18)
Sr 0.843593—0. I286
24
W — 3.36159w’— fl7495111
i� (6.19)
wlseretIre stmhscriptp refersto propcrtmesof normnalparaffinsand,
I —Tb/TCP (6.20)
‘The ummolecnshunrweightof paraffinsis givemr by thefollowing inmplicit relation,
= exp[(s.1264(1+ 2.71579lnnM~— 0.286590(tnM~)2
— 39.8544/(1nM~)—0.122488/(lnM~rJ
(6.21)
Theauthorslater [25] improvedthecorrelationas,—13.7512 InM~+ l9.6I97(InM~i
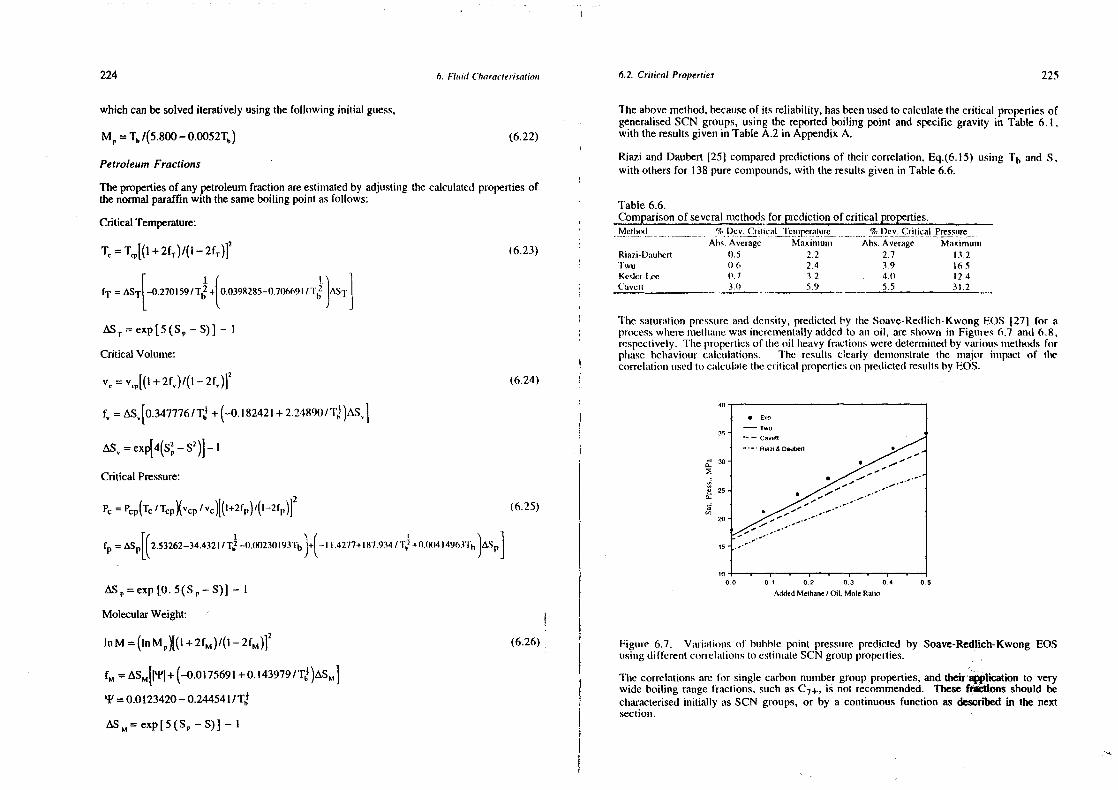
224 6. Fluid (imaracteri.cation 6.2. Critical Properties 225
whichcanbesolvediteratively usingthefollowing initial guess, Theabovemethod,becauseof its reliability, hasbeen usedto calculatethecritical propertiesofgeneralisedSCN groups,using the reportedboiling point andspecificgravity in Table6. 1,
M~= Tb/(5.800—0.0052Tb) (6.22) with theresultsgivenin Table A.2 in Appendix A.
Riazi andDaubert[25] comparedpredictionsof their correlation,Eq.(6.15)using Tb andS,PetroleumFractions with othersfor i38 purecompounds,with theresultsgiven in Table6.6.Thepropertiesof anypetroleumfractionareestimatedby adjusting the calculatedpropertiesofthenormalparaffinwith thesameboiling point asfollows: ‘ Table6.6.
Critical Temperature: Comparisonof severalniethodsfor predictionof criticalproperties.N~cmlm~s~—- %Dev.Crniicaimrmu ~
2 Abs. Average Maximum Abs. Average MaximumT~= T~p[(l+ 2fT)/(I — 2fT)1 (6.23) Riazi-Dumubert 11.5 2.2 2.7 13.2
l’wnj 11.6 2.4 3.9 16.5KestcrI.ce ((.7 3.2 4.1) 12 4
= AST[~270159hT~00398285_0706691~)~T] ~uvcui ~ ~ .~ ~ 5.5 31.2
Tine saturationpressureanddensity, predictedby tine Soave-Redlich-KwongEOS 127] for aso exp[5(S~ S)] — I processwheremetlsanewasimncreunentallyaddedto an oil, are shown in Figures 6.7 and(r.8,
respectively.‘Time Irropertics of time oil heavyfractiomrsweredelermiuseciby variousissetlmodsforCritical Volume: pimase bclsavmourcurlculations. i’he results clearly demmnomrstratethe major immmpact of the
correlationusedto cumlculuoetime critical propertieson predictedresultsby EOS.
= V0~
[(l+ 2f0)/(l — 2f0)12 (6.24)
f soAS40.347776/T~+ (_o. 182421+ 2.24890/T~)As, 1 40
= ex~4(S~- S2)] -1 35 ~::: Da~e4
Critical Pressure: ,,,,.,-‘~ — —
= ~ m (625) ~—~_ — —
= AS~[(2.53262_34.432lIT~.-t).002301931’b)+(_I I.4277+l87.934/’l’~ +t).()0414963’Fh)ASP] us
to0.0 0.1 0.2 03 0.4 0.5
EnS~,= exp[0. 5(S~,— S)] — 1 AidedMe(iiane(Oil. Mole Ranto
MolecularWeight:
mM (lflMP)[(l+2fM)/(1_ 2fM)12
(6.26) Figure 6.7. Vutriurtiouns of bubblepoint pressurepredictedby Soave~Redhich-KwongEOSusimmgdifi’crent correlurtiommsto estimateSCN groupproperties.
— EnsMfrl’I+(_0.0175691+0.l43979/Tb)ASMI TIme correlationsare for singlecarbon numbergroupproperties,andtheir applicationto verywide boiling rangefractions,suchasc
7+, is not recommended. Thesefritlons should be
‘1’ = 0.0123420—0.244541/Tn,1
characterisedinitially asSCN groups,or by a continuousfunction as describedin the nextsectiomm.
~M exp[5(S~—S)] —
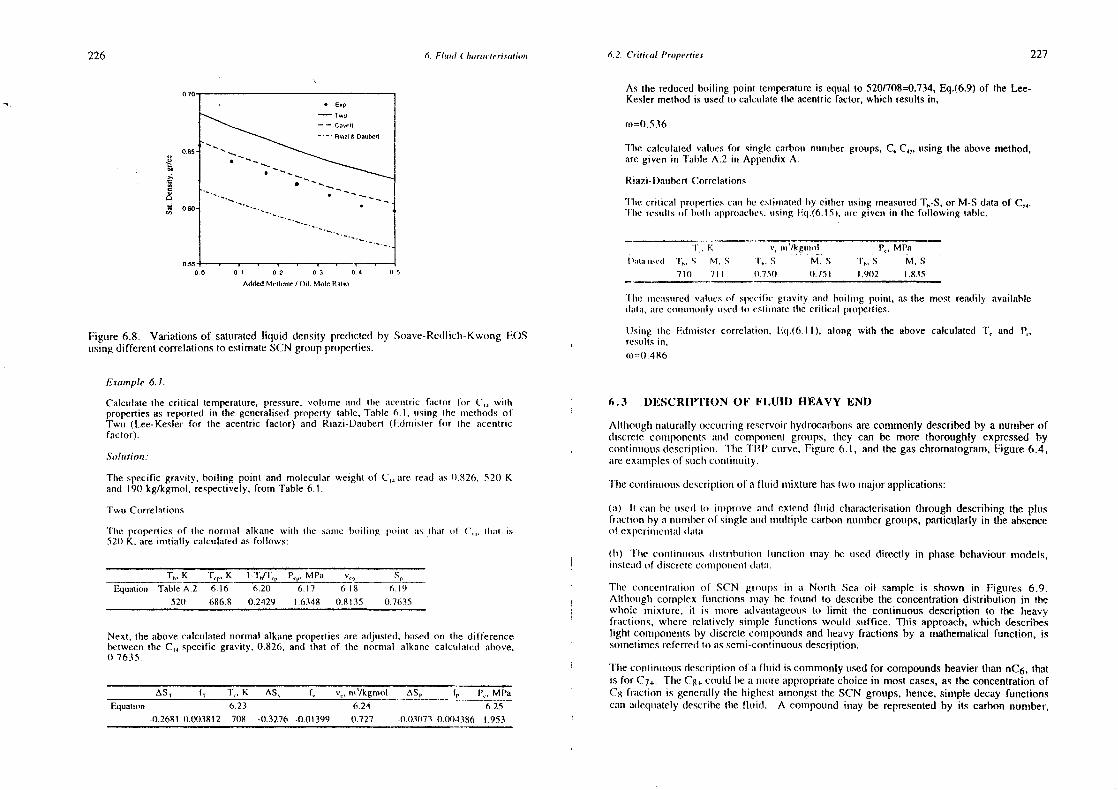
227226
065
060’
0.5500 01 02 03 0,4 1)
Added Meiliane / Oil. MoteRali,,
6. F/uio! (‘/timrui’lerj.c(j(iopm 6.2. Critical Properties
As the reducedboiling point temperatureis equal to 520/708=0.734,Eq.(6.9)of the Lee-Keslermethod is usedto calcnmlatetheacentrncfactor,which resultsin,
(u)=O.536
l’hc cuilculaled valuesfor single cusrhotm nummiher groups,C0
-C44
, using the above method,are given in Table A.2 in AppendixA.
Riazi-l)auhertCorrelations
lime critical propertiescumum he estinratedby eiiher usingmeasuredT0
-S, or M-S dataof C,~.‘lIme resunltsu if bitt In mnpproaclmcs,unsungliq (6. I 5). mure given in Ihe following tumble.
I, K
t)aiasnsi’it ‘l’~. S M. sv, ntn’/kguummii
m~.S M, S ‘t~,S
I’,, MPaM, S
711) 711 1)75(1 11.75I 1.9112 1.1135
‘[lie unmeunsunredvalues mmf spccituc grmmvnly and hoiliumg point, as the most readily availabledmmtn, are ctrnmmnmnormI y mm sedlo esi unumute tIme criticunl properties.
Figure6.8. Variationsof saturatedliquid density predictedby Soave-Redlnch-KwongEOSusingdifferentcorrelationsto estimateSCNgroupproperties.
Example 6.1.
Calculatethe critical temperature,pressure,volume amid tIre acentric factor for C~awithpropertiesasreported in the generalisedproperty table.Table 6.1, uniung tIne nmrellsods ofTsvu (I..ee-Keslerfor the acemitric factor) and Riazi-1)aubert (l1dnrmsler for lime acentricfactor).
Solution.’
The specific gravity, boiling point and molecularweigist of C,, are read as11.826, 520 Kand 190 kg/kgmol, respectively.fronn Table 6.1.
Twu Corretalioums
‘Itne propertiesof lime norumsal alkanne witls lIme smmmnnc bonlnmmg t°”~~mis that itt’ (‘~, that is521) K, are initially calculatedas follows:
T5
, K T,~.K t-T1
/1’,0
P,1
,, MPa v01
S~
Equation TableA.2 6.16 6.20 6.17 6.18 6.19
521) 686.8 0.2429 1.6348 0.8135 0.7635
Next, theabove calculatednormal alkanepropertiesare adjusled,bussedon the differencebetweenihe C~specific gravity, 0.826, and that of the normal alkane calculatedabove,0.7635.
AST I~ T,, K AS0
I, v,, m’fkgniol AS~ f~, P~,MPaEquation 6,23 6.24 6.25
.0268l 0.003812 708 -0.3276 .001399 0.727 -0.t>3073 0.004386 1.953
Ilcirmg tIme i2dmislcr correlatioum. 11q.(6.I I), along with the above calculated T,. and 1’,,resultsin,(m)000.4116
6.3 DESCRIPTION OF FLUII) HEAVY END
Although numturuilly occurrimmgreservoirImydrocarhonsarecommonly describedby a nunsberofdiscrele componentsamid comnpomscnt groups, they can be more thoroughly expressedbycourtitnuousdescriptions. Tire TI3P cuirve. Figure 6.1, and the gaschromatograuns,Figure 6.4,umrcexaumrplesof suchconlimnuily.
‘lime conlimnumousdcscriplionof a flund mmnixturehas two majorapplications:
(un) II can be used to iursprove amid cxtemmd fluid clmaraclerisationthrough describingthe plusfr:mction by mm usmmmnmherof siusgleunmsd mmrunltiple carbonnumsnhergrotups, particularly in the absenceof cxpcriimmcnmtuml dumla.
(h) ‘the commtimsuomisdislribuliois functious nnay be umscd directly in pisasebehaviourmodels,munsteadof d iscuelecolmipouseustdatun.
i’lme conncemslrurlions of SCN groups in a North Sea oil sample is. ,shown in Figures 6.9.Althougln complex funnctiomss mnmay be found to describethe concentrationdistribution in thewhole mnixlure, it is more advantageotusto limit the continuous description to the heavyfractmomms,wlnere relatively sinmple functions would suffice. Tlnis approach,which describeslight comsiponentsby discretecompoundsand heavy fractions by a mathematicalfunction, issomrnetimesreferred to assemi-continuousdescription.
TIne conrtimsuousdescriptionof um flumid is commonlyusedfor compoundsheavierthan nC6
, thatus for C
7+. TheCg+couldhea ummoreappropriatechoicehr most cases,astheconcentrationof
C11
fraction is getmerally mime highestamongst tine SCN groups,hence,simpledecay functionscan adequatelydescribetime fluid. A compoundiisay be representedby its carbon number,
Ow
S
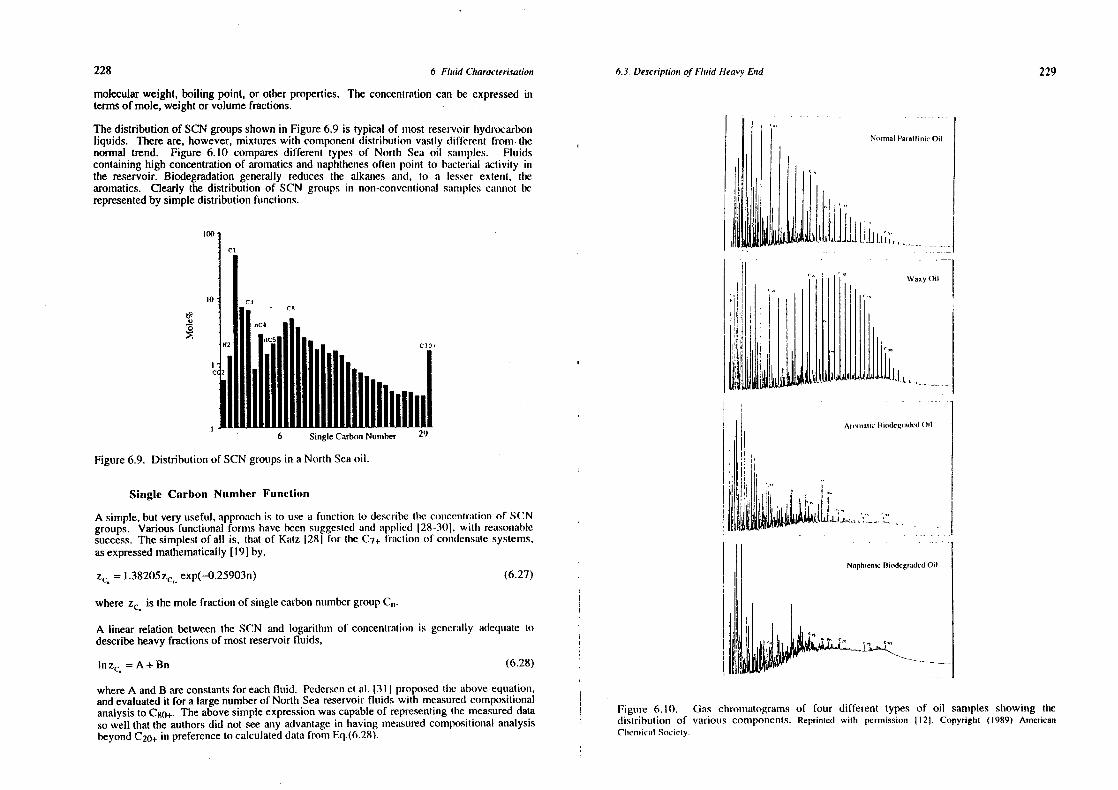
228 6. Flutid Characterization 6.3. Description ofFluid Heavy E,nd 229
molecularweight, boiling point, or otherproperties. The concentrationcan be expressedintermsofmole, weightor volumefractions.
Thedistributionof SCNgroupsshownin Figure6.9 is typical of most reservoirhydrocarbonliquids. Thereare,however,mixtures with componentdistributionvastly different from thenormal trend. Figure 6.10 comparesdifferent types of North Seaoil saumuples. Fluidscontaininghigh concentrationof aromaticsandnaphthenesoften point to bacterial activity inthe reservoir. Biodegradationgenerally reducesthe alkanes and, to a lesser extent, thearomatics. Clearly the distribution of SCN groups in non-comnventionalsummmmplcs cuunnnot berepresentedby simpledistributionfunctions.
lix)
en
~O C3 - CS
111nC4 •‘
C 62
296 SingleCarbonNumber
Figure6.9. Distributionof SCN groupsin a Nortls Seaoil.
Single Carbon Number Function
A simple,but very useful,approachis to usea functions to describethe comncentrationof SCNgroups. Variousfunctional formshave been suggesledand applied 128-301,with reursonahiesuccess.Thesimplestof all is, that of Katz 1281 for the C7~frurclion of commdensumtesystenns,asexpressedmathematically[191 by,
so I .38205z~,exp(—0.25903n) (6.27)
wherez~is themolefractionof singlecarbonnumbergroupC~.
A linear relation betweenthe SCN and logaritlnm of concentrationis generally adequatetodescribeheavy fractionsof mostreservoirfluids,
Inz~=A+Bn (6.28)
whereA andB areconstantsfor eachfluid. Pedersenetal. 1311 proposedtlnc aboveequation,andevaluatedit for a largenumberof North Seareservoirfluids with measuredcompositionalanalysisto Cgo÷.Theabovesimpleexpressionwascapableof representingthemeasureddataso well that the authorsdid not seeanyadvantagein having measuredcompositionalanalysisbeyondC20÷in preferenceto calculateddatafrom Eq.(6.28).
Normal Parall’inic Oil
Waxy 0/i
tIJ.lt ~ ..~ ,J -
AroiltumnicIt itxlegraried (lit
NaphienicBiixieg,aded0~i
Figum’e 6. 10. Gas chromsratogramsof four different types of oil sannplesshowing linedistribulion of varioums components.Reprinted wiih permission 1121. Copyright (1989) AmericanCltcunical Sticieny.
It
230 6. Fluid (‘luaracterisatiopu ‘ 6.3. Description of Fluid 1/eat’s’ Eumd 231
In phasebehaviourcalculationsthecarbon number is umot directly used, lmenmce, it nmtmst bereplacedby somephysical properties. TIre mnmolecularweiglst is oftemr relaled to tire carbonnunnberby,
Mçl4nö ‘ (6.29)
where ö dependson tire chemicalnatureof the SCN group. A value of ~=4 is mm rcuisonumhheapproximationin mostcases[30].
M~= 14n—4 (6.30)
The abo~’ecorrelation, suggeststhat Eq.(6.28). can equurlly be written iii lerimss of tImemolecularweightinsteadof thecarbonnumber,
lflZç=A+BM~ (6.31)
Obviously,theconstantsin thetwo equationshavedifferent values.
Theaboveexponentialfunction is alsoasvalid whentheconcentrurtionis expressedin termsofweight fraction insteadof mole fraction. Theexpressionin weiglmt basis mury eveur be nsoreappropriatefor somefluids. The advanntageof weiglmt basis is tine lack of need for lImemolecularweightdataof SCNgroups,whicharenot avurilablefor very iscavyfrmmctiouns.
Wlsen partial analysisof the C7
+ is available,theconstantscams he determinedby regression,mininsisingthesumof squareddifferencesbetweenthe cumictulatedmnmnd mmremmsumm’ed comsceurtrumlionof known SCN groups.
E.rample 6.2.
The total concentrationof C7+ fraciion of a gas condemnsaleis 3.92 niote%’ with theanalysisas follows. Extendtheanalysisto C3O+by SCN groumps.
Table E6.2.Composition and propertiesof C7+ fraction,
~C, 211.2)) 94 0.730
(‘~ ‘ 21 .4 I 11 7 0.754C
912.11 126 0.7699.23 140 1)785
C1
7,17 153 0.799C
125.68 t65 0.806
C11
427 180 0.820C
143.05 197 0.843
C0
2.43 209 0.844
4.45 374 0.909
Soluaio,n
Fmgure E6.2showsthe relationbetweenthe nroiar concemmirumlioum nnd nimolectular weiglml ofSCN groups in this example. Note thimt the uusxumtmstntionof a hinucuir relunliont heiween tinelogarithm of mole fraction and the molecular weight, Eq.(6.3I), is reasonablefor thisfluid. The two parametersof A and B of Eq.(6.31) carsbe determimmedby tine least squuarefit (excludingC,,), resulting in,
TIne unmolecuulunrweight amid specific gravity of SCN fronmr C1
, to C2.,. are assurnrcdto be thesammme mis those mm tic geusermutisedtable properties.‘I’ahlc 6.l..Suhstituting time molecularweights inn I Ire mnhmive relmml tin rennurnstIme resultsasgiven in the following table,
SCN M S x xM, sM/S(‘7 .4 0.730 1)2(121) 18.9880 26.01(‘8 117 ((.754 Ii 2141 25.0497 33.22
C’) 126 11.769 0.1211 5.2586 9.84CtO 40 0.785 0.0923 12.9220 16.46CII 153 1)799 11.0717 10.9701 3.73Ct2 16.5 11.806 0.0568 9.3720 11.63
CII 81) ((.82)) ((.1)427 7.6860 9.37(‘14 07 0(143 11(13(15 6.111)85 7.13CIS 209 (1.844 (1,0243 5.0787 6.02
C tO 222 1)843 11.1)1 86 4.1237 4.89C17 237 (1(1St 11.0137 3.2586 3.83(18 251 (1.856 0.0104 2.6062 3.04
(‘19 263 ((.861 (1.1)082 2.1467 2.49C21) 275 0,866 (1111164 1.7645 2.04
(‘2 I 21)1 0.87 I 0(1(147 I .3546 t .56(‘22 300 1)876 (((11)39 1,1(159 1.33(‘25 312 ((.881 (1(11)31 1)9532 1.1)8
(‘24 324 II (4(15 ((.111124 11.7781 0.88
(‘25 337 (1.888 (1.111119 0ft236 (1.71)C26 349 1)80)2 0.18115 1)51)76 0,57(‘27 3611 11.8% 0.11012 (1.4200) (1.47(‘28 372 11,899 0.188)9 1)341 I (1.38
(‘29 382 0.902 (1.1111(18 0.2867 (1.32
Tmtnat (1.933 131.7 166.99
Its x~ = 0.4665— 0.020056M1
.
UaL .1’V S
..
S
.0) •80 100 120 140 160 180 200 220
MolecularWeight
FigureE6.2. Relation of unmolmmr coutcennrationwnilt umiolccular weight for SCN groups.
232 6. Fluid (‘Iuarncter,satio,m 6.3. Description of Fluid heavy End 233
Example 6.3.(a) TheC~,mole fraction is calculatedas, ‘I’he mole fraction, molecularweight and specificgravity of the C7.~.fraction of a gas
condensatesanmple are 0.0392, 165 and 0.815, respectively. Describethe C7+ fractionC
2,
Xe~, r1_~xc, =1-0.933=0.067 by SCN groupsextendedto C20+.C,
Solution:(b) The C
7, fraction molecular weight and specuficgravity shotuld renmimin the suuummewhen Rewriting Eq.(6.31),we obtaium,
the fluid is describedto C,~,.Hencethemolecularweightof C,, is deterimniimcd ilS,
c,,, c,, ,s., =
M~,= ~XC.M(. =l65.4=~x(.M(. + xU,,MU,. so 131.7+0.067C, C~ (‘~
M~,,,,=503 so ~Z(’~ = eA~e~0C, C,
(c) The volume of C2
, fraction can be consideredequal to the surma of voluuummes of mmli itscomponents. Hence a similar approach to that of imrolccuuiar wcigimt cmmmm inc used t~ Sunurularly for Eq.(6.33),we obtain,calculatetheC,,~,specific gravity.
C9
UN
so ~zC,MC, =eft~~Mc,etu0mcnMe,, /S~
7, ~ /S~,,=202.86w l65.4/S(.
1, (‘~ (‘~
C7 I lermce,
Sç,,O.815/c, c
5\
The volume balancefor C1
,, resultsin, M~, =~ ~M(.ci~t~ )/(~enm~tn j
C2
, timat is,M~,ISO, 2~XcMc ISe, +XcsoMe,, /S~ =166.99+0.067Ix503xM~,,,/S~,
C, C,
202.87 ~ ~ soO (E6.3)C
7S~35
,=0.940i3q.(i36.3) dernmonm.slrmutestlrat lIne slope of the SCM group dislribution line, B, depends
The molecular weight and specific gravity of C5
, could huuve been cmmlctilaled itm tins onmly out the irmoiccuilar weight of C1
, . The puurmmnremerA affecls only the mole frurction ofexampleby themassand volume balance for the C
1,, fraction only. im~stcmudof time C,, (‘7, in mine nnixturc, by simiftimng tIme line up or downs in Figure E6.2.
fraction.
A so Inn. — ~e~~t(n I (E6.3’)(I ~ ~When little or no compositionalanalysisof tire C7
.,. is available, tine two constantscain be (‘ )determinedby solvingthefollowing two materialbalanceequatiours:
I Norumnumhisingtire di~tributionnof SCN groupsmm time C7
, fraction, by making Zt.,,=l. resmmltsCn C~, . I
~ so~exp(A+BMc)=ze, (6.32) I
A so irs z — ~eBMtnC, C, I ., ~‘‘ ~C, c, j
~ =~exp(A+BMe,,)Mc, Z~7
Mc7
, (6.33)C
7‘l’Immul is, jusl the ummolecularweight of C
7, fractions is suufficiermt to describethe distritaution
of its coulmprisiung SCN groumps.CN is theheaviestcarbonnunnberassunnedto be presentin the mixture. Valuesof 50 1321 to I80 [311, havebeensuggestedas the cut-off carbonnumber, whereaslarger nroleculeswith Assumimming SCN groupswills nrolecular weightsequal to those in the geuserahisedtable,highercarbonnumbersaregenerallypresentin oil andgascondensatesystems. Thechoiceof I Table 6.1, andC
11asthe tmeaviestfraction presentin the mixture,Eq.(E6.3) resunlts in,
thecut-off carbonnurmber,however,hasvery little effecton predictedresultsby EOS in mostcases,asthecontributionof very heavy fractiorns,dueto tiseir low concentrurtions,is minimal l3~0.013141 8.for practicalpurposes.
234 6 F/tool ( ‘l,a,a~’term,calio,u 6 1 /)ese, ipt ion of Fluid hleam’u’ End 235
Substituting time B vmmhumc in Eq.(E6.3’). time valnuc of A is deterussimnedequal to .5.81)1)8671Eq.(6.31) is thenused to calculatethe mole fracliomm of SCN groupsasgiven in tIne folhowiisgtable,
SCN (;roup C7 C8 C’) C 0 CII Ct2 C’ I 3 (‘I 4 (‘I 5 C16Mole ‘S 0.6273 0,5429 0.4516 0.3807 ().3209 (1.2670 ((.2221 I). 11124 ((.1478 0.1198SCN Group C17 C18 CI’) C20 C2I C22 (‘23 C24 C25 C26Mote % 0.0983 0.0818 0.0699 0.0597 0.0484 0.0430 ((((367 0.0313
(:34((.0264(‘35
0.0226(:36SCN Group C27 C28 (‘29 C30 CIt C32 CII
Mole % 0.0195 01)167 0.0146 0.0125 0.0110 0.0095 0.0082 (1.4)1)71 (((((1(94 0.0055SCN Group C37 C38 C39 C40 C41 C42 C43 C44 (‘45M,,le % 0.005(1 0.11043 0.0038 0.01)13 (1.0030 0.0026 ((0024 0.002! 11.0(119
The C,,,, fraction is determinedby sumnimingup C,0
—C, mole fracniouus,i.,.~,=0.4074%,withtue unolccumlmrr weighst dcteruusiniedmis:
(:4,
M~51
so ~XC,MC, =i3”~C
2,,
Assnuusningtbmat SCM groups have tine samsnespecific gravity asthose in the genmi’rmmhism,’d tumble,the specific gravity of C
21, is deternniumedsiunnilar to that in Example6.2.
C,,
ZC51
,MC210
, IS5
.,,,, = ~ /S~.,
S,.,,,=0.892
The normmrahised mole fractions of SCM groumps iii the C7
, fractious cmulcuilaled in thisexampleare given in the following table for comparisonwith tbnosecalculated in Exmumusple6.2, llmmrt is, for a fluid with the sanmeC,, fractioun properties.
SCN P.6.3 E.6.2Cl 0.1604) 0.2020C8 0.1385 0.2141C9 0.1152 0.1211
CI)) 0.0971 (1.0923
CIt 0.0819 11.0717(‘I 2 0.068t 0.0568Ct 3 (1)1567 0.0.527
C 14 (1.0465 (1.0305
CtS (1.0377 0.0243(‘tO 0.0306 (1.1)1 86C17 0.0251 0.0137C18 0.0209 0.0104CI’) 0.0178 0.0082
C20+ 0.1(139 0.0936
Continuous Description
Theaboveapproachof describingtheconcentrationof SCNgroupsby a function, nsayappearas a continuousdescription of tIre fluid. but it is basically a discrete representation. Thefinnctiomi describestheheavypart by a numberof SCNgroups,atsdis only valid at the discrete
cummbomm ntnrnmhcrs. trm ntmurtlncnraticuml terms,tIne funchions provides lIme value of concentration
initegralbetweenCui.l andC5
.
so id/., (6.34)
where i refers to all tIre commmponenlscounrprisiumgthueSCNgrotupn.
A moreappropriateapprourchis time continuousdescriptionof the fluid, where tIme distributionof all its conslitueusts,insteadof carbongroups, is aimed. Indeedthecarbongroupsreportedby lmrhoramoriesmire deten’tnrined by integration of corsipotundscomprising the groups. Forexmnmmnple, Ilme area umuuder time curve in Figuure 6.4 betweennC
9and nC
10is taken as fine
comsccnrlralion(If ~ grotip.
‘the connhituunnini~uiu’sci jIlt ilium nctl(’(’Is 11w trure nmmuluin’e of reservoir firuids hinal urre corssposedofnummiuty ctimiiliiummmds, with priifs.’n tues vmim ymung so gu udumally himmut (10 mnol allow (lnstilmcliveiulennt i ficumi i) iti
lime contitruornsdislrihutiomr of comrponnenlscanhe expressedby a function,F(l). sudsthat,
5 F(I)dl=z (6.35)
wlrcrc z is time totuml councemntrationof all line connpouscnts,representedby I. within the integralboundaries. If all tInecoinrporrcntsof a fluid is describedby thecontinuousdescription,then,
J F(l)dl = I (6.36)
In lIne nsmorcpruiclical setuni-coumtiunuiousdescription,only the heavypart (say > C,) is describedby line contimstmousfumrctuorm,
5 F(l)dl = (6.37)
svliere ~t) is line cormceuntraliommof Ibte lseumvy frurcliour of tIme fluid describedby the continuousulcscmiptuour. ‘l’lrc distrihmmtrounftuuicliomu is generally selectedsucln that the value of integral inFq.(6.37) becoimmes eqmimil to I, Ibmurl is, it describesline relative concentrationwithin tineconml tusumouns purt. I Ic m5c’c, urn lime seitmi—conl i nuotis uupprourcls thecalculatedConcerslrationof tinecomnttunuloumscousslituiemslsslmouuldbe inntultiplied by zI) to mm(srunaliseit in thetotal mixture.
‘l’hre musteumsitychislrihumliotn, F(l), or lIre prohmnhihity of occurrence in statistical terms, is oftenexpressedtry nnolmurdislrihtnluomm, aind so used ins hhnis hook. ‘time massor voltuirme distributiomr,uss obtumined in gascisrousrustograpisyordistillation, respectively,carsalsobeusedto describetheconcentration, Tire variable I, can be the carbon numberor any property, such as theurnolecumlarweigist or tIme boilingpoint. characuerisiumgthecompoundscomprisingthefluid.
II shsouldbe umoled tlmal the conlinstuounsdistrihulioun is valid at all the values of I, within theidenlnfued rangeof commnponeurts,contraryto theSCNgroupfunction which is valid only at tIrediscretecarbonnumbers.The insole fraction of SCN group n, can bedeterminedsimply byintegratimrgthedistrihutioum function between(n-h) andn,
F(l)dI so(6.38)
236 6. Fluid C/uaracterisaiio,u 6.3. l)e.seription ofFliii,l Fleas”,’ Enrol 237
Similarly, themole fractionofanycarbongroup,or pseudocomponent,can he determinedbyincorporatingtheappropriateboundariesin theaboveintegral. — I) = —i (6.45)
Whenthemolecularweight of eachcomponent,M, is usedto representit ins llue distrihutiomm . . .
function,that is I M , theaboveequationbecomes, rime duslrui’uuutnon fimnctnomr us getnerutlly usedto describetIme C7
+ fraction, witlm its parametersdelermmrined by regression to mnmatch tine available SCN group experimental data, using
cM. Eqs.(6.39)and(6.40). The valuneoft should ire between86 and 100, tlme molecularweiglnls
F(M)dM zc (6.39) of nC6
andnC7
, respectively,basedon thedefiumition of C7
.,.. It can be treated,irowever, asaluning parannreterun tlse regressiorr,or assumedeqtmurl to the mid-value of 90 in line absenceof
which is theareaunderthecurveof F(M) betweenM5
.1
andM5
. unmeasuredSCN groupdata. TIme function so developedcan tisen be usedto exteind tire fluiddescruptmonto heaviercompounds.
The molecularweightof SCNgroupn, is determimimmedby,tire vuulume of’y, rangingapproxiumnatelybetween0.5 to 2.5 for typical reservoir fluuids, conlrois
thedistributionskewness. Figuire 6.11 shows typical distributions with differentvaluesof ‘yJF(M)MdM = M~z~ (6.40) kr a C
7.,. fractiouswitim MC7
5=20() ammd t=92. Valuesof yequalto. or less tiran, one represent
mmmixttmrcswilh cotstimstnotrsdecliumein commceumtratioum,winereurs valucsmore thanorre demmmonstrmnte
Themostwidely useddistribution functionis thegurummmsra probability fumnclioun,mrs proposedby a mmmaxiunsurmsin concermtratiomn.‘lime peakwill smut towardsIseavierfractionsby increasingthe ‘yWhitson [9], usingthensolecularweigint asthechumnmcterisatiomrvariable, value.
(6.41)
wherer’(’y), is the gamma function, t is the mininnumsi molecular weigint included in thedistribution,and‘y and~ determinetheshunpeof thedistribution fumsctiomswith lime meanandthevarianceequal to (~3+t)and‘y
1~32,respectively. Hence,
so (M1
, — c)iy (6.42)
wlmere MD is the averagemolecularweiglmt of tlre continuouspart, courmprisedof compoundswith molecularweightsbeginningfromsn ‘r andexlemiding to imsuinity.
Thegammafunction is,
r(y) so
which canbeestimatedfrom thefollowing expressions[331.
r(y)so1+~A(y—1)’ I�y�2
whereA1
representstheparametersin theapproximatepolynomial,
F(M) = — t)~i exp[—(M — t)113]I/[IYF(y)I
A1
= -0.577191652A
2so 0.988205891
A3
so -0,897056937A
4so 0.918206857
(6.43)
(6.44)
A5
= -0.756704078A
6= 0.482199394
A7
so -0.193527818A
8= 0.035868343
MolecularWeight
Figure6.11. Distribution of commnponentsrepresentedby the ganmrmaprobability functionwithdifferent valuesof y. SPECopyrighl. Reproducedfrom 191 with permission.
As describedby Eq.(6.39), the fraction of area under the curve between two molecularweights, identified by the sinadedarea in Figure 6.11, demonstratestIne mole fraction of apseudocomponentcomm’uprised of all compoundswith molecularweightsbetweenM
5.1
andM5
.
Thevalueof ‘p I, reducestire gannmadistributionfutmction to,
F(M)={exp[_(M —t)i~3]}/I3 (6.46)
winds is a sinmpleexpourentialdistribution,
l2(M)=~i~_Li~exp(_M/I3) (6.47)
F(M)
100 200 300 400 500
For y valuesotutside tIme rangein Eq.(6.44
), tire recurrencefon’ummunlum rsnumy he usedto evaluatethegammafunction,
238 15. Fluid (‘Iuara,’teri,mtjolt I 6.3. Deccriprionm of Fluid F/e,uu’v End 239
The mole fraclionsof .SCN groups can be determinedfrom Eq.(6.49),with M,=l4n+2 for
(6.48) nornmah umlkammc houun(laries,
[ ( 14 ~) (l4n+2)—tlnz~=lnlexpi I—I —— ________
[ ~M,,—t) M~1
—t
wtnicim results un,
Note ttmmrt lIme normnnmuhisedmole frmuctions. calcunlatedby Eq.(6.50),have been unnultiplied bylIne C,, unmolc lrmuctuonn.
‘lIme rmmohe frmrciion, oh’ czncis SCN group cars he deterrmnimme(I frousm lime above equation. Thesimm of nsole fructuoushecouusesequnal to i,,, omuly when carbonnuumbcrsup to infinity arernclumded. ‘lime cormtrnhuulionof very huc’mnvy connpoumndsto the total mole fraction, however,heconumes insignuificanl, mis stuinwuu mum line following table for various cut-off carbonnumnsuhers.
I.asmcarhonnum,u,hcr [.ast u,iiulccularweighi - Ti,tatnoruunaliscdnmole_fractions30 422 0 1)85841) St,2 0.997650 702 0.9996
—~ 61) 842 0.9999
tum phasehehmaviomurcalcumlatioums,time propertiesof identified SCM groups must he known.Aluhounglm the selectionof ummolecnuhar weightsof norumnal alkatnesas the boundariesagreeswiibm the convenijoimmuldefinnitious of SCN groups,that is the fraction collectedbetweentwocoissecmntive norrnrmul mulkarme hoihimig points, it results to carbon groups wills averagenmolecumlarweightssigumificantly different fromir Itnose of generalisedvalues. For example,mire C,
9group of this example Immus, by the above approach, a nmolecurlar weight of 625,
whmercussthat of tine genrerahisedSCN group hasa molecular weiglnt of 539, Table A.2.‘[‘Inis is dune tui preseunceof arousmaticsand naphtlmeusesin the sanmpleunder consideration.ilensce, theunse of SCN group propertiesfor the abovecharacterisationis not justified.
1mm order to cimmuraclerise the C,, fruictioun with SCM groups similar to those in thegenermilised tumble. their unnott’cutar weights sisould he used to identify the grouphouuumdmnries. ‘I’Imc rmmolcculmur weiglut houmundariescumn he determinedby solving Eq.(6.49)for lire geunerahisedSCN groups. The dependeuncyof calculated boundarieson the C,,
ummolectulmur weiglmt amid selectedvmulume of ‘t, is insignificant. The calculatedresultswill nottypncmrlly deviate rnmore tinmun OliC unit from tire values determined by simple linear
unveruigiung,
M, =(M~, — M1
.)/2+M1
.
‘Ilic SCM grouup nmolecuuhumr sveiglnl hounnsdmuries,and the valuesof group molecularweightcalcumlatedby hq.(6.49) are given un Table P6.4, and compared with the generalisedvmnhrues. Mote that the valuues are cquuaI willmin the accunracyof measurement. The givenununlecuularweigini boundariesaregermeral and earn he riced for other fluids in the absenceof numeunsuired,mmok’cnnhmnr we ig ImI
(6.49)= z~, cxp(—0.55I 8(m
7I — M, / 79)=0.0392xexp(-0.57718-0.17721Sn)
Substitutingtheabovedistributionfunction in Eq.(6.38),mind nntegralimngit, we ohluuumn,
so _exp(t/~)texp(_M, I~)— exp(—M, .i
whereM, andM, aretheupperandlower molecularweightsof the comn’ipommcun)spresciml irs tineSCM groupn.
Themolecularweightof SCNgroupsis determinedby stubstituntiungline distrmhumlion function muEq.(6.40).
= _~eXP(t/~)ft~~+ IJexP(_M,i~)- + lJexP(—M9
i /I3)]/zc
Eq.(6.48)cmmn be wrilteun in thesimsnphe logarilismie fonssof Eq.(6.3I) by rclumling M,, arid M,1logether. Assumingtlnat M,- M,
1=l4, we obtain,
I ( 14 ~\ 1 M —tlnz , so Ini expi I—Il— (6.50)
~‘ [ t~,M0
—’t} j M0
—t
which is similar to Eq.(6.3I), with thevaluesof A and B asfollows:
A= In expl 14 ~ t (6.51)~M~,—c) j M
0—cj
1 (6.52)— t
Eq.(6.52)can beused to calculateam initial guessfor B to solveEq.(E6.3). Note that M, inEq.(6.50)is thehighest molecularweight presentin tire SCN group and M~,inn Eq.(6.3l) usthemolecularweightof SCNgroup.
Exannple 6.4.
Describethe C7+fraction of the fluid in Example6.3 by mm countmnnuoursfunction run lermsof the molecular weight, arid uuse it to estimate tine mole fraciton of SCM groumpscomprisingthe C7+ fraction.
Solution:
The value of y is assumedequalto one,due to lack of partial analysisof the C,, fraction.The value of f3 can be calculatedfrom Eq.(6.42) after seIecling the lowest molecumlarweightpresentin C,,, that is, t.
The simplestapproachis to selectthe normal alkanemolecularweightsastIne SCM groupboundaries. Hence,normal hexane will be the component with the lowest rsnolecn.uiarweight compound present, t=86, which results in ~3=79. ‘I’herefore, mhe distributionfunction of time C,, fraction in termsof themnrolecularweight, Eq.(ô.
47),becomes,
F(M)= 0.0376exp(-Mfl9)
240 6. Flmmuol (‘har,neteun.catuotn I 6.3. l)e.ceriptionuof Flm,id F/eau’i’ Eiud 241
(‘8 (‘9 ClO CII C12 CI) CI4 CI5 CI61)5162 0.4689 0.3784 0.3293 0.2843 0.2436 0.2132 0.1784 0.1401(‘18 C19 C20 C21 C22 C23 C24 C25 C260.0800 0.1)625 0.0614 0.0459 0.0331 0.0325 0.0288 0.0244 0.0191C28 C29 C30 C31 C32 C33 C34 C35 C36li.tt135 0.1)116 0.0101 00083 0.01)76 0.ttt)65 0.0049 0.0043 0.00311(‘311 (‘39 C40 C41 C42 C43 C44 C45f11.0031 0.0027 1)0022 0.0018 0.0018 0.0016 0.0013 0.0104
SCN Gromup C7Mole% 0.5573SCM Group CI7Mole % 0.1073SCM (irmnip C27Mmutc % (1.0164S(’N Grump C37Mole % 11.0034
‘tIme untIe trmucuu,noI (‘,, I,mus hccum adjnusuculno nuiakcthe total mmmu,lc equal to ‘1,92%. i.e., the nn,,tefractionof C,,in tIne original fluid.
\Viren sufficient inrfortmmuutioun our the distributions of SCN groups in C’y+ frmmclion and theirmoleculmu’weight is avuuilahle, tIme putrausnetersof tire distribution function can be oplinnniscd bymnmmrtclming tIme unneastiredgroup(latun, insteadof urssunmimsgyso I ausd using generanlisednmolectularweightdatmu mis in time abovecxanmmplc.
Whitsomm Ct al. [341 proposeda procedurewhere the measuredunassfraction of eachSCMgroup is usedto regress the three parametersof tIne gamma function while adjusting themolecurlarweighthouundariesof SCM groups. They applied theimsethod to 44 gascondetssateumndoil smumnples,anddeternnmnedtime parametersof the gammaprohurhility distribution functionfor theism. ‘Fire arutimorsconclrmdedtlmumt ‘randycouldhe reasonablycorrelatedby,
so I l0~I — 11(1 + ,~mm72l~1 (6.53)
I leuscetime unptinmnisalioim cams onmly he cousductedfor y and ~, witlm t relatedto y by tine aboveeqrmation.
lii tircir proposedmnmetirocl a valuef(nr y is initially mrssunred,Ca. ‘p1. andvaluesof t arsd ~ arecalculatedfrom Eqs.(6.53) amid (6.42). respectively. Tlren the upper boundaryof the firstgroupis assumedatsdits massfraction is calcunlatedby,
so zc M~/(t + )j~) (6.54)
where1
um and M5
are the umnole fraction and molecular weight of tlre selectedgroup usingEqs.(6.39)and(6.40), respectively. If the abovecalculatedmass fractiondoesnot matclnthe
experinmermtalvaln.ue,witlmin a toleramneeof ~ the upperboundaryof the molecularweight isadjunsted. l’lse urssummmption mmmd uudjustnsentof the upper msmolectnlusr weight boundariesarecointinued for otimer carhoumgroups sequentially,up to the plus fraction. The sum squaredeviuttioumsof curlctulmmtcdmmsolecunlunrweigintsof thegroups,umsingEq.(6.40). from the measuredvumlumesmnre Ilmeun evalrmamed. The parammmetersof y and~1are optinmised by minimising theabovestmumm. After lime oplirnniscd valuesare determinedthe reliability of the model is checked bycomsspariumgtirecalculatedmnoleculmurweigints and nnolefractionswith theexperimentaldata.
‘Fine useof SCM groupdatato tietermnninethe paraunretersof anycontinuousdescriptionis only_______________________________ reliablewincis theconceustratiomsannul nunolcctnlarweigirt of sufficient numberof SCN groupsare
known. Winitson etal. [34], evaluatedtheir proposeduuiethodusingdifferentnumbersof SCMgroup data. In general time mnnelhod was found reliable when information on more than 15groupswereusedin optimisationof tine parameters.
F(M)= 0.04427exp(-M/75) Direct Application
The mole fractionsof SCNgroupscan bedeterminedfrom Eq.(6.48),with the molecularweightboundariesgiven in the abovetable. The resultsareas follows:
Table E6,4.GeneralisedSCN groupmolecularweightboundaries.SCN UpperMolecular SCN GroupMolecular GeneratisedSCMGroup
Weight Boundary Weight, Eq.(6.49) MolecularWg~lmt,Table 6.1kg/kgmol kg/kgmnmol kgFkgumu,uI
Cl 102 96 96C8 113 107 1117C9 128 120 121ClO 141 134 134CII 154 147 147
C12 168 161 161C13 182 175 175CI4 198 19(1 191)CI5 214 206 2)16C16 230 222 222C17 244 237 237C18 257 250 251C19 269 263 263C20 283 276 275C21 295 289 2’)tC22 306 300 300
C23 318 312 3t2C24 331 324 324C25 343 337 337C26 355 349 34’)
C27 366 360 3(n()
C28 377 371 372C29 388 3142 3142C30 399 393 394C31 409 404 41)4C32 421) 414 415C33 432 426 426C34 442 437 437C35 450 446 445C36 460 455 456C37 470 465 464C38 479 474 475C39 490 484 41)4C40 499 494 495C41 507’ 503 5i)2
C42 517 512 512C43 526 521 521C44 535 530 531
C45 544 ____~_9 539
Selecting ‘r=90, the valuedistribution functionas,
of ~ is calculated fronn Eq.(6.42) equal to 75, with the
Thecontinuousdistribution fumrction cain be used in phasebehaviourcalculationssimilar todiscretecomtmponents. The distribution functiomn, as expressedby the integral in Eq.(6.35).
242 6. F/ui,! ( !,,uu,m,’ferisar:o,m 6.,). l)e.r,’rupti,nu of Fluid I/eat’s’ E,td 243
replaces the concentrationof individual discrete consponents. TIme pr’opertres of time umunusuericutllyeven for simple distrihutiots functions. Anurongst the nummerical melimods appliedcomponents,suchas thecritical propertiesrequiredin equationsof state,aremulso expressedby sticcessfully1361. thennetlmodof Guuussianquadraturehasprovedto be reliableandpractical.contunuousfunctionsof thevariableI, which representcomprisingcoumnpounds.
l’ire nnrethodapproxumutlesthe vuiltue of integralnumericallyby ad(Iing the weightedvaluesof aFor example,thetwo parametersof a vain der Waahstypeeqinunlmon of slate,tmsnmsg time random ftuusctioum usl mm tmunnheroi’ specifiedvuuhiuesof thevumriahle.called thequadraturepoints,mixing rsulesof Eqs.(4.73—74),for a mnxttnre describedby lIme senmmi-coumtmnntnousumnetlmod, arecalculatedas, I Jf(l)cXp(I) d(I) =~wkf(Ik ) (6.59)
SN Iona so ~~x
1x,(a, ‘a,) +IJF(l)(a(l))°’
5dl + wherewk is tire wcnglst and f(
tt) is lIme vumlue of the function f(l) at the quadraturepoint, orroot, k.
Lu J (6.55)N Selccllmrgline gausrurmaprohunhulmly functiomr, Eq.(6.4I), to describethe eonlinuousfraction, the
2~x1
a3
°5JF(I)(a(l))°~dI imrtegral in Eq.(6.37)becomes,
wherethefirst termaccountstIne atlrmsclionn hctwecmntime discretecouunpouuumds.tIme sccomnd is that c” (M “ tY exp[_-(M — t)I[IJ= I (6.60)
fPE’(y)of thecontinuous fraction, and the tisird is dime to uumleractmots hctwecmn lIme discreteaumd tImecontinuousparts.
it sinounid he unoted Ihat lime fuinctuoms provides lIme distrihumtioms of the constiluenls witlmin theSimilarly for therepulsiveterm,or co-volume,weget, contimmumotuspmirl. imcnice.willn mu total valuueof I.
N Defining a mew variumble,b so ~x1b~+ JF(I)b(l)dl (6.56)
X(M-t)/~ (6.61)
The termsa(I) and b(t) are sousecontinuousfunctiours of I with valuesequal in pusratsmelcrsaand b, respectively,for compoundsdescribedby the comrtimrruounsdescription. Exuimples of reducesEq.(6.60) to,suchfunctionsarethosegivenby Cotterrnan[351, for lime Somnve-Redhiclm-KwoumgEOS, whrerehe usesthemolecularweightastlne parameterrepresentingcompouunds. XYICxP(_X)dX so I (6.62)
F(’y)The equality of fugacity of eacir componentin co-existimsgpinasesmit equilibriuunn is expressedfor thediscreteandthecontinuousparts,as follows, wlniclm cats he shownas,
fV so ~i (3.30) J,f(x)exp(—x)dx I (6.63)
f”(l)= fn.(t) (6.57)where
‘lIme unmaterualhunlumusceequumitionsrequnired for plmaseheliumv our ca cmi luml ions, Sectlout 5. I, utecd tohe umnodilued alsoby incltuding tIme continumous description. For mu mmtixttmrc (lescrihedby the ~(~) ~--—. (6.64)semi—corstinuousrsnethnod, theumimulerial bumlanceequationsfor time total unnixlunrc mind tIne (liscrete r(y)comsrponentsremains the sameas Eqs.(5.1—2), wilhm mmum additional equnaliors for tine countinu(nusfraction, I
Suhsluturtionmof lIne couumpositionsush(histrihution of Eq.(6.63) for 5 F(I)dI , in Eqs.(6.55—56),nt Fr(l) so nLFu(i)+ nVFV(I) (6.58) reducestine instegrumlsinn theexpressionsfor a amid b, to tine fol1owin~generalform,
wlrere FF(l), F’(I) and Fv(1) are thedistribution fummctions for the continmmomusfractions of L f(X)exp(—X)dX (6.65)feed, liquid mmmd vapour respectively. It has been shmowmm tlnat whets a slistnihumtmon function,sumcls asEq.(6.4I), describesthecontinuousfractionof a pliunse. tine suuunsctype of fuunction alsodescribestine oIlier equilibratedpisuise 1361. TIme rangeof cousnpoundsdescribedby mill three Ohvnously time functions ~(x) is duffcretnt to that inn Eq.(6.63)anddependson theexpressionsfunctions is the same. lhnat is t in Eq.(6.4l). hut otimer paraunieters.y and ~, are generally for uuM) umund h(M). lire roots utund werghts,however,arethe samefor the integralsas theyalldifferent. I belongt(n thesammieclass((lauss-Laguerre)of functions.
Tire useof thedistribution function,and theresultingderivativesfromrm Eq.(3.3I), to detennine I Applytusg tIne quadratureintegration nmetlnodto Eq.(6.63),we obtain,the fugacity coefficients leads to complex integral equationswhich can ously he solved
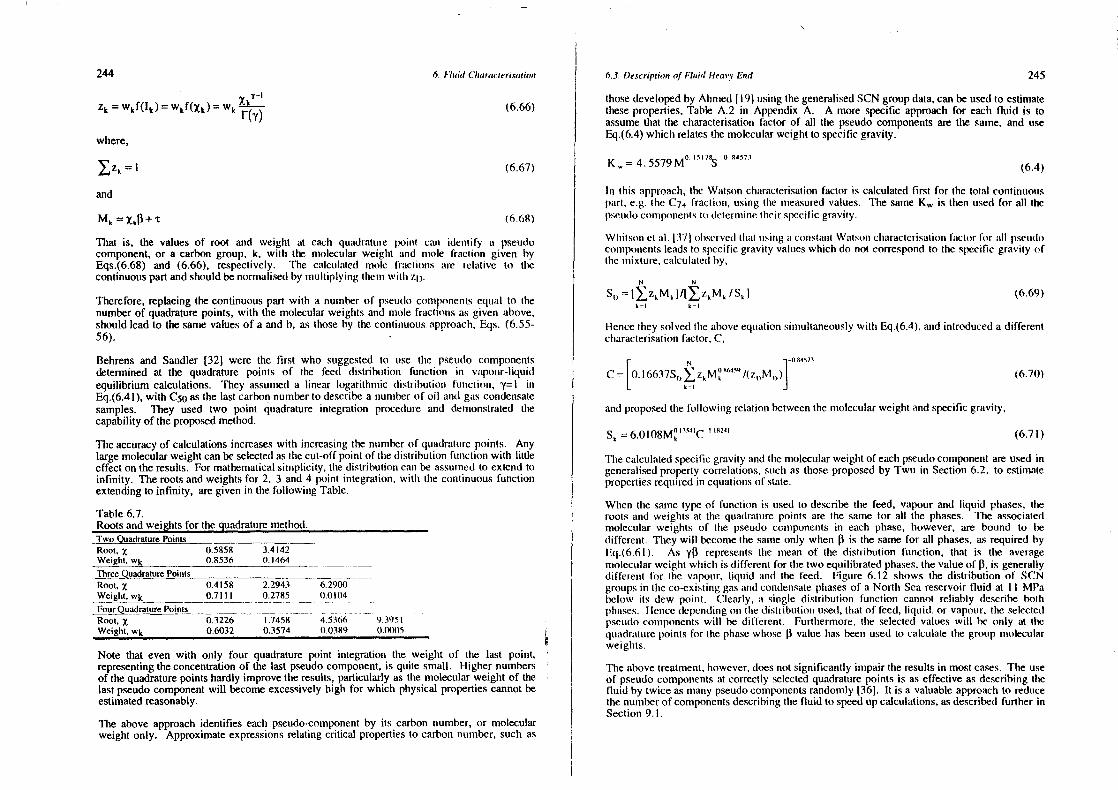
244 6. Fluid Cbnara,’ierLcagio;n 1 6.3. i)e.criptiouu ofFluid tjeau”,~Eund 245
Table6.7,Rootsandweightsfor thequadraturemethod.Two (‘r•~,1r,.,~•r.P,s,n,.,
,~ i-i= wkf(lk) = wkf(Xk) = Wk ~?— (6.66)
where,
~zk—l (6.67)
and
(6.68)
That is, the values of root and weight at each quadrature l’1oiust cats idemnlify a pseudocomponent,or a carbon group, k. with the molecular weight and nmole frauction given byEqs.(6.68) and (6.66), respectively. The calculunted mole frmucturns mire relative to tinecontinuouspartandshouldbenornialisedby multiplying tlncm witls ~l)~
Therefore,replacingthecontinuouspartwith a numberof pseudocomsrponentsequal to thenumberof quadraturepoints,with themolecularweightsandmole fractionsas given above,should leadto thesamevaluesof a and h, as thoseby the continuousapproach,Eqs. (6.55-56).
Behrensand SandIer [321 were the first who suggestedto use tine pseudo componemstsdeterminedat the quadrature points of the feed distribution function in vapour-liquidequilibrium calculations. They assumeda linear hogmnrithmic distribution fumnction, y=I iiiEq.(6.41),with C
50asthe lastcarbonnumberto describea nunnberof oil mutmd gascondensate
samples. They used two point quadrature integration procedureand deunmonstrated thecapabilityof theproposedmethod.
Theaccuracyof calculationsincreaseswith increasingthe numberof quadraturepoints. Anylargemolecularweightcanbeselectedasthecut-offpoint of tInedistribution fumnctionm with littleeffect on theresults.For mathematicalsinnplicity, thedistributioncams be assunssedto extendtoinfinity. Therootsandweightsfor 2. 3 and4 point integration,with tIne continuousfunctionextendingto infinity, aregiven in thefollowing Table.
thosedevelopedby Alsmnned[191 usingtine generalisedSCNgroupdata,canbeusedto estinsatetheseproperties,Table A.2 in Appendix A. A more specific approachfor each fluid is toassumethat the characterisationfactor of all tine pseudocomponentsarethe same,and useEq.(6.4)whichrelatesthemolecularweightto specificgravity.
K~=4.5579M°i.Si78~-O 8457i (6.4)
In this approach,the Watsoncharacterisationfactor is calculatedfirst for thetotal continuouspart. e.g.the C
7~fraction, using tine measuredvalues. The sameK~is then usedfor all the
pseudocomimpommeuststu determssinetimeir specific gravity.
WImil sinuset mil. 137 ohseu’vedthaI rusiung mu conrstauntWmnlsoim cimaraclerismntiou lmnctor for mull lrsCti(Iocomponetstsleadsto specificgravity valueswhich do not correspondto thespecific gravity ofthe mixture,calculuntedby,
S0
so 1~zkMk]F[~i.5
M5/S~1 (6.69)
Hencethey solvedtIneaboveeqtmationsinsuitaneouslywith Eq.(6.4),andintroduceda differentcharacterisationfactor,C,
N
C = [o. I 6637Sn)~zkMk /(7.0
M0
)] (6.74))
andproposedthefollowing relationbetweenthenroieculan’weigint andspecificgravity,
so 6.0l08M~un4m
C i 18241 (6.71)
Thecalculatedspecificgravity andtine nnolecularweightof eachpseudocomponentare usedingenerahisedproperty correlations,stmch as thoseproposedby Twu in Section6.2, to estimatepropertiesrequiredin equationsof state.
Whenthe sametypeof function is usedto describetine feed, vapour and liquid phases,tirerootsand weights at the quadraturepoints are the samefor all the phases. The associatedmolecularweights of the pseudocomponentsin each phase, however, are bound to hedifferent. They will becomethesameonly whemn ~ is thesamefor all phases,asrequiredbyEq.(6.6I). As ‘yr) representsthe mean of the distribution function, that is tire averagennolccularweiglnt wimicim is different for tine two equilibratedphases,thevalueof ~3,is generallydiffereint for the vapour, liquid and the feed. Figure 6.12 shows the distributionof SCMgroupsin time co-existingguns mindcondensatephasesof a North Seareservoirfluid at II MPabelow its dew point. Clearly, m~ single distribution function cannot reliably describebothphrases.Iiemnccdepcmrthiumgon tIme distribution used,tlmal of feed, liquid, or vapour, the selectedpseudocomponentswill be different. Furthermore,tine selectedvalues will he only at thequmrdnaturepoints for time phasewhose1~ valuehasbeen usedto calculatethe groupnnmolecularweights.
Time abovetreatnsent,however,doesnot significamntly immspair theresultsin mostcases.The useof pseudocomponentsat correctly selectedquadraturepoints is aseffectiveasdescribingtimefluid by twice asmauny pseudocomponentsrandomly[361. It is a valuableapproachto reducethenumberof componentsdescribingthefluid to speedupcalculations,asdescribedfurther inSection9.1.
Root,X 0.5851)Weight. Wk 0.8536
3.41420.1464
ThreeQuadraturePoinisRoot, ~ 0.4158 2.2943 6.2904)Weight.w~ 0.7111 0.2785 0.0104
...op~rat~mrePointsRoot, ~ 0.3226 1.7458 4.5366 9.3951Weight, Wk 0.6032 0.3574 0.0389 0(8305
Note that even with only four quadraturepoint integration the weight of the last point,representingtheconcentrationof thelast pseudocomponent,is quite small. Higher numbersof thequadraturepointshardly improvetheresults,particularly asthe molecularweightof thelast pseudocomponentwill becomeexcessivelyhigh for which physical propertiescannotbeestimatedreasonably.
The aboveapproachidentifieseach pseudo-componentby its carbonnumber,or molecularweight only. Approximateexpressionsrelating critical propertiesto carbonnumber,suchas
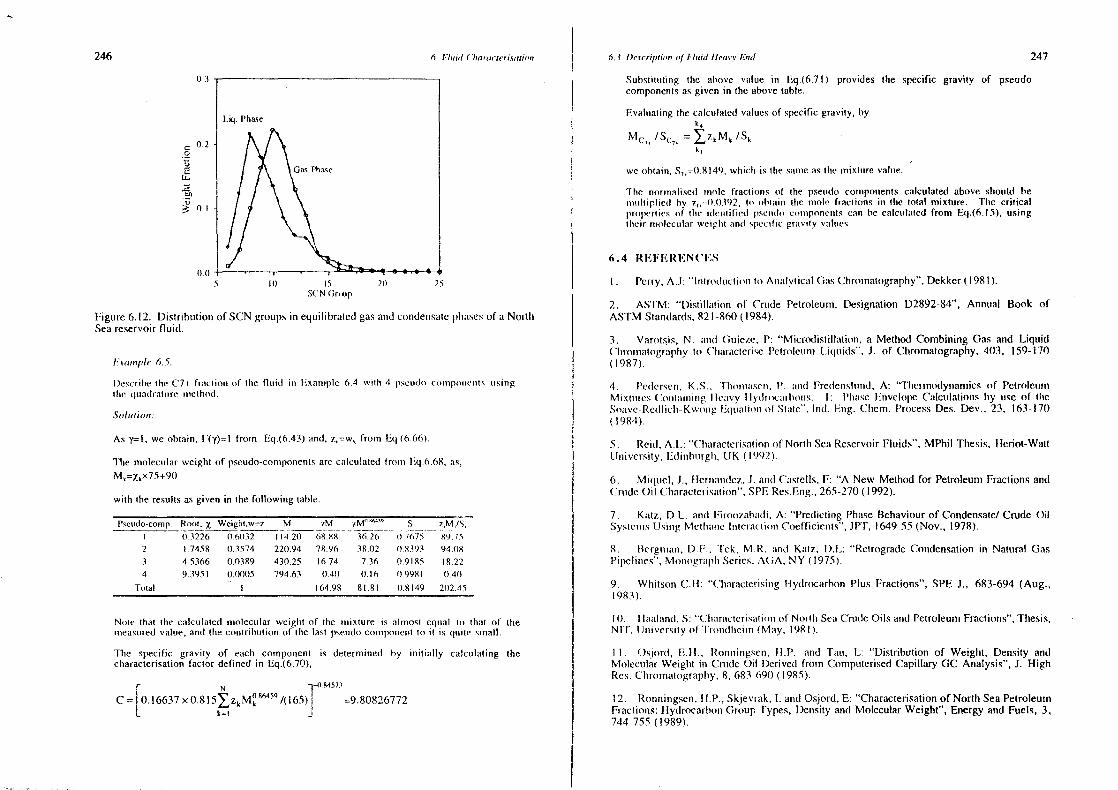
246 6. Fluid (‘!mau’ncterj.c,’mtio,i 6,3. De.ceriplioru of F’ lmn,d 11cm”,’ End 247
0.3
0.20
U‘0
U-.0
8~1
01
(10
Figure6.12. Dislribtutioms of SCN groupsin equihihrateshgasandcondetmsatcphrasesof a MortlsSeareservoirfluid.
ksanuple6.5.
b)escrihethe C7+ frmuction of tIne flmuid inn F’.xausuple 6.4 svithu 4 t~etndoconnipuini&’umts (usingI Inc quu adrattire noelhod.
Solutuo,i:
As ysoh,we obtain, F(y)sol from Eq.(6.43)munsd, z,sow~from Eq.(6.66).
The molecularweighi of pseudo-componeuntsare cmuhculatedfrommn Eq.6.614, as,M(soX~x75+90
with theresultsasgiven in the followiung table.
Pseudo-comp. Room. ~ Weight.w=z M iM zM”’~’0 S
(I 7675
eM/S
89.75I t).3226 0.61(32 114.2(1 68.88 36.262 1.7458 0.3574 220.94 78.96 38.02 (1.8393 94,08
3 4 5366 0.0389 430.25 t 6.74 7.36 0.91145 18.224 9.3951 0.0005 794.63 0.40 0.16 0.9981 0.40
Total I 164.98 81.81 0.8149 202.45
None utiat the cmulctmtatedmohecuularweight of the mumixture is mnlmost equmut to thmmt of theunmeasuredvahune,and the coimtrmbulionof the tasl pseimdocommspouncnui to it is qnuine summall.
The specific gravity of each component is determined by initially calculating thecharacterisationfacior defined in Eq.(6.70),
N
c so [o. 16637x 0.815~zkM~SMSS1(165)] =9.80826772
Suhslitmntiung the above value in Eq.(6.7I) provides the specific gravity of pseudo
componenlsasgiven in the abovetable.
Evuihuatingthe calculatedvaluesof specificgravity, by
Me,, /Sc,, = ~zkMk ‘5
k
5’
we nhiain, S,,=0.X149, which is the sameasthe mixturevalue.
The normaliseduusohe fractions of the pseundo conmrponentscalculatedabove should benmiultiphieil by z,,=(l.0392, to obtain lime mole fractions in the total mixture. TIne criticallununliertim’s of due identified ps<’unr
1mi comnmpommemstscmnmm he cumhcmuimnted from Eq.(6.IS), using
I hueir mumolccunI mur we ighit mmmd specific grmnvuty vmshues.
6.4 REI”EREN(TES
Perry.A.J: “hntm’oc.huictioui to Ammumlylicuni (las Chnrotnatograplmy”,Dekker (1981).
2. ASTM: “Distihluulion of Cnude Petroleum,Designation D2892-84”, Anmnual Book ofASTM Standards,821-860(1984).
3. Varotsis, N. mumnd Guieze. P: “Microdistillation. a MethodCombining Gas and Liquid(‘hiromatograpimy to (‘Immiraclerise PelroleunmsLiqui(hs . J. of Clmromatography,403, 159-170(1987).
4. Pedersen.KS.. ‘I’hnomnimnscn. P. amid Fredeumsinnmnd.A: “limermo(lynamics of PetroleumMi xliii cx (‘onulaimi inig I Icmuvy II ymhmm ucamhssuis. I : Plmuise Fmmvelopc Cuulcn.mlationns hny tuseof tImeSomuve—Redlichs—KwouigEquumtioiu of SImile’’, Imnd. Emsg. Cimetn. ProcessDes. Dev., 23, 163—170(1984).
5, Reid,Al.: “Chimtracterismmhionrof Nortin Semi ReservoirFluids”, MPhii Thesis, i-leriot-WmnttUmniversity, Edinnhtn’ghn, UK (1992).
6. Miquel, J., llerumaundcz,J. amid Castells,F: “A New Method for PetroleumFractionsandCnndeOil Charactenismntion”,SPERes.Eng.,265-270(1992).
7. Katz, [).L. ami(l I’iroozahuudi,A: “Predictiung PhaseBehaviourof Condensate/CrudeOilSyslcmnisUsing Methiunuse luntermsctiounCoefficiemits”, JPT, 1649-55(Nov., 1978).
8. Rergnuiuums, t).F.. ‘l’ek, MR. mind Kale.. DL: “RetrogradeComndensationin Natural GasPipeliumes”,MonnogrmuphnSeries,AGA, NY (1975).
9. Whitson Cli: “ChiaracterisimigHydrocarbonPlus Fractions”, SPE J., 683-694(Aug.,1983).
I 0. I lmummlaurd, 5: “Chuumrmnclcnisatiots of Norlh Sea Crude Oils and Petroleum Fractions”, Thesis,NII’, I Jnmiversit y of ‘I’rommdhseitnn (May, 1981).
II. ()sjord, ElI., Rouninimrgsen. lIP, mind ‘ruin, L: “Distrihution of Weight, Density anelMolecular Weight ins Crtmde Oil Derived fronn ConiputerisedCapillary GC Analysis”, J. HighRes. Chronnatograpimy.8, 6,S3~690(1985).
12. Romsningseus,H.P.,Skjevrak, I. amid Osjord.E: “CharacterisationsofNorth SeaPetroleumFractions:HydrocarbonGroup Types,Deussity aurci MolecularWeight”, Energyand Fuels,3,744-755(1989).
5 10 IS 20 25S(’N (;~~
248 6. F/ink! (lnaracier,,ca,bum 6.4. Refere,mces 249
29. Loimrenz, J., Brmny, Ba. unnel Clark, C.B: “Calculating Viscosities of Reservoir Fluids13. Robinson, D.B. and Peng, D.Y: “Time Charmuclernsationof the lleptmmsnes amid Heavier fromn tiseir Conuposmitioums”.JPl’, 1171-76(Oct., 1964).Fractionsfor theGPA Peng-RobinsonPrograms”.GI’A ResearchReport28. ‘l’uI.sa (1978).
30. Alrnmed, T., Cmudy, G. mind Story, A: “A GeneralisedCorrelation for Characterisingthe14. Yarborough,L: “Application of a GeneruilisedEqummtionof SImile to Peli’olcunr Reservoir Hydrocarbonliemuvy Fractions”,SPE14266, Proc.of 60th Ann. Conf. (Sept., 1985).Fluid”, Equationsof State in Engineering,Advmmncesinn Clmemsnistry Series. (‘hmuuo, K.C. amsdRobinson,R.L. (eds),AmericanChemicalSoc., No. 182, 385-435(1979), 31. Pedersen,KS., Ellilie, AL. and Meisingset, K.K: “PVT Calculations on Petroleunn
ReservoirFluids tlsinsg Measturedmnmrd Eslinrsaled CompositionalData of the Plus Fraction”,IS. Curvers, J. and van den Engel, P: “Gums Chrommiatograpimic Metlmod for Sinmmn.ulumlcd , lnnd. ling. Cisemsr. Proc. Res., 31, 1378-1384,(1992).Distillation up toaBoiling Point of 750’C UsingTemperature-ProgrammedJnjectiotsanmd HighTemperatureFusedSilica Wide-BoreColumns”,J. High ResolutionClmronnatograpisy,12, 16- 32. Behrens,R.A, and SandIer,SI: “The Use of SennicontinuousDescription to Model tine22 (1989). C
7, Fractionsin Eqsialionof StateCalculations”,SPE/DOE14925,Proc.of 5th Symposiumon
EOR, ‘[‘tulsa (April., 1986).16. McTaggart, N.G, Glaysher,P. and Harding, A.F: “Correlation of Simntmhumted TrueBoiling Point Curves by Gas Liquid Chromatograpimyunrmd IS Plumte L)islillation l)mmta”, 33. Ahrummmnowitz, M. mnmmcl Slegtnn, l.A. (Eds.): “handbook of Malhematicutl Functions”.Calculationof Propertiesof PetroleumProducts,ASTM, STP, 577, 81-94(1975). Dover Puhlieaiions Inc., New York, 256-257 (1972).
17. Chorn, L,G: “Simulated Distillation of PetroleumCrudeOil by Guts Cinrommnuntogr;mphy, 34, Whitson, CII., Anderson,‘F.F. anmd Soreiele,1: “Application of theGamnmaDistributionCharacterisingtheHeptanes-PlusFraction”, J. (‘Inro. Sci, 22, 17-20(1984). Model to MolecularWeigint ansti t3oihin~Point Data for PetroleunnFractions”, Chemn. Eng.
Consmrm.,96, 259-278 (1990).18. Danesh,A. andTodd, AC: “A NovelSamplingMethod for CompositionalAnalysis ofHigh PressureFluids”, J. Fluid PhaseEquilibria, 57, 161-171 (1990). 35. Cottcrmnman,R.L: “Plrase Equilibrium for SystemsContaimring Vemy Many Components,
Developmmrcntumund Applicationof (‘ontimnuous Thermnmodynnamics”,PhD Dissertation,Univ. of19. Ahmed, 1: “Hydrocarbon PhaseBehaviour”, Gulf Publisining Compummmy, lloustotn , Calif. at Berkeley(1985).(1989). I
36. Cotiermmman, RI.. mmmd Puuuusmmitz, J.M: “Flasin Calculations for Continuous (Sr20. Kesler, M,G. and Lee, B.I: “Improve Prediclions of Enllnumlpy of Fractions”, 1-Jydro I SenmicontintmousMixturesUsimmgmtus Eqtuationof Slate”, I & EC Proc. Des. Dcv., 24, 434-443Proc.,153-158(March, 1976). (1985).
21. Lee,11.1. and Kesler, MG: “Improve VapourPressurePrediction”, Ilydro Proc., 163- 37. Whilson, CII.. Andersomm. T.F. and Soreide, I: “C7
, Characterisatiomnof Related167 (July, 1980). Equilibrium Fluids Using GammsmnnaDistribution”, in “C
7, Characterisation”,Ed: Chorn, L.G.
and Mansoori,GA., Taylor & Francis,35-56(1989).22. Cavett,RH: “Physical Data for Distillation Calculations,Vapour-Liquid Equilibria”,Proc.of 27th API Meeting,SanFrancisco,35 1-366 (1962).
6.5 EXERCISES23. Edmister, W.C: “Applied Hydrocarbon Ttmertsnodynaunics,Part 4, CompressibilityFactorsandEquationsof State”, Pet.Ref., 37, 173-179(1958). 6.1. ‘lime commmpositionn of us live samniple Imas becur dctenssimred by flumslning time fluid mit line
lmtbormttory conditions, mmmd mirnunlysing the collected,gas and Ilttiid phases by gas24. Riazi, M.R. and Daubert, T.E: “Simplify Property Predictions”, Hydrocarbon Proc., cisroimnatograpimy. ‘lIme commmposituonof gas, in mole has~smeasuredby a TCD detector,and59(3), 115-116(1980). liquid, us ussass basisnneumsuredby a FID detector,are given in the following table. Calculate
themixturecompositionin mole basis.cccc25. Riazi,M.R. andDaubert,T.E: “CharacterisationParametersfor PetroieumnFractions”, I& ECRes., 26, 755-759(1987). Couniponemml Guns Liquid
Mote% Weiglmt%26. Twu, C,H: “An Internally ConsistentCorrelation for Preelictimrg lime Ci’iticunl l’roperties ~ ‘~‘‘~‘t~ 19 0.0(1andMolecular Weights of Petroleum and Coal Tar Liquids”, J. Fluid PhmuseEquilibria, 16, (‘I 6851 (1(12137-ISO(1984), 1401) II 115
~ III’)27. Grahosku,MS. mind Datuhert,T.E: “A Modmficd Somuve l:qtmmttuour of Simile’ I~nu’Phmmuse (4 t 68 (114EquilibriunsCalculations I HydrocarbonSystemsns”, Iimd. Emmg. (‘Incus. Process Des. Dcv., ‘I 2 81 tt 5517(4). 443-448(1978). ‘ i’’5 I I’) tI5l
28. Katz, D: “An Overview of Phase Behaviour of Oil and Gas Productioms”,JPT, 1205- CS 1.84 1.1(11214 (June,1983). C6 0.75 2.17
C7 0.37 3.41(‘8 0.17 5.28
250 6. Flmmid Cho,’acteri.cario,u 6.5. Exefl’,.ce.c 251
C9 0.05 4.63CII) 0.01 4.37CII 0.00 4.20Ct2 0.00 3.17C13 0.00 4.46Ct4 0.00 3.38ClSi. 0.00 62.57
i-IItmianne
n-ttuuanei- Pennanesn~PentaneIlesanestlcpt7nncs+
0.5 15
1.2550.359
0.5510.6 164.771
Liquid PhaseMolecularWeiglnt= 2(16
6.2. Onemethodof estimatingpropertiesof SCN groups,or evaluatingthe uneasmiredvalues,is to relate the molecular weight and specific gravity by assumiming a cotmstant (UOP)characterisationfactor. Is this areasonableasstmmption?
6.3. Calculate the critical temperatrure,presstmre,volume and acentric factor for a pseudo-componentwith Tb=
6I2
K, S=0.866and M=275 kg/kgumnol, usirng lIne mnrcllmochs of Cmmvett(E.dmister for lire acemnl.ric factor), and Riazi-Dauhcrt (Lee-Kesler for lime micemitric fmuctor).Comparethecalculatedresultswith thoseofC~reportedin TumbleA.2.
6.4. Theconcentrationof C7+ fractionof a gascondeimsateis 4.77I mole % with tIre umnalysisas follows. Extendtheanalysisto C30+by SCNgroups.
Compositionandpropertiesof C7÷fraction.
TIme C7
, descriptionof thefluid is time saummeaslhmtt given ins Exercise6.4.
Describetire C7
, fraction by two and mnlso fottr psetmdo connponents,using the quadraturenuretlmod. Predicttime dew point andsaturateddensity of time gascondensateat T=394K using aptmasebclnaviommr umodel and describingthe C
7, fractious by a single, two and four groups
(Measuredvaluesin Tumble2.2C).
(s.7. ‘lIne commiposilionnof unn oil satrrpleis mis follows 13 I
Component MoIe% Densily, kg/mum’ MoI. WeightIlepimuumes 2 I .09 739.0 89Ocianes 15.01 749.4 10.5
Nonunuies 9.96 764.1 121Decauses 6.58 776.6 138tinmdecamses 6.67 785.7 151t~idecaneun 5.71 796.9 164Tridecanmes 5.30 810.5 178Tetr~iecanes 4.72 814.4 192Pentadecanses 3.73 822.5 206Ftexadecaunes 3.02 829.5 220Hepiadecanes 2.64 832.2 234Demadecanes 2.66 835.7 249Nonadecanes 1.32 838.1 263
Elcosanesplus I 1.59 1)52.1 353
~immponctum moteIraci n,,mm MW S(
N2 (1.0069
C02 (1(8)12(‘I 0.4709
(‘2 1)0569(“3 ()()439
i.C4 (1.0095
(‘4 (1(1242
-(‘5 ((.0111CS 0.0146
(6 0.0226
C7 0.0393 91.9 0.735
(‘8 0.0452 105.2 0.745
C9 0.0323 121 (I 0.784
CII) 0.0230 1331) (1.789CII 0.0203 48.0 0.794C 12 0.1)188 1(7311 0.806
(‘13 0.0162 1771) (1.819
C14 0.0176 190.0 0.832
CIS 0.0139 204.0 (1.834
C16 00103 217.0 0.844Cl 7 (1(7122 235(1 ((.841
Cl8 0.0085 248.0 1) 847
(19 (1(1)197 20(1(1 0.860
C20 11.18)32 269.4 1)874
C2 I 0.0081) 282.5 (1.870
C22 0.0053 297.7 (1.872
(‘23 0.0044 31)1.1 (1.875
C24 1)0(134 321.8 ((.877
(“25 0.0048 332.4 (1.81)1
C26 (1.0039 351.1 0.886
C27 0.0031 370.8 0.888
C28 0.0031) 381.6 (1.895
C29 0.0024 393.7 (1.1)98
C30÷ 0.0294 612.1) 0.935
6.5. The mole fraction, molecular weigirt amid speciFic grunvuly of C7.f fuaction of a gumscondensateare 0.04771, 165 and 0.8012, respectively. Describe time C7~I’rumctioum by acontinuousfunctionin termsof themolecularweiglst. anduse it to estimnaletime ninole fraction ofSCNgroupscomprisingtime C7+fraction.
6.6. Theconspositionof a gascondensatesampleis as follows.
Components Mot%NiurogenCarbondioxide
MeuhaneEnhane
Propane
0.2981.72
79.1397.4833.293
252 6, FIn,id C!naracierj.ca,ion 253
DescribetheC7, fraction by the gammaprobability function. Use the quadraturemethod torepresentthe C7, fraction by two, and also four groups. Predict the oil bubble point atT=345.8, using a phasebehaviourmodel and describing C
7,, by a single, two and four
groups. Comparetheresults(Measuredvalue ~b=23~7
MPa).
GAS INJECTION
Itnjecting gas iisto ~inoil reservoirto imncreasetime oil recovery,haslong been applied. It canI iunnprovetIre recoverytinrougim mnaitmtainingthe reservoirpressure,displacingoil, or vaporising
time insternnediateandimeavy fractionsof theoil. Astheinjectedgasis not initially at equilibriumI with thereservoiroil, the commtactbetweenthe phasesresultsin masstransfer,hence,changes
in propertiesof thetwo phases.Thedisplaceunentof oil by gasbecomeshighly efficient whentire propertiesof theadvancinggasanddisplacedoil becomesimilar. That is, thetwo phasesaclnievecompleteimmiscibility amid tire vapour-liquid interfacevanishes. At the pore level, theimmiscible displaeemmmentis practically 100% efficient, as time lack of interfaceeliminates the
-c’ ~ retainmentof theoil hr pores.
It is reasonableto assuumre(mull tine eqimilibriuns is reaciredat the gas-liquid interface. Hence,pirase belsaviour conceptsand nnodehlimmg methodspreviously describedcan be applied toinvestigate gas injection processes. The conceptof miscibility in gas injection, and theexperimentalandtheoreticalmetisodsto evaluateand designmiscibledisplacement,however,nmerit particularconsiderations. In this chapter,miscibility conceptsare initially de~cribedforsimple mixtures, and thenapplied to real reservoir fluids by presentingmethodsto àstimatemiscibility conditions.
254 7 Gas limjeetio,m 7.1. Miscihilin’ Coiucepec 255
7,1 MISCIBILITY CONCEPTS
Miscibility conceptscats be expressedcouivenmicumlly by exmtmmliliimmg I lie lilmuise lmclumivmour of mmternarysystem,simulatingtheinjectiongas-reservoiroil mixture,usinga triatsgtulardiagram.
The phasebehaviourof a threecomponentmixture (L: Light, h: Internnedimrte.H: 1-leavy) at aconstanttemperatureandpressureis shownin Figure7.1 by a ternarydiagrammi. Each cornerofthetriangulardiagramrepresentsacomponentaspure, 100%, whilst all binarynnixturesareonthelinesconnectingthetwo corners,e.g.,Point D. Any point witlsmn the diagratssrepresentsathreecomponentmixture,e.g., Point M and its composition is delernmsinred by its posutionrelative to the corners. When two fkuicts of different compositions mire mmxcd. lIme overallmixture lies on the lineconnectingthe two fluids, whiclm is called the dmhmmlnorm or operaliing!i,me, and its positioncanbedeterminedby theleverrule.
0 1. 100%
11100% 80 60 40 20 0
Figure7.1. Ternarydiagrampresentationof fluid plmaseequilibriaat constantpressureandtemperature.
Thephaseenvelopeis slnown by thecurveACB in Figure7.1. AIry nsmxlmnre,F. insudethe twophaseeumvelopeformnis a vapour phase,Y, andmu hiqumid plimise, X. mml equnmtubrmuunmm,lying on timephaseboundarycurve. Time line XY, connectingline two plnasesat cquilmhriummiis kmnowms as thelie line. llemsce, time left handside of the curve, AC, represemilssmntsmraledliquids, i.e. thebubblepoint curve,whereastine right handside.CB. represetrtssmslumrmnledgmnses,i.e. lIme chewpoinrt curve. The two pmnrts of tirecurveconvergemit mIsc crilical poimsl C, umlso kmmowmm mis tine plaitpoint. Any nnixturc outsidethepinaseenvelopeis mm siusgle phmuseumnder-saluruik’dflmnid. Plnaseenvelopes,and the associatedtie lines, at diffcremmt pressurescan be shown (mn time sanrediagram, where increasing the pressuregenerally results in thm~ shnrinkage of the phraseenvelope. A ternarysystemmay form more than two phases,or Irave a numberof isolated
two-phaseregiouns,hut thediagramirshownin Figiure 7.1 resemblesmostof the practical cases,andis quiteadeqtmalefor describingtIne miscibility commeepts.
I ignmne7. I shows I Immmt lime hu usuuucS ummmnlc of I. mmmd I, amid simmiihumrly of I and II, forumi singleplnasemmmixburcs ~vlmenmmmixed mit ammy proportion,whcremms, L mind ii forum a single phutsefluid whsemsmixedonly withninm a Iimssited ratio. l’wo fluids are consideredto be miscible, wlmen timey form asinglephaseat all proportiotrs,at constantpressureandtemperature.It is evident tlmat any twofluids with thseoperatingline not crossingtIme two phaseregionwithin the phaseensvelopearemiscible.
Figmnre7.2 slnows (mat mm ins jection gasconrprisedommly of! is nniscihle whenconlmmctedwith OilB, wlmereumsGasA is mint. It cami hecomime,hiowcver~miniscible eilimer by enrichmmiemmtwills I to A”or by rumising lIme systeninpressureto shnrink time phmaseenvelopemis shownby the clashedphaseetsvelopc.Wimeus lire ins~eclmonguns ammd reservoiroil, miiixcd at any ratio, forns a single phase.theymmmc cmuhledfirs, eo?mIa(’lnn,,scil,Ie. First conlmucl umuiscihility camm be achievedonly for higislyrich gases,or at very highs pressumrcsfor leansystenms.
Figtmre 7.2. First coustactmiscibility.
I 100%
Ann imijeclions gas whiiclr is miol immiscible wills mun oil mit first couslact, may achieve miscibilityduring ummimlhiple couilmnetsby gcltimmg etsrichedtlmrough vaporising lIme intern’nediatefractions ofoml. The process,kmsown mts tIne s’apori.silmgga.sdrive (VGD) is conceptuallyshownin Figure7.3.
time immjeclioun gas. I.., commiprised mit the light Ilimich onuly, after contactingOil A, fornnms twoequilibratedphasesof hiqumid X mind gas ‘~‘l~witln’anm overall nmixture F~.Note that the gaspirase,Y
1, is the original gasL after it inaspicked up someintenniediateandheavy fractions
from tIne oil phase. Tire gas phase,Y1
, movesforward and makesfurther contactswitls the
10%I) 711%i
A’
GasA
11 100 % L 100%
256 7. Ga.s Imujecthnu 7. 1. Miscibiliis’ Commeepl.s 257
freshoil andprogressivelybecomesricherparticularly in tine internnediates.as simowmn by Y2,Y3.... The gasultimatelybecomesmisciblewith oil at C, that is, wherethetangent line at thecritical point, whichis thecritical tie line with zerolength,gcnesthroughtheoil consposition. Itis quiteevident,that thecompositionalpathmustgo throughthe critical point, as it is theonlycondition that equilibratedphaseslosedistinctions,andacontinuoustransition fromnm gasto oilcanbeachievedwithout anyphaseboundary.
The aboveinjection gas,pureL, however,doesnot acirieve mumltiple contmtct nmmiscihility withOil B, astheenrichmentof theadvancinggasis limited by thetie lime X’2Y’2 thimrmiting tie line)which, if extended,goes throughOil B. It is evident that the nmiscibility cammnot he acisieveclwhen the oil compositionand the phaseenvelopeareat tire sameside of tine critical poimittangentline (critical lie lineextension). The vmiporising gasdrive immiscibility iimr oil B cmnn heachieved,however,by raisingthepressuresufficiently to shrink tine phaseenvelope,as shownby thedottedboundary. Thepressureat which thecritical tie line extensiongoesthroughtheoil is the minimum requiredpressureto achievemiscibility. lncnce, called the mini,uu,nmiscibility pressure(MMP). At MMP, thelimiting tie line beconmesthe critical lie hue astImegas phaseenriches through multiple contacts with the original oil attaimuimsg the criticalcomposition.
I. mIRm%
Figure7.3. Schematicphasediagramof vaporisinggasdrive at minimum miscibility pressure.
In thevaporisinggasdrive, the nmiscibility is aclsievedat the fromnt of tine advuminciunggas. Thegas composition varies gradually from that of the injected gas till rcaciminng tire criticalcomposition. Then it miscibility displacestheoriginal reservoiroil in a pislon-type manner.Nophaseboundaryexistswithin thetransitionzone.
The gascomposition appearsto have no effect on achieving the miscibility state in thevaporising gasdrive asit is fully controlledby theoil phase,asdemonstratedin Figure7.3. Arich gas, not forming first contactmiscibility with an oil, can, however, achieve multiplecontact miscibility through condensingits intermediate fractions to the oil as shown
conceplm.ualiy in Figure 7.4. Tine process.which is called the.condensinggas drive (COD), isdescribedbelow.
00%
Figure7.4. Conulcumsiusggmmsdrive scimetnaticpimasedimmgramn at nnimmirnsummiscibility pressure.
The ricim gasA formstwo plnases.gas, Y1
, and oil. X1
, in equilibrium aftercontacting thereservoiroil. ‘rise gums pinase unroves forward and leavesthe enricined oil X
1beisind to be
cotstumctedfurther witln tIme fresh gasA. resulting inn an oil even riclser in the imstenmmediatesasshown by X
2. X
3... . This processgoeson andthe oil is enrichedto theextent tlnat it finally
aquires the conmpositiommof time critical oil at C. At thsis point it will be miscible with gas A.The pressuremit which thecriticuil tie lime extensiongoesthrough tire gasconmposition,is theminimum requiredpressureto achnievemiscibility (MMP).
At MMI’, tIneoil plsaseetiricired in time intermediatethroughmultiplecontacts witim the injectiongasuittmmins time criticuml eommmposition,with the limiting tie litre becomethecritical tie iimse. ‘limeinnjectiomsGunsB, wInds is lemitier ins tlmc intermediatestlman GasA, doesnot form immiscibility, attine ciurrentpiessuure,mis tIme enriehmnentof the oil is limited to the compositionof the tie lineextenditsgtisrouglm lire injection guns composition(limiting lie line). The miscibility, however,can be achnievedby raisimsgthe pressureto shrink the phaseenvelopeas shownby the dottedcurve.
Time origimnal oil coumnpssitiommInas urn effect on achievingtine ntniscihility slate in tIre condcnsiumggums drive, asit is comslu’olled by tIre insjedtion gascumrmposition. I lence, instca(l of raisingthepressuretsr achmievc mmmiscihility, mIne injection gas mummy he enriched. Tire emmruclminmentlevel mntwinieR tIme critiemmh tie line extensiongoes throughthe injection gascomposition is called themninimm’rutnmmiscibility enrichment(MME).
In tine condensinggasdrive, tine uniscibility is achievedat theinjection point. The injection gasdisplaces the criticud fluid, in a piston type manner,with tine liquid composition varyinggraduallyto that of theoriginal oil. No phaseboundaryexistswitlsin thetransitionzone.
i 00%
I iOO%
GasA
GasII
H it)l)%
H 100%
258 7. (a.s l,,jecsio,u 7. 1. Mi.o’ibmlmiy Concept.c 259
Miscibility in Real Reservoir Fluids
The ternary plnase diagrammn of a multicomponent reservoir humid is ofteun expressedbyrepresentimsgthefluid with threepseudocomponents.It is commnnonto groupC
1, mnuiul N
2asIhe
light (L), C02, 112
S amrd C2
-C6
as the instermediate(I), and C7~
mis the ineunvy (II) fraction.Pseudo-ternarydiagrams imave beenmisrused, however, mn descrihinig line hcliavimmr of realreservoirfluids in gas injection processes,partucularly in estimatingthe ophinisuusr operatingconditionssuchasMMP andMME.
Theconceptualdiscussionon multiple contactmiscibleprocesses,umsing line lermnamydiagram,isnot strictly valid for real reservoir fluids, umund tine dimngramin shotmid mint he smscd genermully ins Ihsedesignof realprocesses.Tine hmisic idea of multiplecontact miscibility throingim minassexelsangebetweenthe phases,and tire requirementof attaining the critiemsl corsipositiots.mmmc mill valid forrealsystems.However, theexistenceof ml large miummrmherof comnnpomncmslsinn ml real reservoirhluidprovidesmiddimiomnmml possibilities for comnmpositionmmilvmurialimmns,mind mms’liucviuig nnmiss’iinility. Inn tInefollowing discunssiomn,time unnisciblecotrditmoun us icferrcd In time. conidutmomu wlucis’ mumuscihilily cumunjust be unchieved,thuit is, at MMP. At liighrer prcssuurcs,tine niniscmhnlmty will ohviosnsly heachievable.
The nruultiple conlact miscibility, can be aclsieved ounly wlren the comrmposilmotnah pmuths goesthroughthe critical state. As tine critical compositiots,hencetine critical tie lime, for a ternarysystemat a given setof temperatureand pressureis uunique,tine miscibility is dclermunedonlyby thetwo limiting lie lines. When thecritical tie line coiimcideswills time linmiliung lie himme goinglhroughm the originuml oil counposilion.the nniscihulity us achsievedby line vapmansiungprocess.When the critical tic line coineideswitir tIne limnnihing tie line gommig lisrotigin 11mm’ injedhioms gmuscomposition,themiscibility is aelnievedby thecondcnsmmigprocess.
In a realsystem,it is possibletlmat neitherof thelimiting tie lines goestimrough tine critical point,hut miscibility still is achieved. This will occur if the fluid attains a critical state not at theleadingor the hailing edges,hut sonmewhierewithin the transutmomn zone. Sudsa possibilityexists for mixtures with morethan threecomponents. Indeedlire prevailmng nnnechsanismforachievingmiscibility in rich gasinjection is often, if not always, the above memmtuonedcaseandnot thecondensingmechanismdescribedfor a ternarysystem.
Tine injected rich gassines not generallycontain heavy fractiomrswhicis arcpresent in tIme oil.I lence,winihst tine injectionsgasenrichesthe oil iun light internnncdimmteramrgc. it strips tine ineavierfractions. The reservoir oil in contact with tIre fresin gums iuiimialiy bccouineslighter, but as itcontactsmoregasandlosesonly someof its lighterheavies,overall it tendsto get enricimed invery incavy fractionsandtirusbecomeslesssimilar to the unjectionguns. Figure7.5 shows thevarialion of measuredcompommentgroupsin theoil phaseat tire inn jedhion point for mu North Seaoil. As the oil is contactedwitln additional rids gas, the cotucentralion 1)1 (.‘,, is decreased,apparentlylightening the oil in its path towardsachieving tIme condensingmiiiscibility. Anexanninationof the heavy end, e.g. C25, , however, shows llsmnt Ilmis fractiomn Iras increasedmarkedlydueto vaporisationof thelighter heavies. This oil eamnmsotbecoumnemiscible with thefrcshn injection gas. The phaseenvelope,asdeterminredby mneasurimrg tine compositionsofequilibratedphrasesat theinjectionpoint andalsoattIme gasfront in a laboratorytest, is shownin Figure 7.6. Note tinat the bubble point and the dew point curves initially converge,demnonstratedby sisorteningtie line lengtirs, aumdthendiverge.
As the forward moving gas becomesricher in heavy fractiorns, it vaporisesless of thesecompoundswhilst losing intermediatesto theoil. It is conceivablethat at favourableconditionsthe combinedvaporisationlcondensationprocessresults in a statewithiur tine tramnsition zonewhere thecompositionalpathgoesthroughthecritical point, acisievingmiscibility. Thiscan beenvisagedasa combinationof thecondensingprocessat the front, and the vaporisingprocess
at time tail. Tisis proces~.cunllesh lIne eommden,si,ng/vapori.cinggasdrive, wasreportedby Zick El)in 1986,anddetailedby Stalkimpin 1987 E21.
50
40
30
0
20
I0
0 2 4 5 5 10
Vol. Gas/Vol. Oil
Figure 7.5. Varimstioni of componentgrouupsin comntactedoil at injection point wills tine ratio ofinjectedguts volumme to contactedoil volcunne.
50 40 30 20 10
L
Figure 7.6. Phrasedimmgrmtnnof a Nortim Seaoil andrids injection gasdeterminedexperimentally
duringcomntactexperimnnent.
‘line mnnulhiplccontmndt unmiscihility inn nssumlticonssponenlsystetmssis mncimieved in a dynamicprocess,tmence. it can be affected by olhcr factors additional to the fluid phasebeimaviour. ThecoumnpositionalpaIls dependsour other mechanismssuch as multiphase fluid convection anddispersioninn porousunedia. Tine two limiting critical tie lines, that is, thosewith extensionsgoinrg timroughthre original oil and the injection gas,dependonly on theoriginal fluids. I-hence,time nniscihilily conditionscan be deternminedby phasebehaviourconsiderationsonly, if thenimiscihihity is achievedby either vaporisimngor condensinggasdrive mechanisms,Otherwise,thecritical lie line, hscncemniscihilily, dependson tine local fluid mixturecompositioninfluenced
--5 . Lighu
Flea~y
---- -- 0
nnIc,,nctniamc
(71),
50
60
20
70
inj gas
80
90
260 7. Gas !?ujec:ion 7.2. E.uperinuentol Studies 261
by flow factors. Therefore,a proper investigationof themultiple contactmrmiscibihty shouldinvolve thesimulation of fluid phaseandflow behaviouras closelyas possibleto that in thereservoir.
Thereare ample publicationson mathematicalsimulation of multiple contact immiscibility asdevelopedin aonedimensionalflow, Tire reportsby Orr andco-workers13-71. tmtilisimng mmanalytical method to solve the governing phase and flow behavioureqsmations with nodispersion,for a four componentsystem provide valuable insigint into tine rmrechanisnmsofmultiple contact miscibility. The authors demonstrate that tine displacememsh in amulticomponentsystem,can beexpressedby aseriesof pseudo-ternarydiagrams,wherethecompositionalpathprogressivelymovesfromeachdiagramto thenext. Wisemstine two phasesof vapourand liquid at equilibrium are present,the transfer from one tcrnmury diumgrummnm to timenext mustoccurat acommontie line betweentine two diagrams,calledthe crossover tie line.Thenumberof thepseudo-ternarydiagramsincreaseswith the numberof crmnponents,witlnthe numberof crossover tie lines equal to the numberof consponentsmmniumsms 1111cc. Forexample,whilst thecompositionalpath in a four componentsystemsmcamn be depictedby twoternarydiagrams, with a conmmon cross over tie line, there arc two cross over tic linesconnectingthree pseudo-ternarydiagramsin a five componentsystems. Dependingon thefluid composition,pressureandtemperature,any of the crossovertie lines or tine limiting tielinescanbecomethecritical tie line. Themiscibility is thenachievedat thatpoint.
Consideringtheabove,theestimationof miscibility conditionsbasedon the liunmiling tic lines isnot generally adequatefor real systems. When tire process is known definitely to bevaporising, such as methane displacing an oil composed only of hydrocarbons. Ihe oil tie linecan be usedto detenninethemiscibility condition. The estimationof miscibility in rids gutsdrive, using theinjectiongastie line, is expectedto be unreliablein most cases,if Isot in all.When the key tie line which controls the miscibility is one of time cross over tie lines, theestimationof miscibility conditionsis not asstraight forward, Even if the key tie line cams bedeterminedfor a dispersionfree, onedimensionalflow, as suggestedby Johns etai. [6], itmay not representthereal process. It hasbeendemonstratedthat dispersion,viscous fingeringandgravity segregationcan impair theachievementof miscibility, causing two pimaseflow inreservoirsin which they wouldbemiscibleotherwise[8,9].
7.2 EXPERIMENTAL STUDIES
Gas injection experimentsare conductedwith several objectives. Most tests have beendesignedto directly measurethe minimum miscibility pressureor enrichment. Testsare alsoconductedto generatevolumetric and compositionaldata for specific studies, such as oilvaporisationby gas injection, or evaluation and tuning of phase behaviour models fornumericalsimulationof thereservoirperformance.
Displacementof oil by gasthrougha porousmediumsi,simulatestime gas injection processmoreclosely than other tests, and it is consideredas the definitive test. The displacementisconductedeither in a core,extractedfrom the reservoir,or moreoften in a long and narrowsandpack,known asthe slim tube, Static tests, where theinjection gasand time reservoiroilare equilibratedin a cell, are also conductedto determine tlne mixture pinumse behaviour.Although thesetestsdo notcloselysimulatethe dynamicreservoirconditions,tisey do provideaccurateandwell controlleddatawhicharequite valuuihle,partieulummiy for ttmnimrg tine equumtionof stateusedin modellingtheprocess.
Slim Tube
Slim tube,a onedimensionalnnodel reservoir, is mm nmnrrow tube packed witin smnnd, or glassbeads,with a lengthbetween5 and 40 m. A schematicdiagram of tine tube aurd tine auxiliaryequipmentto allowdisplacementtests,is shownin Figure7.7.
The tube is initially saturatedwith the oil at reservoir temperatureabove the bubble poimstpressure. Theoil is then displacedby injecting gas into the tubeat a constantinlet, or moreoftenoutlet, pressurecontrolledby a hack pressureregulator. The pressuredrop acrosstheslim tubeis generallysmall, tlrerefore,theentire displacementprocessis consideredto be at asinglecomnstantpressure. The shun tubeeffluent is flashed at the atmosphericconditions,andtime rmnte of recovery,densityandcommlposilionof producedfluids are measured.Thegasbreakthrough is detectedby comitinuously monitoring the effluent gas composition, and/or theproducinggasto oil ratio.
Themiscibility conditionsaredeterminedby conductingthedisplacementat variouspressures.(Sr injectiongasenriclnuncurllevcls. andmonitoringline oil recovery. This canalsobeaided byvisumul observatiomi of tIne how throughasightglassplacedat thetubeoutlet, The aclsievemmnenlof miscibility is expectedto accomimpanya gradualclsangeof colourof (Ire flowing fluid frontsthat of the oil to clear gas. Whereas, observing two phase flow is indicative of an immiscibledisplmnceuncnt.
Figure7.7. Schen’mmmtiediagramstof slim tube apparatus.
Slum tubes of differcmnt sizes mumnd orientatiomms have been used at various displacementconditioums. Tine effect of tube geometryand flow paranneterson fluid recoveryhas beensystensaticahlyinvestigated[10]. An ideal tubeshould provide a one dimensionaldispersionfreedispluicemeirtof oil by gas. This is not to suggesttimat such a displacementsinnulatestineprocessin a realreservoir. It is nmrerely a well controlled experiment,with valuable resultsforphaseheimaviourstudiesimncludimrg miscibility evaluation. The actumaldisplacementin a reservoiris influemrced by variouns nmechaunisrns,such as viscous fingering, gravity over ride ausddispersion. Reservoirhetcrogeuseity,at differentscales,strongly divert time flow and affect therecovery. As it is imnnpo.ssibleto sinnulateall theseinter-relatedtmrechanisnmsin a slim tube,oreven us a core, it is logical to avoid them all in plnasebehaviourtests. l’hese factors, allimmrportanmtto thesuccessof a gasinjection schenme,could then be studied in otlmer experimentsandumsingcompositional simulators.
Probably tIne simmmplcst test usinig a slim tube, is determinationof time nsiscihihity comsditiotss.Altsmostammy shinstube, regardlessof thedesign, can be usedIn estimatethe effect of pressure
Pump
Guts Meter
Back Press.Regulator
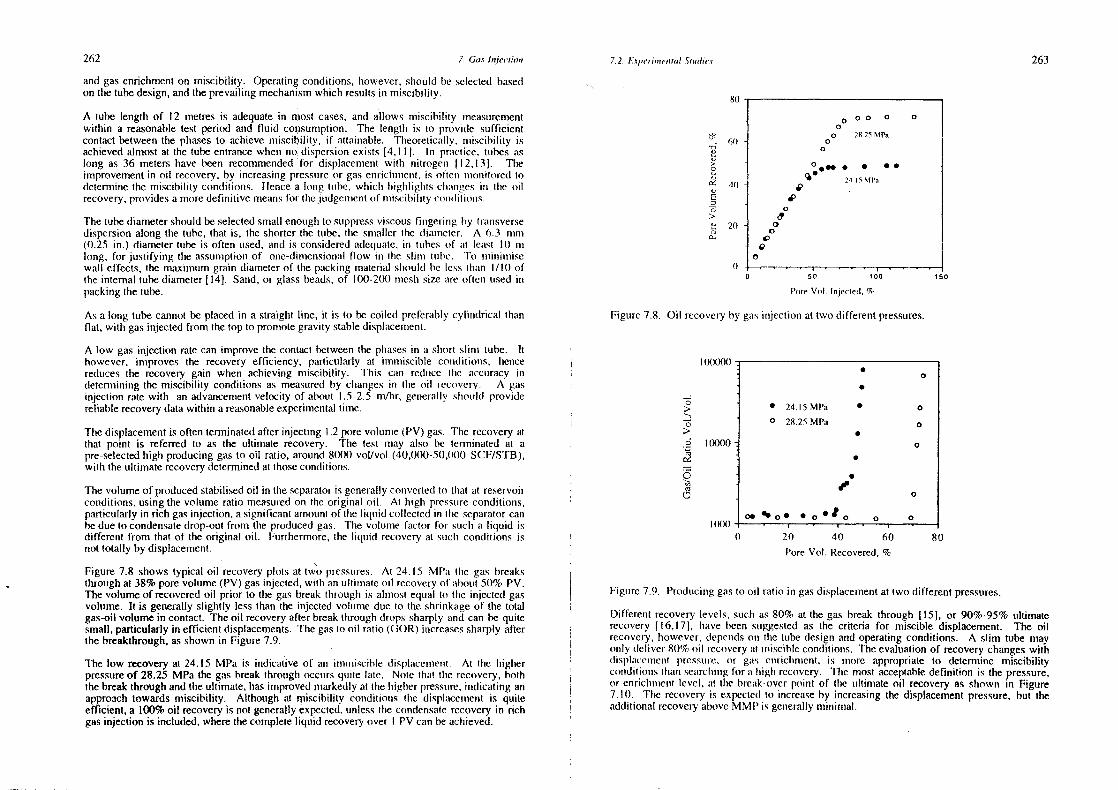
262 7. Ga.c Iiujeeimoiu 7.2. Kmpe,’inue,mtaIStm,dies 263
andgasenrichmenton miscibility. Operatingconditions,however,should beselectedbasedon thetubedesign,andtheprevailingmechanistsiwhich resultsin miscibility.
A tube length of 12 metresis adequatein most cases, andallows miscibility mireasurementwithin a reasonabletest period and fluid consumption. The length is to provide sufficientcontactbetweenthe phasesto achievemiscibility, if ustluninable, Thneorelicunhly.nniscihility isachievedalmost at the tubeentrancewhets iso dispersionexists [4,111. Its practice, tubesaslong as 36 metershavebeen recommendedfor displacementwith nitrogens 112.13). Theimprovementin oil recovery,by increasingpressureor gas enrichnunsent,is ofteni nmnonsitoredtodeterminethe miscibility conditions. ilence a long ttmhc, whiclu Inigimlighnts cinmnnmges inn line oilrecovery,providesa moredefinitive meansfor tine jlmdgemimenl (nf msmmscihrilily conimliliomns.
The tubediametershould beselectedsmallenotughto suppressviscousfingerimig by traumsversedispersionalong the tube, that is, the shorterthe tube, tire snmaller time diaur’seter. A 6.3 tnmm(0.25 in.) diametertube is often used,and is consideredadequate.inn ltmhes of mml lemmsl 10 mrslong, for justifying time assumptionof onc-diunrensionalflow iii lIne shiunm ttmhc. To usmimniunnisewail effects, themnazimum grain diameterof time pmickung material shrouldhe lesstinmiti I/It) oftheinternal tubediameler[14). Sand,or glass heads,of 100-200nneshnsize mire oftenusedinpackingthetube.
As a long tubecannotbe placedin a straiglnt line, it is in be coiled preferablycyliundrical thanflat, with gasinjected from thetop to promotegravity stabledisplacement.
A low gasinjection ratecan improvethecontact betweenthe phasesin a short shiumn tube. ithowever, improves the recovery efficiency, particularly at imumsiscible commditions, imencereducesthe recoverygain when achieving miscibility. This cats reduce line accuracy indetenisiningthe miscibility conditions as measuredby chammges in the oil recovery. A gasinjection ratewith an advancensentvelocity of ahotut 1.5-2.5 muir, getserally shtoumld providereliablerecoverydatawithin areasonableexperimentaltumne.
Thedisplacementis often terminatedafter injecting 1.2porevolume(PV) gas. Time recoveryatthat point is referred to as the ultimate recovery. Tire test nmay also be terminated at apre-selectedhigh producinggasto oil ratio, around8000 vol/vol (40,000-50,000SCF/STB),with theultimaterecoverydeterminedat thoseconditions.
Thevolumeof producedstabilisedoil in theseparatorms generallyconvertedto that at reservoirconditions,usingthe volumeratio measuredon theoriginal oil. Al high pressureconditions,particularlyin rich gasinjection, asignificantainosuntof lIme liquid collectedin time separatorcanbe dueto condensatedrop-outfrousm the producedgas. The volunsre fumctor for sudsa liquid isdifferentfrom thatof theoriginal oil. Furthermore,the liquid recoveryat suds conmditions isnot totally by displaceunent.
Figure 7.8 shows typical oil recovery plots at two pressuires. At 24. 15 MPmm line gas breaksthroughat 38%porevolume (PV) gasinjected,with an ultitnateoil recoveryof about50% PV.Thevolumeof recoveredoil prior to thegasbreakthrough is almost equal to time injected gasvolume. It is generallyslightly less thantire injected volume due to the shrinkageof thetotalgas-oilvolume in contact. Theoil recoveryafterbreakthroughdropssharplyandcan he quitesmall,particularlyin efficient displacements.Tinegas to oil ratio (CUR) increasessharplyafterthebreakthrough,as shownin Figure 7.9.
The low recoveryat 24.15 MPa is indicmntive of aim immmniniscihle displacemnmerrt. At tire Inigherpressureof 28.25 MPa thegasbreakthroughoccursqumile late. Note thmnt thie recovery,boththebreakthroughandtheultimate, lsas improvednrarkedhyat tine iniginerpressure,indicating anapproachtowards miscibility. Although at miscibility conditionns tIme displmiccunent is quiteefficient,a 100%oil recoveryis not generallyexpected,unlessthecondensaterecoveryin richgasinjection is included,wherethecompleteliqmnmd recoveryover I PV canbe achieved.
0
;2.
0
>0
0
0
Figure7.9. Producinggasto oil ratio in gasdisplacementat two differentpressures.
Differeust recoverylevels, suchas80% at the gasbreakthrough [15], or 90%-95%ultimaterecovery [16,171, lnave beensuggestedas the criteria for miscible displacement. The oilrecovery, however, depemids our tIne lube design and operating conditions. A slim tube mayounly deliver 80% oil n’ecovery unt msii.scihle conditions. The evaluation of recovery changes withdnslmlmnceulmennt prcssunu’e. or gums cnmriclnmmncnt, is nimore appropriate to determine miscibilitycondihioums tlmunnm seumrcimimngfor a lmighn recovery. TIme rumost acceptabledefinition is tire pressure,or enrichmntnemshlevel, mnt tine bremnk over poiust of the uuhlinnateoil recoveryas sinown in Figure7.10. Tlme recovemyis expectedto imrcreaseby increasingthe displacementpressure,hut theadditionalrecovemyaboveMMI’ is gemmerallynsininmal.
80
(ill
4(1
20
~0
0
E0
0>
050.
000 0 00
0 2S2SMPa0
0
0.••• S •S
S~ ~.1mSMu’~‘I
‘S
05~
0U
‘30
0
50 iOO n50
PoreVol. lnjecmed. %
Figure 7.8. Oil recovery by gums iunjedtion at two different pressures.
I )J)~5flfl~
10000
001)
0
• 24.15 Ml’a S 0
0 28.25 MPa 0
.0
S
•‘F
0
0•~O• •0•’O 0 0
0 20 40 60 80PoreVol. Recovered,%
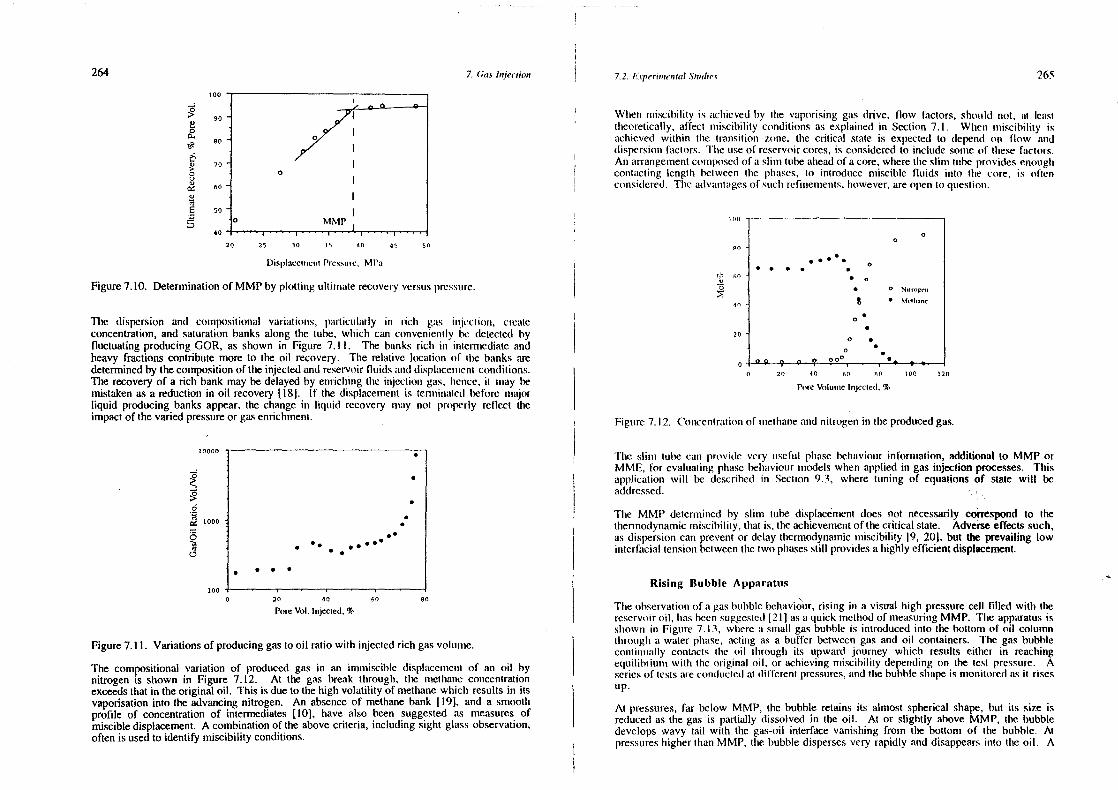
Figure7.10. Determinationof MMP by plotliimg ultimate recoveryversuspressure.
The dispersion and compositional vamimttiomns, particularly un micin gums iumjectiomm, createconcentration,and saturationbanksalong the tube, wInch can conveniently be detecledbyfluctuatingproducingGOR, as shown in Figure 7.11. The banksrich in immterrnediateandheavy fractionscontribute more to the oil recovery. The relative location of tire banksaredeterminedby thecomposition of theinjectedandreservoirfluid.s mind di.splmncemmsentconditions.line recoveryof a rich bank maybedelayedby enriclmimmg tine immjectiomn gas, isemncc, it mmnay bemistakenasa reduction in oil recovery[181. If Ihe displacememstus tentnimnunled before majorliquid producingbanksappear,thechangein liquid recovery ninuny not properly reflect theimpactof thevariedpressureorgasenrichment.
1000 20 40 60 80
Pore Vol. Injecled,%
Figure7.11. Variationsof producinggasto oil ratio with injectedrichgasvolunse.
The compositional variation of producedgas in an inmmssiscible dispimtceumscmslof an oil bynitrogen is shown in Figure 7.12. At the gas break througis, the msmethammecomncentrationexceedsthat in theoriginal oil. This is due to the high volatility of methane which results in itsvaporisationinto the advancingnitrogen. An absenceof methanebank [19], and a smoothprofile of concentrationof intermediates[hO], have also been suggestedas measuresofmiscibledisplacement.A combinationof theabovecriteria, including sight glassobservation,often is usedto identify miscibility conditions.
Wireur ussiscnhuhity is umchnueved by time vaporising gums dnive, flow factors, should not. al leasttheoretically,affect tmniscihihity conditionsas explainedin Section 7. 1. Whems msmiscihihity isachievedwithin lIre transition zone, the critical stale is expectedto depend on flow anddispersiounfactors. ‘I’lme useof reservoircores,is consideredto include sonseof tinesefactors.An arramngemenlcomnsposedof mm slim tubeaheadof a core,wheretIme slim tube providesenoughcolmtuncting lenglin between tine pimases,to introduce miscible fluids into the core, is oftencounsidered.TIne advmmntuugesof sudsrefinensenmls,however,areopento questions.
09 ~7 •
Figrure 7.12. Conceustruntion of ummetimaneansd nitrogenin theproducedgas.
Tine sums tube cmtul provide very useful pimase heinaviour infortnnation, additional to MMPorMME, for evaluatingpinumsebelsaviourmodelswhen applied in gas injection processes.Thismnpplieatiomn will be described in Section 9.3, where tuning of equationsof state will beaddressed.
The MMP detemuinedby shun tube displacenrentdoes not necessarilycorrespondto thethermodynamicmiscibility, that is, theachievemeuntof thecritical state. Adverseeffects such,as dispersioncan preventor delaythermodynamicmsniscibilmty [9, 20], but the prevailing lowinterfuicial tensionbetweemrthetwo plnasesstill providesa lsighnly efficientdisplacement.
Rising Bubble Apparatus
Tire observationof a gasbubblehchavk~ur,rising in a visual high pressurecell filled with thereservoiroil, lnmns heeumsuggested1211 asa quick mimethodof measuringMMP. The apparatusissimowmm in Figure 7. 13, svlncre mm smimahl gasbubbleis introducedinto time bottom of oil columnthrotugis a waterpinumse, actingas a buffer betweengas and oil containers. The gasbubblecoistimmuumlly comstacts tire oil tlsrougis its upward journey which results either in reachingequilihriummmm wills tine original oil, or achieving nsiscihility dependingon the lest pressure. Aseriesof testsareconductedam dilTerenmtpressures,unnd tine bubblesimapeis nnotnitomedmis it risesup.
At pressures,far below MMP, the bubbleretains its almost sphericalshape,but its size isreducedasthegas is partially dissolved in the oil. At or slightly aboveMMP, the bubbledevelopswavy tail with tine gas-oil interfacevanishing from the bottom of the bubble. Atpressureshighertinan MMP, the bubbledispersesvery rapidly anddisappearsimmto tine oil. A
264 7. Gas Injeciio,m
0)
I)>0UC)
C)‘C
5
108
90
80
•10
60
50
40
0 MMP1
7.2. Fnperinuenuta! Stnudues 265
20 25 30 35 40 45 50
1)isplaccnuncnnPressure.MPmu
too
00
Os0
40
20
00
0
• • S S S
• 0
• 0 N•trogt’n
S0
S
0 5S
0
), oo° •
10000
1000
0Cl
0
0
0 25 40 60 00 00 120
PoreVolunuic lunjecmcd.%
S
•
••
‘S
• •• •
S S S
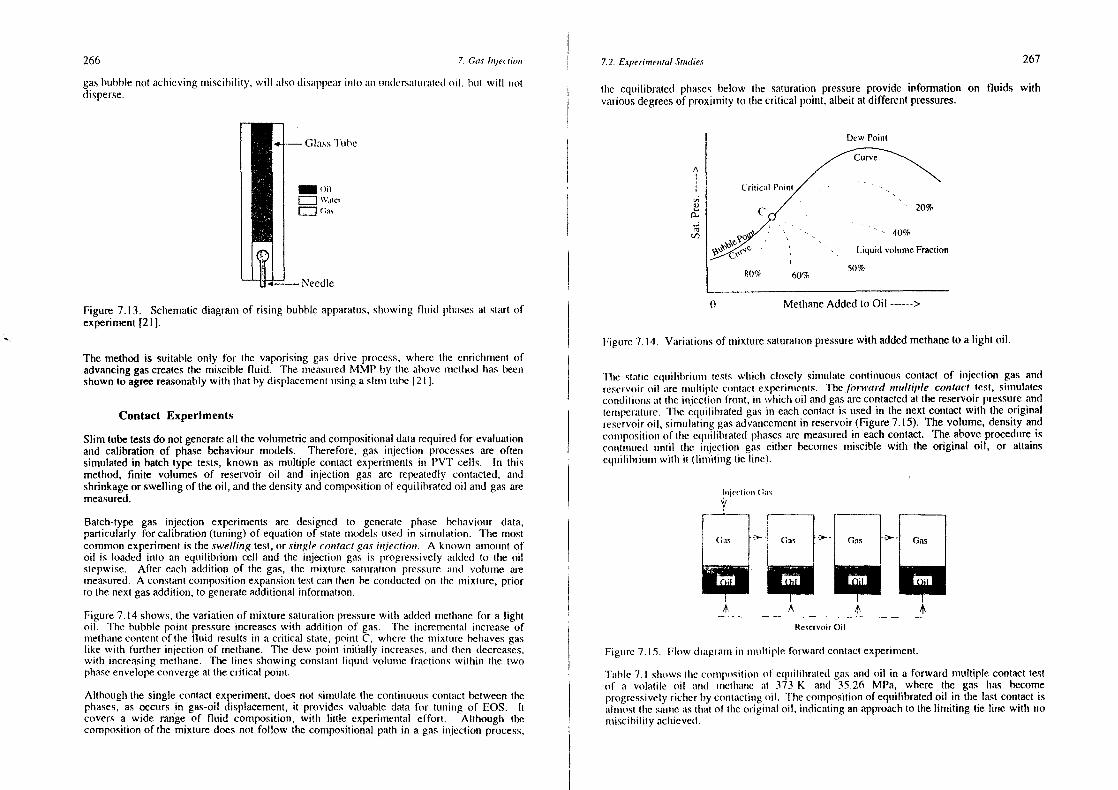
266 7. Gas InjeCtion 7.2. Experi~neiutalStudie,s 267
gas htmhhle not achieving nmiscibility, will also disappearinto ami unmdcrsunturatedoil. html will uiotdisperse.
Needle
Figure 7.13, Schematicdiagraumsof rising buhbl~apparatus,slmowmng humid pirumses at startofexperiment[211.
tire equilibrated plrumses below tine saturationpressureprovide information on fluids withvariousdegreesof proximity to time critical point, albeit at different pressures.
A
C)
‘CIf)
Dew Point
Liquid volummnieFraction
MetlmaneAddedto Oil >
Figure 7.14. Variations of nmixture saturation pressure with added methane to a light oil.
The method is suitable only for the vaporising gas drive process, where time enricimumnent ofadvancinggascreatestine miscible fluid. The measuredMMPby the above mnnetbmod has beenshownto agreereasonablywilln tlmat by displacementusinga slimin tumhe 1211.
ContactExperiments
Slim tubetestsdo not generateall thevolumetricandcompositionaldatarequiredfor evaluationand calibration of phasebehaviourmodels. Therefore, gas immjeetion processesare oftensimulatedin batch type tests, known as multiple contactexperiunentsin PVT cells. In thismethod, finite volumes of reservoir oil and injection gas are repeatedly contacted,andshrinkageorswellingof theoil, andtine densityandcompositionof equilibratedoil and gasaremeasured.
Batch-type gas injection experiments are designed to generate phase heinaviour data,particularly for calibration(tuning)of equationof stalemodels usedin sitnulalion. The mostcommonexperimentis theswelliougtest,or singlecontactgasinjection. A knnown aunrountofoil is loadedinto atm equnilibriuns cell and the injection gas is progressivelyadded to the oilstepwise. After eachaddition of the gas, time mnixture saturationpressuremmmd volume aremeasured.A constantcompositionexpansiontest can then be conductedon lIne mmsixtuire, priorto thenextgasaddition,to generateadditional infornmation.
Figure7.14 shows,thevariationof mixturesaturationpressurewith addedmethanefor a lightoil. The bubblepoint pressureincreaseswith addition of gas. The incrementalincreaseofmethatiecontentof tire fluid resultsin a critical state,point C, wiseretime nnixtume heisavesgaslike with furtimer injection of methane. Tire dew poimmt initially increases,and lInen decreases.witim increasingmetlnane. Tine lures showing constumnt liquid volumumie frmsctiouns witlsinm tire twophaseenvelopeconvergeat time critical poinsl.
Allhoingh the singlecontactexperiment,doesnot simulate lire commtinuouscontuictbetweenthephases,as occurs in gas-oil displacement,it provides valuabledurta for tuning of EOS. Itcovers a wide range of fluid composition, witim little experimmmetstal effort. Although thecompositionof the mixture doesnot follow the compositionalpath in a gas injection process,
‘Ilme static cquililrrituumr tests which closely sinruulate contimmuous contact of injection gas andreservoir oil arennnuuhtiplc commtuncl expcrinmncnts. The forward multiple contact lest, simuiatesconditiouns tnt time its jection frommt, inn wlmicim oil and gas are contacted at the reservoir pressure andtemmnpermuture. Time equmilibrated gums in each contact is used in the next contact with the originalreservoir oil, simulating gas advancement in reservoir (Figure 7.15). The volume, density andcommnpositiomsof tIne equtilibratedplnasesare measuredin eachconlact. Theaboveprocedrmreisconliuttued until Ilne injections guns citimer beconresimmiscible with the original oil, or attainsequmi I ihriummn witim it (Ii mnitiusg tie I muse).
‘Fumble 7. I shnows lIne constpositiomm of equilibratedguns mmmd oil in a forward mumltiple contact testof mu volatile oil unnd umnetisumnuc tnt 373 K and 35.26 MPa, where the gas has becomeprogressivelyricherby contunctimigoil. Time counspositionof equilibratedoil in the last contact isunimnuosl lime sumumieasthratof tine originimul oil. indicating anapproachto thelimiting tie line with nonmsiscihility adlmicvedl.
— OilcjEJ (~~
0
20%
- ~ 40%
80% 60%50%
0
Liujecti~nu( ;.ts
y
4’ 4’
ReservoirOil
Figuire 7.15. Flow diagrammsmm usnunltipleforward contactexperinment.
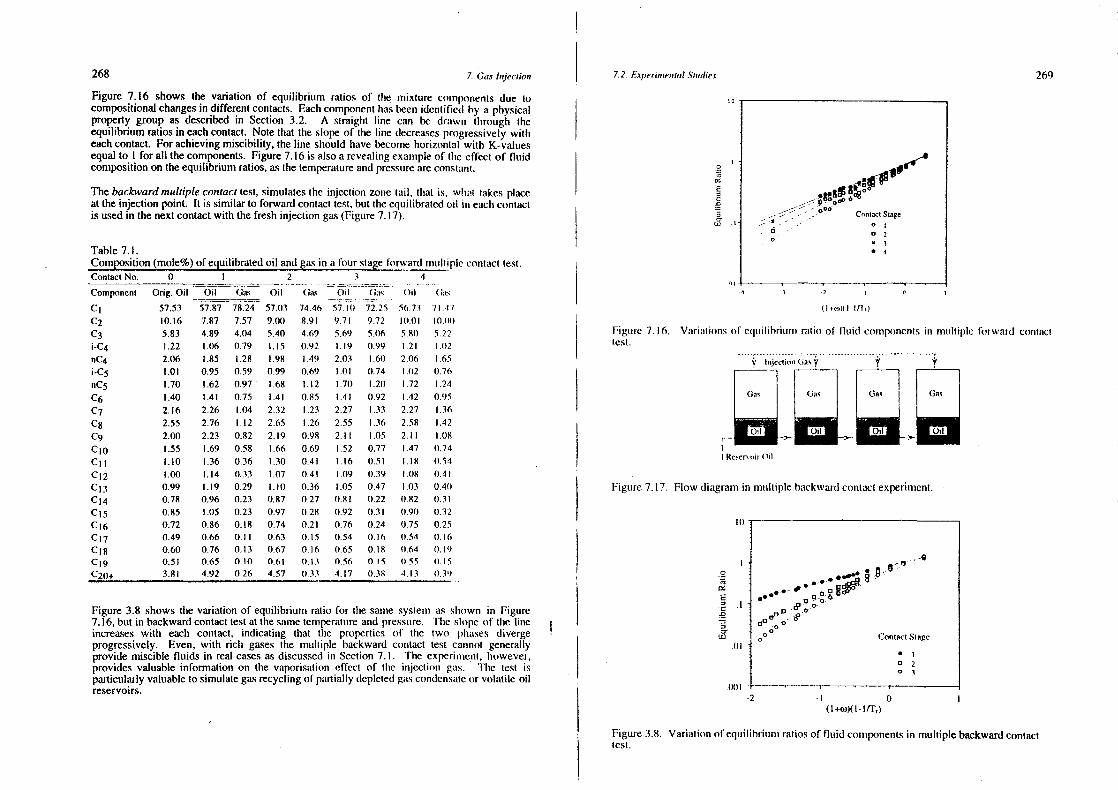
268 7. Gas lnjectiouu
Figure 7.16 shows the variation of equilibrium ratios of the mixture counpommentsdue tocompositionalchangesin differentcontacts. Eachcomponenthasbeenidentified by a plsysicalproperty group as describedin Section 3.2. A straight line can be drmmwmn through theequilibriumratiosin eachcontact. Notethat the slopeof tine line decreasesprogressivelywitheachcontact. Forachievingmiscibility, theline shouldisave becomehorizontal with K-valuesequal to I for all thecomponents.Figure7.16is alsoa revealingexampleof lime effect of fluidcompositionon theequilibrium ratios,asthetemperatureandpressureareconstunnl.
Thebackwardmultiple contacttest, simulatesthe injection zone tmiil, timat is. what lunkes placeattheinjection point. It is similar to forward contacttest,but theequilibratedoii un eachcontactis usedin thenextcontactwith thefreshinjection gas(Figure7.17).
Table7.1.Composition(mole%)of equilibratedoil andgasin a four stageforward nmumltiplecontacttest.ContactNo. 0 2
Orig. Oil Oil (las Oil
57.53 57.87 78.24 57.1)310.16 7.87 7.57 9.005.83 4.89 4.04 5.401.22 1.06 0.79 1.15
2.06 1.85 1.28 1.98
1.01 0.95 0.59 0.99
1.70 1.62 0.97 1.68
1.40 1.41 0.75 1.412.16 2.26 1.04 2.322.55 2.76 1.12 2.652.00 2.23 0.82 2.191.55 1.69 0.58 1.661.10 1.36 0.36 1.301.00 1.14 0.33 1.07
0.99 1.19 0.29 1.100.78 0.96 0.23 0.870.85 1.05 0.23 0.970.72 0.86 0.18 0.740.49 0.66 0.11 0.630.60 0.76 0.13 0.670.5! 0.65 010 0.613.81 4.92 (1,26 4.57
3 4
Gas Out ~ Oil (;us
74.46 57 II) 72.25 56.73 71.41
8.91 9.71 9.72 10.01 10.1)1)
4.69 5.69 5.06 5.81) 5.220.92 1.19 0.99 121 1.1)2
.49 2.03 1.61) 2.06 1.650.69 1.01 0.74 1.02 0.76
1.12 1.71) 1.20 .72 1.240.85 1.41 0.92 1.42 0.951.23 2.27 1.33 2.27 1.36
1.26 2.55 1.36 2.58 1.420.98 2. II I .1)5 2. II I .080.69 1.52 0.77 1.47 0.740.41 1.16 0.51 1.18 (1.540.41 1.09 0.39 1.08 (1.410.36 I .05 0.47 I .1)3 (1.41)0.27 (1.8! 0.22 0.82 (1.31(1.28 11.92 t).3 I (1.91) 0.32
0.21 0.76 0.24 0.75 (1.250.15 (1.54 0.16 0.54 (1160. 16 0.65 0. 18 t).64 0. 190.13 t).56 0.15 1)55 0.15(1.33 4.17 0.38 4.13 (1.39
Figure 3.8 shows the variationof equilibrium ratio for the samesysleunas shown in Figure7.16, but in backwardcontacttestatthesametemperatureand pressuure. Time slopeof tire lineincreaseswith each contact, indicating that tire properties of time Iwo pirases divergeprogressively. Even, with rich gases the multiple backwardcountact test canisol generallyprovide miscible fluids in realcasesasdiscussedin Section7.1. The experimlmemmt,however,provides valuable infomsalion on the vaporisationeffect of tIme iusjcctioms guns. Tine test isparticularlyvaluableto simulategasrecyclingof putm’tially depletedguts commdensamcor volmmtile oilreservoirs.
7.2. F.uperiennetntalSluu!ie,u
10
0
aC.0
0’1)2
269
01 .
4 4 -2 1 0 1
I I ou)( I — ITt)
Figure 7.16. Variuutionsof eqnnilihriuunm rumtio of fluid counponenlsin mntmlliple forward contacttest,
~l munjccniot (,as ‘j’
~Oas~ ~j ~Gas
r Oil Oil th1
I Reservoir(SI
Figure7.17. Flow diutgramin mnnultiplebackwardcomnlactexperinreni.
In
I ••“~‘~
ujO 00
ContacuSnage.0!
St
0203
1)1)! .
-2 -l 0(I+om)( I— tf’F~)
__.,0o~, 0000- 000- - ,.. C,,ntacn Stage
em0_- 02
0 03
.4
Component
C1C2
C3i-C4nC4i.C5nC5C6C~CgC9C’
0CjC12
C1
4
Cl6CuCl
8Ci9C20+ 0
0
.0
00~
U.)
Figure3.8. Variation of equihihriuimnratiosof fluid conmponentsin multiplebackwardcontacttest.
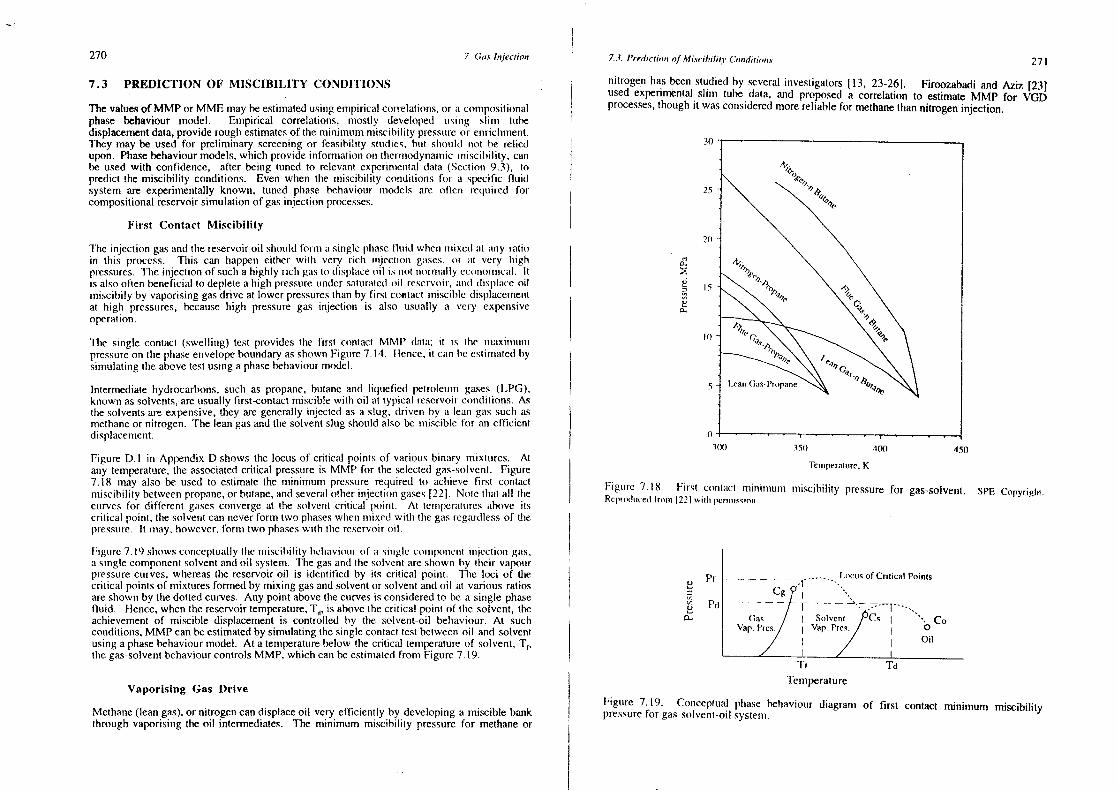
270 7. Gast,ujectuon 7..). I’redjction of Mi.ceibility Co’udizjoins271
7.3 PREDICTION OF MISCIBILITY CONDITIONS
Thevaluesof MMP or MME maybeestimatedusingempiricalcorrelations,or us compositionalphase behaviour model. Empirical correlations, mostly developed uusimrg simm lubedisplacementdata,providerouglm estimatesof the nsinimumuniscuhihitypu’essumreor enriclnnsent.Theymay beused for preliminary screeningor feasihilnty sludies, html sinotild not he reliedupon. Phasebehaviourmodels,which provideinformalionon tlrertnrodynaunicnsiiscibility, canbe used with confidence, after being tunedto relevantexperinnentaldumla (Section 9.3), 10predict the miscibility conditions. Even when the miscibility conditiotmsfor a specific fluidsystem are experimentally known, tuned phase behaviourmodels are often required forcompositionalreservoirsimulationof gasinjection processes.
First Contact Miscibility
The injection gasandthereservoiroil should fou’ttsa singlepluaseflunid whets mmnixe(l mit tiny ratioin this process. This can happen eitimer wills very rich injections guIses, or UI very Inighpressures.The injection of sudsa highly rich gasto displutceoil is not mnornmnuullyccononnnical. Itis alsooftenbeneficialto depletea Imigir pressureunder saturatedoil reservoir, mmd displmmce oilmiscibily by vaporisinggasdrive at lower pressuresthaum by first co.mtact miscibledisplacemenmtat high pressures,becausehigh pressuregas injection is also usually a very expensiveoperation.
Tire singlecontact (swelling) test provides time first contact MMF’ data: it us time umnuixiummununpressureon thephaseenvelopeboundaryasshownFigure7.14. Hence,it canhe cslimsnatcdbysimulatingtheabovetestusing aphasebehaviourmodel.
Intermediatehydrocarbons,such as propane,butaneand luquefied pelroleuunn gases(LPG).known assolvents,areusually first-contactmisciblewitlm oil at typIcal reservoireondilions. Astime solventsareexpensive,they aregenerallyinjected asa slug, driven by un lean gassuchasmethaneornitrogen. The leangasandthesolventslug shouldalsobe miscible for an efficientdisplacement.
FigureD. 1 in Appendix Dshows the locusof critical points of various binumry mixtures. Atany temperature,the associatedcritical pressureis MMP for the selectedgas-solvent. Figure7.18 may alsobe used to estimatethe minimum pressurerequired to achieve first contactnmiscihility betweenpropane,orbutane,andseveralotherinjection gases122j. Note tlsat all thecurvesfor different gasescoumvergeat time solvent critical poitnt. At tenipcrulllmresabove itscritical point, thesolveuntcanneverfortn two pisaseswlren ussixedwitis thegasregardlessof thepressmre.It unlay, however,fornnm Iwo plmaseswith tIne reservouroil.
Figuire7. 19 slsowscounceptunallylIne mmmiscilmility heimunviomnr of mu simnglc counmlxnuscuil immjectiomm guns,a singlecomponentsolventandoil system. Thegasandthesolveust msresimosvn by tiseir vapourpressurecurves,whereasthereservoiroil is identified by its critical point. ‘lire loci of thecritical pointsof mixturesformedby mixinggasandsolvent orsolventand oil at various ratiosareshownby thedottedcurves. Any point abovethecurvesis consideredto he a single phasefluid. Hence,whentime reservoirtemperature,Td, isabovethe critical pointof tIre solvent, theachievementof miscible displacementis controlled hy the solvent-oil belmaviour. At suchconditions,M~MPcanbeestimatedby simulatingthesinglecontacttestbetweenoil and solventusinga pisasebehaviourmodel. At a temperatuirebelow the critical temperatureof solvent, T
1,
thegas-solventbehaviourcontrolsMMP, which can be estinmatedfronm Figure7.19.
Vaporising Gas Drive
30
25
20
Is
I))
nitrogenhasbeen studied by several investigators(13, 23-26]. Firoozabadiand Aziz [23Jused experimentalshun tube data, and proposed a correlation to estimateMMP for VGDprocesses,thoughit wasconsideredmorereliablefor methanethannitrogeninjection.
0
Fmgure7. 18. First contact nmmmnintntjm immiscibility pressurefor gas-solvent.SPF.Copyrigtnt.Reproducedlromn 1221 wiltm rcrniniscioui
0
0)
0~
3(11)
Pt
Ri
— --- ---- — — ~ Locus ofCrimicat Poinls
~ ~Ti Td
Tensperature
Fugture 7.19. Connceptuuml phasebelsaviour diagranr of first contact minimum miscibilitypressurefor gas-solvent-oilsysteusm.
350 400
Teunmperatmurc,K450
Methane(leangas).or nitrogencandisplaceoil very efficiently by developinga misciblebankthroughvaporisingtheoil intermediates. The minimum miscibility pressurefor methaneor
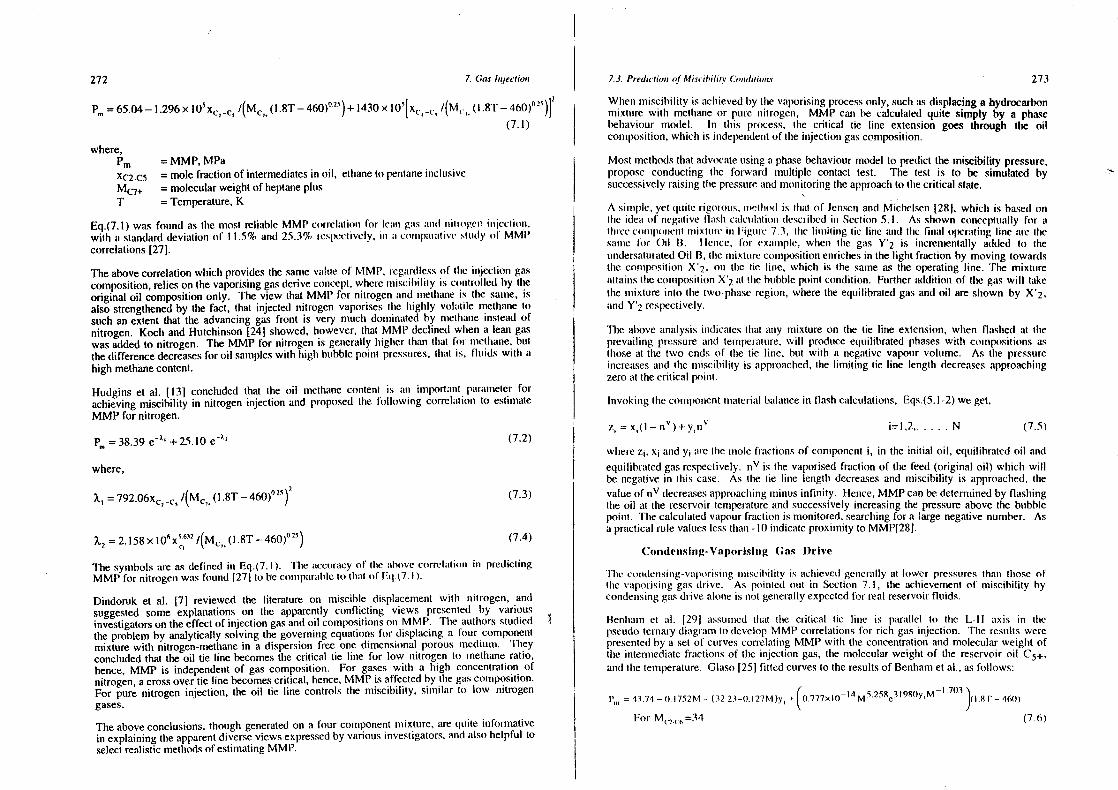
272 7. GasInjec(iouu
1mm 65.o4—I.296x lO5
Xe c I(Me,,(l.8T_460)023)+l430x l0~[x(.4~,I(M<., (l.8T_46O)~25)]
(7.1)
= MMP, MPa= mole fractionof intermediatesin oil, ethaneto pentaneincluusmve= molecularweightof heptaneplus= Temperature,K
Eq.(7.I) was foundas tIme most reliable MMP correluutioum for lcuunn guns ulnnd nnmlnmngcmm iunjcciiots,with a standarddevimmtion of 11.5% mind 25.3% respectively,mum a commnpumnmilivc sttm(ly oi MMI’correlations[27].
Theabovecorrelationwlmich providesthesamevunltue of MMP, rcguurdlcssof tine imnjcction gascomposition,relieson thevaporisinggasderivecomncepl,where mmsiscibility is coinlrolied by tineoriginal oil compositiononly. The view that MMP for nitrogenand mnnetlnaiseis tine same,isalsostrengthenedby the fact, that injected nitrogen vaporisestine Imigimly voluitile metinanetosuchan extent that the advancinggasfront is very nnuch dominatedby msretlsane inslead ofnitrogen. Koch andHutchinson[24] showed,however,that MMP declinedwlsena lean gaswasaddedto nitrogen. The MMP for nitrogenis generallyhigherthan timal for nsnethane,hutthedifferencedecreasesfor oil sampleswith high bubblepoint pressures.linumt us, Iluids witlm ahigh methanecontent.
Hudgins etal. [13] concludedthat the oil methanecontent is an imnportumnmt pusraumneterf~rachievingmiscibility in nitrogen injection and proposedthe following correluntmoms to estimateMMP for nitrogen.
Pm = 38.39e~X+ 25.10 e5
2 (7.2)
where,
= 792.06x~..1~/(M~,(l.8T—460Y”~) (7.3)
= 2.I58x l06x~52/(M~,,(I .8T.~460)025) (7.4)
The symbolsare as defined in Eq.(7.I). TIme muccuruneyof tine uthovecorrcluulmomn ins predictiirgMMP for nitrogemswas founmd (271 to he comsnparuibleto Ilmuui of 12(137.1).
Dindorm.nk et al. [7] reviewed the literature on miscible displacement with unitrogen, andsuggestedsome explanationson the apparently conflicting views presented by variousinvestigatorson theeffect of injection gasandoil compositionsonr MMP. ‘Fhme umulhors studiedtheproblemby analytically solving thegoverningequationsfor displacinga four componentmixturewith nitrogen-methanein a dispersionfree one dimensionalporous medium. Tlmeyconcludedthat theoil tie line becomestine critical tie line for low nitrogen to ur’uethaneratio,hence,MMP is independentof gascomposition. For gaseswith a hugh concentrationofnitrogen,acrossover tie line becomescritical, hence,MMP is affectedby time gascomposition.For pure nitrogen injection, the oil tie line controls the miscibility, simnmlar to low nitrogengases.
Theaboveconclusions,though generatedon a four componentmixture, are quite informativein explainingtheapparentdiverseviewsexpressedby variousinvestigators,andalsohelpful toselectrealisticmethodsof estimatingMMP.
7.3. Prediction of Miscibility Co,udjtiopus 273
Wlmen immiscibility is achnievedby tIre vaporisingprocessonly,suchasdisplacingahydrocarbonmixture willn metimamneor pure nitrogen, MMP can he calculatedquite simply by a phasebehaviour model. In tlsis process,the critical tie line exteinsiongoes through the oilcomposition,which is independemnlof theinjection gascomposition.
Most methodsthat advocateusinga phasebehaviournnodel to predict themiscibility pressure,propose conducting the forward mnultiple contact test. The test is to be simulated bysuccessivelyraisimmg tine pressureandmonitoringtheapproachto tImecritical state.
A simisple,yet quite rigorotus,umnelhod is linunt of Jemmsennumnd Miclrelsen (281, winich is basedonthe ideun of mmcgmnlive liunsln cumlctulullioun describedin Section5.1. As sirown conceptuallyfor aIlirec colulpoumemntnmmixltuuc inn Figtnnc 7.3, lime liumuiliung lie liunc anmil lime fiinunl opcrmttiutg line are line.saumne br Oil Ii. I lemncc, for exumnnmple, winemm line gas Y’
2is incrementally added to time
undersattnratedOil B, thennixlurecompositionenrichesin thelight fraction by moving towardstime connrposilion X’
2. nun tire tie lime, which is the sameas theoperating line. ‘Fine mixture
uultaiissthecompositionX2
unt tine hobblepoint condilion. Furtlmer a(lditi(rn of the gaswill laketIme mixture into the two-pima.seregion,wimere time equilibratedgasandoil aresisown by X’
2.
and Y’2
respectively.
The aboveanalysisimndieate.sthat amsy nmixture on the tie line extension,wlnen flashed at timeprevailing pressureamnd temnipcrature,will produceequilibratedplnaseswith counipositionsastirose al the two endsof time tie lime. hut with a negativevapour volume. As time pressureincreasesand tine trmiscihihity is approached,the limiting tie line length decreasesapproachingzerotnt thecritical point.
lnvokiimgtire eotmsponncrrtnnmateriuml bumlancein flashcalculations, Eqs.(5.1-2) we get,
7.,=x(I_nV)+y,mmS~ i=I,2 N
wlmerez~,x~andyj mIre llme mmiole fractionsof conmponenti, in the initial oil, equilibrated(nil and
equilibratedgasrespectively.mn’s’ is the vaporisedfraction of the feed(original oil) wisicin willbe negumtivein this case. As the tie line lengtls decreasesand nhiscibility is approached,thevalueof n” decreumsesapproaclningnnninusinfinity. hence,MMP canbedeterminedby flashingtime oil at thereservoirtenmperalureand successivelyincreasingthe pressureabove the bubblepoimst. Timecalculatedvumpourfractionis monitored,searchingfor a largenegative number. Asa pruucticalrule valueslessthan-It) immdicateproxumity to MMP[281.
Condensing-VaporisimigGas Drive
l’Inc coundennsimng_vmm~sorisiungmntuscibmlmly is mmclmieveml geunerumilyat lower pressuresllmann Ilnose oftime vaporisingguts drive. As poimnted out in Sectiomr7. I, time achievementof immiscibility bycondensinggasdrive aloneis not generallyexpectedfor realreservoirfluids.
Benlmummin et ,ml. (29( missurnedtlnumt tine critical tie line is parumlhel to the L-Il uuxis in timepseudo-ternarydiagu’arn In developMM!
3correlatiomnsfor rich gums immjection. Tine resultswere
presentedby a set of curvescorrelatingMMP with theconcentrationandmolecularweightofthe inntertmnediumtefractionsof tine injection gas,the mmmolecularweiglrt of tIme reservoiroil C
5+.
anrd tire temrsperature.Glaso1251 fitted curvesto theresultsof Benlnametai., asfollows:4 S258 1198(1 M’’t
7t53
\
= 43.74—11.1752M —(32 23—11.127M)y + ~t).777xtO’1
M ‘‘ c )( 181—46(1)
For M~2~6
=34 (7.6)
where,
XC2CS
Mc7+T
(7.5)
274 7 Gas l,i,iectiopu 7.3. Predictio,u of Misc jbj!jty Conditip,us . 275
= 3804—0 l326M —(55.79—0.I88M)y +(t.l72xl0~ lM3.730el356.7yM~°58)(I.x.r_4~ I ~=(l
6y~.
2~5)/IM
5.15
(l.wr 460)J
For M~2~ 44 (7.7) where y is the mole fraclion,andP~and‘J~tire in MPa andK, respectively.
Time predictedMMP by the utbove correlationwas comparedwith slim tube dataon II oilreservoirs. The predictedvalues,ramsgimmg fromnm 10 to 40 MPa, slnowedan averageabsolute= 51 18—0 1772M —(5069—0 t47M)y
1+(3 392xIO
16M
5520e21706YmM”
t~){l 8’~—460 deviation of5%. Time Benhamcorrelationgenerallyoverpredictedtheresultswith an average
For M~2~6
=54 (7.8) absolutedeviationof 37% [311.
where ~m is MMP in MPa, y is the mole fraction of methaneimr the insjection gums, T is the Al reservoirconditions, CO2
is often a super-critical compound and behavesas a strongtemperaturein K, andMc2.C6is themolecularweight of the C
2to C
6fraction in lIre mnjectiOmm solvcnml extrunctingconnsponenlsasIneumvy uss C
31, even at moderatepressures. Hence,MMP for
gas. . C02
, is generuilly quite low. TIne solvencyof CO2
iuncreaseswith its density. Tiserefore,
As it is knownthat non-paraffinoilsachievemiscibility at lower presstmres,(“ulaso inehinded lime higimerpressuresarerequmiredat highertennlperalmures,to increaselIne CO2
density for achievingeffect of oil typeon MMPby calculatingtime nrolecunlumrweigint of time stock taunkoil C
7+,M, mis, miscthmlity. tun low temnmperunlurereservoirs,tine C02-oulmnixture mayformtwo liquid phases,or
tlnree phasesof vunpour,(‘(‘~2rids liquid ummnd imydrocarhonrich liquid.
M=572.7/(S~,.~570) (7.9) Miscibility by cumrhondioxide iuujectionrhasbeenstudiedextensively,andvariouscorrelationsto
estitnmalcMMP imavc been proposed. Ennick et al. 1321 reviewed 17 correlationsproposedbywhereS~
7÷is thespecificgravilyof C
7+fraction. different inmvestigumtors.
Kuo [301 simulatedthe backward multiple experiment,usmng the Peng-RohmumsonEOS. tO Alston et a!. [33] developeda correlationbasedon a largenumberof MMP datafor pureCO2
,predict themiscibility conditionsfor a numberof oil and ruch gassystems. The resultswere
0)16correlatedas, P,,=6.05xhO 6(1 .8’F~—4fi0)’°6
M~8
,(x, I x~) (7.12)
y~ME~FrMcO~= 18.46——-—— ~ (7.10) whmeuc xi,, ultm(i x
1mIme lIne untole fmunctioun of volatile (C
1, N
2), and iumternnediateconnupommenls(C
2-
(I 8T_46O)TIM~,, C~,C02
, ll2
S) its line (nil, respectively. For oils witis bubblepoint pressuresless tlsan 0.35MPa, thevalue of (x~/x
1)0t36
is takenas unity.wherey~is themole fraction of methane,MC2.4 is themnoleculunrweightof C
2to (‘4 frunclion us
the injected gas, and Mc5+ is the molecularof C5
+ in tine oil. Tine minimmnultr miscibility Contammminalionof CO2
witin gasesof Irigher volatility. i.e. N2
and C1
, increasesMMP, whilstpressure,
1mm is in MPa, and‘F is inn K. l’he valuesof theconstantsin tIre aboveequationare: addition of less voluntile connponentssuchasH
2S, C
2, andC
3lowers MMP. Theestimated
MMP for CO2
canbecorrectedfor time effect of impurities by empiricalcorrelations. Alston etA= 0.7807248 B=-0.0017204C= 1.7 138599 D-l 0695591 uul. [33J proposedthefollowiung correctionfactor,dip, to hemultipliedto the estimatedMMP ofE= -0.9909715 F=-0.00l0102 pure CO
2.
Theabovecorrelationwasdemonstratedto besuperiorto thoseof Benhametal. aundGlasoin a ( 87.8 ~ 87.8comparativestudy [27], with a standarddeviationof 13.3%. hmi41~l.935j— IInn~ I (7.13)
I ~ —460) 1\ I .8~I’c _460)
Thevalidity oftheabovemethods,which are basedon thecriterion of cntical inlection gas tieline, for realreservoirfluids is in doubt. where~ in K, is tIme pseudo-criticaltemperatureof the impureCO
2gas, calculatedby the
weightaverumgemixiungnule,Pedrood [31] simulated the displacementof oil by ricim gases using a one duussensionalcompositional model. An extensivesensitivity analysms of the parametersaffectmng themiscibility resultedin tire following correlation:
5T( = ~wi(. (7.14)
I’~49.l50.68630+2.482X10t0
20.20
54W
2(7.11) wlserc w
1is tine weiglnl frunclious of conmspomuent,i, inn gas mixtrure, and Tc
1is time critical
meunnpcrunlunrcof coninpomicunt i. Tine umtntirors sruggesteclto usea value of 325 K for the criticalwhere 0 and s~,representpropertuesof tine injected gas umuid reservoir onl. nespectively,as leusspcrumtuuresoil 1
2S mmmd elinamse, insteadof theiractm.muml valuesto inmnprovetheresults.
follows, IOtlner correlations,using tine molar averagemixing rule for calculating the pseudo-critical
=100
(Yc~+O.8y~,+0.5
y~2
,~02
) tenrsperatureInavealsobeenproposed[34].
and
276 7. Gas lnjectio,n 7.3. Prediction of Miscibility C~onditio,us 277
Phasebehaviourmodelscan be usedto estimatemiscibility conditions in rich gas and CO2injection. Asthemiscibility is determinedby a crossover tie line, thepropersimulationof the
compositional path is essential. Thesimulationof simple batchtype experiments,suchasthebackwardmultiplecontacttest,cannotgenerallyproducethemisciblebank.
Themostcommonmethodis theuseof one-dimensionalflow coummpositionalrnnodelssinrulaliungdisplacementin a slim tube. MMP can he found by monitoring the commnpositiommal vunriationsalongthetube,orplotting thepredictedliquid recoverysimilar to using slim tubeexperinsentaldata.
Any reliableEOSmaybeusedto predictthephasebehaviourof injectiongasand reservoiroil.The model also requirescorrelationsfor calculating the relative pensieability, viscosity andinterfacial tension. The selectedmathematicalparametersto solve the governingequations,suchas thenumberof cells describingthetube and the time step. alsoaffect the results byintroducing numerical dispersion [14]. Further details on using a one-dinmnensionalcompositionalsimulatoraregiven in Section9.3.
Example 7.!.
EstimateMMP of thefollowing reservoiroil and theinjected rich gasat 367 K.
Component Cl C2 C3 iC4 nC4 iC5 nC5 C6 C7+ C02Oil, mole % 54.50 8.09 5.82 0.78 2.17 0.94 1.65 2.39 23.66Gas,mole% 84.63 8.81 4.11 1.40 1.05
C7+ Properties: M=209 S=O.8323
Solution:
Glaso(Benhamet al.) Method:The adjustedmolecularweightof theC7
, fraciion by Eq.(7.9),usimsg its specific gravity, is
calculatedas205.9. The molecularweightof theC2
-C6
is determinedas,
M~2
_~6=[~XCMC]/~XC =36.84
The calculatedMMP for ~ of 34, 44 and 54 at 367 K, using Eq.(7.6), Eq.(7.7), andEq.(7.8),respectively,areasfollows:
P,,,~4
=56.27MPa
Interpolatingbetweentheabovevaluesfor Mcm.c,=36
.84
,we obtain,
MMP=54.16 MPa
Kuo Method:The calculatedMMP by theKuo correlation,Eq.(7.I0), with M~,,=186.19, and Mcm.c
4=
37.33, is,
MMP=40.54 MPa
PedroodMethod:
The two parametersrepresentinggasand oil in Eq.(7.I I) arecalculatedas.
0=1124 s~i”~522I5
resulting in,
MMP=35.87 MPa
The umneasuredvunltue usinmg shuns tube data is 39.99 MPa. The predicted valume assumingmiscibility by vaporisinggums drive is expectedto behigher than thoseby the condensingprocess.However, time Firoozahundi-Azizcorrelation, Eq.(7.l),predictsMMP=36.51 MPa.which is only slightly higher tlnann the answerby Pedroodmethod, and much lower thanthe answersby Glasoand Kumo metlmods.
7.4 REFERENCES
I. 7.iek,A.A: “A ConishinsedCondensingIVaporisimmgMechanismmnin the Displmmcemenlof Oilby EirricIned Gases”,SI’E 15493,Proc.of 61stAnn. Conf. (Oct., 1986).
2. Stalkimp, Fl: “l)isplacemrmenl Behaviotnr of the Condensing/VaporisingGas DriveProcess”,SPE16715, Proc.of 62nd Ann. Conf. (Sept., 1987).
3. Monmroe, W.W., Silva, M.K., Lutrse, L.L. and Orr Jr. FM: “Comnposition Palms inFour-ComponentSystems,Effect of Disolved Methaneon 10 CO
2Flood Performance”,SPE
Res.Eng.,423-432(Aug., 1990).
4. Orr Jr. F.M., Johns, R.T. atmd Diimdoruk, B: “Developnnenl of Miscibility inFour-CommnpotsemmtGasE)rivcs”, Sl’E 22637,Proc.of66th Ann. Comnf. (Oct., 1991)
5. Jolmns, R.’E’., Diumdonnk, B. and Orr Jr. FM: “An Analytical Theory of CombinedCondensing/VaporisingGasDrives”, SPEAdvancedTechnologySeries,1(2), 7-16(1993).
6. Johns, R.T. and On Jr, F.M: “Miscible GasDisplacementof Multicomponent Oils”,SPE30798,Proc.of 70th Ann. ConI., 985-998(Oct., 1995).
7. Dindoruk, B., Orr Jr, F.M. and Johns, RI: “Theory of Multicomponent MiscibleDisplacementwith Nitrogen”, SPE30771, Proc. of 70th Ann. Conf., Res. Eng., 725-738,(Oct., 1995).
8. Pande,K.K. andOrr Jr. F.M: “Interactionof PhaseBehaviour,ReservoirHetrogencityand CrossFlow in CO
2Floods”, SPE 19668, Proc.of 64thAnn. Conf. (Oct., 1989).
9. Jolmns,R.T., Payers,F.J.andOrr Jr. F.M: “Effect of GasEnrichmentandDispersiononNearlyMiscible Displacementsin CondensingVaponisingDrives”,SPEAdvancedTechnologySeries,2(2), 26-34 (1993).
10. Flock, D.L. and Nouar,A: “Parametric Analysis of theDeterminationof tine MinimumMiscibility Pressurein Slim lube Displecements”,JCPT,80-88(Sept.-Oct,,1984).
II. Dunnore, J.M., Hagoort, J. and Risseeuw, A.S: “An AnaIyti~~’Model forOne-Dimeumsional.ThreeComponentCondensingand VaporizingGas Drives”. SPE J., 24,169-179(April, 1984).
12. Glaso, 0: “Miscible Displacement,RecoveryTestswith Nitrogen”,SPERes.Eng.,61-68 (Feb., (990).
P0
,4
=53.32MPa P0
,,=56.62MPa
13. Hudgins, F.M., Llave, F.M. andCh~mng,F.T: “NitrogenMiscible Displacementof LightCrudeOil, A LaboratoryStudy”, SPERes Eng., 100-106,(Feb., 1990).
278 7 (;~ Injection
14. Dulhien,F.A.L: “PorousMedna, Fluid Transport unud PoucStructimre”. Acadcuumie Press,London (1979).
15. HoIm, LW. and Josendal, V.A: “Effect of Oil Comrmpositions (1mm Miscible-TypeDisplacementby CarbonDioxide”, SPE3., 87-98 (Feir., 1982).
16. Jacobson,I-IA: “Acid GasesandTheir Contributionto Miscibility”, JCPF,57-59(April-May, 1972).
17. Graue,0.3. and Zana,E.T: “Study of a PossibleCO2
Flood in Ranmgcly Field”, JPT.1312-1318(July, 1981).
18. Tajdar,R.N., Danesh,A. and Gozalpour,F: “An Investiguntionof Oil l)ispiulcemsmcnmtbyEnrichedGasesUsnnga CompositmonushModel arid Its Applicmitionn to Kuirunnj Reservoir”, Proc.of 2nd Internationuul(‘onfcrenceotm Clscmntistryun Inndunstry,A(’S, Ituilsrmiini (Oct., 1994).
19. Sibbald, L.R., Novosad,Z. and Coslunims,T.G: “Metlmodology for tIne Slrceificumlion ofSolventBlendsfor Miscible Enriched-GasDrives”, SPERes. Eurg.,373-378(Aug., 1991).
20. Walsh,B.W. andOn Jr.F.M: “Prediction of Miscible Flood Performstammce,tueEffect ofDispersionon CompositionPathsin TernarySystems”.In Situ, 14(1), 19-47(1990).
2!. Christiansen,R.L. and I-lames, ElK: “Rapid Mea.surennentof Minimmmumsn Miscibility
Pressurewith theRising-BubbleAppratus”,SPERes. Eng., 523-527(Nov., 1987).
22. Stalkup,FL: “Miscible Displacemetst”,SPEMousograpirVol. 8 (1983).
23. Firoozabadu,A. and Azuz, K: “Aunalysis mmmd Correlaliomr of Nilrogenn amid Leanr-GasMiscibility Pressure”,SPERes. Eng.,575-582(Nov., 1986).
24. Koch Jr.,HA. andElutcinsonJr.,C.A: “Miscible Disphacenmentsof ReservoirOil UsingFlue Gas”,Trans.AIME, 213. 7-10 (1958).
25. Glaso, 0: “GenerahisedMinimum Miscibility PressureCorrelation”, 927-934 (Dec.,1985).
26. Boersma,D.M. and 1-lagoort,J: “DisplacementCharacteristicsof NitrogemsFloodingvs.MethaneFloodirsgin Volatile Oil Reservoirs”,SPERes. Eng.,261-265(Nov., 1994).
27. Yurkiw, F.J. atnd Flock. D.L: “A Consparativetnvestigumtion of Miuninsmummsm MiscibilityPressureCorrelationmsfor EnhancedOil Recovery”,JCPT,33, No. 8, 35-41(1994).
28. Jensen,F. and Mnchelsenm,ML: “Calculatuounof First mind Mtmiliple (‘ountuict MinimnsumMiscibility Pressures”,In Situ, 14(1), 1-17(l99t)).
29. Benham,AL., Dowden, W.E. amid Kuniznnnan, Wi: “Miscible Fltuid Displacement,Predictionof Miscibility”, Trans. AIME, 219, 229-37 (1960).
30. Kuo, S.S: “Preductionof Miscibility for Enriched Gas Drive Processes”,SPE 14152,Proc.of 60tln SPEAnn. Conf. (Sept., 1985).
3 I. Pedrood,P: “Predictionof Minimum Miscibility Pressureims Rich Gas Injections”, M.Sc.Thesis,TehranUniversity,Telrran(1995).
7.4. Ref,’re,ue.c 279
32. Enik, R.M., iloldcr, G. mmmd Morsi, B: “A ThernmsodynamicCorrelationfor time MinimumMiscibility Pressurein CO
2Floodingof PetroleumReservoirs”,SPERes. Eng., 8 1-92 (Feb.,
1988).
33. Alstonm, RB., Kokolis, G.P. and Jamrres,C.F: “CO2
Minimum Miscibility Pressure,ACorrelationfor lnrpure CO
2StreanmisanndLive Oil Syslenns”SPEJ., 268-274(April, 1985).
34. Sebastian,H.M., Wenger, R.S. andRenner, T.A: “Correlationof Mininnum MiscibilityPressurefor Impure CO
2Streaunms”,JPT, 2076-2082(Nov., 1985).
7.5 EXERCISES
7. I . Use mu plmmmsc bclnmmviour nnno(ldl to developa tcrnnuury diagrannfor C1
—C1
—rmC11~
at 377.6 Kmmmd 28 M l’ui. Wlmuut is I Inc mmmlmit utuimnum reqtnmed cotrceunlrmntnonof propanein a guns consposedof
(‘‘ -(‘i Inn mmiisci hI ~ (1151)1ace mini oil cotumposedol (‘~(60umsol%)ullm(l nC ~ (40 moi%) at time abovecourditiours.
7.2. The comlmposiliomnof a reservoiroil us given ins thefollowing table. The reservoirpressureamsdteminperunlureareequnal to 82.75 MPa and387 K, respectively.Theoil is to hedisplacedbyunmclisuune. What is your recomusrendedpressurefor gasinjection.
CouiuponenuCl ,_cL.J~_Jc~4,c~_~C~,,_C6÷N2 C02Out, mdc % 4175 7,61 4.77 0.99 2.6! 1.05 1.51 35.41 0.33 4.37
(‘6+ Properties: M=l7i S=0.8527
7.3. (‘uulcumluule MMI’ inn lime aboveexercise,umsumiglIne nmegativefluislm nnethod.
7.4. Nornnnal huntunnic IS 10 be nmscd mis tlte solvent slug in a tnnellmanegas injection process.AssunmsinsglIre reservoir oil behavesas normal decane, estinsmatc the minimum miscibilitypressuireat 360 K. Winat is MM!’ uml 410 K?
7.5. EstinnmunteMMP of the reservoiroul, describedits Exercise7.2, and the injected rich gasdescribedmr time followiumg table. Commnparevariouscorrelations(measuredvalue=32.75MPa).
Coin~nentCI ,ç’~ C3 jç4 ç4 ~ç~5~C~ç6+ N2 C02Oil, mmuotc % 74.60 9.9(1 3.9! 0.57 1.12 0.26 0.27 0.17 0.30 8.90
7.6. The m’escrvoir oil, described its Exercise 7.2, is to he mniscibly displumccd by a gascommnposedof 90 nmnol’X (‘02 annd tO numol% N2. Estitmsmmte tine mimsinsnummiscibility pressure.
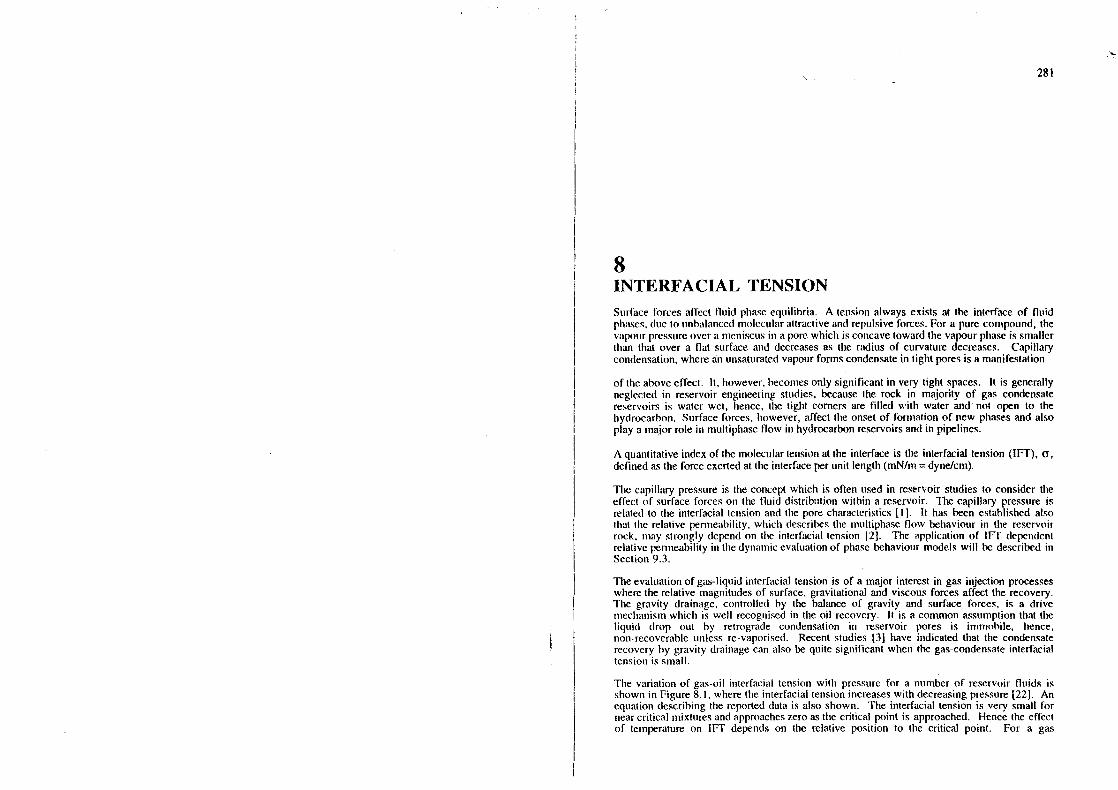
281
8INTERFACIAL TENSIONStnrfaceforcesaffect fluid phaseequilibria. A tension always exists at the interfaceof fluidphun.scs,dueto unhuuiumnccdnnnolcculumrattractiveandrepulsiveforces.For a purecompound,thevmnpour pressureover mn nneniscusinn a porewhiclr is conmcavetoward thevapourplnaseis snmmallcrthan tisat over a flat surface and decreasesasthe radiusof curvaturedecreases. Capillary
condensation, whereanunsaturatedvapourformscondensatein tight poresis a manifestation
of tIme aboveeffect. It, hnowever,becomesonly significantin very tight spaces. It is generallyneglectedin reservoirengineeringstudies,becausethe rock in majority of gas condensatereservoirsis water wet, lmence, tIne tiglmt cornersare filled with water and not open to thehydrocarbon.Surfaceforces, lmowever,affect the onsetof formnrationof new plnasesandalsoplay a majorrole ins multiphaseflow ins hydrocarbonreservoirsanndin pipelines.
A quantitativeindexof themoleculartensionat the interfaceis tIre interfacial tension (1FF), ~,
definedastheforceexertedattheinterfaceper unit length(mN/nm dyne/cm).
TIme capillary pressureis the conceptwlnicln is often usedin reservoirstudiesto consider theeffect of surfaceforceson thefluid distribution within a reservoir, Thecapillary pressureisrelatedto the interfacial tension aurd tlse pore characteristics[II. It hasbeenestablishedalsotimat tIme relative penneahility,winch describestine mnultiphaseflow behaviourits the reservoirrock, ninny strongly dependon tine interfacial tension [2]. The applicationof (FT depemidentrelativepenunneabilityun time dynnamimicevaluationof pinasebehaviourmodelswill he describedinSection 9.3.
Tineevaluationof gas-liquidinterfacial tension is of a nnajor interestin gas injection processeswheretherelativemagnitudesof surface,gravitationalandviscous forcesaffect therecovery.The gravity drainutge, commtroiled by tIme balanceof gravity and surface forces, is a drivenseclnannisnnwhicls is well recogunisedinn the oil recovery. It is a common assumptionthat theliquid drop out by retrograde condensation in reservoir pores is imnirohile, hence,notm-recoverableunless re-vaporised. Recentstudies [3J have imndicated tirat tire condensaterecoveryby gravity drainagecan alsobe quite significantwhen the gas-condensateinterfacialteunsionissmall.
Tine variation of guts-oil interfacial tensiomn witis pressurefor a nunsberof reservoirfluids isshownin Figure 8.1. wiseretheinterfacialtensionincreaseswith decreasingpressure[22]. Anequationdescribingthe reporteddata is alsoshown. The interfacial tension is very small fornearcritical mixturesandapproacheszeroasthecritical point is approached.Hencethe effectof temperatureon 1FF dependson the relative position to tlse critical point. For a gas
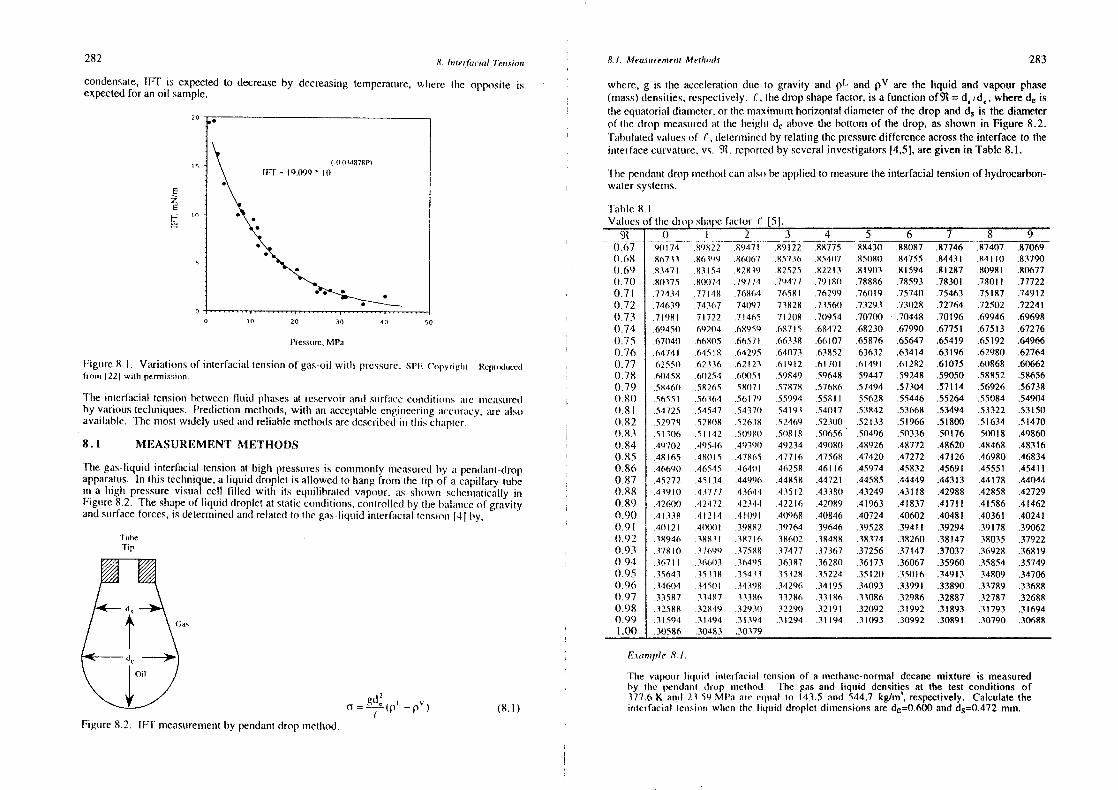
282 8. lnierfacial Tension 8. 1. Menus renuen! Metlmod,c 283
20
is
C
tO
0
condensate,IFT is expectedto decreaseby decreasingtemperature,where tine opposite isexpectedfor anoil sample.
Figure8. I. Variations of interfacnaltensionof gas-oil witim pressure.srF Copyrighi Rcpruxliuccd
from 1221 wiih permission.
Time interfacial tensionsbetweenfluid phasesat reservoirand surfuucecomrditmonns mire nmneasunredby varioustcchmmiquues.Predictionmetlmods,witln mm acceptableengiunecriumgmmcctmrmmcy, arc mulsoavailmmhle. Themostwidely usedand reliablemethodsaredescribedimn tins chsuiplcr.
8.1 MEASUREMENT METHODS
Time gas-liquid interfmncial tension at high pressuresis conrmnmomnly nmreasuredby mm peurdanrt-clropapparatus.In this technique,a liquid dropletis allowed10 hangfrommi the lip of a cumpillaty tubein a Inugh pressurevisual cell filled with its eqtmilihraledvapour, as slnown schiennuaticmillyinFigure8.2. The shumpeof liquid dropletat static comnditiotss,controlledby thehalmmrmccof gravityand stmrfaceforces,is deternminedand relatedto tIne gas-liqunidinnterfmncial tensious141 by,
rube
0 10 20 30 40 50
~=~~(pi._pV) (8.1)
where,g is the accelerationdue to gravity and pL and pV are the liquid and vapour phase(mass)densities,respectively.1’, (lie dropshapefactor, is a functionof9~= d~ide,whered~i~time equatorialdiamnmcler,or themaximumhorizontaldiameterof tine dropandd~is the diameterof tIme dropmeasuredat tine imeighnt d~abovethe bottomof thedrop, asshown inn Figure 8.2.Tuihunlatedvaimnesof (‘, deternsinredby relatingtine pressuredifferenceacrosstine interfaceto tImeinsterfacecurvature.vs. 9~,reportedby severalinvestigators[4,5], aregivenin Table8.1.
Tine pcmrdamntdropnnetlmodcanalsobe mmpphicdto mrieasunretheinterfacialtensionof hydrocarbon-watersystetns.
!muisle 8. IValuesof time dmot slnmll)c functor I’ [5~.
0.690.700.7!0.72t).730.740.75
0.760.770.780.790.80((.8I0.820.83((.840.850.860.870.880.890.900.9!0.920.93
0.940.950.960.970.980.991.00
t).90(74
I
.89822
2 .5 4 0 1 9
.8947t .89122 .88775 .88430 .88087 .87746 .87407 .870698(,7i1.86719 .860(,7 .85716 .85407 .85080 .84755 .84431 .84110 .8379083471 .83154 .82859 .82525 .52213 .81903 .81594 .81287 .80981 .80677
.81)375 .80074 .79774 .79477 .7918(1 .78886 .78593 .78301 .78011 .77722
.77434 .77148 .76864 .76581 .76299 .76019 .75740 .75463 .75187 .74912
.74639 .74367 .74097 .73828 .73560 .73293 .73028 .72764 .72502 .72241
.71981 .71722 .7(465 .71208 .70954 .70700 .70448 .70196 .69946 .696911
.69450 .6921(4 .68959 .687IS .68472 .68230 .67990 .6775I .67513 .67276
.67(140 .66805 .66571 .66338 .66107 .65876 .65647 .65419 .65192 .64966
.64741 .645)8 .64295 .64073 .63852 .63632 .63414 .63196 .62980 .62764
.62551) .62336 .62123 .61912 .61701 .61491 .61282 .61075 .61)868 .60662
.6(1458 .6(1254 .60051 .59849 .59648..59447 .59248 .59050 .58852 .58656
.58460 .58265 .58071 .57878 .57686 .57494 .57304 .57114 .56926 .56738
.56551 .56364 .56179 .55994 .55811 .55628 .55446 .55264 .55084 .54904
.54725 .54547 .54371) .54193 .54017 .53842 .53668 .53494 .53322 .53150.5297% .5281(8 .52638 .52469 .5230(1 .52133 .51966 .51800 .51634 .51470.51306 .51142 .50950 .50818 .50656 .50496 .50336 .50176 .51)018 .49860
.49702 .49546 .49390 .49234 .4908(1 .48926 .48772 .48620 .48468 .48316
.48165 .481)15 .47865 .47716 .47568 .47420 .47272 .47126 .46980 .46834
.46690 .46545 .46401 .46258 .46116 .45974 .45832 .45691 .45551 .45411
.45272 .45134 .44996 .44858 .44721 .44585 .44449 .44313 .44178 .44044
.43910 .43777 .43644 .435 12 .43380 .43249 .43118 .42988 .42858 .42729
.42600 .42472 .42344 .42216 .42089 .41963 .41837 .41711 .41586 .41462
.41338 .41214 .41091 .4(1968 .40846 .40724 .40602 .40481 .40361 .40241
.4t512t .40001 .39882 .39764 .39646 .39528 .39411 .39294 .39178 .39062
.38946 .38831 .387(6 .38602 .38488 .38374 .38260 .38147 .38035 .37922
.37810 .37699 .37588 .37477 .37367 .37256 .37147 .37037 .36928 .36819
.36711 .36603 .36495 .36387 .36280 .36173 .36067 .35960 .35854 .35749
.35641.35338 .35473 .3532% .35224 .35120 .35016 .34913 .34809 .34706
.3461)4 .346(11 .3439% .34296 .34195 .34093 .33991 .33890 .33789 .33688
.33587 .33487 33386 .33286 .33(86 .31086 .32986 .32887 .32787 .32688
.32588 .32849 .32930 .32290 .32191 .32092 .31992 .31893 .31793 .3t694
.31594 .31494 .31394 .31294 .31 94 .31093. 30992 .30891 .30790 .30688
.30586 .30483 .70379
L.uau;mple 8.!.
The vapour-hiqunid inmterfacial tension of a methane-normaldecanemixture is measuredby nIne pendausldrop method, The gas and liquid densities at the test conditions of377.6 K anmd 23.59MI’a are eqmnaI to 143.5 and 544.7 kg/mu, respectively. Calculatetheinterfacial tensionswhen the liqunid droplet dimensionsare deO.600andd
5=O.472nmm.
(-0 03417Rt’)IFT= 9.099* in
Pressure,MPa
lip
Figuure8.2. lET measurementby pendantdropissetinod.
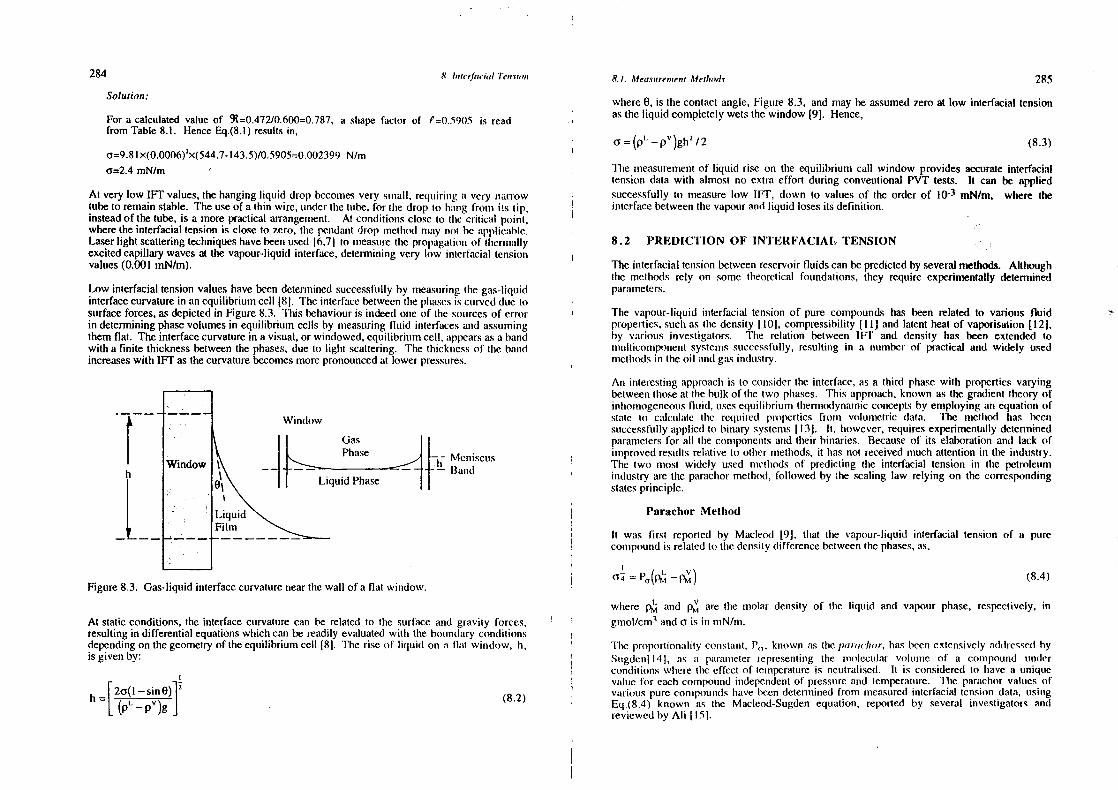
284 8 !uuIu’tfucn~nlTe,u.m,o,n 8. 1. Mea.uuuennen: Alei/uods 285
Solution:
For a calculatedvalue of ~R=0.472/0.600=0.787,a shape factor of ~=0.5905 is readfrom Table8.1. HenceEq.(8.l) resultsin,
c~9.8I x(0.0006)2
x(544.7-I 43.5)/0.5905=0.002399N/m
a=2.4mN/rn
At verylow IFT values,thehangingliquid dropbecomesvery snmsall, requiriumg a very nnarrowtubeto remainstable. Timeuseof athin wire, underthettube, for tire drop to hmnog from its tip,insteadof thetube, is a more practical arrangement. At conditiommsclose to linc critical point.wheretheinterfacial tension is close to zero, tIre pendantdrop msrcthmod mummy not heapplicable.Laserlight scatteringtechniqueshavebeenused 16.71 to Ineasturetire propagationsof tlscrmmmunllyexcitedcapillarywavesat thevapour-liquid interface,determiningvery low interfmmcial tensionvalues(0.001 mN/rn).
Low interfacialtension valueshavebeen detertmiincdsuccessfullyby nneasurinrgthegas-liquidinterfacecurvaturein anequilibriunncell (8(. The interfacebetweenthephasesis curveddue tosurfaceforces,asdepictedin Figure8.3. This behaviouris indeedomseof time sourcesof errorin determiningphasevolumesin equilibrium cellsby measuringiluid interfacesandassumingthemflat. The interfacecurvaturein a visual,or windowed,equilibriumcell, mmppearsasa handwith a finite thicknessbetweenthephases,due to light scattering. Tire thicknnessof time handincreaseswith 1FFasthecurvaturebecomesmorepronouncedat lowerpressures.
wirere0, is thecontactangle, Figure8.3, andnray be assumedzeroat low interfacial tensionasthe liquid completelywets thewindow (9]. Hence,
~y=(pi._pV)ghl/2 (8.3)
The measurementof liquid rise on the equulibriutn call window providesaccurateinterfacialtension data with almost no extraeffort during conventionalPVT tests. It can be appliedsuccessfully to measurelow IFI’, down to valuesof the orderof l0~mN/rn, where theinterfacebetweenthevapourandliquid losesits definition.
8.2 PREDICTION OF INTERFACIAL TENSION
The interfacial tensionbetweenreservoirfluids canbepredictedby severalmethods. Althoughthe methods rely on sometimeoretical foundations,they requireexperimentallydeterminedparatneters.
The vapour-liquid interfacial tensionof pure compoundshas been related to various fluidproperties,suchas tine density (10], compressibility[Ill and latent heat of vaporisation[I 2J,by vmnrious - investigators. Tine relatiomr betweenlET and. density has been extendedtonmnulticonnpomnemntsystemssuccessfully,resulting in a numberof practical and widely usedmetimod.sins theoil mnnd gasindustry.
Ans interestingapproachis to counsiderthe interface,as a tlnird pInase with propertiesvaryingbetweenthoseal thehulk of tine two pinases. This approach,known asthegradient timeory ofinimonsrogemmeousfluid, um,sesequihibriunmi timermodynatsnicconceptsby employing anequationofsonIc to cmdctmlmute tire required properties from volunmictric datum. The msietlnod has hecmrsuccessfullyappliedto binary systenrs[13]. It. inowever,requiresexperimentallydetenninedparanmetersfor all the conmponentsandtheir bimmaries. Becauseof its elaborationand lack ofimmmprovedresunltsrelative to other mnethiods,it hasnot receivednnuchattention in the industry.The two mnsost widely used nmsetlmods of predictinmg the interfacial tension in time petroleumindustry are theparacinormetlmod, followed by the scaling law relying on the correspondingstatesprinciple.
Parachor Method
It was first reportedby Macleod [9]. tlmat the vapour-liquid interfacial tension of a pureconnmpoumndis relatedto thedensitydifferencebetweentime phases,as,
Window
Gas
id Phase — Band
L~~L;~uid MeniscusFilm Lmqu
Figure8.3. Gas-liquidinterfacecurvaturenearthewall of a flat window.
At staticconditions,the interfacecurvaturecan be related to the surfaceand gravity forces,resultingin differentialequationswhichcan bereadily evaluatedwith the hotmndmury conditionsdependingon thegeometryof theequilibrium cell [81. The riseof liquid on a limit window, h,is givenby:
h F2y(1_smno)12 (8.2)L (pL~pV)gj
(8.4)
wimere p~and p~are the molar density of the liquid and vapour phase,respectively, in
gmnol/cmn1and~ is in mN/m.
lime proportionmuulilycoumstmmnt,P0
, known as thepanwIuor, hasbeen extensivelyaddressedby
Stmgdcn(14], as mm pmmrmmnmmeter representing the molecular volummne of a connnpound underconnditions where tIne effect of temumperatureis neutrahised. It is consideredto have a uniquevaluefor eachconsrpotmndimmdepcndentof pressureand temperature. Tine parachorvaluesofvariouspure connpounmdslsavebeen determinedfrom measuredinnterfacial tension data, usiungEq.(8.4) known ins time Macleod-Sugdenequation, reported by several investigatorsamsdreviewedl)y Ali 1151.
286 8 1,ireuf~meiolieuu,cjo,u 8.2. Preducu:oiu of Inlr;fneia! le,i.uion 287Parachorvalues of homologouslsydrocarhonsslsow an alnnost limmear relmmtiomsslnip willn tIne
molecularweight [16-17]. A relationfor theparachorof pure norunsmsl paraffiunsis ums follows,
P0
=21.99+2.892M (8.5)
Parachorcorrelationsin termsof critical propertiesIrave alsoheeurpumblisired 1181.I?
P0
=0.324T,4
v~ (8.(m)
wherethecritical temperatureT~is in K andthecritical volummev~is in cmTn3
/gunsol.
Paracisorsof a numberof purecompounds,to heusedin Fq.(8.4),mire given ins Fable8.2 1191.Thevaluesfor compoundsheavierthan nC
5havebeenestimnatedfrousm Eq.(8.5).
Table 8. 2.Parachorand ~ valuesof pure conmnpoummds.(.‘ouuuponenl Paraclnor t value(‘02 78.0 3.505
N2 4t.0’ 3.414Cl 77.0 3.409
C2 108.0 3.630(‘3 150.3 3.681iC4 181.5 3,597*nC4 189.9 3.687(‘5 225.0 3.682*
nCS 231.5 3.695nC6 271.0 3.726nC7 312.5 3.748*nC8 351.5 3.852nC9 393.0 3.865nuCtO 433.5 3.855nCtl 474.1 3.641nCt2 514.7 3.815
nCt3 555.2 3.872nCl4 595.8 3.820nCtS 636.4 3.795nCl6 676.9 3.822“The givenvalue is for ninrogen in hydrocarbon misiurcs.
The value for pure nitrogen is 60.0.* Calculatedvaluesfrom Eq.(8.18).
The Macleod-Sugdenequation,Eq.(8.4), has been extendedto mlmixtures by incorporatingvarious mixing rules. Weinaug and Katz 119] proposed simple tnrolar uuvermuging for limeparachor,
~ ~ =~P01
(x1
p~—yp~) (11.7)
wIrere x1
and y~are time insole fractions of counnpommeusl i ins the hiqunid amid v:ulsouir pinmuse,
respectively.P~is theparacinorof counponenti.
= ~~z~z~P0
,1
(8.8)
wherez1
is the insolefuactiomn of connnponmenti in tine hiqunid or vapourphase. P~jjis the average
pusrachorof commnponmeumti aund j, -
= ~- (P01
4’ ~ (8.9)
whereC~is a temnlperunturcdcpcnndentinteractionparaurseter,determinedexperimentallyusinglET dmuta our binary nrixtuures.
The sinimple nmsolarunvermigingasproposedby Weinatugand Katz, Eq.(8.8),is time nsmethodwidelyu.used ins petroleutsuindiustu’y. Tine paraclsorvalueof acomponsentin a mixtureis thesausneas thatwlsenpuure. The exceptiomnis tlsmit ut nutrogenin reservoirfluids, asgivenin Table 8.2.
‘lIne rclmntiouu hetweenrtIne pmnrunchor mmmd line mnnolecuiarweigtmt of imydrocarbongroups,such assiunglc cmmrhxnnn ntununbcn’ grnntnps. is conssiden’cdto deviate signilncanlly from linearity 121,221.This trennd simouuld Ire expected mis tine pmnraclsor-nsmolccularweiglst relation varies for varioushydrocarbonhoumnologuues.‘rIse ratio of paraffins, aronsraticsand cyclic compotunndsin variousSCN grotups are not tine suutnme. resulting in a nonm-hinearrelation. Firoozahadi et al. (22]detem’unminedparmucinorsfor crundeoil frmnctions of various molecular weights annd proposed thefollowing equnationn.
= -11.4 -i- 3.23M - 0.0022M2
(8.10)
It simounkl be noted tlsmml genserahisedcorrelations are nsot expectedto provide a reliable parachorvmmlue for time oil imeavy eurd, winicls geuserallycontaimss a highs concentrationof asphaltic andsurfmmceactive mrmaterials. It is advisableto determineit experimentally.
The insterfacial tenrsiondescribeslIne natureof nnolecularforces at the interface,whereasthedensity or tIne mnolecumlarweighmt are hulk properties. In generalall prediction methodswhichrelmntc lET to sommne huulk properties,sucin as the denrsity,are not reliable for nnixtumres withcomponentdistributionat tIme interfacedifferent thantisatof thehulk.
Lnaiuuple 8.2.
A reservoiroil tsmns beeun umnodelled by a mnnixtuure of Cl and nC~~(60-40 nnole%). Thenunixture bubblepoinst pressuremit 377.6K is 23.59MPa. The propertiesof the oil phaseat the mubovecoimdilionns and its equilibratedgas,areas follows:
t’luasc density,5/cuss’ methaneunmolefractionOil 0.5447 0.6000Gas 0,1435 0.9825
Esniunianc tIme gas-oil uuutcrfmucitut lcussnomn at mIsc above conditions, using tIne parachor
nsicthod. Tine unicasuuredvalunc is 2.4 mssN/m.
,Soluuimo,m
‘lIne unsiutar dennsuty of tsunt Is plumuse.cmire calculatedas
M’ =~xM,=0.6x16 043u-0.4x142.285=66.54 g/gmoh
Ilugill and van Welsenes1201 proposeda quadraticnssixing rule for estimationiof tIme pimaseparachor, M
0=Zy,M,=0.91125xl6.043-t-0Oh 75xI42.285=l8.25 g/gnsmoh
288 8. Iuurerfaeial Tu’rn.cjoui 8.2. Predicsio,n ofhuferfneial Ten.ciouu 289
where ~ and~mire tInennohardemnsitiesof theliquid and vapourphases,respectively,and the~=0.008I86 gmol/cm
m~=0.007862 gmol/cun’ exponent(dO) is equalto (45/I76)=(l/3.9l11).
The parachorvaluesare read from Table8.2 and usedin Eq.(8.7)to calculmute lET. ThecoefficientP~is equivalentto theparachorin Eq.(8.4) andis givenby.
1,0 2S...77(~6x0 0081 86-0.9825x0.007862)+433.5(0.4x0.008186-0.0175x0.007862)P
0=A~
45~76v~/~ (8.17)
a=I.708 mN/mwlnere v, is theminurlmur critical voluunsseandtime value of ~ is estiminatedfrom IF!’ data ots piure
CorrespondingStates Correlation (Scaling Law) comrnpounnmds,asgivensmum l’mihle 8.2. It Inns beenrclmnted alsoto thecritical conmsprcssihihityfunctor,mis 1251.
According to the correspondingstatesprinciple, Sections 1.2, fluids lrelnmuvc siummilmtrly wiucnmscaledproperly relative to theircritical points. For a pure fluid, time vapotur-hiqunid imslerfacial = 1.854426
7,~-it.524lt2 (8.18)
tensiondecreaseswith increasingtemperatureandheconmmeszero at tine critical point. hence tinefollowing scalingcanbe considered, almInougln tine correlmstiuundoesmmml midcqtuumtely nnuitcis lIme reportedvaln.nes. For nsni5turcs, unnolar
avermugiung us usedto calculate vmulues I~ I’ ‘I’ v amnd ~, for cutch phmnse to deternnnine itsc c’ c’ CIT (I — Tr)° (8.11) pmnraclmorfroism Eq.(8.17). The immterfacialtension is Linen calculaledfrom Eq.(8.16).
whereT, is thereducedtemperatureand the exponent0 may he estimmnatedexperinsnenntallyortheoretically. Comparison of Predictive Methods
Brock andBird [231 incorporatedthedimensionlessinterfmscial tensionsgrornpof c~I(P~213
Tc”3
) An examinatiourof time abovetwo methodsrevemmis timmst theyarebasicallythe sanme. Both unsein theabovescaling,adoptedtheempiricalexponentvalueof 0=11/9reportedby (Iuggenheinn experinsnenrtmnlhydeterumninedparaclmorcoefficients,directly in the formerandindirectly relatedto[241 andproposed, tine criticuil property by ~, in tine latter. Usinng a function relmiting the parunchor to critical
properties.sudsmis Fq.(8.6), ins line first method,will makethe two even more sinnilar. Thefirst nmnetlnocl,however,appliesnmmixing rulesdirectly to calculatethe mixtureparachor,wimereas
= Ac (1 - Tr)’ 1/9 (8.12) . tine pseudomixturepropertiesareinitially calculatedin thescalinglaw to determinethe mixtunreparachor.
where,The main difference is the value of exponent inn tine 1FF-densitydifferencerelation. This,
(0.132f~~- 0.279)(P 2/3T t/3~ (8.13) Inowever, does not himil any of lire two methodsto specific exponentvalues. Hough andc c IStegenneier[27] proposedan eqn.uation similar to Eq.(8.4), but with an exponentof 1/3.67,
I~cis theslopeof thereducedvapourpressurecurve,plottedvs. tIme reducedtenmmperature,at tine deteumnineilusinglET dumlumof propmuneandbutanein tine critical region. It hasbeenshown [6)critical point andcanbeestimatedfrom, tisattire ilough-Stegeummeicrequmulionis nmoreaccurateat low interfacialtensionconditions( <
0.05 usrN/nn).
~ =09076I~n(~(1—T~/T~) J (8.14) ‘[he IF!’ densitydifferencerelmitiour canbegenerahisedas,
vv(T/m = (P,~’p~I~~1 (8.19)whereTbis theboiling pointof thesubstanceat lime atinmosphmericpressureP.1
.
where i~inas beensuussunmsmedto he constunmstin time abovemethods.Eq.(8.I2), developedfor pure fluids, cannot be used for inmixtures as time conmmhx)sition ofvapourandliquid changeswith pressureandtemperature. Figmnme 8.4 showsIFI’ of a Nou’tim Seagas.condcnrsatemeasuredduring severaltests, including
tine coumstmtuntconnpositionexpansion,constammtvolunnedepletionandmethanecycling at 383 K.LeeandChien [251replacedthetemperaturescalewith the liquid-vapourdensity difference,,as All the unmeasuredpoints follow time same trend when plotted againstthe liquid-gas densityit alsovanishesatthecritical point, difference. Therelation is linear on the logarithmicplot, but theslopeclearlychangesaround
IFT= I mN/rn. Tine changeof slope for other systemshas been reportedalso by other(pL pV) (T~~T)E (8.15) investigators128].
Tine deviationof predictedlET by theWeinaugandKatz correlationfrom experimentaldataonThey assumede=~/I6astheoreticallydeterminedby Fisher[26] andproposed, sevenhydrocarbonbinary systems,including 213 datapoints, is shown in Figure 8.5 [29].
Note that thenmetimodgenerallyuumderpredictsat low lET conditions,whilst it over predicts at(TriO (pLL ~vv
= PM — ~ PM) (8.16) higln lET conditions,with tine unostaccurateresultsaroundIFT=I mN/m. A sinmilar trend wasalsoobservedfor the Lee-Chicomethod[29).
290 8 I,iii’i i~ic,alI(~i.(lOII 8.2. I’redieuio,u of hue ufaeia! Tepi.uio,i 291
z
a
Figure8.4. Measuredgas-condensate1Ff of a North Seareservoirfluid mit 383 K.
V
V
0.
C
0
tOO
S
0
- tooOOt 01 .1 iO 01)
tvr, nuN~m
Fugunre8.5. Deviationsof preductedIFT by theWeinaug-Katzmumetlmodfor binary nmnixtuu’es.
Botlscorrelmntionscmuo he imsmprovedby nmmiking tine IF!’ expomsenit, l/E, a functions of mIne liquid—vapomurdeursiny difference129]. Theoptiurrised value for tIme Weinsaung-Katzcuimrelation wasdeterminedby regressungE to ummiuninmuisethedevimstionsof tine predictedhinsmmny resultsmis,
E=3.583+ 0.I6(~-p~) (8.20)
wiserep51
us mn gmol/cmn3
. The contribution of time second terism imr the abovecorrelation isnegligible in mostcases,resultingin a constantexponentin practice.
.S.
l~
!‘inc abovemuno(IilicationsreducedtIme averageabsolutedeviationfrom23% to 14%, wlnen testedagainst 65 data points on tnulticonumponentmodel fluids. A similar improvementwas alsoobservedfor realreservoirfluids iumcludinggascondensateandoil samples[30].
Schechlerand Guo conductedus comprehensivesurvey [16] of reported1FF anddensity dataandclearlydemonstratedtlnat time optinnunssvalue of E, particularly for hydrocarbonsystemsatlow lET conditions,is less tinaum 4. Based on experimentaldata and molecular models, theauthorsconcludedthat a sinsgleconmstantvalueof E=3.88in Eq.(8.19)shouldsuffice to predictIF!’ witluinm ml rangewimere tIne critical point scahinngis applicable,that is lessthan I mN/m.
(TI/iSO = ~P0
,(xp~,1
y1
p~) (8.21)
As clummnsginmg tIme vmultnc of exlmonsennt rcsunlts mr clnminnge of lIme parachors, lhney calculatedapproprimnleparunclnorsfor a large mnununhcrof punre connpomnnds,using experimcnntallET data.I’lmeir cuilcuuluiied vmulumes mire giveun ins the plnysicunl properly table,‘l’ahhc A. I, in Appendix A. ihe
it lains unhso k’ vekm1
x’uI I inncmnr comreluntionss betweu’ur tine parmmchor and nsnolectnhnr weight forvminious inydrocunrhonrisonnsologumu’s. lime correlation for alkanesis asfollows,
l’~=ll.73+2.9871M (8.22)
A linear rclmstiomr betweenpuiracimor vunluesand nnolecularweigirt was alsosuggestedfor alltypesof hydrocarbons,witim a deviation of 22%.asfollows:
P5
=3.72+2.95l9M (8.23)
‘lIme abovecorrelatiourntayhe musedto estimateparunchorvaluesfor SCNgroups.
!~~oniph’8.3.
Predict tine gas-liquid IF!’ of tlse ntmixture described inn Example8.2. using the Lee—Chienmn,nd Sclsumclsicr—Gnno mmciImods.
Suuhuuine,,u:
L.ee-ChienMethod
TIne counmponentcriticuil propertiesare read fronn Tumble A.l in AppendixA. The valuesofft for eachcoussponenntis calcumlatedusing Eq.(8.I4),
ft ,-I330947 3,ç~ 17.29700
Vunluesof ~ for nnuethmmneand nsornnsaldecaneare read from Table8.2, equal to 3.409 and3.855, respectively.
TIme valuesof v,. T,, P,, ft anscl c1 of eachphaseare calculatedby molar averagingandsiubstituntedin Eq.(8. I .1) muusd Emq.(S.17) to determineA, and P,, , respectively.
l5uaw v, cuuu’/guuuot ‘I. K I’,, Mt’s (1 A,, mN/rn P0
Liquid 299.16 36t.42 3.6034 14.9045 3.5874 28.2673 195.970Vapour 07.37 198.04 4.5554 13.3793 3.4168 19.6633 64.104
Suihstuniting tIne mnlmovc valuesof t’~aund nmnol mur dcnmsities,calculatedin Example8.2, inEq.(8.l6). we obtunin,
I)cnsniyl)illcrcnce, g/cuuu3
292 8. Inierfacia! Tension 8.3. Water.flvdrocarboniumteufacia! Tension 293
(Ti4vnmu)_ l95.970x0.008l86-64.IO4x0.OO7862~l.10024
a=l.453 mN/rn
Schechter-GuoMethod
The parachorvaluesfor methaneand normal decaneare read from Table A.I, equnal to74.05and440.69, respectively,and substitutedin Eq.(8.7), but with the lET exponentof(1/3.88),
EzE
Connprehensivedata omr multiconnponenthydrocarbons-water,particularly realreservoirfluidsarescarce.For reservoirgases,time trendis very nsuchsimilar to that of methane,Figure 8.6.witim tine presenceof heavierconnpoundsin thegasreducing1FF. Theeffect of pressureon oil-wmuter IF!’ is mininnmul above tine oil htnbhle point. The reduction of pressurebelow the oilbubblepoint generallyreducestImeoil-waterlET dueto releaseof gasout of the liquid nmixture.Theoil-waterinterfacialtensionis expectedto decreasewith increasingtenmnperature,but resmnltscontraryto that atsomeconditionshavealsobeenreported[35).
~‘>=74.05(0.6x0.008I 86-0.9825x0.007862)÷
440.69(0.4x0.008186-0.0175x0.007862)
a=l .864 mN/rnaza
8.3 WATER-HYDROCARBON INTERFACIAL TENSION
The interfaciai tension of pure hydrocarbon-waterhas been measuredover wide rangesoftemperatureand pressureby various investigators[31-36]. ihe reporteddata often showsubstantial discrepancies as reviewed by Firoozahadi and Ramey [37]. The variation ofmethane-waterIFT with pressureand temperatureis shown in Figunre 8.6. ‘fhe imsterfacialtensiondecreaseswith increasingpressureandlortemperatureover thetestedregiomn.
0
Figure8.6. Methane-waterinterfacial tension.SPECopyright.Reproducedfrom 1351 with permission.
Figure 8.7 shows thevariation of n-octane-waterlFl’, witlm pressureand tensnperature[36].The interfacial tension decreaseswith increasing temmnperature. Ann iurcremise in pressure,however, increaseslET, but theeffect is small. Tirereare reportssinowing sliglnt redmuctionofIF!’ by increasingpressure[33], contraryto that in Figure8.7. Tine effect of pressureon lETof pure liquid hydrocarbon-wateris generallysmall andcanbeneglectedin mostcases.
81) ttX)
0 555
S
595K
0 ID 20 /0 40 50
Pressure, MPa
Figmnmc 8.7. Water-tn-octaneinmerfacial. PcmroteurnSuucicmy umi Cuiunatla Copyrighu. Rcprixiuncedfruinsu 1361wimtu joeruuuissi In.
Altlnough paracirorvalues,about52 [25, 38),havebeenreportedfor water, time use of vapomnr-liquid correlations, Eqs.(8.7) and (8.16), to estimate lET of hydrocarbon-wateris notrecomnsmend.Timesecorrelationscan pn’oducehiglnly erroneomnsresults,evenfor sinsrplebinarysysteunns[371.
l~xauumpIe8.4.
Estiusmale the interfmmcial tensionbetweentIme gas inn Exanmuphe8.2 anmd water.
Solu,iouu:Connsideringthat the gas is predominantly composedof methane,Figure 8.6 may be
mused to estinnuategmns-wmmterlET mit 377.6 K and23.59MPa.
(~,=43mN/nnn
Firoozabadiand Ramey [371 denmonstraledthat IF!’ betweenwaterand pure hydrocarbons.over a wide rangeof temperature-pressure,can be describedby a single plot shownin Figure8.8. Tire 1Ff frunctiomsis as follows:
1 li2S S . . ‘.5 03125II’ I I’u.uinctnonm E t,~u,W“(p — P )j( 1/It
20 40 60Pressure.MPa
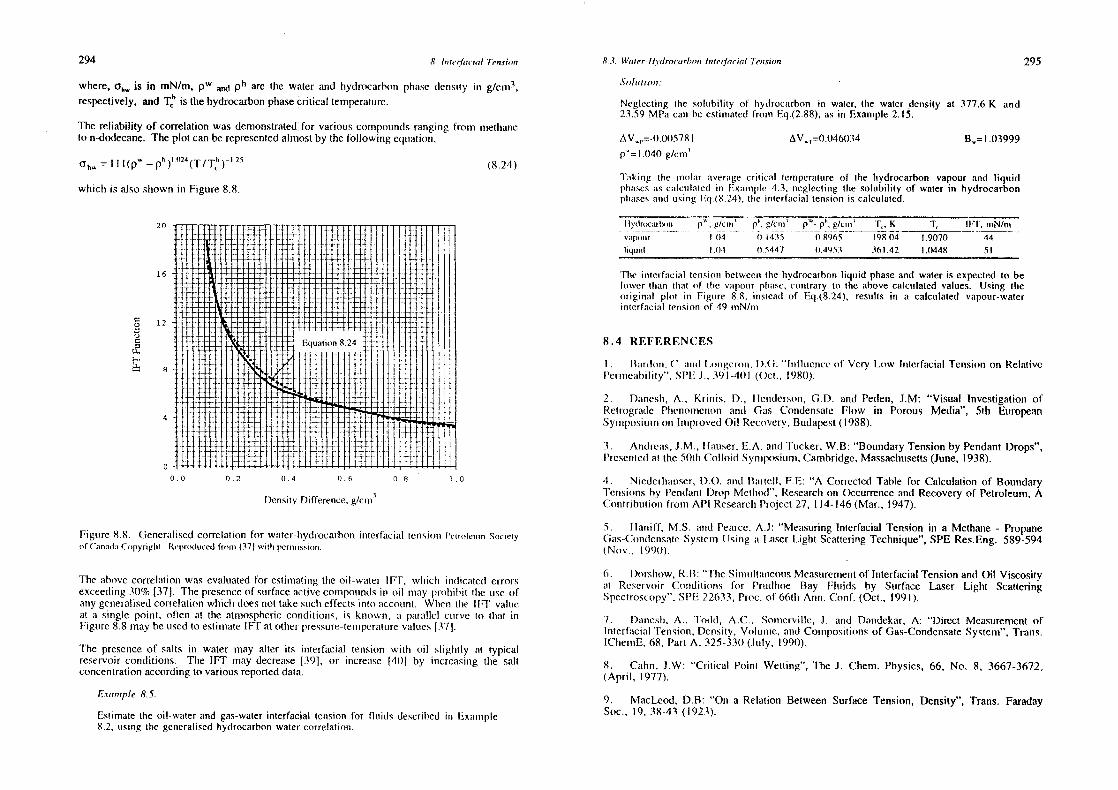
294 8. (ml frrfacial Te,uciomu 8.3 tVoiu’r-Flwlroearbo,n /,ute,J’acial Tensio,u 295
where,ahW is in mN/rn, pW ~ ph are the water and hydrocarbonsphase deunsity its g/cnnn3
, Sohuuiio,u.
respectively,mmd T1
h ns thehydrocarbonpinasecritical temperature. Neglecting the solumbility of Imydrocuirbon in waler, tIme water density at 377.6K and23.59 MPa can he estimatedfrom Eq.(2.88),as in Example2.15.
The reliability of correlationwas demonstratedfor variouscompoumndsranmging fronn nnethanmeto n-dodecane.Theplot canbe representedalmostby thefollowing eqmuatiois. AV,,~.0.0057RI i\V~
0=0.046034 t3,,=l.03999
p~=l.040 g/cnn’(8.24)
Tmnkinng the uniolar averuige critical tenssperatureof mime hydrocarbon vapour and Iuqnnndwhicin is alsoshownin Figure 8.8. pluunses as calcuulmstcdun Exausiphc4.3, neglectingthe solubility of water in hydrocarbon
pliumses aund usingI:q.(8.24), tIme interfacualtension us calculated.
20 ttydruucarlxin p”. g/cuui’ ~ g/cuuu’ pW.p0~ g/cuus’ ‘F,. K 1, 1FF, nuN/rn
. . .1 - viupulur 1.1)4 (1)435 0.8965 198,04 1.9070 44-. .- --. =- .., ... ... . tuqumid 04 0.5447 i).4953 361.42 1.0448 51
16 TIne interfuicial teunsionshetweenmthe hydrocarbonsliquid phaseand wateris expectedto belower nlnan tlnat of tine Vuiponir plumuse,cuuuntrary to the above calcnulatedvalues. Using the
. - ‘ original plot mu Figure 8.8. unsiead of Eq.(8.24), results ins a calculatedvapour-water- . . ‘ - . - — imuterfacimil temssion of 49 nurN/m.
12 -. -
- . Equiauion8.24 - - :‘ -. 8.4 REFERENCESU— -..;. . . . . . .
1 - — . . I . Itmim’duumn, C. amid I .uunsgcmoun.I ).(: ‘‘Imnt’luuenncc (it Very I_ow ImnterfacnalTenmsnonon RelatnvcI ‘. I - J. .j~ l’ernunemubility”, SPEJ..391-401 (Oct., 1980).
2 D munesin A Kruuius D lhcnsderson G D ansd Peden J M Vnsuah Investugattonof
- - . . . . RetrogradePirenousmenron and Gmms ComndensateFlow in Porous Media”, 5th European
4 - .. . - - . - - . - .: i: - . ‘ Synmsposiuusuon Improved Oil Recovery.Budapest(1988).
‘1 Andreis J M 11 truser E A ‘md Tucker W B BoundaryTensionby PendantDropsI’rcsensled‘ml time SOtIm (olloid Sympociuns CannhrudgeMassaclsmnsetts(June 1918)
0- ~ -0’4-,--
0.0 0.2 0.4 0.6 0.5 I .0 4. Niedcrlnmiuser,1)0. mnnsd llmumtcll, FE: “A ConectedTable for Calculatiour of BoundaryTennsionsby Pendmrnstt)rop Metlmod”. Researcimonm Occurrenceand Recoveryof Petroleum,A
DensumyDufference,g/cisr ConnIrihuutionrfrourn API ResearcinProject27, 114-146(Mar., 1947).
5. lIaniff, M.S. uunsd Pearce,A.J: “Measuring Interfacial Tension in a Methane- PropaneEugmure 8.8. Generahmsedcorrelationfor wunter-Imydrocarhonnnterfmucuallemsslon t’curotcuunu Society (imns-CorudensmsleSysteuntJsimng mi Lumser Light ScatteringTechnique”,SPE Res.Eng.589-594of CanadaCopyrigini. Reproduced fruin 371 WIl ti peru ussioni ( ~ , I 990)
6. l)orsinow RB: “TIne SiumunltmimseounsMeasuretneuntof InterfuiciaiTeursionand Oil ViscosityThe mshovecorrelmituon was evalmnatedfor estimatingthe oil-wmnter IF!’. wisicis uusdicmntedern’ors mit Resem-voir Comsdiliours for Prumdhoe Bay Fluids by Surface Laser Light Scatteringexceedumsg30%(37]. Thepresenceof surfaceactive connpommndsiii oil nsayproisuhut tlse useof Spectroscopy”SPE22633, Proc.of 66tln Ann. Conf. (Oct., 1991).ammy generalisedcorrelationwlnicim doesnsot takesmuctseffectsinto mmccount. Wiseur tine 1Ff valueat a siurgle point, often at the atmosphericconditiomss, is known, mm parallel crmrve to Ilsunt in 7. Pauresls,A , Todd, A.C , Sonsnerville, J. and Dandekar,A: “Direct MeasurementofFmgumre8.8 maybeusedto estinniate1Ff at otherpressure-teurspermltuurevmtlues 1371. InnterfmuciaiTension,Density,Voluunsne,and Consnpositionsof Gas-CondensateSystem”, l’rans.
tChensnE,68, Pant A. 325-330(July, 1990).The presenceof salts in water may alter its unterfacnal tension with oil shugintly at typicalreservoirconditions. TIne 1Ff may decrease[39), or incremsse (40) by uncreasingthe salt 8. Cmnhn, 3 W “Cu’iticah Point Wettinrg”, The 3. Chem. Physics, 66, No. 8, 3667-3672,concentrationaccordingto variousreporteddata. (April, 1977).
E.mauuuple 8.5. 9. MacLeod,D.B: “0mm a Relation BetweenSmnrface Tension, Density”, Trans. Faraday
Estiunnate tine oil-waterand gas-waterinterfacial teunsion for fluids describedmu Exununuple Soc., 19, 38-43 (1923).8.2, using thegeneralisedhydrocarbonwatercorrelatioun.
296 8. Funfrufa’niF Te,n.ciinn
hO. Mayer, SW: “A MolecularParaisreterRclaliomsslnip belweenrSurfmmcc ‘hemmsionm mmnd Liquid
Compressibility”,J. Phys.Chem.,67, 2160-2164(1963).11. Sivaraman,A., Ziga, J. and Kobayashi, R: “Correlations for Prediction of lnterfmmcialTensionsof Pure Alkane, Napthenicand Aromatic Compoundsbetweentheir FreezingandCritical Points”,J. Fluid PhaseEquilibria, 18, 225-235(1984).
12. Carey. B.S.,Scriven, L.E. andDavis, U.T: “SemiempiricalTheory of SmurfaceTensionmof Binary Systems”.AIChE, 26, No. 5, 705-711(Sept.,1980).
13. Carey, B.S..Scriven, L.E. andDavis, H.T: “SemiempiricalTheory of SurfaceTensionof Binary Systems”,AIChE, 26, No. 5,705-711(Sept., 1980).
14. Sugden,Sr “The Parachorsand Valency (Romntledge,1930); A List of Pmnrumchors”,Brit.Assoc.Report(1932).
15. Ali, 3K: “Predictionsof Parachorsand PetroleumCuts anti Pseudocommmpomrents”,J.FluidPhaseEquilibria, 95. 383-398(1994).
16. Schechter,D.S. and Guo, B: “ParacisorsBasedon Modern Plrysics mmmd Their ttses innLET Predictionof ReservoirFluids”, SPE30785 Proc. of Ann. Commf., l)mtllmms, USA (Oct..1995).
17. Baker,0. andSwerdloff,W: “Calculationof SurfaceTensions.3: Calculunlionof SurfaceTensionParachorValues”,Oil andGasJournal,53,87(1955).
18. Fanchi,J.R: “Calculationof Parchorsfor CompositionalSinnulation,Aim Update”, SPERES.ENG.,433-436(Aug., 1990).
19. Weinaug.C.F. and Katz, D.L: “SurfaceTensionof Metirane - PropaneMixtures”, I &EC, 239-246(1943).
20. Hugill, J.A. and Welsenes,Van, A.J: “Surface Tension: A Simple Correlationn forNaturalGas+CondensateSystems”,3. Fluid PhaseEquilibria, 29, 383-390(1986).
21. Ahmed,T: “HydrocarbonPhaseBehaviour”,Grulf PublishningConimpany(1989).
22. Firoozabadi,A., Katz, DL., Soroosh,11. and Sajjadian, VA: “Surface Tension ofReservoirCrudeOil/GasSystemsRecognisingtime Asphalt in the HeavyFraction”, SPERes.Eng., 265-272(Feb., 1988).
23. Brock, J.R. and Bird, RB: “Surface Tension ansd the Principle of (‘orrespoirdingStates”,AIChE, 1, 174-177(1955).
24. Guggenheim,E.A: “Thermodynamics”,3rd Ed., North-HollandPub. Co., Anuisterdam(1957).
25. Lee, S.T. and Clnien, M.C.l-l: “A New MulticonsnponentSurfmuce Tensionn CorrelationBasedon ScalingTheory”, SPE/DOE12643,EOR Synmmposiummr.Tmmlsmn (1984).
26. Fisher, M.E. and Scesney,P.E: “Visibility of Critical ExponeuntRemrornnalization”,PhysicsReviewA, 2, 825-835(1970).
27. 1-lough, E.W. andStegemeier,G.L: “Correlationof Surfaceand Interfacial Tension ofLight Hydrocarbonsin theCritical Region”,SPE3., 259-263(Dec.,1961).
8 5. Erern’i,ses 297
28. llunygens, R.J.M., Ronsdc, II. and ilagoort, J: “Interfacial Tension of Nitrogen and
Voluntile Oil Systems”,SPE26643,Proc.of 68th Annr. Conf. (Oct., 1993).29. Dmmnesh,A., Dmmnmdekar,A.. Todd, AC. and Sarkar,R: “A Modified Scaling Law andParaclnorMethodApproachfor lnmmprovedPredictionof InterfacialTensionof Gas-condensateSystems”,SPE22710,Proc.of 66th Ann. Conf. (Oct., 1991).
30. Dandekar, A: “Interfacial Tension and Viscosity of Reservoir Fluids”, PhD Thesis,Heriot-Watt Unniversity,Ediumburgim,Scotlammd(1994).
3 I. Elomnglm, E.W., Rzursa,M.S. and Wood,B.B: “Interfacial Tennsionat ReservoirPressuresand Tennperatures,Apparatusand tine W~ter-MethaneSystem”, Trans. AIME, 192, 57-60(1951).
32. Micinmmcles, A.S. mmnsd llmumuser. E.A: “lnmterfmmcial Tension at Elevated Pressinre andIeuumpermmtmmm’esII”, J. I’hys. ( ‘hncnnm.,55, 408—421(1951).
33. Ilmrssans. ME., Nielsour, RE.. Callnomun, iC: “Effect of Pressureand l’ennperatmureonOil-Wmmter hnmterfacimul Teumsiours for mu series of llydrocmmrhons”, Trans. AIME, 198, 299-306(1953).
34. JenningsJr., 1I.Y: “TIne Effect of Tenniperaturemind Pressureon Interfacial l’ension ofBenzene-WaterandNominal Decane-Water”,J. Colloid & InterfaceSci.,24, 323-329(1967).
35. Jennings.lI.Y. arid Newnnan,Gil: “The Effect of Temperatureand Pressunreon tineInterfacial Tension of Wunter Aguuinnst Metlnaune-NormmralDecaneMixtures”, SPE J., 171-175
(Jmmnse, 1971).
36. McCmuffery, F.G: “Measmnrenmnentof Interfacial Teissions and Contact Angles at Iligln‘l’eunnperatureandPressmure”,JCPT,26-32(July-Sept.,1972).
37. Firoozahadi.A. anal RannneyJr., H.J: “SurfaceTensionof Water-HydrocarbonSystenosat ReservoirConditions”, JCPT,27, 41-48(May-June,1988).
38. ilmnkinm, D.l., Steinberg.D. ammd Stiel, LI: “GeuserahisedRelationship for time Surface‘l’ennsion of PolarFimnids”, lnd. Eng. Cheun.Fund., 10, 174-175(1971).
39. Bmtrtell, F.E. mmmd Niederhmmmnser,DO: “Film-Fornning Constituentsof Crude PetroleumOils, FmnndaunenlmulResearclron Occmnrunnmceand Recoveryof Petrolemntin. 1946-1947”, API.Marylmmnd (1949).
41). Aveymnrd, R. ammd I Imuydomm. D.A: “iimennsodynannicPropertiesof Alipinmmtnclnydrocmmrhonm—Wmuter lustcrfmnces”.‘Frmmns. FarmudmmySoc., (ml, 2255-2261(1965).
8.5 EXERCISES
8.1 . Thegas-liquidinrterfmucimuh temnsionof nmsetlnane-non’unmalhmmtanenmnxture at 311 K and I 2.07MPmm is mmicasuredby tine peurdant drop usnethod. Calculatethe interfacial tennsion wlmen thedroplet dimnenmsionsmire d~=0.228and d
5=0.325mnn.
8.2. Tire vapomnr-Iiqumid equilibriumnn dunta of a five-componentgas condensateusmnxtmnre at353.1 K ins a constammtconmnpositiourexpamnsiontestaregivenin the following tables. Conmrparetine ummeumsmnredIF1’ valueswith thosepredictedby the original Weinmaug-Kali. nnetimod annd itsmodificationsEq.(8.21)by Scheclnter-GuoandEq.(8.20),andtheLee-Chienmnetinod.
298 8. !uulerfncial Tension 8 5. Erercises 299
Gascondensatecomposition.Component Methane Propane n-Pentanne n-Decaumen-HexadecaneMoleFraction 0.8205 0.0895 0.0500 0.0199 0.0201
Liquid_phase_properties_and_gas~1iguid_interfacial_t~nsion. _____________
Presuure Methane ~j nPentane_~caim~ ~ Densiny 1FFMPa Mole Fracmiour g/cnis3 mN/rn30.43 0.68130 0.1073 0.0772 0.050) 0.0774 0 480 (it 1829.06 0.6640 0.1115 00827 0.0564 0.0854 (1497 0.22927.68 0.6414 0.1133 00886 t).0634 00933 (1.513 ((.39))26.30 0.6187 0.1186 0.0940 0.0689 i),0998 (1.524 i).53624.92 0.6003 0.1208 0.1001 0.0743 0.1045 (~535 (1.738
Connparethe measured1FF vunhues witlm tlrose predictedby the Weinsaug-Katznnetlmod asmodifiedby Scheclmter-Guo,and tine Lee-Chienmethod. It hasbeen suggestedto improve thepredictionby adjustingtheparachorvalueof time plus fraction to unatch theexperimentaldata.Find theoptirnisedparachorvaluneof the plusfraction.
8.4. Estimate the interfacial tensionhelweentine gas in Exercise8.2 and water, at thegasisydrocarhondew poinl of 31.98 MPa and 353. I K. using the generalisedwater-hydrocarboncorrelation. Connparelhe resultswith thevalueobtainedby assumingthegasaspuremethane.
Vapourphaseproperties.Pressure Methane Pruu’uani~ .._n~’~nuan inc - un-t-tcxmudccauic Density
MPa MoleFraction g/cnnn33042 0.8362 0.0869 0.0465 0.0167 0.1)137 1)29829.04 0.8448 0.0863 0.0445 1)0145 0.0(199 0.27827.66 0.8512 0.0857 0(143) 1)0127 0.1(1)73 026)26.29 08580 0.0844 0.0414 0.01(18 00054 1)24624.91 0.8625 0.0841 0.0398 0.0095 0.004) - li.23 I
8.3. The interfacial tension, consnpositionmand dennsity of gas miund condenismileplnutscs weremeasuredduring a constant volunse depletionstests. ‘fine results at two pu’essuircsare misfollows:
Pressure,MPa 34.47Conm~p~nent,Mole%V~ppur Liquid V~~q9~_N2 0.65 0.4) 0.65 1)26C02 2.42 1.72 2.59 1.39Cl 78.06 49.82 78.88 35.36C2 6.71 612 6,90 5.43C3 2.99 3.30 3.04 3.36iC4 0.60 0.74 (1.59 0.82nC4 I .25 I .68 I .25 I .94iC5 0.48 0.75 0.48 0.95nC’S 0.59 0.95 058 1.23C6 1)73 I 48 (1.84 21)9Cl 1.10 2.25 .02 3.38C8 1.01 2,53 0,95 4.03(‘9 0.68 1,96 0.65 3.29ClO 0.47 1.51 0.35 2,68CII 0.33 1.22 0.32 2.26C12 0.25 1,17 1)22 2.19Ct3 0.22 1.11 0.14 2.09C14 0.26 1.21 0.16 2,27Cl5 0.19 1,16 0.13 2.11Ct6 0.12 1.01 0.06 1.63C17 0,11 0.77 0.04 1.51Ct8 0.10 0.87 0.03 1,47Cl9 0.09 0.84 0.02 1.35C20+ 0.57 15.42 0.11 16,91MolecularWeight 28.05 97.44 25.32 120.62densiny,g/crn’ 0242 0.593 0.143 0.628MeasuredIF)’, mN/rn 0.372 1.389
20.68
301
9
APPLICATION IN RESERVOIRSIMULATION
Phasebeinaviournmsodelsare usedextenisively in pctroleunsninsdustry. A nmiodel canbe used toevaluatetIne consistencyof memssuredPVT data,or to genneratesuchdataasinput in black oilreservoirsimulation. The nrodelsare also used in pipeline and weilbore multi-phaseflowcmmlcmmlmntions. Ins tIme design and operationof surface facilities, phasebehaviournnodels areennsployedto determinethe propertiesand theamount of equilibratedgasand oil. The mainapplicationof phasebehaviourmodels,basedon determining the fugacity of componentsinboth plnasesby EOS,is howeverin conmmpositionalreservoirsimulation.
in a simmrulator,thereservoiris couumuusonlydivided into a numberof grid-blocks,or cells. Thefluids witlsin eaclncell mireconsideredto he in equilibriunsat the cell pressureansd temperature.Time clnmunmgeof reservoirconditions with time is investigatedby determiningaveragevalues ineachcell during successivesusnall tinme steps. The equilibrium condition over a time stepisdeterminedby flaslm calculationsin eacls grid block. As reservoircalculationsare generallyitcrmmtive. nsnorethan oneequilibriums flash calculation per eachgrid-block at any time stepis
reqmnired. For a large reservoir,tire total numberof equilibrium flashesmay exceed manymilliouss, consunninga largecomnputumtionaltime and making the simulation very expensive.Asthe number of equations in conventional flash calculation increaseswith the number ofcomponents,seeSection 5.1, tIne nmnmberof componentscharacterisingthe fluid is conmimonlyredmncedby groupingto reduceline computationaltime.
Ann innnpou’tminnt conmsideruutionins applying a l)lmase behaviourmodel to reservoirstudies,is widerangesof compositionand pressurewimich are to be modelled by EOS. In tlre integratednrodellinsgapproach,wherethephasebehaviourmodel is to coverreservoir,wellbore,pipeline,scpmmrators,etc.. in rune sinrnuluutinn, time taskbecomeseven more stringentand tIne model ofteni’mmi Is Inn providesmil isfuiclony results. ~IImeconnnmmunnm mmppromncin is t(n calibrate,or tmnunc line nsmodel.agaiunstexperinnentaldata. lime selectionof requireddataandparametersof EOS for adjustmentin tIne tuning processandthe useof relevant methodsconstitute a major task for reservoirengineer.
Exanup!e 9.!.
Describe the C7~fraction of tine oil in Exannple 6.3, identified to C45
, by a number ofpseudo-components(using tine Whitson nmethod.
‘The last carbon nunnssherdescribing the C7
, is 45. Hence the number of pseudo-
connponcnmtsfor lime C7
, frmmction is calculatedfrom Eq.(9.I), as
N~=Integer11+3.3 log(45
-7)]=6
Thecomponenlsconnprisingeachpsemido-componentare identified by calculating themolecular weight boundariesof eachpseudo-conmponent.Using Eq.(9.2), with thegenerahisedmsnohecmularweigint of singlecarbon numbergroups,we obtain the uppermolecularweightof first pseudo-comsnponent,
M~=96{exp[( l/6)ln(539/96)JJ = 128
I iemncc,C7
, C5
mmmd (‘~. wills time last Immiving a usnolecumlarweigist of 121, are assignedtotine first psctndo-connmponmenl(gromnp). Similarly, for otinergroupswe obtain,
(;runut) No. k ~(pperM honinduury,M~ Comptunenisin Group
28
4
6
9. 1. Grouping
S(,!ustzo,n:
302 9. App/ieariouu inn Receunoir Siuuuuilatiouu
9.1 GROUPING
Theconceptof groupinghaslong been eunployed in fimukl description,html this is donenrostlydueto limitations in the compositionalanalysis. Time nrost convenmlionialnnsetinmnd is to describethehydrocarbonmixtmnre with discretecomponeurtsto nornral penltmnneand imexminses emich as asinglecarbongroupandlump all theheavyfractionsastheheplanesplmus (C
7,). Tins is not an
efficient method of describing a reservoir fluid, particularly in conmnpositionnal siumiulationstudies,where it is desirableto minimise thenumberof consmponentswinile still retainming tInereliability of predictedvaimmesby phasebehaviotnrmodels.
It is expectedthat thefluid descriptionrequirennrentvaries witim tire complexity of tine processwhich is to bemodelled. The phasebeisaviourof a reservoir fimmid unnder pressmnredepletionmay only bemodelledby two components[II, whereasmore than len eonmmponentsnnay berequiredfor miscibility studies.
Thekeypointsin componentgroupingare:
1. Thenumberof groupsrequiredandthedistributionof componentswitInin emsclngroup.
2. Theestimationof grouppropertiesrequiredin pimmuse hehmmviou.nrnniodclhunig.
3. Theretrievalof fluid descriptionin termsof the original componeurtswhenneeded.
Group Selection
Many investigators11-13] have given recomnrendmmtionson selecting tIne nuimmmsbcr of pseudocomponents(groups). In general,4-JO pseudo-conmponenrlsare consideredadequateforsimulationpurposes.
A simpleapproachis to addnitrogenandcarbondioxide, at low concentrations,to nnethaneandethane,respectively,amnd to combineiC
4with nC
4and iC
5with nC
5. TheC
7~frumction is also
characterisedby a numunherof pseudo-conrponenstsmmnmd iuscludcd.
Whitson [51 proposedrepresentingtheC7
, fraction of a mixture by N~psetndo-connponentscalculatedasfollows,
N~= lnteger[I+ 3.3 log(N —7)] (9.1)
whereN is the last carbongromnpnumber.
Theboundarybetweenmthe consecutivegroumps are basedour tire molecularweightsMk, given
M7
{exP[+]lts(?J]}m
k = I, 2 N~ (9.2)
The componentsof the original fluid with molecularweigints falling witimin Mk1 to Mk areincluded in groupk. MN is themolecumlarweightof last carbongroup.
Ill
227303404
539
303
The mipplicunlions tnf coustinstnomnsdescriptions to select 3—5 psetmdo—conmponents(nnntnlti carbongroups), unt (luadrmulnurc poimuls, discunssedin Sectionm 6.3, is time reconnnnnendedmethod ofdcscrnl)insg theincavy ensd. ‘line selectedpscmndo-comnuponenlswill be as effective aschoosingtwice asunany,selected randomlyorat equalintervalsI l4J.
Selectmng4 psemndo-connponentsby (lie quadraturemethod to describethe Ci+ fraction andfollowing line siunnple uupproacimof addinsg isonners to normal hydrocarbons,describedabove,wnll redmuce lime tolmil nsmnnmnherof coumnponenntsdescribinga fluid to aroundten. l’he numberofgrounps,however,cmnnm furtherbe reulucedparticularlyby groupingtheiiglmt fractions.
Lm cI mnl. Ill J proposedto groupcompousentson the basisof their volatility, usingequilibriumruntuos obtainnedby flmusIminng line fluid at reservoirtennperatureandtheaverageoperatingpressure.Tlmcy prcseuuteddnffercnutconTcimoiomnsfor groupinngol highl andheavycomponents.Pedcrsenetat. 1151 suuggesleultim grouup tine cousupouncuntshunsed ms nnass,llrat is, eachgroup containingmuppu’oxnnnmmmleiy tIne saumnc umumuss fumiclion. A ntnnsnherof fluids were describedby 41), 20, It). 6mmmd 3 psemmdsm—connnponnentsmmmd their smnttmratiu)n points were predicted usinug EOS. Theyconsclmmdedtlnat a 6-connsponsetntrcpucscnntationwas .cuflncient for an accmmrate prediction of thesmmtunruutiomm point. Cotternnsanand l’raumsnitz 114) used the criterion of equal mole fraction toselectgroups.
A representativefluid descriptionsis expectedwhentiregroupsareformedby dueconsiderationto thevolatility and theconcentruntionof comimponentsin time nnixture. Newley and Merrill [12],suggesteda methodof groupingbasedon minimising thedifference,L~,betweentheapparent
(‘~ ( ‘,~
C1cCus
C17
-C~2
C2
çC,uC
71.C
4s
304 9. Application in Re.’e,n’oir Si,,nu!alio,u 9. I. Grouping 305
equilibrium ratio (K-value) of the pseudo-componentandthoseof the original componentscomprisingit,
A(KIKk) (93)In tin) K1
where K~,is theapparentK-vaiueof thepseudo-componentk. definedas,
K~=!~2__ (9.4)~xii)k)
y1 andx1 arethemole fractionsof componenti in thevapourand liqunid plmmnscs mmt line salmurationpressure,respectively,andi(k) denotesthecomponentsassignedto thepseudo-eomponmentk.
In the above proposedmethod, the mixture saturationpressureand the connpositions ofequilibratedphasesat thesaturationpoint are calculatedby thephasebehaviourmodel, musingthefull compositionaldescriptionof the fluid. The componentsare thenordered mmccording totheir K-valuesandgroupedinitially by theequalmole criterion. Thegrouping is then adjustedby movingcomponentswithin theadjacentgroupsto minimisetheobjectivefmnnsctionA.
The volatility of fluid componentsat high pressureconditionns, dcpenrds run line nmmixtnurccompositionat agiven temperatureandpressmure. Altimougls time cquilihriunmn rmmtio varieswitisthecomposition,theorderof relativevolatility of componentsrcnnainms(lie saumme. ilence,somecomponentproperties,suchastheboilingpoint, critical temperature,molecularweight,or theircombinationscanbeusedto describethe relativevolatility of componentsin mu mixture. Anexampleofsuchatrendwasshownin Figure3.8.
A grouping methodbasedon the concentrationand the molecular weight, representingthevolatility, of componentshasbeenproposed[13). Theoriginal componentsare arrangedbytheorderof theirnormalboiling pointtemperaturesandgroupedtogctlserin an mnsccndingorderto form N~groupsso that thevaluesof ~ z~lnM~for all thegroupsbcconsncnearlyequal. It canbeexpressedmathematicallyas,
N~z
1InM~—(k/Np)~e
1InMj � 0 k=l,2 Np (9.5)
i(k)
N~z~tnM
1—(k/Np)~z1tnMj�0 k= I, 2 Np (9.6)
i(k) i
where z1 andM~ are, respectively,the molar concentrationand the molecular weight ofcomponenti in the mixture, fully describedby N components. The last componentin thegroupk,wouldbeeither,�ore+ I, dependingon which inequality,(9.5) or (9.6), is smaller,respectively. Methane,due to its high volatility in comparisonwitin other hydrocarbons,shouldnot begroupedwith othersexceptnitrogenat low concentrations.
A numberof 25-componentoil mixtures, Table9.1, were subjectedto single and multiplecontacttests,simulatinggasinjectionprocessesexperimentallyusing differentgases[13]. Thefluids weredescribedby variousnumbersof pseudo-componentsranging from 2 to 25 groups
using different groupingschemes.SeveralEOS were usedto simulate the test results. Theaverageabsolutedeviationsof predictedl’esuitsby differentmethodsareshownin Figures9. Iand9.2. Note that the reductionof thenumberof groupsdownto an optimum valuedid notimpairthepredictedresults.Minor improvementsby groupingobservedat sonneconditionsaredue o thecancellationof errors. It appearsthat describingtheoil by 4-6groupsis sufficient tomodel gasaddition processes.Note tisat lowering thenumberof groupsbelow the optimumvalueresultsin adrasticinnpairmentof theresults.TheaboveconclusionswereindependentoftheemployedEOSandgroupingnrethod[13].
a5
C
C
0
C
4:Si,
V>
4:
Figmnre 9.1. Effect of tIne nsunnsbcrof groups describing fluid on predicted results by tineValderramamodificationof Patel-TejaEOS,usinggroupingmethodof Eq.(9.5-6).
30
—. - ‘~ ttl,uck Oil)B) & Memtsane
25 ‘~‘-‘—O’—— Black 011(13) & CarbonDuoxjde
‘‘•‘-- Black()it)A) & Rich Gas2))
Numberof Groups
C0
0V
C
C
.0
4:
Numberof Groups
Figure 9.2. Effectof thenumberof groupsdescribingfluid on predictedresultsby tire Peng-RobinsonEOS,musing eqmualunolefractiongrouping.
306 9. Appli’caiiauu mu Re.o’rcoirSiuuuulalion 9.!. ~ 307
A comparativestudy [13) of variousgroupingmethods,using 4 or 6 groups, indicated apreferencefor themetlmod describedby Eqs.(9.5-6)to that by equmal mole frmrclionm, with liroseof equalmassfractionandLi et al. [Ii) astheleastreliablemetimods.
Example 9.2
Describethe oil reported jim Table 9.4 by three pseudo-compoineuntsfor a numeilmanne gunsinjection study am 373 K, usingthe methodsof equalnsass.equnmnh numole. eqnu;mt ,,lusM, anudNewley-Merrill.
Table 9.1.Compositionsandpropertiesof model fluids mit 373 K.
‘nuuruponenn Black Black Votauile Vutauulc kuclu ( musuuu,,1c9 011(A) 011(13) 011(A) 011(0)~t 4680 36,14 74.17 73.33 69.82C2 8.77 12 17 5.32 5.35 I 5.0’)
(3 7.44 8.05 4 (,7 4.71 11.1)1nC4 4.01 5.13 t 2,58 2.62 5.99
nC~ 2.56 4.79 0.97 1.00
nC6 .77 3.81 0.69 ((.71McI Cyct Pent 2.25 1.43 0.88 0.91Cyct Hex 2.20 .45 0.86 ((.89nC7 0.46 0.36 0. I 8 0. 19Mci Cyct Hex 2.36 2.49 0.94 0.98‘J’,,luene 0.72 0.76 0.28 0.30nCg I .02 I .08 0.4I 0 42
oXylene 1.79 - 0.72 0.75nC
91.66 3.16 0.66 (1.70
nC~ 2.73 2.29 1.11 1.17
nC1
237 1.91 0.96 .1)2nC 12 2.04 1.74 0.83 0.89
nCI3 1.77 1.47 0.73 0.78nCI4 1.53 1.32 0.63 0.68SCIS 1.34 1.22 0.56 0.60
nC16
1.15 ((.95 0.4% 052nCl7 099 0.85 0.42 11.45nCtg 0.87 0.67 0.36 0.39nC
1g 0.75 0.57 0.32 034
nC2O t).6S 1)48 0.27 0.30nC24 - 5.03 - -
Sat. Pres.,MPa 20.28 15.43 32.78 32.70Sat, Denns.,,g/cnnm” 0LQ~_~.0.)2_8....PreSsU!~MPa— Densuiy,,glcm’
20.79 0.542 0.593 (1.19224.23 0.550 0.601 0.21727.68 0.557 0.23731 . 1 3 0.564 0.25534.58 0.569 0.613 0.390 0.399 0.271
Solution:
Methaneis selectedasGroup-I. particularly as tine grouping is for a nselhmunle iunjcctionsnudy andthe rest is groupedinto Iwo pseundo-componensts.
Equunl mole mmnetlsuxl:The total mole% of (‘irouup-lh anid (6roump-tll is equmal to 52.802%,with an objective valuefor eacim =52.802/2=26,401. Addinug coruspounents from C
7downwards,Gronmp-l will
conmsist of C,-C,. wills 23.091 nsnole% and lime rest, C4
-nC,0
with 29.711unrole%, inGrouup-llt.
1~qunmilweight(mnrass)umnethod:TIne wemglnt of cads comnponneuntis calcnlanedas x,M,, with the total weight of C
2-nC,,,for
100 kguunotes of oil ~ s,M,= 4692.2 kg. ‘l’hc objective weiglnt of each group is=46922/2=2346.I . Aildimsg counmponeunmsfrousi C”, downwards.Group-I will consisn ofC,-nnC,, with a weiglnl of 2219.1 unmnd misc rest, nC,
7-usC
75with a weight of2473.I, in
Grouup-Itt.
h~ituumuIxlnnM, nuseltuod:‘lIne vuitune for cacti c’onsmpuunncuut us d’mnlcimlancd. wutln tIne total valume for C,—nC,,,, ~ x, mM, =
223.53. The ohit’cljvc v;nlune of cacti gruumup =223.53/2=111.77. Adding components0 unsu (‘7 downnwards. ( ronnp-I wull conmsnSi of (‘
7~nC,wntln ~ x , InM, = I I I .66 uunsd the rest,
ui(’,—us(’,,, winlu mu value iui 111.87. mum Griumup—Ill.
Newley-Merrill nmielhod:Tine conspositionof vapouir mit tIne bubblepoint umrunst be calculatedusing a tuned phasebehaviour model, as suiggesled by the mmulhors. In this example, the measuredcomnnposilionmof the vapour,asreportedin Table9.4 is usedinstead.
TIne conmnponenmtsof C,-mnC,,,are initially groupedinn two by equnal mole and K’ and A arecmulculumted unsiung t:qs.(9.4) mnusd (9.3), respectively. Tine first coursponent of Gronnp—llt is
nakens innno (Jm,uui~-II unnud line corresponding valnne of A is re-calculated for the new
grouping,tmunlil tIne lowest value of A is unClnieVe(I. llse calculation resultsfor tIme first andlIne Imusn few iteralionssunre slmowns in tIne following Tumble.
Coun1
u.. 11,0? ‘5. 5 ~
C2
II.~I81 .767
K, G.tm,A,
.895741.012132 0.75992 0.07038 0.07471 0.08350
(3 It 473 9 1)41 (1 713802 1.97594 (1.00310 0.00436 0.00742nC
47.059 4 34! 1) 61496 0.41211 1)04412 0.03874 0.02927
nC~ (.295 (1.634 11 48’)S13 0.302711(1.27036 0.25335 0.22184
uuCt, 0.982 (1.389 039613 (1.197280 77178 0.73610 0.66912MeuCycI Peal .297 (1.461 I) 35544 (1 t 4480 1.19S93 1.14637 1.05297CycI tIes 1.31)1 0 422 1) 32437 0.1036 1.67476 1.61043 1.48893iC7 0.279 0 090 0.32258 ((.101)76 1.70778 .64246 1.5 m 907Mel (‘yci mmcx m 463 1)423 0 28913 0.056872.47649 2.38868 2.22241i’,,lncne 0.448 1) 125 (1 279(12 0.044462.77883 2.68242 2.49976nC
80.648 0 174 (1.26852 0,03240 0.267673.03090 2.82908
o’Xytcne n .199 0.2154 0.22018 0.00000 0.16927 0.192545.15626n(’9 1.112 0247 022212 0.00008 0.17352 0.19686 0.23198unClO 1.923 0 353 0.18357 0.03979 0.08645 0. t0683 0.13896nCl u 1,73) 0.261 0.151(61 0.21343 0.01946 0.03223 0.05546
~~‘t2 1.545 0 192 0 12427 0.59566 0.00183 0.00003 0.00540nCt3 .382 0.t44 0.10420 1.23910 0.05942 0.03457 0.01103nC
14t.2t9 0.119 0.09762 1.57626 0.10728 0.07065 0.03220
nC1~
1,0139 0.082 0.0751)1 3.70233 0.St997 0.41096 0.27994n(’tó (1.956 006t 0.06581 6.00615 .06303 0.87721 0.647t6nC
1~ 0.833 0 045 0.05402 9.46080 1.95706 I .65741 1.27992
nC1
g 0.715 (1.034 (1.04626 m4.1364 3.24556 2.79316 2.21718SCI9 ((.646 0.025 0.1)3870 21.991% 5.51658 4,80937 3.90131nC2O
Toial A
0.567 0019 0.03351 31.0331 8,22194 7.22300 5.9339494.12547 32.40257
G-III, A, G-It. A, G-ltl, A, G-lt, A G-ttt, A, G-tt, A, (3-lit. A,0.220180.744140.1296II0.73600 0.12357 0.72016 0.1 1514
32.01332 32.5 1408
308 9. Applncatioin jim Reservoir Sinuuilation 9.1. Grouping 309
Themostcommonmethodis molaraveraging.
°k ~(in)
wherexk is themole fractionof groupk in themixture,
xiiilk)
= .!.~~xmxj(vJ+8 i(k))(k)
T5, = j ~ +cii ilk) ;hk)
ZCk = 0.2905— 0.085
= Z~RT~/ van,
b~ihkl ilk I
en, = ~ ~x1x1(c,~ + c1~)‘ / x~ilkl
= ~
(nh
0, =ilk) (k)
wineretIme weiglnting fmictor,q~,is definedas.
p =(x~y~)’’2= 7.~(K)~
The lowestvalue ofA is achievedwhen componentsC,-nC~are includedin Group-Il,withXylene-nC~in Group-Ill.
Group Properties
Severalmethodshavehenproposedto calculatethepropertiesof pseudo-compommentsrequiredin EOS[4,5,lO,l2,l5].
(9.7)
(9.8)
9 representsthecomponentproperty,suchas the critical properties(Ta, P~,v~,Z..~),acentricfactor,or themolecularweight.
Pedersenetal. [15] suggestedusingthemassfrmmction iimsteumdof tIne tmmolc frunctionn inn Eq.(9.7),whereasWu andBatycky[10] proposedto calculategrouppropertiesby a connhinnationof massandmoleconcentrations.
The Lee-Kesleraveragingmethod for critical properties[16,17] hasalso been used in theindustry,
(9.14)
(9.15)
wherea~,hk andck, aretheparatn’ietersof EOS for thepseudo-cotrmponentk.
Time binary interactionparametersbetweenthe pseudo-componentsof k and q,. aredeterminedfrom,
k�q (9.16)
A comparisonof time abovemethodsdid not indicate a clear preferencefor anyof them (13].The results dependedon the selectedEOS and the number’of pseudo-componentsused todescribethefluid, probablydueto thecancellationof errors,as inrprovementsrelative to thosepredictedusingtIne full compositionwer~alsoobservedat someconditions.
Grouping is commonly conductedaccordingto the concentrationof componemmtsin the feed,oflen tine original reservoir flmuid. This approachis jmnstilned in predicting the single phasevolumnnclric bclnavhntnr mnnd to sonnmeextentthesaturatiounpressure. It, Imowevcr, dcterioralesinnflasin calculationswiseretine disti’ii,ution of componentsin each pseudo-consponentwill bedifferent in the two plnases. Tinis can causeproblems,particularly for gascondensatefluidswheretheretrogradecondensatephaseis overpredicted,asthe propertiesof the heavypseudocomsnponentsarethoseof tine originalgasandnot thefornimedliquid.
NewleyanndMerrill [12] suggestedto calculatethe critical propertiesand the acentric factor ofpseud~-connnponentsusing a weiginting factor, basedon splitting of the original fluid at itssaturationpoint,
(9.17)
(9.18)
where, x~,y, aretine predictedussolefractionsof connponenti, usingthefull descriptionof thefluid, in time liquid andvapourat thesaturationpoint, respectively,with the equilibrium ratio ofK andzj is themole fractioun of componenti in thefeed. Theauthorsalsosuggestedusingtheaboveweiglnting fmnctor, insteadof time mole fraction, in Eq.(9.16) to calculate the binaryimmtermuction punrumnnnelcr.sbetweenthepsemndo-components.
Ncwley mmmd Merrill 1121 conn’npmmredIlmeir proposedgroupingmetinod with equal urnole fraction,eqxnal mmmuussfractiousandtinmmt of Winitsons. l’hey appliedEq.(9.17 ) to tlneir own nuetisodand timeitnolar averagingto otlners to estiunnate thepropertiesof groups. The study for a lean gascondensatedenmmonstraledtime stuperiorityof their method.
(9.9)
(9.10)
(9.11)
(9.12)
The molecularweight andthe acentric factor arecalculatedby molar averagingin the abovemethod.
Thecalculatedpropertiesof pseudo-componentsarcnot directly incorporatedin immost EOS,butare usedto calculatethe parametersof EOS. hence,applyiumg mixing rules directly to tineparametersof original componentsto calculatethe parametersof pseudo-counpoumentsseemsareasonableapproach[13],
= ~,~x,x1
(i — k1
)(a,a1
)2/x~ (9.13)ilk) jIkI
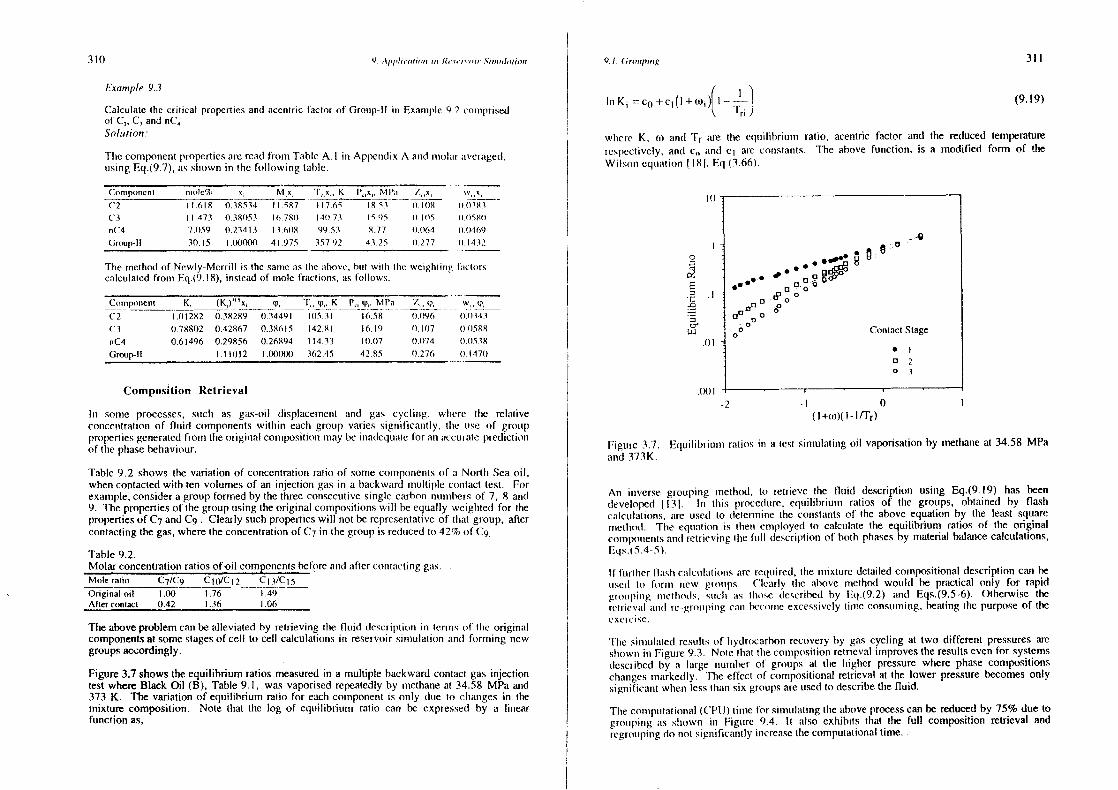
310 9. ..lpp!i,’,ilii,iu I,, I,’, ,,‘,‘,‘oi, ,5j,,i,,/,,ij,,i, 9. I. (rounping 311
E.eanuple 9.3
Calculatethecritical propertiesand acentric factor of Group-Il in Exausnplc9.2 comprisedof C,,C, andnC,Solution:
Thecomnponentpropertiesarereadfrom TableA. I imm AppendixA and umiolmur averaged,usingEq.(9.7), as shownin the following table.
Componenl nsolc% s Mx, Tx,, K t’~,s,Mt’a 7.5(2 11.61% (1.38534 It 587 117.65 18.51 11.11(8
(3 11473 ((.38053 16 780 14(1.73 ISIS 11)05
nC4 7.059 0.23413 13.608 99.53 8.77 0.1164
Group-Il 30.15 1.18)000 41.975 357 92 43.25 (1.277
(1(1181(1(158(1
((.1(469
((.1432
Tise methodof Newly-Merrill is thesamnneas line above,hint wilts tIne weighliiug factorscalculatedfrom Eq.(9.18), inssteadof nnole frunctions, uns follows.
Cousmponenst K, (K)”s, up, T~,up. K105.31
P~,up. MPa
6.58
Z~,up,
0.096
w~,‘p
((.0343C2 1.01282 0.38289 0.34491
C3 (178802 0.42867 0.38615 142.81 16.19 (1.11)7 (1.0588nC4 0.61496 0.29856 0.26894 114.33 1(1.07 0.1(74 11.0538
Group-lI 1.11012 1.001(00 362.45 42.85 (1.276 (1.471)
Composition Retrieval
In some processes,suds as gas-oil displacement and gas cycliung. wlsere tIne relativecotncenntratiommof fluid componentswithin each gromnp varies significmsnmtly, the use of grouppropertiesgeneratedfrons theoriginalcommsposilmonumsaybe iuma(Ieqlnmnlefor mm unccurunlepredictionof thephasebehaviour.
Table9.2 shows tire variationof concentrationratio of somecouiiponcntsof mu North Seaoil.whencontactedwith ten volumesof an injection gas in a backwardmultiple comitact test. Forexample,considera groupformedby thethreeeoussecutivesinglecarbonnunnbersof 7, 8 and9. Thepropertiesof thegroupusingtIme original compositionswill beequallyweiglmted for thepropertiesof C7andC9. Clearlysuchpropertieswill not be representativeof Ilnat group, aftercontactingthegas,wheretheconcentrationof C
7in (hegroup is reducedto 42%of C
9,
Table9.2.Molarconcentration ratiosof oil componentsbefpreunn(I umfter cormtmicting gums.
C1~
/C15
I .49Molerauio C
7/C
9ClO/CI2
Originaloil 1(10 I .76After conuact 0.42 1.36 1.06
Theaboveproblemcan bealleviated by retrieviung time fluid descriptionims lerms of line originalcomponentsat somestagesof cell to cell calculationsin reservoirsinmulation andforming newgroupsaecordingly.
Figure3.7 showstheequilibrium ratios measuredin a multiple backwardcontactgas injectiontestwhereBlack Oil (B), Table9.1, was vaporisedrepeatedlyby tsmethaneat 34.58 MPa and373 K. The variation of equilibrium ratio for eachcomponentis only due to clmatnges in themmnixture composition. Note that the log of equilibrium ratio can be expressedby a linearfunction as,
1mm K1
=co+c1
(l+wi)(l_1J (9.19)
where K, (n) and Tr mire tine e.qruilihriunmm ratio, acentric factor and the reducedtemperaturerespectively,and c,, aind c
1are constants. The above function, is a modified form of the
Wilson equation 18], Eq.(3.66).
-l 0(I+m~~)(I—h/Tr)
Figure 3.7. Equihibriuimn rmntios ins un test simulmntinng oil vaporisationby mettmaneat 34.58 MPaand 373K.
An inverse groupinsg ussetlsod. to retrieve the fluid description using Eq.(9.I9) has beendeveloped1131. Ins (isis procedure.equilihriumn rmmlios of time groups, obtumined by flashcalculuutions,are used to detenisiimre the conslanntsof the aboveequationby tIme least squareimsetlnod. Tine equnalion is tiseum eunployed to calculate the equilibrium ratios of tlsc originalconsnponsentsand retrievimng tine full descriptionof both phasesby material balancecalculations,Eqs.(5.4-5).
If fn.urtiser flmnsim cmmlcmnlmmliomss are required, time imnixture detailedcompositionaldescriptioncan bemused lo fornnn unew gnotnps. Clearly tine above melirod would be practical only for rapidgroimpiung umnetlnods, such as lisose descrnhedby Fq.(9.2) and Eqs.(9.5-6). Otlrerwise tinerclnicvmsl umund re—grusupinngcaur k’(uule excessnvelyIinnse consunisiung.beatingthe purposeof theexercise.
Time sinsulaledresults of hydrocunrhonrecoveryby gascycling at two different pressuresa.resisownmims Figure9.3. Note thmml tine conmpositionretrieval improvestheresultseven for systemsdescribedby mm large number of groups at the higiner pressurewhere phasecompositionschangesmarkedly. Time effect of compositionalretrieval at the lower pressurebecomesonlysignificantwhen lessthanrsix groupsareusedto describethe fluid.
Time conspuitationuml(CPu) timnne for simulatingtIme aboveprocesscanbe reducedby 75% duetogroupiumg mns shown ins Figure 9.4. It also exhibits tlmat tine full composition retrieval andregroupingdo not siguiificumnhyincreasetInecompulationaltime.
0
em
3: .1
.01
.01 II
---a
On i~’0
ua o0
000 ContactStage
02
03
312
(aa,0UU
+enI-)
80
60
40
20
0
9. Applucatio,u inn Remn’rnoir Si,unulat join
0 5 10 IS 21) 25
Numnunherof Grinups
Figure9.3. Effect of compositionretrievalon predictedrecoveryof C3
.1
. fronms Volatile Oil A bymethanecycling at 373 K.
0C0
Ua,,U
EI-.
0.0
••~~••~~•wimh Reir. 20.8MPa
- wiihouni Reir. 20.8MPa
Is 205 10Numberau Groups
Figure9.4. Computationaltime of simulatingnmiethanecycling.
Example9.4.
The oil reportedin Example9.2 was flashed mmm the reservoir temperatureof 373.0K. Theoil wasdescribedby methaneand two componentgroups,using the equal zlnM isnethodandmolaraveragedproperties,as given in Example9.3. The predictedresultsby a phasebehaviourmodel, using the above fluid description,are given in the following table.Calculatethe compositionof equilibratedphasesin termsof the original components.
Group FeedComp. Oil Comp. GasComnmp. EquilibriumRatiomolefraction
l(methamme) 0.47198 0.28419 0.71332 2.5100II (C
2-nC
4) 0.30150 0.32964 0.26533 0.8049
llt(nC5
-nC2O) 0.22652Liquid mole fracnion=0.56239
0.38616 0.02135 0.0553
9.1. Grouping 313
Solution:
‘l’he critical teussperatureand acenntric fmsctor of the threegroups are calculatedby molaraveragingand Ihe coefficientsof Eq.(9.19)are determined.
Group T,, K Tr acentricfacior (l+w)(l-IIF,) Ink —
I (nuicilnamue) 19(1,56 1.95739 0.0115 0.49474 0.920282Il (C,-nC
4) 357.92 1.04214 0.1432 0.04623 -0.2181145
III (nC,-nC2O) 626.67 0.5952I 0.4861 -1.01066 -2.894982
lnK~=_0.334l6+2.534l(I+Wi)(l_~~~_)
Smnhstimniing tIne muccintric factor and reduncedtcrnnpcruntmurcof e~ncinconuponentin line aboveequnalionresuIns inn mime cqniilibriuinn man ios of tine original coumnponemmts.
lIme conmnpiscncnmthuiluuumcefur emuch connnponentresultsinn,
7. Ix, = nL +(t— nL)K1
Substitutingnu. =0.56239in theabove.
7.,/X~=0.56239+0.43761K,
the commmpositionof equilibratedphasesarecumlculatedas shownin thefollowing table.
Connponent.mole ‘5 (t+w)(l-tIJ’,) K, x, y1
C1
0.49474 2.50819 0.28657 0.70604C
2(1.19950 1.18696 0,10824 0.12620
C1
(1.01)979 0.73393 (1.13087 0.09435
nC4
-(1.16771 0.46807 0.09273 0.04264nC
5-(1.32445 0.31463 0.01864 0.00576
nC6
-0.46958 0.21781 0.01505 0.00322Met Cyct Pent -0.52701 0.18831 0.02027 0.00375Cyct flex .0.511654 0.16194 0.0207I 0.00329
nuC7
.1160492 0.15457 0.00446 0.00068Met Cyct lies -11.65952 0.13460 0.02373 0.00314‘riuluene -(1.74148 0.10936 0.00740 0.00079
nCg -1)73432 0.11136 0.01069 0.00117
o-Xyteume -0.91)576 0.07212 0.02035 0.00144
nC9
-(1.85759 0.0814% 0.01874 0.00150nC
10-((.97900 0.05991) 0.03293 0.00194
nC11
-1.1)9131 0.04506 0.03001 0.00133
nC12
-l.2t)449 0.03383 0.02698 0.00090nC
11-1.30953 0.02592 0.02428 0.00062
nC14
. -1.40954 N 0.02012 0.02151 0.00043
nC~5
-1.51451 0.01542 0.01929 0.00029
nC16
-l.(,115o 0.01206 0.01697 0.00021)nC
17-1.72225 0.00911 0.01482 0.00013
cC18
-1.81626 0.00718 0.01310 0.00009nCi
9-1.91179 0.00563 0.01153 0.00006
nmC20
-2.1)1937 0.00429 0.01013 0.00004
Winln Retr. 34.58 Ml’s— * ~—‘ without Reur. 34.58MPa
“~‘ wIth Reir. 20.8MPa~—~a—Wiuhoui ReIr. 20.8Mt’a
*--.-.-~-e
g
25
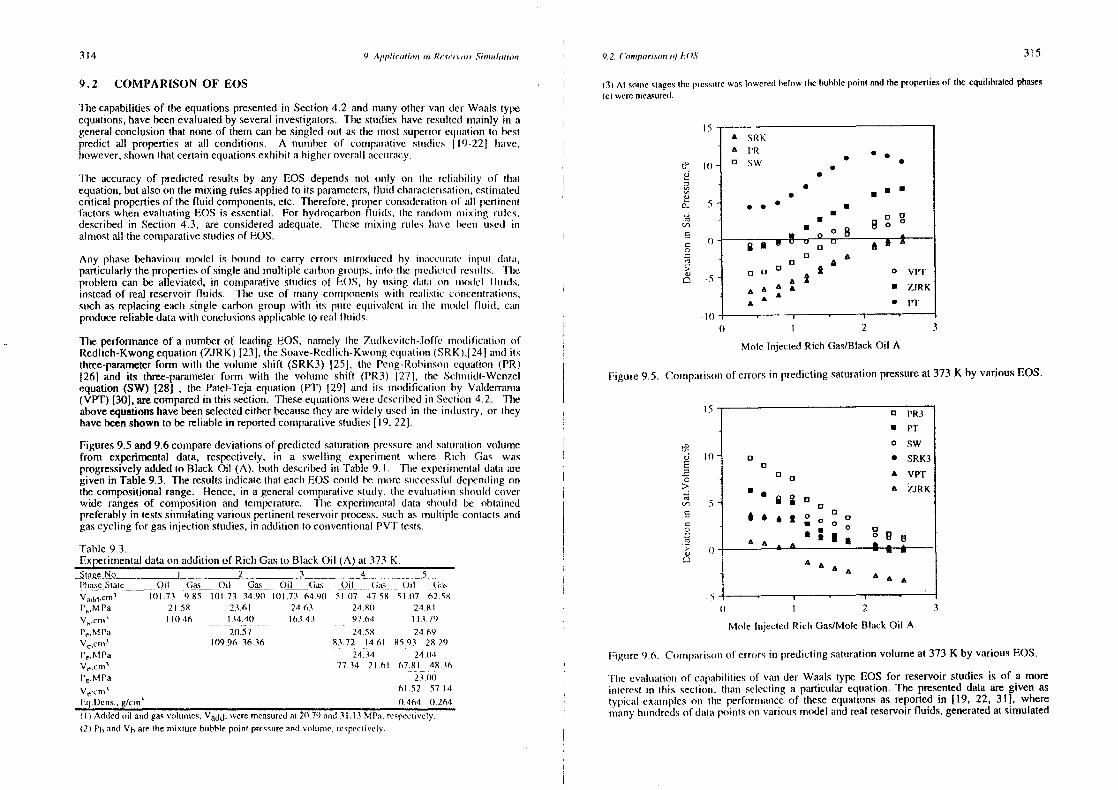
314 9. ,4pp/ucoli,nu in Ri’,s,’,oij; ,Sipnu,hutj,,,u 9,2, (‘o,mupari.smi of I’A)S 315
9.2 COMPARISON OF EOS
The capabilitiesof tine equationspresentedin Section 4.2 andmany othervan der Waalstypeequations,havebeen evaluatedby severalinvestigators.The studueshave resultedunainly in ageneralconclusionthat noneof them can be singled out as the nmnoststuperiorequmationto bestpredict all propertiesat all conditions. A number of conmpmnrativc sltmdies 19-221 Imunve,however,shownIhat certainequationsexinihit a higiner overall muccunracy.
The accuracyof predictedresultsby any EOS dependsnot only oun lIne n’climmhihity of thmmlequation,but alsoon themixing rulesappliedto its parameters,fluid clnaracterisation,estimatedcritical propertiesof thefluid components.etc. Therefore,properconsidermmtiounof all pertinemstfactorswhen evaluatingEOS is essential. For hydrocarbonfluids, line rmnmmdonnn usuixing mimIcs.described in Section 4.3, are consideredadequmite. Tinese nriximsg mimics hmmuve bceun used inalmost all thecomparativestudiesof EOS.
Any phasebehaviourmodel is hotnnd to carry errors intro(htnced by inmmnccumn’mmIc imnptnl (Immlun,particularly thepropertiesof singleand multiplecarbongroups,inmto tine predictedrcsunims. lIneproblem can be alleviated, in comparativestudiesof FOS, by unslung dala 11mm umnodcl fluids,insteadof real reservoir fluids. The useof many componenrtswith remnlistic c(utsceuntrumlionms,such asreplacingeaelm single carbongroup with its ptnre cqunivmmlent its tIne nun(sdcl fluid, dunnproducereliabledatawitin conclusionsapplicableto remnl fluids.
The performanceof anumberof leading EOS. namely the Zumdkevitcin-Joffc umsodiincmition ofRedlich-Kwongequation(ZJRK) [23], theSoave-Redlich-Kwongequmation(SRK),124Jmmumd itsthree-parameterform with the volume shift (SRK3) 1251, the Penmg-Rohinsouseqdnation(PR)(26] and its three-paramelerform with the volumnme shift (PR3) 1271, the Sclsnnnielt-Wcnzelequation (SW) [28] , tine Patel-Tejaequation(PT) [291 annd its nnodilmcation by Vmsldcrranra(VP’F) [30], arecomparedin this section, Tineseeqinationsweredescribedin Sedlion 4.2. Tineaboveequationshavebeenselectedeitherbecausetlmey arewidely rused in time indiustry, or theyhavebeenshownto be reliablein reportedconimparativestudies[19, 22].
Figures9.5 and9.6 comparedeviationsof predictedsaturationpressureand smmturumtiomn volunnefrom experimental data, respectively, ium a swelling experinment wlnere Rich Gas wasprogressivelyaddedto Black Oil (A), botim describedin Table 9. I. The experinnentaldatum arcgiven in Table9.3. TIre resultsindicatethaI eachEOS could be nnore successfuldependiumgon
tIne compositionalrange. Hence,in a generalcotsipmmrativestudy, the evakiation should coverwide rangesof composition and temperature. Time experiummermlmml data sisouuhd be obtainedpreferablyin testssimsrulatingvariouspertinentreservoirprocess,suchas nmuubtiple contactsandgascycling for gasinjection studies,in additionto conventionalPVT tests.
Table 9.3.Experimsncntaldataon umdditionof Rich Gasto Black Oil (A) at 373 K.
PhaseState Oil Gas~ . 5
Oil u;~.51(17 62.58
Oil Gas Oil Gas1(11.73 (14.9(1
Oil Gas5) 07 47 58V
5d
4,Cin’ 1(11.73 9.85 101.73 34.9))
t1
,MPa 2)5% 23.61 2463 24.80 24.81
V5
.cm’ II)) .16 — 134.40 163.43 97.64 11.1.7’)
P~.MPa 20.57 24.58 24.69Vc,cunui 11)9.96 36.36 83.72 14.61 85.93 28.29Pe.MPa 24.34 24.04V~.c[ns
177.34 21.61 (~7.8l 48.36
P~.MPa 25.1%)
V~’cisu’ 61.52 57 14
Eq.Dcns.,g/cuss’ 0.464 0.264
(I) Addedoil and gasvolumes, V5
dd, weremeasuredxi 20.79 and 31.13Ml’s. rcspccuive)y.(2) Phand Vh areulse nsisuurebubblepoint pressureandv,,tumc, respectively.
Mole Inujected Rich Gas/MoleBlack Oil A
Figunre9.6. Connmpumrisomnof errorsin predictingsaturationvolume at 373 K by variousEOS,
‘l’lie evaluationsof capumbilitiesof van der Waals type EOS for reservoir studiesis of a moreinlerest in tlnis sectiomn, than sclectinmga particular equation.The presenteddata are given astypicmml exumummples on the perfornsnmmmrce of Ihese equalions as reported in [19, 22, 31], wherennanyfmunndrcdsof dmntuipoinlson variousnrsodel and realreservoirfluids, generatedat simulated
(3) An sonnesnagesnhc pressurewasloweredbelow nhe bubblepoiunt andIhe propertiesof nbc equilntmraledphases(e)werenicasured.
IS£ SRI<A l’R
1: ° :“...:;:: ::
~en
* 0 vp’rAt
A A A • ZJRKAA • PT
It) •0 I 2 3
Mole InjectedRich Gas/BlackOil A
Figure9.5. Cousmparisomrof errorsin predictingsaturationpressureat 373 K by variousEOS.
5)
E
C>
emcc,CC0
em5)
0
I’S.
ho
S
1)
-s
O t’R3• PTO SW
o • SRK3a
A VPT• A ZJRK
00
aU 0~ a
0~9
a
2 3(I
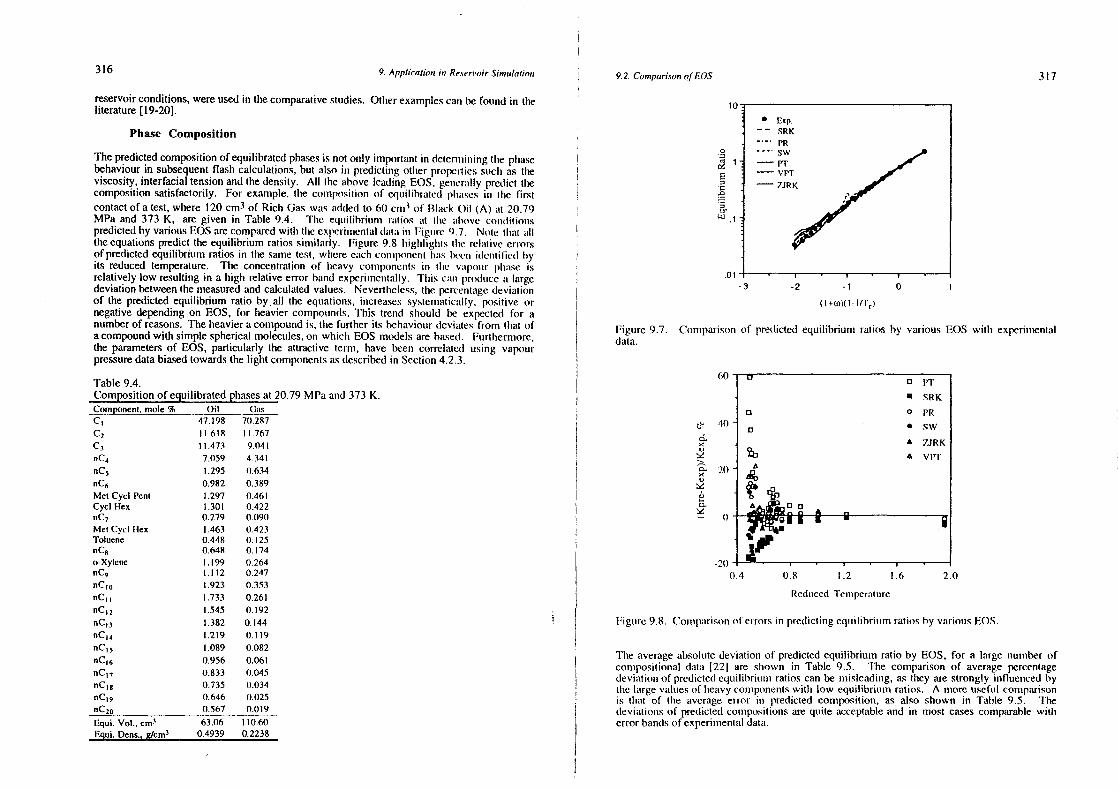
316 9. Application ui Re.aersoir Sipnudaiion 9.2. Comparison of LOS 317reservoirconditions,wereusedin thecomparativestudies. Otimerexamplescanbefound in the
literature[19-20].
Phase Composition
Thepredictedcompositionof equilibratedphasesis not only importantin deternnminingthephasebehaviourin subsequentflash calculations,but also in predictimmgotlner propertiessuch as theviscosity,interfacialtensionandthedensity. All the aboveleading EOS, gemmerally predict thecompositionsatisfactorily. For example,the compositionof equilibratedplnmuses in tIme firstcontactof a test,where 120 cm3of Rich Gas wums addedto 60 cmn
3of Black Oil (A) mtt 20.79
MPa and 373K, aregiven in Table 9.4. TIne equilibrium ratios mnt lime muhove conndilionmspredictedby variousEOSarecomparedwitin time expcrinncnrlaiclmilmi inn Figure i)], Note Ilnat alltheequationspredict theequilibrium ratios similarly. Figure 9.8 imiglnligints line reluntive errorsof predictedequilibrium ratios in the sametest, whereeachconnmponemmt inmus lmecmm idetmlilied byits reduced temperature. The concentrationof ineavy consnponenmlsin tine vapour pimmuse isrelatively low resulting in a high relativeerror band experinnentmmlly. This cans producemm largedeviationbetweenthemeasuredandcalculatedvalues. Neverilneless,tine percemmtagedeviationsof the predictedequilibrium ratio by.all the equations,increasessystennatically,positive ornegativedependingon EOS, for heaviercompounds.This trend slnould be expected for anumberof reasons.Theheavieracompoundis, thefurtimer its behaviourdeviatesfrom tlmat ofacompoundwith simplesphericalmolecules,on which EOS modelsarebased. Fum’timernnore,theparametersof EOS, particularly the attractive term, have been correlated using vapourpressuredatabiasedtowardsthelight componentsasdescribedin Section4.2.3.
Table9.4.Compositionof eguilibratedphasesat 20.79MPaand373 K.
Gas
70.287Component,mole % OilCm 47.198C
211.618 11.767
C5
11.473 9.041cC
47.059 4.341
nC5 1.295 0.634nC
60.982 0.389
Met Cyct Pent 1.297 0.461Cyct Hex 1.301 0.422nC
70.279 0.090
Met Cyct Flex 1.463 0.423Toluene 0.448 0.125nCg 0.648 0.174o-Xyteune 1.199 0.264nC
91.112 0.247
nC~0 1.923 0.353nCmu 1.733 0.261nCi
21.545 0.192
nCun 1.382 0.144nCm
41.219 0.119
nC~ 1.089 0.082nCi
6 0.956 0.061nCii 0.833 0.045nCug 0.735 0.034flCn
9 0.646 0.025
nC20
0.567 0.019Equt. Vol., cm
363.06 110.60
E~ui.Dens.,g/cmtm
0.4939 0.2238
0
‘1
EC‘as
0’w
10’
• Exp.—— SRK- ‘-. PR
—— —. SW1’ —p’~
— VI’S’
— ZJRI(
.05
(I +w)( I - lrrr)
Figure9.7. Consparisonof predictedequilibriunm ratios by variousEOS witim experinmnenlaldata.
0.U
0.ad5)
0.
60 —a
O PT
• SRK
0 O PR40 S SWen
£ 7.JRK
a vi’i~2t)
A- .~-0 0
t)q ti~.
0.4 0.8 1.2 1.6 2.0
RedmncedTenmperature
Figure9.8. Comsnpmmrisonof em-ron’s in predictingequilibritum ratiosby variousEQS.
TIme averageabsoluntedeviationof predictedequilibrium ratio by EOS, for a largenumberofcommnpositionaldata 122] ame slnown in Table 9.5. The comparisonof averagepercentagedeviationof predictedequihihriummnnratios canbe misleading,as tlmey are strongly influencedbythe lmsrgevaluesof lneumvy counmponentswith tow equmiiihriummn ratios. A nmoreunseftul commmparisonis thmmt of the averageerror in predictedcomposition,as also shown in Table 9.5. Thedeviuntiounsof predidledcompositionsare quite acceptableand ins most casescomparablewitherrorbandsof experinnientaldata.
-1 0 n
318 9. App(ueotio,i in Rise, ,‘oir Sunuualao,,,i 9.2. (‘onupari.son of ADS 319
Ahmed[19] comparedtheperformanceof eight EOSfor predicting lIne pinmmse belniviotur of tenreal gascondensatesystemsafter matclming the dew point of cuiclr fluid by adjuslinmg tineinteractionparameterbetweenmethaneand lIme plums fractioun. All line mubove lcmmdimsg EQSpredictedthe concentrationof major componmenlsof tise vapour pisaseun counstannl voltununedepletiontestswithin adeviationof 2%.
Table9.5.Averageabsolutedeviationsof predictedequilibriumratio andcompositionfrom experimnmental.
Equit.ratio OnI Gas
Equation % mokfracuonSRK 16.27 0(1021 0(1018SRK3 16.45 0.0021 0(8)17PR 18.35 (1.0019 0.0011PR 3 18.56 0.0019 0.0011SW 17.17 0.0020 0.0014PT 22.70 0.1)02(1 0.0012VPT 21.72 0.0014 0.00117JRK 14.61 0.0014 0.0012
Considering typical errors no measurungcompositionsin tests suclm as colmstmnmrt volunsmedepletion,differential liberatnonand gascycling, thepredictedphuusecompositionsby EQS forproperly characterisedfluids could he as reliable as line cxpcrimsscnnlal dmita. 1’Iuc errorsassocumstedwulin n’r’ueasum-edconspositionaldatum of equilibrumledphasesuising poor Practiceswenddescribedinn Clnmupter2. In sudscasesnt ms probmmblynnorcbcunelicimnl to chii’cct lIme ellorl towmsrdscharacterisinglhe origunal fluid aund genermntingreliable PV1’ dmmta, and (men musemi tuned phasebehaviourunodelto prcdmct theproducedfluid composition..
SaturationPressure
Table 9.6 lists the averagedeviationof predmcleclbubblepoint pressurefor mm vmiricty of oilsatnmples. imscluding Ilnose with non-lnydrocarboungasesadded to tlmenus in swclliusg tests 1221.Theequationsaregenerusllycapableof predictungtiscbubblepoimml pressurewillninu 5% devimitioumfor hydrocarbon systemsover the whole range of phaseenvelope itncluding nemur criticalcondmtions. The deviuntuons are generally iniglmer for flunids witlu isigim concentrumliornsofnon-imydrocarbongases. The VET and ZJRK appearto be overall tniore accurmmlc than (lOners,with a deviationof about2%. TIne deviation of predictedvaluesby VII’ for CO
2ricin syslenns
us relatuvelyhigh . It should be noled tlsat no binary inleraction pmlrmsusselcrwas used in VP’F.All EQSgenerallyrequmrebunaryunteractionparansselersfor hydrocmmrhorm-C0
2.
Table 9.6.Averagemmbsoluted evialionsof predictedsaturationpressures.
C02 Overall
Devnalion %
11.02 6.16
tnj Gas Flyb’ocmnrbon N2
E~iaii,,n Average Absoluue
SRK 4,77 1205SRK3 477 12.05 11.02 6.16PR 4,22 2.29 4.80 4.35I’R3 4.22 12 29 4.80 4.35SW 3)3 9.91) 2.77 3.05PT 6.52 362 23.87 10.38VPT 1.04 1.91 8.20 2.63ZJRK 2.57 1 39 2.36 2.52
ConrsideringIhe reliability of EOSfor prediction of equilibrium ratios of light consponents.tImesumccessof theseequmunlions in predicling tIme bubble point is expected,as the bubble pointjsrcssnnre is nununiunly counlnulled by lise lrehimuviounr (mf light colsnpounermts. IligIn deviations in
1rcdiclcd cquiliimriuunum matiuss oh lscmmvy conunponneusls should, imowever, lead In tnnreliahle
estimmnmulmonoh thedew point.
TIse deviumlionnsof predicteddew point pressurefrommm experimenmtaldata, by time leading EOS.canexceed20%[31], eveurfor well definedsyntheticmodel fluids. TIne deviationcan be nsuchlniglmcr for real fluids dueto tIne presenceof very largensolecules,which strongly affect thedewpoinsl, evensat low concen(ratiours.i’lne behaviourof Ilsese compoumnndsare not ommly difficult tomnmodel by E()S, hut tiscir idcntiimcuntiotn anmci characterismutionare alsoquite demaunding. Ahmed[19) evumlunaled line relimuhility of lemiding EQS 10 predict the dew point of a nunniber of gasconilensunlemixtures in swelling tests. Although tInedew pointsof original fluids were initiallynsnatclncclby tuniung EA)S, tImedevimitionmof predicted valuesafteradding gasexceeded30%.
Density
‘l’ablc 9.7 slsowsthe mivermuge devuustioni of predidled saturationvolume and liquid and gasdc’mtsilics in vmmrionns gums injeclions teds )22). A sinnihmtr uncctnraey is expectedfor gascondensatesystcmsms. Note tlsmul ins (sr(lcr to produce rehimmhle denusity of equilibrated phases,EQS slmouldpredict hotim lIne phumsecousspositiommmnnnd time nmnuslmmr volunnme of a fltmid with known cotmrpositionreliably.
All tIne 3-parmnmsneterequimumions.wlscretIme timird parusnsmelcris included for improving densitydata,mis discussedinn Sectioms4.2.2, mire mooreuchimible tluusum tIne 2-paranmueterequations. ‘line exceptionis 1.1 R K. A ltinommgiu it is mu I amu Pammmnmndterequmition, it uses (Ienmsity datum to delenninne EQSparmnnnidters. Devimmtiotss,sup to 25%,werenmoticcd using SRK. hut tIme inclusionof the voluunetrmnmrslmitiotm,SRK3,emsltmmmnccd its cmnpmmbility to oneof tine leadingequations[22].
‘Fable 9.7.Avermigemsbsoltuledevimutiounsof predicted liquid smmturationvolunme,munich gmms mmnnd liqtuid densitiesmit equulibruuum’n.
I ‘Suiat ion
Smulnirmnui(,uu Voluuuuuu’ I .i Iu~u~I )eunsily ( mis l)encity
AverageAt usotulc I )cviaui,un ‘8’
SRK 6.9’) 16(i) 10)16SRK3 3.34 4.55 6.78PR 6.73 8.19 2.61I’R 3 4.83 5.94 2.31SW 4.57 685 3.71
t”t’ 3.44 3.53 2.44VP’F 2.45 2.80 3,33
7JRK 2.3’) 2,81 2.18
‘t’hse gums deunsity is gcmncrally predicted nmnore reliably tlman that of theliquid by two-parameterequnmnliouns. TIme perfornnnmsmmceis eqtmaily well for both phaseswitlm thnee-paramelcrequations.‘Ilnis is unuoslly dume tin time useof smihuraledliquid detssitydatain correlatingtime third parameterinIlucsc EQS. It is not summustimml to himid tlmree-paratmrctcrEQS predicting the liquid density morerehiumbly (humus tismit of its cquilihrmited gas.particularlyfor gascondensatesystems1261.
As tIne tlnird pmsranmnelcrimums been generallycorrelatedusing saturatedliquid volumnies.EOS maypredlucl erronneotnsdeunsity for highly tinder-saturatedliquids. It is advisableto calculatetInesmitsnrmmtedliquid demnsity by EQS amsd then adjustit for conrmpressiondue to theexcesspressuremmhove tine bubblepoinrh. ‘I’hc isotinermalcompressibilitycoefficient,describedin Section 2.3,emits he usedto estimssaletIme incrcunse in liquid density by pressure. Alternatively, empirical
320 9. Appheaiioun in Re.ce’ru’ojr Su’nmm,I~mlin,,n 9.2. conuporm.soun of LOS 321
methodsof estimatingoil density, presentedin Section 2.3, may be used to calculate thedensityof under-saturatedliquids.
Gas and Liquid Volumes
Theerrorsinvolved in predicting phasecomposition and density arecouinhimmed to nmake tInecalculatedphasevolume in flash calculationsas lime lcasl relimubic predicted imnfiu’nmnmntionm byalmost all EOS. Table 9.8 demonstrates the averageabsolutedevimmtion of predictedgasanmdliquid volumes for a large number of data generated in various simulated gas injectionprocesses[22]. Note that theerror in predictedphasevolume ratio is the higimest in all thecases.EOSgenerallypredict tine total volume more reliably thanthe volume of eachphaseatequilibrium. Hence,an over estimation of one phase is generally acconnpanmiedby underestimationof theother,resultingin a largedeviation in predictedphasevolume ratio.
Table9.8.Averageabsolutedeviationsof predictedvolumesat equilibrium.
Equation
SingleConiact Mutniple Conumuct
Gas Liquid GaslLiquid Gas I.iqmuid GaalLiquuid
AverageAbsoluie Devimutiiun %
SRKSRK3PRPR3SWP1’VPTZJRK
37.4916.4720.1214.1811.599.68
11.514.54
27.10 46.25 41.41 32.9130.24 41.05 31.56 35.1125.68 36.40 32,21 32.5024.70 30.75 31.84 33.2914.65 19.71 29.13 32.6724.27 44.77 11.53 10.7111.19 27.77 14.84 17.8110.31 14.02 21.95 25.96
48.5946.7743.6444.6442.06
5.5319.9432.38
Theerror in predicting phasevolume increasessharplywhen thecritical point is approached.Theresultsof firstcontactbetweenVolatileOil(A), Table9.1 aumdnrethanreat 373 K and 34.58MPa are shown in Table9.9. Note the severeusmassexchangebetweenthe pinmuseswlmere theoil/gas volume ratio of 4 prior to thecontact changedto 0.2 at equihibraim,with ahunrost nochangein thetotal volume. Thedeviationsof predictedequilibriums voltnnmesby vumriotus leadingEOSareshownin Table 9.10. Note that errorsof over 100% are qtiile conmsmnnoun. Smcim higlnerrorsnearcritical conditionsshouldnot be surprisiumg as a snmnall prcssn.nrcrcdticmioun below tinebubblepoint canvaporisealmostlmatf the liquid volume. h’ience, for examnnple mu I 00% error inpredictedgas/liquidratiocouldbeequivalentto only anerrorof lessthan 0. I % in thepredictedbubblepoint pressure. Whilst suchanerror in predicting the saturationpressureby EQS ishighly encouraging,itseffect on thevolume ratio is totally unacceplable.Time inmiprovementinpredicting phaseratio, by inclusion of thenearcritical density correction. Sectioum 4.2.I, hasbeenfoundtobenegligible[32]. Whereastuning of EOS to experinmentaldata,generatedin thecritical region,cansignificantly improvetheresults.
In compositional reservoirsimulation, where the reservoir is described by a number ofequilibrium cells,thepredictedresultsin eachcell provide the input data for time neiginbouringcells in the flow direction. This generallyresultsin compoundingerrors. Figure 9.9 showsthedeviationof predictedphasevolume by variousEOSat thefrontof a forward movinggasina reservoirdescribedby four cells. AlthoughVET wasfoundto bereliable for theoriginaloil,it resultedin a significant deviationof the predictedgas/oil volume ratio in the final stage.
Therefore,the overall error in a multiple contact sinnulation is expectedtobe significantlyhigherthanthat in flashcalculationsof theoriginal fluid.
Table9.9.First contactdataof tmmettmane-VoiatileOil (A)at 373 K and34.58 MPa.Conimponent,Mi~% - - Di(‘I 72.266
C2
4.479C5 4.1)75
nC4
2.398n(’ç (1.958unC,, 1)712Mcm CydI t’eumm 11,944(‘yet hex (1.948cC’, I). 199Met(‘ycl tIcs 1.11611‘l’uuluicuue (1.325n(’
5(1.462
ii Xytenc ((.876cC
54)791)
(las811.887
4.292
3.721)
2,007
((.742
11.515((.650
(1.62711.135
11.6760.20411,293
(1.501((.47I(1.76711.65111.548
(1.470
t).402
(1.348
0.2950.249(1.2131)181
11.15420.01)81 .90
0.4327 0.3310
‘l’mmlrlc 9. It).l’ercenmtmmgeerror inn predictingpinasevoluusmcby variousEOS.EOS ZJRK SRK SRK3 PR PR3 SW P’f VPTOil Vol. -118 -182 -152 -126 -126 -135 .53 .51)GasVail. 26 28 31 27 25 26 9 II
l’Ine cmmpmihility of EQS in predictiung the plmasevolumnne of gascondensatesysmeumus.particularlywitlnins tIme retrogrmsdcregion,is generallyinferior to that of gas-oil systems. Such a beimaviouris expecteda~tlme mmccuracy in munodlelhng the behaviourof heavycompounds,which dominaletime lic
1umid fornmation, is generallyinsferior. Thevolumetricbehaviourof a gascondensate,with
tIne commnpositiomm givems in Figtmre 4.6, as predictectby several EQS is shown in Iigtnre 9.10.Note Ilnat tire predictionsof all EQS approachtine experimentalvaluesquite closelywithin tinevaporisiusgregioum,wheretine systennbehavesoil-like.
usC,,, 1.374nC,~ 1.242nnCi
21.117
nnC15
1.014nC,
40.918
nC~5
1)830nnC,
60.744
nC17
0.661nC,g 0.594fl(’iq (1.533
nC’2u) (1.481) -Va~~.dunn’ 80(10
V~,cuns5
17.02
Eq.l)euns., 5/dunn’
Time error in predicting time retrogradeliquid volume below time dew point can be redumccduinarkedlyby tuning EQSto tsmatchthedew poitst.
322 9,4
ppli( (ltiOii jul Resei’i’,,ii .Si,,uuihuijo,n 9.2. ( olnparisoiu of LOS 323
V
E0>‘O
20
0
-20
~4O
-60
81)
too
0 2 4BlackOil A/Rich Gas,MoleRatio
Figure9.9. Error in predictingphaseratio by variotusEQS at frount of Rich (imns mudvanscinmginBlack Oil (A) at 373 K and20.8 MPa.
16
~ 12E0>
08ViaCU~0C
04(-3
0
Figure 9.10. Comparison of predncted condensate/gasvolutmietric ratio in a constantcompositionexpansiontestat 383 K by variousEQS.
Robustness
The robustnessof a phasebehaviourmodel in convergingto asolution is more dependentonfactorssuchasthematlmematicalmetinodsof solving lhe governingeqtmuntionsand inilial guessestused in iterations, than EQS characteristics. The pertinent comiditions of composition,temperatureand pressurecain also have profound effects on lime convergenceof EQS to a
6
solutions. All cubic equationsgenerallyexhibit a similar convergencebehaviour,they eithercanunoteasilyconverge,or convergeto the trivial solution of equalpartitioning of componentsbetweenthe phases,at conditionsclose to the critical poinl. Convergenceproblemsmay beobservedunlso at conmclitions nearIhte rnumxinnsunm pressureand time nmnaximum tennpcratureof theplmase boundary. EQS which locate time prevailing conditions away from the difficultconditions,suchas time critical point, often converge,wlmilst others may fail. Hence, theconvergedequatiomssarenot necessarilymorereliable,or applicableto that system.
9.3 ‘l’UNIN(; OF FA)S
l’hc inmhucrcnnldeficienciesof F.()S, lsmirlictmlmlrly for nmntnlticonnnponcntnnixtures,were(IeSCrihC(I in‘Inmulster 4. t’lmmmsc hclumuvionnr nmiode’ Is bmmscd nun thesecilumml iumnms nmmmmy predict Iniglnhy erroneous
mestulls,puurlictuiumrly for unearcm it icmnl I Ituids.cvcnm for well clmunracterisednmodcl fluids uns showninScctiomn 9.2. Realreservoirfluids, comniposcdof Ihousmtnmdsof connnpounds,are describedby alimssiled nuunrbcrof pure subslatnccsumn(I carbon groups. Time compositionalanalysisof thesefluids mire not umiways very reliable mmmd tIne carbonsgroupsare not fully defined. Gencrahisedcorrelations,often with signilncumntIydivergingrestultsmnmongstthenmselves,areusedto estimatetIne crilical propertiesof (lie carbongroups required for EQS calculations. All these factorsfurtherdeterioratepredictiomisof EQSfor realreservoirfluids.
‘The currentapproachin the industryto enmcountertIneabovedeficienciesis to calibrate,or ttnne,mm EOS nnodeh agmninrst experinncmmtmul dumla generated mit pertinent conditions for specific fieldsttmchies. Ahtbmounghtime industry Imums not adapteda singlestandardmethod for tuning, thevariousapproumchmesare hmnsicahlysiuinilmtr; sommse uncertainvaluesof input data to the phasebehaviourtsnodelareadjustedIn nsminimmnise tIne differencebetweentIne predictedand measuredvalues.
As themodel is to prcchicl tine pimumse belnaviourand various fluid propertieswithin wide rangesin conmsposilionnmmlreservoir sinnnulumtion. mm Immrge nunnberof experinsmentaldata areoften usedinttmning. The exercise is basically to rmnininsiise aim objective function, defined as the sum ofweiglmied squmarecldevmalionss.
N,,~, (WNOn(X )—‘v~’ I
A = ~ wj~ ‘ (9.20)
where cunchu elensmenmtof Ilse ol~ectivefanunclion expressestine weiglmted difference between tire
prcclicled aundexperinnmeuntmmlvmslues,mFIpreil mind ‘lft’xP. respectively;w is the weighting factor andNalalmu expressesIlne mnuusnberof nsnemnsureddata points t(n be fitted; X~designatestIme regression(Iunncdl) vmmriables.
Tine optirmrunnnvaluesof variablesareobtaitnedby nminuimnisingtime function A. Altlmoughs variousmmnethods[33-35] isavebeensuggestedfor solvingmulti-variableregressionproblems,nonecanhe gtmmsranliedto scrlve tIne problem in all cases.A nmodification of the Levetnberg-Marquardtnnethmod 1351 is oftenusedto minimisethevalueof A in Eq.(9.20).
The innportanmceof mm property is ensnplmasisedby multiplying its deviationwith a high weightingfumctor. TIne satuurationpressureis perimapsthemost innportantproperty of a reservoirfluid forpimase behavioumrsludies. Furthernmiore,it needsa high weighting factor if it is to beconmeeffective,asgenerallythe nutnberof datapointson the fluid saturationpressureis much fewerthan tlnoseof otiner properties.Iligln weighting factorscould alsobeassignedto more reliableexperinnentaldata. l..essreliable data, sucin asthe consmpositionof equilibratedphases,shouldreceive low weiglmtinmg factors,or preferablynot rmsed at all. Table 9.11 providesweightingfactorsasa rouglm gunide 133].
.
aSo
0
0
• vm’rS
o 7JRK00 PR)
• .5W 0
• SKK3
10 15 20 25 30 35Pressure,MPa
324 9. App!iearion in R~.sen’pirSinmuda,ion 9.3. Tuning ofLOS 325
Table9.11.Weightingfactorsof propertiesin tuningofEQS.Property Bubble Point Density Volume CompositionWeightingFactor 40 20 10 I
Although the dew point is an important parameterand its accurateprediction is desirable,assigning a high weighting factor to it may increasetime deviation of predicted retrogradecondensatevolume. Many gas condensatesamplesshow a liquid drop-out tail duringdepletion,as describedin Section2.2.4. Matching tine dew poinl gencrumhly restmlts in overpredictionof the liquid volumeduring the early depletioms stagesfor these fluids. As tinemeasurementof dew point is quite subjective,tuning EQSwith a higlmerenmmpim~isison theliquidvolume, insteadof thedew point, is preferred.
Thedeviationbetweenthe predictedand experimentaldata is not only due to deficienciesofEOS,butmostlydueto theinputdata,excludingthenearcritical conditionms. llennce,tIne luninmgprocessshould primarily be conductedto evaluate and innprove tIne inrput (luila, inmslcmud ofmodifying EOSparametersindiscriminately to mnmatchtheexperinnentumldata. (icumerumlly a severetuning couldindicate overlookedproblems. Furthermore,the tuning simould unot be regardedpurely as a mathematicalregressionproblem. Time parametersto he regressedneed to beselectedbasedon physicalconceptsandvariedwithin reasonablelimits.
Fluid Characterisation
A properanalysisand characterisationof the reservoirfluid is tIme Inmost insnportanl step insuccessfulapplication of a compositional model to determine the fluid belnaviour andproperties.Pedersenetal. [36] providemanyexamples,wherea propercharacterisationof realreservoirfluids hasresulted in reliable predictions by phasebeimmuviour ummodels without anytuning.
Comparativestudies, where the same fluid Inas been sent to diffeneust Imuhormllories forcompositional analysis, have revealed striking inforusmalion on tine dispmmrily of results,particularly forgascondensatesystems.Theuseof high pressureanalysistechniques,to avoidloss of compoundsin the flash(blow down) method,Section2.2, is recomnnended.This isparticularly valuablefor gascondensatefluids, wheretine flash mnetinod resultsin an analysisoften leanerthantherealfluid dueto thelossof collectedcondensate.
When compositional data generated by different metlmods, such as distillation, gaschromatography,high pressureanalysisand massspectromsretry,areavailable,liney all shouldbe usedto determinethe most probablecomposition of the fluid. The capabilitiesof eachmethod shouldbe consideredin driving the final analysis,rather than averagingthe reportedcompositions.For example,themostreliableinformationon the relative concentrationof lightcomponentsis obtained by gas chromatographyof the flashed gas, whereas distillationprovidesreliabledata on heavy components,particularly theplus fraction. The high pressurecompositionaldataon intermediatesandlighter heaviesare generallymore rehimnble than thoseby other methods. The high pressureanalysis also provides valuable infonnation forevaluatingthereliability of thevapourto liquid ratiousedin derivingtine overall compositionbytheflashmethod.
Theconcentrationof componentsis alnmnost always measunredin munass (or volumnmre) basis indistillation and also in gaschromatograpimy.‘fine resultsare generallyreported un immolc basis,eitherby usingthemeasured,orthegenerahisedsingle carbongroup. msmolecularweiglnts. It isalwaysadvantageousto work with thecompositionalanalysisin massfractions. Time nnolecularweightofheavyfractions,particularlytheplus fractiondueto its low reliability, maybe variedasatuning parameter.Workingin massbasiswill retain theoriginal compositionaldata,whenquestionablemolecularweightdataareadjusted.
The eharacterisationof single and tmmultiple carbon groupshas a major innpaet on the resultspredictedby EOS. Guidelineson time tntumberand selectionof groups and theestimation ofgrouppropertiesweregiven in Section 9.1. Occasionally, inspropercharacterisation,suchasdescribingtheheavyfraction witlm too few pseudocomponents,may leadto lowerdeviationsofpredictedresultstinan timat of an appropriatemethod. This can be dueto the cancellationoferrors at someconditions and should not be adopted. It is more logical to use propercharacterisationandthenattemptto improveothershortcomings,than relying on uncontrollablecancellationof errors.
Tuniumg of [OS can be conductedwith the fluid describedby any nmunmberof conlmponennts.Ingenermuldescribingmine C
7~with 4 groups,using tine quadraturetsmelhod. and mill line discrele
connspotmndsmis reported,slnould be mmdcquatein mostcounpositionalmodels. Time eomunponetntswitlm their optimisedpropertiescouldbe groupedagainto reducetheir nuimrher, if required. Anadditionaltninor tuningof thenew groupproperties,dependingon thegroupingmethod,maybenecessary.
Selection of EOS
Forcing EOS to matchcertain datmsby excessiveadjustnnentof its paranrmeters,nnay lead toimigimly unreliableinfommation at otherconditionswinereexperinnentaldatais lacking. In generalany leading EOS whicln predictsphasebehaviourdatareasonablywell without tuning, wouldbe tlme tnostappropriatechoice.
Tuning sinould not he comndiuctedwithout considerationsto capabilitiesof EOS. For example.tunning of a two-paraumnelerEOS. kumown to be weak inn predictingtine liquid density, to nnatchexperimemn(aIdensitydlmmta, may lemmd to seriousproblenmswith prediclion of otimer data,or evenlurtinerdeterioratiounof predicteddeunsityoutsidetheraisgeof availableexperiusnental(laIn.
Aithougim usnostof tIme vami der WaumlstypeEQS arebasicallyvery siusnilar. certainequationsmayhepreferableto others. As reliablevolumninetric dataare also requiredin reservoirfluid studies,three-parameterEOS simouldhe selectedin preferenceto thetwo-parameterequations. Certainequations,suchas the Valderramannodifieation of Patel-TejaEQS. which have consistentlydemonstratedtheir reliability, cotmid beconsideredannongstthefirst choices.
Experinaental l)ata
All reliable experirunenslumldata should be used jun tumsing of EQS. The experinmentaldata,irowever,seldommmcoverall prevailingconditions. ConventionalPVT datamay not be adequategenerallyfor tuning of EQS.which is oftenusedin simulationof reservoirprocessesothertinan
‘simple pressuredepletions. Experimental data should be generatedat conditions closelysinnulatingreservoir processes. For example,if gas injection is to be modelled by EQS.multiple contacttestdataarehighly valuable for the tuning. The swelling test with a rich gas,particularly coveringconspositionsaround thecritical point, providesuseful information formiscibledisplacemeuntprocesses.
Time type of experinsenlaldata required for tuning hasbeenaddressedby severalinvestigators[37,38]. In general, the datashouldcoverthe pertinentrange of composition,pressureandteunnperumtture. Testsunre genmerumily c,nnmductedat Ihe reservoirtemperatureto simulate reservoirIii ~cssesmmnd mmt lIne sepmurmulortenumperatureto sinunulatesunrfacecoumditions.
Connipositiornaldataonm eqn.uilihratedphaseare known In begenermmlly unreliable,hence,seidouinusedin thetuning. When the estimnationof produced fluid compositionby gascycling in areservoir is the tnain target of the study, such a treatmentof compositionaldata will be
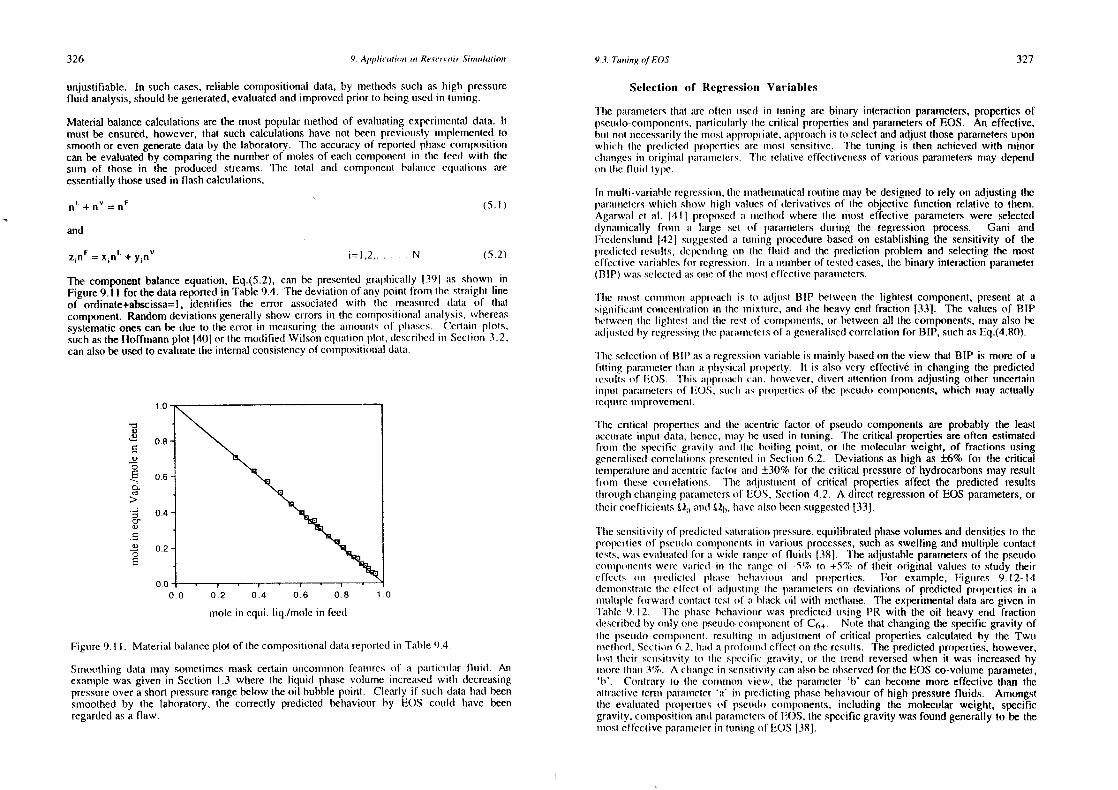
326 9. Applieatio,u in Re.c,rroir Sj,,nulntjo,u 9.3. Tuning ofLOS 327
unjustifiable. In sucheases,reliable compositionaldata,by methodssuch as high pressurefluid analysis,shouldhegenerated,evaluatedandimprovedprior to being usedin tuning.
Material balancecalculationsare the mostpopularmethodof evalrmatirig experinmmenlmn] data. itmust be ensured,however,that suchcalculationshave not been previously iunmplensmentedtosmoothor even generatedataby thelaboratory. TIne accuiracyof repouledphsmnse conmlpositioncan be evaluatedby comparingthenumberof molesof cadsconmmpounerstnn tIne feed with thesum of those in the produced streams. Tine total and conmponensthunlansceequmnlnons mineessentiallythoseusedin flashcalculations,
nL+nv=nF (5.1)
and
z,nF = x,nL + y,n” i=l,2 N (5.2)
The componentbalanceequation.Eq.(5.2), can be presentedgrapimicahly (39] mis slnown inFigure9.11 for thedatareportedin Table9.4. ‘The deviationof anypoint fronm tine straigint lineof ordinate+abscissa=i,identifies the error associatedwmthm tine measturcd rhata of tlnatcomponent.Randomdeviationsgenerallyshow errors in theconrposilnonalmunumlysis, whereassystematiconescan bedueto theerror in nmemtsuring the aurnotumslsof phases. Cenlammi plots,suchastheHoffmannplot (40] or tlme modifiedWilson equationplot, dlescruhc(lnun Sectioun 3.2,canalsobe usedto evaluatetheinternalconsistencyof comsnposutiommaldatmm.
Figure 9.11. Material balanceplot of the compositionaldatum reportedimm Table9.4.
Smsnootlmitsgdata may soumretimesmaskcertain ummcomnmusonm fealunres of mt pmmitncuimmr fluid. Atsexansplewas givenn in Section 1 .3 where the liquid phasevolummise nnscreumscdwutlm decreasinsgpressiureover a short pressurerangebelowtheoil bubblepoint. Clearly if sudsdata hadbeensmoothedby time laboratory, the correctly predicted behaviour by EOS coumld have beenregardedas a flaw.
usiole in equi. hiq./mole in feed
U
CU0
cicm>
0’5)
C
U0
Selection of RegressionVariables
line putrannelersthmrt uue ofteum used in humming are bitsary inmteractionparameters,propertiesof
I)setn(lo-conmrponetsts.particularly time critical propertiesand parametersof EOS. An effective,html usot mnecessuirily(lie unsostappropriate,approachis to selectandadjustthoseparannetersuponwlsich lime predictedpropertiesare usnost Sensitive. TIne tuning is then achievedwith nninorclsmmnges imm origimmal himmrmunnnelers. ‘l’hse relmntiveeffectivenessof various paranmnetersnmay dependnun tIne fluud type.
In nnuili-variahleregressions,tire nmrmuthnennruiticalroutinnemssay be designmedto rely onr adjustingtheparmnnselerswinich show high valuesof derivativesof time objective function relative to them.Aguurwmml et unl. (411 proposerl a nmmelhmod winere lIme nmmost effective paraimneterswere selected(lynmmmsmicahiy frommm mm large set of parannetersdtmring tine regressionprocess. Gani andFredenslund(421 suggesteda tumming procedurebasedon establishingthe sensitivity of theprcdictedlresimlls, (lepcnding on tine fltmid amnd tIre prediction problem and selectingthe mosteffcctive vumrimnhlesfor regression.Imu a nnunnumherof tesledcases,(Ire binary interactionparansmeter(HIP) wmmsselectedmis omneof tIme usnosteffectiveparaumneters.
‘line usmost connmnsounapproaclsis to mndjtust BIt’ betweentIne Iiglmtest componenl, present at asignnificamnt conmcenntrmnliotnin time mixture, and lime heavy end fraction [33]. The values of BIPbclwcemm tIme higlnlesl unmid lIne rest of cotnspomsenrts,(Sr betweenall lime eornponennts,umnay alsobemidjunstcd Iry regressiungtIme pmmmaunsctemsof mm generalisedcorrelationfor BIt’, suchasEq.(4.80).
lime selectionof BIt’ asa regressionsvarimmhle is mainlybasedon lime view that BIP is more of ahiltitng parannsetertlnuun mm pinysicmml property. It is alsovery effective in cisanging thepredictedresultsof [oS. ‘l’luis unppromnclncmmun. however,dmvcrt mittenlion from adjustinmgoIlier tnneerlainiunprml parumunnclersof [OS, stucin mis iropcrties of lime pseudocolnnponents,winich nunay unctuallyrequireinnprovenmenl.
TIre critical propertiesmmmd tIme aceustric factorof pseudocomponentsare probably tIme leastmucctnrmmte inrput data, lsenrce,nrsay he unsed in tinning. Time critical propertiesareoften estimatedfromsm tIne specific grmmvity aund tine boiling poinnt. or tlse nmolecularweight, of fractions usinggeneralisedcorrelationspreseuntedims Section 6.2. Deviationsashigh as±6%for Ihe criticaltemperalureamid acentric factor and ±30%for the critical pressureof hydrocarbonsmayresultfrotns tlmese correlatiouss. ‘rime adjuslmmient of critical propertiesaffect the predicted resultslinroughclnanginrg pmmrmmnnsetcrsof [OS. Section 4.2. A direct regressionof EQS parameters,ortheir cocfficieumtsUmn mind ~
1b. hunve alsobeensuggested[33].
‘rime scmnsitivily of predidtedlsatinruntionpressure,equilibratedphasevolumesanddensities to thepropertiesof psetudocoursponcumisin various processes,suchasswelling and multiple contacttests.wmusevaltumiled for mm wi(ie rmnmngc of flimidls [381. ‘lime adjustableparametersof thepseudoconnuponrcmntswere varied in line rmuuige of -5% to +5% of tlreir original valuesto study theireffects onn hsu’cdhictcdl plimnse hcluaviouur mmdl properties. F(ir example, Figtnres 9. 12—14dcuuuonsslruulclIme ci lcd of mmdjustimig time pmnrmnmuneters(sin deviationsof predictedpr(ipertiCs in ansnultiple forward coustmucl test of mm hlumck oil with nnsclliummne. Theexperimentaldataaregiven in‘l’able 9.12. Tine phasehehnavioinr was predictedusing PR with theoil heavy end fractiondescribedby otmly ouse pscudo-conssponentof C
6~. Note that changingthespecific gravity of
line pseudlocomnmponncnt,rcsumltimmg ins adhjustutnentof critical propertiescalculatedby the Twumsiellmod,Sectioms6.2. hada profounusuleffect on theresults. The predictedproperties,however,inst their scussitivity to lIme spcciiic gravity, or tIme lren(l reversedwhen it was increasedbyimmore llmmmnn 3%. A cluamrgein sensitivitycmmn alsobeobservedfor tine EQS co-volumeparameter,‘b’. (‘omutrary to lIne connnnnnomm view, time paramm’mcter ‘h’ can beconnemore effective tinan tinemnttrumdtive ten-Inn parameter‘a’ in pmcdidlimmg phrasebehaviourof high pressurefluids. Amongstline evumlumusted propertiesof pseudocommsponenls, including time molecular weight, specificgravity.composilionmind parametersof [OS. thespecific gravity wasfound generallyto be theusmosteffeclive pmnranseterin tuniumgof [OS [38].
0.0 0.2 0.4 0.6 0.8 1.0
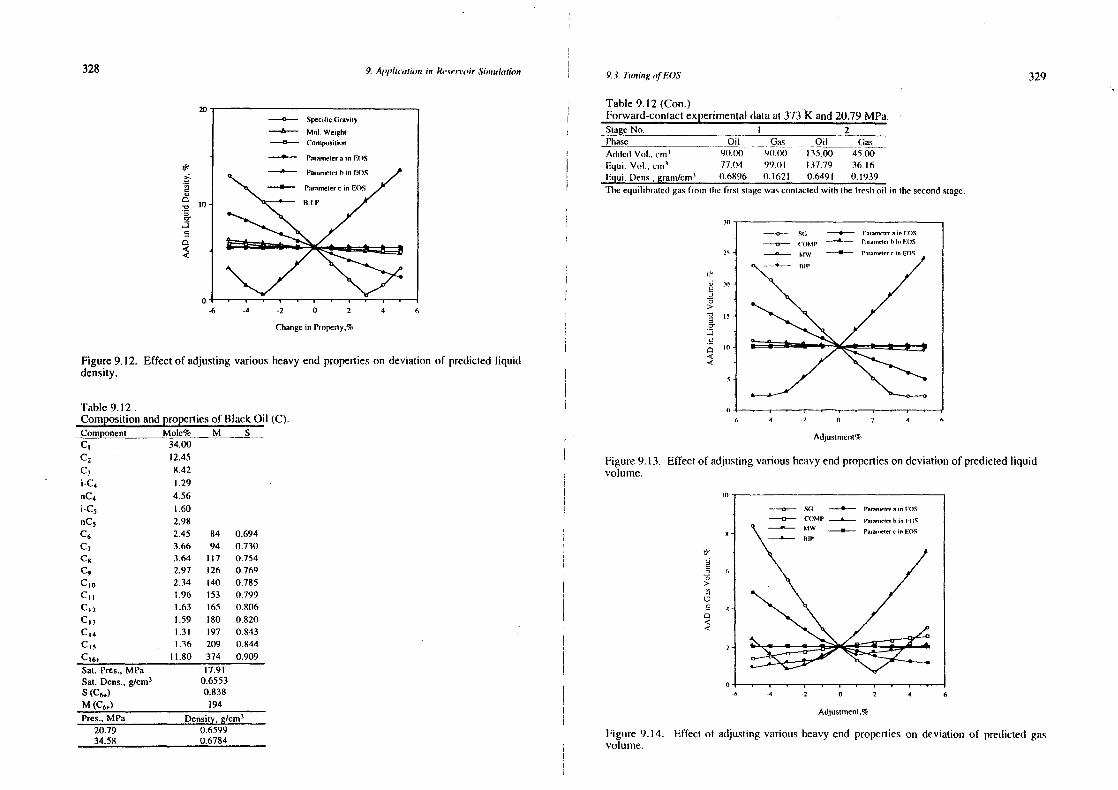
328
Figure9.12.density.
9. Appla’auiiuii inn Ru’.se,’n(nrSinuu!agion
fin
~1
Changein Propeumy.%
Effect of adjustingvariousheavyend propertieson deviationof predictedliquid
Table9.12.Compositionandpropertiesof BlackOi1(C).Component MoIe% M S
34.00C
212.45
C3
8.42i-C
41.29 -
inC4
4.56
i-C5
1.60nC, 2.98C
62.45 84 0.694
C7
3.66 94 0.730C~ 3.64 117 0.754C
92.97 126 0.769
C~ 2.34 140 0.785C~ 1.96 153 0.799Cm
21.63 165 0.806
Cmi 1.59 180 0.820Cn4 1.31 197 0.843C
01.36 209 0,844
C~, 11.80 374 0.909Sat. Pres.,MPa 17.91Sat. Dens.,g/cm
30.6553
S(C~) 0.838M(C,
5) 194
Pres.,MPa Density,glcm3
20.79 0.659934.58 0.6784
9.3. Tuning ofLOS
Table9.12(Con.)Forward-contactexperimentaldataat373 k and20.79 MPa.
I 2Phase_________ Oil Gas Oil GasAddedVol., dunn
3 90.00 90.00 135.00 45.00Equni. Vol., cuun’ 77(14 99.01 137.79 36.16~ui. Dens.,grannm/cm
m 0.6896 0.1621 0.6491 0.1939‘fIne equnilmhratcdgasIron the iirst smmuge wascontaciedwilh the frcslnoil in the secondstage.
10
2%
ni .‘i)a0
>~2 us0’
IS
329
-6 -4 2 0 2 4 6
Adjusimenm%
Figure9.13. Effect of adjustingvariousheavyendpropertieson deviationof predictedliquidvolume.
is)
—0——— 50 ——— i’,,nn,nI~, nfl 505-—n-—-- CuMr ~ i’~,n,,,nwni’ in
ii ~uw ._......_._..... ~ c in SOS——-— sir
-6 -4 -2 0 2 4 6
Adjusunuenu,%
Figure 9.14. Effect of adjustingvunrious heavyend propertieson deviationof predictedgasvolume.
~6 .4 -2 0 2 4 6
—~‘0~~~SC) —‘—e’———— i’nna,nct,’, • in mmcm~~~~0~~dOME ~ r~,,,nIc,bin us—a—--— suw —~—— u’nrnn,nnnncnSOS
—s--—— muir’
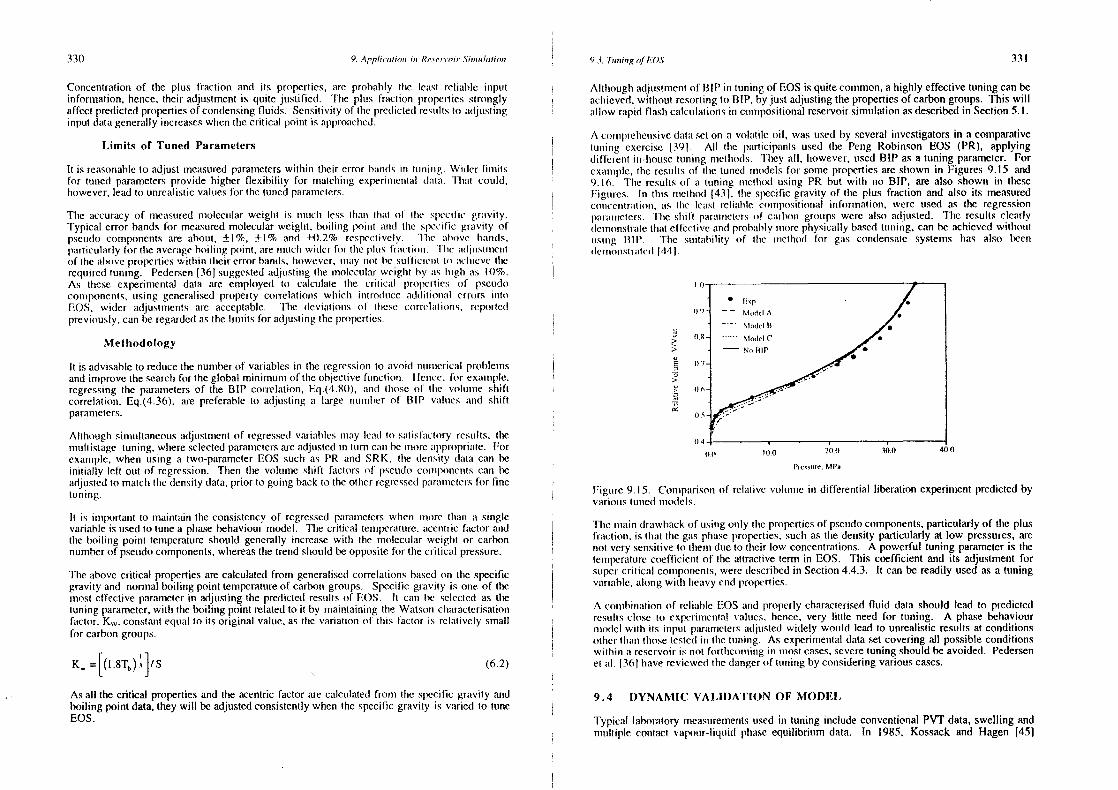
330 9. Applications mu Resc’s u’pur ,Si,suuhntio,u
Concentrationof the plus fraction and its properties, are probably lime icmmsl reliable immptutinformation, hence,their adjustmentus quite justified. The plus fractioum propeu’tiesstronglyaffect predictedpropertiesof condensingfluids. Sensitivityof tine prcdictedlresultsto artjrns(immginput datagenerallyincreaseswhenthecriticuul poimit is approundtscdh.
Limits of Tuned Parameters
it is reasonableto adjust mneasuredparameterswithin their error haunds in tumnimug. Wider linsnitsfor tunedparametersprovide higher flexibility for matchrimmgexpermnssentmmldlatmi. iIsal cormld,however,leadto unrealisticvaluesfor thetunedparamelers.
‘t’Ise muccuracy of nmmeasuredmsmolecularweiglmt is mmsucls less tinmmui lhsmul ol lIne specnlucgrunvity.Typical errorhandsfor measruredmolecularweigin, boiling polunt mmmdl time specific gravity ofpseudocomponentsare about, ±1%,±1%amid ±0.2%respectively, line above hmmnnds,pmmrticulumrly for lIme averagehoihimng point, msre unnucinwider f(ur theplt~mfm’act monu. ilue mud mnslnnscnmtof themmhove propertieswitiminm Ilneirerrorbmnnds, however, nnmmuy nuot be suitmc cml lii mis: Inmeve tInerequiredtuning. Pedersen1361 suggestedadjusting tine ismohecularweight by as inngin uns 0%.As these experimental data are employed to calculate tine criticmnl properties of pseudocomniponents,musing generahisedlproperty cou’relalionrs wlnicim introduce mmd(hitmonnmnl errors mlmlo[OS, wider adjustmentsare acceptable. ‘rIme deviatiouss of Iluese cori’cimilionss, reportedpreviously,can be regardedasthehitmsits for adjustingtheproperties.
Methodology
It is advisableto reducetIme nunnberof variablesin the regressionto avoid nrnusscricmmlproblensisandinnprovethesearcinfor time global nr’minrimum of tIne objectivefiurnctiomm. I-lenncc. For exmmmsmple,regressingthe parametersof time BIP correlustion,Eq.(4.80), amid thoseof lIne volume shifteorrelatiomm,Eq.(4.36). are preferableto adjustinga large nuummherof HIP vmulmmes aund shiftparanseters.
Alllmormglm sinmullanseousmndjtnstnmmentof regressedvmuriahles ussay leadto smitisfactoryresmmlts, tImeunsuiltistagetuning.wlnere selectedparannmetersareadjustednut turn cmunm be unnore mippm’opriate. Forexample,when using a two-parameterEQS such as PR arid SRK, the denrsnty datacan beinitially left oul of regression. Tinen the volume shift fmmctors of pseudoconnnponcnmtscan beadjustedto matchlime density dmmta, prior to goiung back to theotlscr regressedlpmirausmctcrsfor finetuning.
It is inmportaunt to mnaintmmin the consistencyof regressedpmiramnetcrswhsenm usnorc Ilnams us singlevariableis usedto tunme a phasebehaviourmodel. l’he critical tennpermmture.uncentric fmmctor andtheboiling point temperatureshotnld generallyincreasewitim the molecularweiglnt or carbonnumberof pseudocomponents,whereasthetrendshouldbe oppositefor tine critical pressure.
Theabovecritical propertiesare calculatedfrom generahisedcorrelationsbasednun tine specificgravity and normal boilingpoint temperatureof carbongroups. Specific gravity is one of timeIrlosI effectiveparameterin adjusting the predictedresultsof EOS. It camm be selecledas tImetuning parameter,with theboiling pointrelatedto it by nsaintaimrimsglise Watsoncinaracterisationfactor, K~,constantequalto its original value,as tine variation d)f linis factor is relatively smallfor carbongroups.
K~w[(t.8T6
)~]/S (6.2)
Asall thecritical propertiesand the acentric factor are calculatedfrorns time specific grunvily andboilingpoint data,theywill beadjustedconsistentlywhen the specific gravity is varied to tuneEQS.
9.1. l’unnning of LOS 331
Althoughadjustmentof BIt’ ium tunmingof EQS is quite common,a highlyeffective tuningcanbeachieved,without resortingto BIP. by just adjusting thepropertiesof carbongroups.This willallow rapid flash calciulationsin connrpositionalreservoirsimulationasdescribedin Section5.1.
A cotnspreimermsivedmntmmseton a voluntile oil, was usedby severalimnvestigatorsin a comparativeRunning exercise (391. All lIne participantsused time Peumg Robinson EQS (PR), applyingdifferent in-housetuning methodls. ‘lucy all, however,usedBIP asa tuning paranmeter. Forexammnple,the resultsof tIne tuned unodelsfor somepropertiesare shown in Figures 9.15 and9.16. Tlse resultsof a ttmnimmg urmetlnodl usiung PR hut with no BIP, are also shown in tlneseFigmures. In tins method [431, tIne specific gravity of time plus fraction and also its nsmeasuredcommceuntrmitioni, mis tIme lcmmst reliable comisposiliomnai inforunatioum, were unsed as time regressionpmmrmmuuuelers. lime smut pmmrummsmetersoh carbonsgromnps were also mndjuusted. Time resultsclearlydenusonstrmntethat effectiveandprobablyunsore physicallybasedtuniitmg. can be achievedwitlmorutuusinsg HiP. Tise suitability of the nusetirod for guns condensatesystems has uulso beendemmnonnstratcul1441.
Figure 9. 15. Conmparisounof relative vohuuummein differential liberation experimentpredictedbyvariomislmnnned nniOdlels.
‘[Inc nmmaium drunsvhackof risingonsly tIne propertiesof pseundocomponents,particularlyof the plusfraclioun, is thmnt tine guns pmnasepropertmes,such as thedensity particularlyat low pressures,arehot very sensitive to themnmdueto tineir low concentrations.A powerful tuning parameteris tImetennmpcralurecoefficient of the attractiveternr in EQS. This coefficient and its adjustment forsumper-criticalcolmnponnents,weredescribedin Section4.4.3. It can be readily used as a tuningvariable,alongwith heavyernd properties.
A connnlmimnmmtion of rchimmhie EQS mmmdl properly characlerisedfluid data should lead to predictedresultsclose to cxperiunmcnlal valuncs, hence,very little need for tuning. A phasebehaviournmsodcl wilh its input pumrmuumnetensumdjtmstedwidely woumhd lead to unrealistic resmultsat conditionsotlnerIhmln tlrnsetestedin tine ttmmsinrg. As experirumeumlaldatasetcovering all possibleconditionswitlminr a reservoiris not fortlsconmingin nsiostcases,severetuningshouldbe avoided. PedersenCl unl. (36] havereviewedthedangerof tuningby consideringvariouscases.
9.4 I)YNAMIC VALII)A’l’ION OF MODEL
>
a
>
am
isoF’,cssuire. MPa
Typical laboratoryuncasuremneuntsmused imm tuning includeconventionalPV’F data, swelling andnrumltiple countact vumpour-Iiqsuid phase equilibrium data. in 1985. Kossack and Hagen [45]
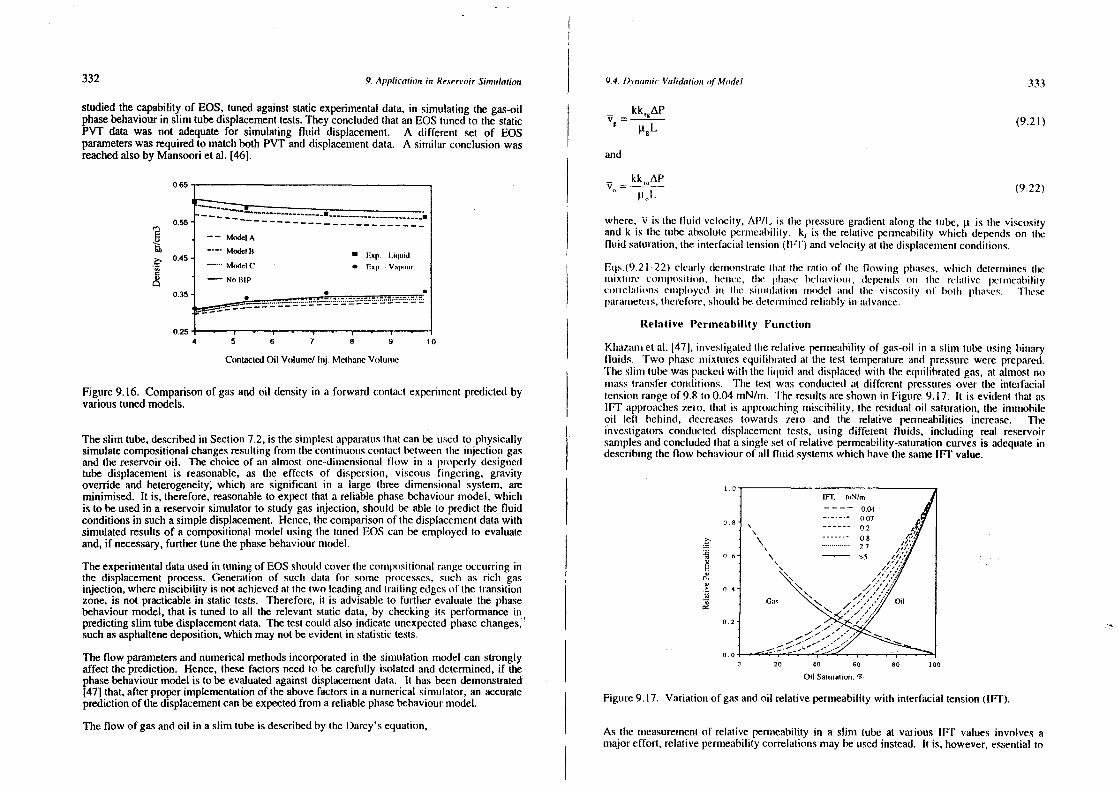
332 9. Applmcaounm jim Reservoir Sinnulation
studied thecapabilityof EOS, tunedagainststatic experimentaldata,in simulatingthegas-oilphasebehaviourin slim tubedisplacementtests.Theyconcludedthat anEOStunedto thestaticPVT data was not adequatefor simulating fluid displacement. A different set of EQSparameterswasrequiredto matchboth PVT and displacementdata. A similar conclusionwasreachedalsoby Mansoorietal. [46].
0.65
0.55
0.45
0.35
0.25
ContactedOil Volume! Iunj. MethaneVinlumnnc
Figure9.16. Comparisonof gasand oil density in a forward contactexperimentpredictedbyvarioustunedmodels.
Theslim tube,describedin Section7.2, is thesimplestapparatusthat can be usedto plmysicallysimulatecompositionalchangesresultingfrom theconlinuuommscontact belweenlime inmjection gasand thereservoiroil. Thechoiceof an almost one-dinnensionmmlflow mm ut properly designedtube displacementis reasonable,as time effects of dispersion,viscous fingering, gravityoverrideandheterogeneity~which are significant in a large three dimensional system. areminimised. It is, therefore,reasonableto expectthat areliable phasebehaviourmodel,whichis to beusedin a reservoirsimulatorto study gasinjection, shouldbe able to predict the fluidconditionsin suchasimpledisplacement.Hence,thecomparisonof thedisplacementdatawithsimulatedresultsof acompositionalmodel using thetunedEOS canbe ennployedto evaluateand,if necessary,further tune thephasebehaviourmodel.
Theexperimentaldatausedin tuningof EQSsinouldcovertheconmposilionunlrangeoccurringinthe displacementprocess.Generation of suncin data for soumme processes,smmchn as rids gasinjection, wheremiscibility is not achievedat thetwo leadingandtruuilinng edgesof time transitionzone, is not practicablein statictests. Therefore, it is advisableto further evaluatethe phasebehaviourmodel, that is tunedto all the relevantstatic data, by checkingits performanceinpredictingslim tubedisplacementdata.The testcouldalso indicate unexpectedphasechanges,’suchasasphaltenedeposition,which maynot beevidentin statistic tests.
The flow parametersandnumericalmethodsincorporatedin the sirnumlation model can stronglyaffect theprediction. Hence,thesefactorsneedto becarefully isolatedanddetennined,if thephasebehaviourmodelis to beevaluatedagainstdisplacementdata. It hasbeen demonstrated[47] that, afterproperimplementationof theabovefactorsin a numericalsinmuimnlor, an accuratepredictionofthedisplacementcanbeexpectedfrouna reliablephasebehaviourmodel.
The flow of gasandoil in a slimtube is describedby theL)arcy’s equation,
—— ModelAModetli
U Esp - i.iquidModei C • t~p - vtnnr
NoBIP
4 5 6 7 8 9 50
9.4. I)y,manmic Va/ida,jo,u ofMode! 333
kk AP(9.21)
and
kk At’V,, (9.22)
where,V is tine fluiul velocity, APIL is tIne pressuregradientalongtIre tube, ~t is the viscosity
andk is lime tubeabsolutepernmmeahihity. kr is time relative penneahility wlmich dependson thefluid saturation,theinterfacial tensions(1Ff) andvelocity atthedisplacenmentconditionss.
Fqs.(9.21-22) clearly dennmonstrmnletinmnl tIne ratio of lIne flowing pinumses. wimicln dctcrunninestInenummxlnnre cnmunilsumslmm(mnn. Imenuce, lime l)Imuusu’ hclnuuviotmr, dcpenmdsnmnu lhue relmilive peunnncmnlmilimycormelmmlmoms emnpioyedl inn lIne sinumtnlationn mnsodcl mnnmul line viscosity of hot in plmmnses. ‘Fhmescparaummeters,timerelore,shnounldlbedcleu’mnmimncd relimihly inn uudvamnce.
Relative Permeability Function
Khazamet al. 1471, investigatedtIme relativepenmiemihility of gas-oil in a slim lubemusing binaryfluids. Two phasensnixturesequihibrmutedat tine test tenrperatureand pressurewere prepared.Tine slimnm tubewaspumekedwitlm tIne liquid anddisplacedwith the eqmnilihratedgas, at alunmost nonmiass transfercotmriitions. ‘fine test was conductedat different pressuresover time iumterfacialtensionrangeof 9.8 (00.04mN/m. ‘[he resultsareshownin Figure 9.17. It is evidentthat as1FF approacheszeu’o, thmmt is approachingmiscibility, theresidualoil saturation,the immobileoil left behind, decreasestowards zero and tire relative permeabilities increase. TheinvestIgatorsconducteddisplacemenmttests, using different fluids, includiumg real reservoirsamplesandconcludedthatasinglesetof relativepermeability-saturationcurvesis adequateindescribingtheflow hehunviourof all fluid systemswhich lmavethesame1FF value.
1.0
0-S
C-
am
0.6
0.4
0.2
0.00 20 40 60 80 100
Oil Samuraumon.‘55,
Figure9.17. Variation of gasandoil relativepermeabilitywith interfacialtension (tFT).
As tIne unmeasurenmemmtof relative pennieability in a slim tube at various1FF values involves amajoreffort, relativepermeabilitycorrelationsmaybe usedinstead. It is. however,essentialto
334 9. Applscasuons so Re.u e,’u’our Si,,usikuio,m I 9.4. Du’nanuic Validation of Model 335
measurethe relativepern’neabihitiesat a single high IFI’ condition (basecurves)as lhsc startinginputdata. Displacinga binaryoil with its equilibratedgas,and rtreasuuringthe productionrateand the differential pressureacrossthe tube, provide all the reqmnim’ed data to detenusnine therelativepermeabilityusinga graphicalmethod [48]. There is no useed.however,to usseasurethechangeof relativepermneabilitieswith lET extensively. One set of relustive pcrnsscmmhihitycurvesat a low 1Ff valueandthe basecurvesare sufficient to define tine parametersof a gemmeralisedrelativepermeabilitycorrelation.
A nuunmbcrof correlmitions(47, 49—51] lsave been(IeVCl(ipcd to miccounusl for tine el fed of 1Ff ourrelativepermeability. Oneof theearliest atteusmptsto correlategas-oil relmulive peu’msuemuhiility witimlET is that of Coats [50]. The Coatscorrelationis basedonr the commcepl lhsmml is tine interfmmcialtcursiimn betweentIne two plmmssesappromicineszcn’o nmcmnr line critical point ( immiscible conmnhitions), tIneresiduuulphmnsesaturationvaluesdecreasetowardszero umund line relative penumucuitumlutycurvesvs.saturationsapproacimstraightdIiagonal lines. I he suggestedlto cstiumnmulc tIme rclmulive pcmnnmcmuhihntymitaumy 1FFvmnlue, by interpolationbetwceunthebasecmmrve dlelcrnnmincd mnt luigin lii’ mmmd tIne slraiglsldiagonalline,
= F,,k,, + (I — F,,)k,,, (9.23)
wincrekr is tlse relativepernneahihityto gasoroil, annul F0
is the scmnlmmsg functor betweentime boserelativepermmseabihitykrbandthemisciblerelativepermeability~
F0
is a functionof theinterfacial tension,~, asfollows:
F,, =(~‘~b)” (9.24)
wisere55
h is thebaseIF]’ and mm dependson time poroususrediuuni typewitlm mm dlcfmmmuit vmslue of 7(52].
The value of k~ cams be assumedequal to tine phase satunruilion. Altisouglu tisis simpleinterpolationapproach,Eq.(9.23),will resultin zerur rcsiduual oil mit mill 1Ff conditions,its effecton theevaluationof phasebehaviourmodel,usingslinmi tubedispiaceusientdumla, is insignificant.
Viscosity Prediction
The viscosityof a single phasereservoirfluid increaseswitin pressure,exceptat nmear criticalconditions.The increaseof temperature,decreasesthe liquid viscosimy whilst it increasesthegasviscosityat moderateand low pressures.At high pressures,lime behaviourof gasviscosityis more liquid-like (Figure 2.23). Hence, thosecorrelationsdevelopedeither for gas or forliquid. Section 2.3. may not be suitablefor reservoircondiliotis, particunlarly for gas injectionprocesses.It is requiredto usea single methodto predict the viscosity of both plmasesat suchconditions,especiallywhen miscibility is approachedland the propertiesof vmnlxmur and liquidbecomesimilar. A nunmberof methodsare applied to both gasand liquid in reservoirstudies,which canbeclassifiedinto threegroups:
First, tine correspondingstatesmethods,wherethereduncedviscosity,definedmis lime rmnlio of timefluid viscosityto that at thecritical point, is relaledto two reduncedsImile properties,sunclm as tinereducedpressureandreducedtemperature,Pedersenetal. [531. or time reducedteusiperatureandreduceddensity,Ely andHanley [54]. As reservoirfluids cannotbemodelledaccuratelyby thesimpletwo parametercorrespondingstatesprinciple, some correction factors are included inthesecorrelations. The correction factorsadjust tine deviation of time predicted result bycomparingit with the viscosity of one reference fluid, methane [53-54], or two referencefluids, methaneanddecane[55]. Although theviscosityis not a thernnoclynanmicstateproperty,theaboveapproachpredictsacceptabledatain mostcases.
‘lire secondutpproacln is basedon time analogy betweenviscosity-temperatureand specificvolume-temperaturebeimaviour. Cuuhicequnations,similar to vander Waalstype equations,butwith vokuunnereplacedby viscosity, havebeen proposed(56,57]. Thereis very little reasoningbehind linus approunclm, apmmrt from the similarity of pressure-volume-temperatureamud pressure-vuscosity—lensspcratureplots.
The thirdi approacisusestheconceptof residualviscosity, which is definedas the differencebetweenviscosity mst prevailiungcoundilionsaund linmil at low pressmnrewhmere theviscosity dependsunmshy on tIne Ilmerusnal cumergy. line rcsiduuml viscosity cmiii he relatedto tIre fluid density, whereaslIne viscosity (sf gmmsesat low pressunrecanhe reliablydeteruiminedby time kinetic Iheory of gases.This mnpproach,as imsrplcuncumleulbuy I.olsrcnz-Bray-Clark(LBC) [58], is mused widely in tinep.’ln’olemmmnn imudiustry. p;uumucsmlanlyins rescrvunnrsmumnmmlmntiomn. lime nmnellnodis hasicunilytbnmil of Jossiet~mi.1591 for ptnrecommupomiuuds,extendledIn lnydrocarhronreservoirflmnids, asdescribedbelow.
‘line knmnctmetheory of guisesslniuws thaI time viscosity is inverselyproportioumalto,
X ‘F~M ‘i’~ (9.25)
Jossmet al (59] nnsultiplicdtIne residual viscosityby ?~to unmakeit dimensionlessandcorrelateditwitim tine reduceddensity,P
1= p/pt. for pureconnmpounclsas,
[(p — ~u~’)x x + l0~ = a1
+a2
p1
+a1
p~+a4
p~+ a5
p~ (9.26)
wisere mn1= 0.1023(1
mm2= 0.023364
a3
= 0.058533mu
4= -0.040758
a5
= 0.(X)93324
amnd~.m°is line low pressureviscosity whicln cmmmm bedeterminedas,
fn°=34x10’ T,°”4
1X Tr� 1.5
= l7.78X l0~(4.58T l.67) /X i’~>1.5
Note that lime unitsof T, mind P, iii Eq.(9.25)should be K and atm (MPa/0.l0I325) in order toobtumimi theviscosityun nstPmm.s(cp).
l,olnrcnzCl mml. 1581 extendedlime mihoveIn nnnixtmmres. by prusposingthe Herning-Zipperermixingmule (601 for lIne low pressureviscosity mind tIne mnmolunr mixing utile for other propertiesasfoIl miws,
N N(1° = ~x~p~’M? / ~x~M? (9.28)
=1
(9.27)
X =(txT~JtxM)~(txP5
J~ (9.29)
336 9. Applicalion in Reservoir Sinmnlatio,n I 9.4. I)ynuanuic Validaiimm ofModel337
PM5
=(v5
)’1
=(u~XiVci)~~t . (9.30)
p, = v5/ v
wherePM0
is themolarcritical densityandv5
is thecritical molarvolume. The amnthorsusedtheviscosity dataof a numberof reservoirfluids to backcalculateandcorrelatetIme critical molarvolumeof C
7.~.as,
(v5
)~, = 1.3468 + 9.4404XlO~”Mc — l.7265lS~,+ 4.4083x10’3
M~,Sc, (9.31)
whereM andS are the molecularweightandspecific gravity, respectivelyannd tine estimatedcritical volume is in m
3lkgmol.
The methodof Lohrenzet ai. is quite sensitive to the flumid density, asapparentmm Eq.(9.26).Henceit should beusedonly in consbinationwills EOS winich are known to pmechict gas annulliquid densityreliably.
Figure 9.18 shows the deviationof predictedviscosity by Eq.(9.26) for pure connmpounds.Clearlythecorrelationloses its reliability for heavy compounds. Ileisce, the unnctlnod becomesunreliablefor densefluids witin reduceddensitiesover 2.5 [61]. It unray predict oil viscositywith deviationsexceeding100%.
U
t~s
40
20 ?4~
,~
.2(1A A
-40
-60
-80
A
Menlumnne4’ Eilnannc
0 Prop;iuie
0 n-Iiummnne° un-Pcuuuan,~
£ nu—Ikoanien-Os’uminu’
• n-I)crznune
• n-Dusujcc;nuueuu’Peuuu,uict’,iuue
• un-I Ieptmuutes’auue
0 I 2 ‘ 3 4ReducedDensimy
Figure9.18. Deviation of predictedviscosityof purehydrocarbonsby themethodof Jossiet ai.
It is commonto tunethenmodelby adjustingthecritical volmunnueof tine C7
+ fractions to nimatch themeasureddata. The aboveapproachimproves time predictedresults markedly in processeswheretheheavyfractionremainsalmost intact. A successfulexampleof sucim practice,wherethemeasuredandpredictedviscositieshavebeenmatchedonly at thebubblepoint, is shown inFigure9.19.
52.U
52,aaU
>
1.4
1.2
1.1)
0.8
0.6
0.4
o 2to 20 .1)
Pressure,MPa
41)
Figure 9.19. Consmpmmrisonof predictedviscosity by LBC nnctlmod with experimeuntumidama of mmNorth Seaoil at 371 K.
Example 9.5.
Estimate the viscosity of a liquid mixture conmposedof Ci=59.30, C~=37.46andnCg=3.24molc% at 311 K mind 20.68 MPa. The liqmuid density at the aboveconditions is0.368g/enn
3. The nmeasuredviscosity is 0.0510 nnPa.s(0.05 hO cp).
S(,huuiolm:
The propertiesof pmmre conmnpounenmtsare read froun Tumble A.i us Appendix A, with timecritical pressureconvertedto atom (divided by 0.101325)and their viscosity is calculatedfronnm Eq.(9.27), mns follows.
Conump. x M, g/gmunol ‘Ic, K Pc, atm v,, cnm’/mnoh T, ~t°, mPa.sCl 0.593 16.043 191)56 45.4 98.6 1.63203 0.04706 0.01134C3 0,3746 44,096 369.83 41.9 200 0.84092 0.03343 0.00864nC8 0.t)324 114.231 568.7 24.6 486 0.54686 0.03186 0.00605
‘Fine usnixtmnre properties are then calculated using the nnixing rules given mnEqs (9. 28-30)
xM°’ xi’, xM xP, xvçCl 0.02693 2.37519 1 l3.0() 9.513 26.915 58.47C3 0.02150 2.48752 138.54 16.518 15.705 74.92nC8 0.00210 0.34629 18.43 3.701 0.796 15.75‘total 0.05052 5.20900 269.97 29.733 43.417 149.14
‘I’hc valume of 1” for nnmixlunre is c;ilctulmnleil from Eq (9.28) to he 0.0096992 mPa.s. Thevalune of X for immixluire is cmnlcnnlated fronmm Eq.(9.29) to he 0.0377423. The mixturereduceddensity is cmilculated froums Eq.(9.30), as.
I----
p,=(0.368/29.733)xi49.14=h.84583 ~
338 9. Application in Rcse,’u’oir ,S’inuuulaiion
Substitutingthe abovevaluesin Eq.(9.26)results in, p_~n=O.O37l4
5usnPa.s. tlu’uuce,
p=O.O4
684
mPa.s
The predicted valume deviatesby 8% from the measuredvmscosmty.
Implementation
Most reservoirsimulatorsavailabletoday obtain solutionsto flunid flow equuatuomms(non-linearpatlial differential equations)by replacingthederivativeswith finite-differencemippmoxinmations.Theuseof theseapproximationsintroducestruncationerrorsand nmuusnerical dnspersion. Thesimulationresultsare,therefore,sensitiveto (lie numusherof grid-blocksmnnd Imusme-stepsuz.e usc(hto model theslim tubedisplacement.Tlmeseparaunetcrsshouldbeselectedso tismul tine nunscricaldispersionbecomescloseto thatof thephysical dispersionin tIme lube.
The degreeof sImm tubepacking homogeneityand time associatedplnysical dmspcrsion,cmmn beidentified by conducting miscible liquid-liqumid displaceusmenl[471. For mummy nsununher ofgrid-blocks,theoptimunutime step,whiclr yields thebestnsatchbetweentine predictedand tImeexperimentaleffluentprofile, canbe identifiedasshownin Figure9.20. For theopluumsmscdgridsize-timestep,thenumericaldispersioncanbeconmsideredequnivumlenlto lIme plnysmcmul dispersion.
In the slim tube displacementthe pimysicunl dispersionis generuilly sinumull mnusd cams he mmssmutnedzeroin mostcasesfor lnonmmogeneoussandpmmcks. TIse umnetlnund proposedby I .muunl/. (62] cumnn beusedto determinetheoptinm’mum tinmestep-gridblock ~iIlmzerodispersions,uunstemudl of counduictingliquid-liquid displacement. For a typical sliuss tube, 100 grid blocks are generally neededtoachievea stablenumericalsolmution. At conditions approachingussnscihihnty. iundlncmmled by lowlET regions,moregrid blocksarerequireddueto sharpchangesof fluid properties.
C0
CI
C)5)Ca
C-)C
0)
LL~
0.8 t).9 1.0 1.1 1.2
PoreVolumeinjected (fraction)
Figure9.20. Variation of simulatedeffluent conceustrationprofile witls Immune stepsize its a shuntubemodelledby 100 grid blocks.
9.4. lknanuic Validation of In’! ode! 339
of 311 K. The Peng-RobinusonEOS was ttmned to tine vapour-liquidequilibrium experimentaldataof SageandBerry (63] on theaboveternarysystemand multiple forward contacttest data(64], at time test temperattureamid pressunre.Tine mtmltiple contact testat 20.68 MPa imndicatedthemmclsicvcnrsentof umsiscihihily. ‘I’Ine ltuused mrsodclnnatchcdtine volumesof vapourand liquid phasesin equilihriium tests wills anaverageabsolutedeviationof about3%, with thecompositionanddensityreliably predicled.
Tine tuned plnmnse helmaviouur umnodel was inscorporatedin a one-dinnmensionalnumericalunodel,along with nmeasunredrelative pemnmeabihitycurves and the optimumgrid-time stepsizing, topredict tIre above, ‘I’ Inc simnuhumleddisplacenssentresullsat 13.79MPa areshownin Figure 9.21.TIse unodel tunedIn tIme static dala clearly is capableof predicting the dynamicexperimentalresunils. Time resunils mit 20.68 MPmu were mnlso qmuite reliable, demonstrating miscible(hisplaceunnent(64]. ‘I’o indicate lime sensitivityof disphumcennentresults to tlne phasebehaviournruodel,tine aunthorsdclihcrumleiy usuistumnedthemodel aguminsttIne static data,which resultedin asignificminl deviumlion betweeimtine predictedandnsieasureddisplacementdata,particularly the gashremmk llsrougim mind prodtncinggums to onl ratio values.
C
0
a
LCLi
0
0
0
so
40
20
‘0 Q0’i’i~0t’52.0
1E
mm
0.
a
00 05 1,0 1.5 2.0
Pore Volume tnjecied. Fraction
The aboveapproaciswas applied by Khazamet ai.(47
] to a liquid nnmxture of CI/C3/nCl()displacedby methanein a slim tubeat two pressuresof 13.79 and 20.68 MPa and tennnperature
Figunre9.21. Memisuredaundpredicteddisplacenmnentdata.
340 9. Applieatioin in ke.s.’rn’oir Si,,nndaiirnu
Theslim tube displacementdataarecertainlyvaluable for evaluatinga tuned phasebelmaviourmodelwhichis to beusedin reservoirsimulationof gasinjection. in immiscible displacementprocesses,however, tuningof the phasebehaviourmodel to relevant stalic equilihriuumrn datashouldgenerallysufficeandthereis very little need for relatively tinme consuusnimmgdisplacenrnenmttests. The swelling test, coveringboth sidesof the critical poinrt, will be higimly unseful togeneratestaticdatafor miscible processes[12].
9.5 EVALUATION OF RESERVOIR FLUID SAMPLES
Thecollectionof a samplethat reliably representsthe reservoirflmnid is essentialium anyphasebehaviourstudies. After all, a model tunedto experinnentaldatum of a saunpie,with propertiessignificantly different to thoseof the reservoir fluid, will be of little value inn studying thatreservoir. Challengesin obtainingrepresentativesamplesfrom gascondeunsalcmmmd volatile oulreservoirs havebeen well acknowledged by those involved. Souseof time key issumes andpitfalls in fluid samplingweredescribedin Section2.1.
Any fluid producedfrom a reservoirshould, in principle, provide vunlununhic muslomnnmunlionnun tInereservoirfluid. However, it maynot havetine samecompositionandpropertIesmis the ormgmnuuhreservoirfluid. The collected samplemay havegone through certain umnwanted processes.resultingin changesof its properties.If theseprocessescanbe reasonablyideumtificd, it may bepossibleto traceback theoriginal fluid from thecollectedsample. Phasebehavuoumrmmnodelscmtnmplay an importantrole in helping theabovetask.
Evaluation and improvement of a collected sample generally benefit from a combinedexperimentalandnumericalmodellingeffort. Some processes.suchas a snmmgle equuilibriumnnmflash, can be physically simulated by simple experinnents. Pinuuse heinaviour nmodels arerequired to simulate more demandingequilibriummm tests. Processesoccmmrrinmg witimumm lImereservoirgenerallyneedto bemodelledby a reservoirsiumnulator.
Themain sourceof error in sampling is the phasetransition and collectionof co-exitiung fluuidsat an improper ratio. Reffstrup and Olsen [65] studied fluid conmrpositional clmangesduringsurface sampling under non-ideal samplingconditions. They used a nnodified black oilsimulatorto producefrom alow permeabilityleangascondensatereservoiramudan EOS nmodelto simulate therecounhinationof separatorsamples. The authorsshowed that the dew pointpressureof a wellstream(recombinedsample)waslower thantheinitial dewpoint of reservoir,but higherthan thebottom hole pressure.They recommendeda methodto hack calcunlatetheinitial reservoirfluid compositionby matchingtheinitial reservourdew point pressure. Fevangand Whitson [66] extendedthe Reffstrup and Osien’s mnnethod to cover otlmer types ofreservoirs. The authorsconductedan extensive investigation of susmumpling Irons (lepheledreservoirsto determine the original reservoir flinid mmsinrg comumpositmonnmmlsmunmuimmlioun. ‘I’lneyproposedexperimentalmethodsto obtain the original fluid fronnn collected sammnplcs, basedontheir simulation results. A key recommendationto obtain the original reservoir fluid insaturatedreservoirswas to equilibratethesamplescollectedfromthegascapaurdtheoil zone attheoriginal reservoirgas-oilcontact,pressureandtemperature. Theequilibrated oil and gasphases,then, representthe original reservoir fluid in oil and gas condensatereservoirs,respectively.
A main concernin surfacesampling is therecombiningproportionof thecollected liquid andgas from the test separator. Any uncertaintyin themeasuredgasto liquid rmtlio in the fielddirectly affectsthecompositionof recombinedsampleand its properties. imperfect sepmnrationof thephasesalsocauseseithersomeliquid to becarriedover witin thegas from nun upstreamseparatorto thenext (carryover)or somegasto be producedwith the liquid (carry througin),disturbingtheproducedgas to liquid ratio.
9.5. Eu’aiiwtion ofReservoir Fluid Sanuples 34 I
in a saturatedreservoir, tImesaturationpointof coexistinggasandoil phasesshouldbeequal tothereservoirtemperature-pressureat the gas-oil contact. Hence,neglectingtime compositionalgrading in space, it is expectedthat thenreasuredbubble point of the oil sample,or time dewpoimnt of time gassamumple.be close the abovevalue. In practice, however,the compositionalvariationswith depth aundareaarerarelynegligible.
Thebubblepoint pressureof oil is a unonotonic fumiction of the gasto liqmuid recombiumatiousproportion,i.e.,tine bubblepoinnt pressureincreaseswith increasiunggasto liquid ratio (GLR).i-lensce,it is a reasonnahiepracticeto ignore time measuredGLR during oil sampliumgaumdtake oilandgassanmplesfronun time separalorandrecombinetimeun to achievetine target bubblepoint. Thedew point pressure, however, may increase,decreumse,or remain almost uncimanged byincreasiumgGLR, Figumre 2.2. As time GLR-dewpoint pressurecurve is dome-likeshapein gascondensatennixtmnres, il is possibleto obtain time saumme dew point pressumrewills two differentCi LR ‘s.
~Flnebelmaviour of mm typical North Scum guns condensunte.with a dew point of 31.94 MPa at383 K, wassimuimmted by flaslminmg it uml vmmriouspressuires.‘I’he equilibratedgasandcondensate
plnumseswere tlsen rccouumhinmednil differcmmt rumlios at cads pressure. Figure 9.22 shows timepredicteddew point of tine differenstrecombinedfluids. Theresultsclearlyshowtimat tine higlrertheseparatorpressure,thehigimer is thedifferencebetweenthe two recombinationratios whichresmult in tine samedew point. Therefore,ntis lesslikely to selectthewrong reconnbinationratioat high pressureswhenmminning to matcim time dewpoint.
CI
cm.’
5)
C)
cm.’Ca
cm.’Is
~13
32
31
3(1
29
211
27
Mole Liq. Add/ Mole Sep. Gas
0.4
Figure9.22. Predicteddew point pressureof reconnbinedseparatorgasandliquid samples.
Theplot alsodenmonstratesthat thedew point becomeslesssensitive to the recombinationratioastIne separatorpressureincreases.Astine targetdewpoint hasa certainerrorhand,thelack ofseumsitivity affects line recomunhinationratio markedly mit Imigh pressures. However, as time twopimasesnit Inigh pressumresmiremore siuusilarthan at lower pressures,the effect of deviatedgas toliquid ratio in recounhinationon thetotal fluid compositionand its behaviouris less significantat isigherpressures.If time separatorpressureis equalto thesaturationpressure,no condensatewill form. Theoretically,if tine condensateformed at the dew point is addedto the saturated
SeparamorPies.MI’a
(1.69
3.31689
0)3413.79
20(’u(
26 . - ‘‘I
0.1) 0.1 0.2 0.3
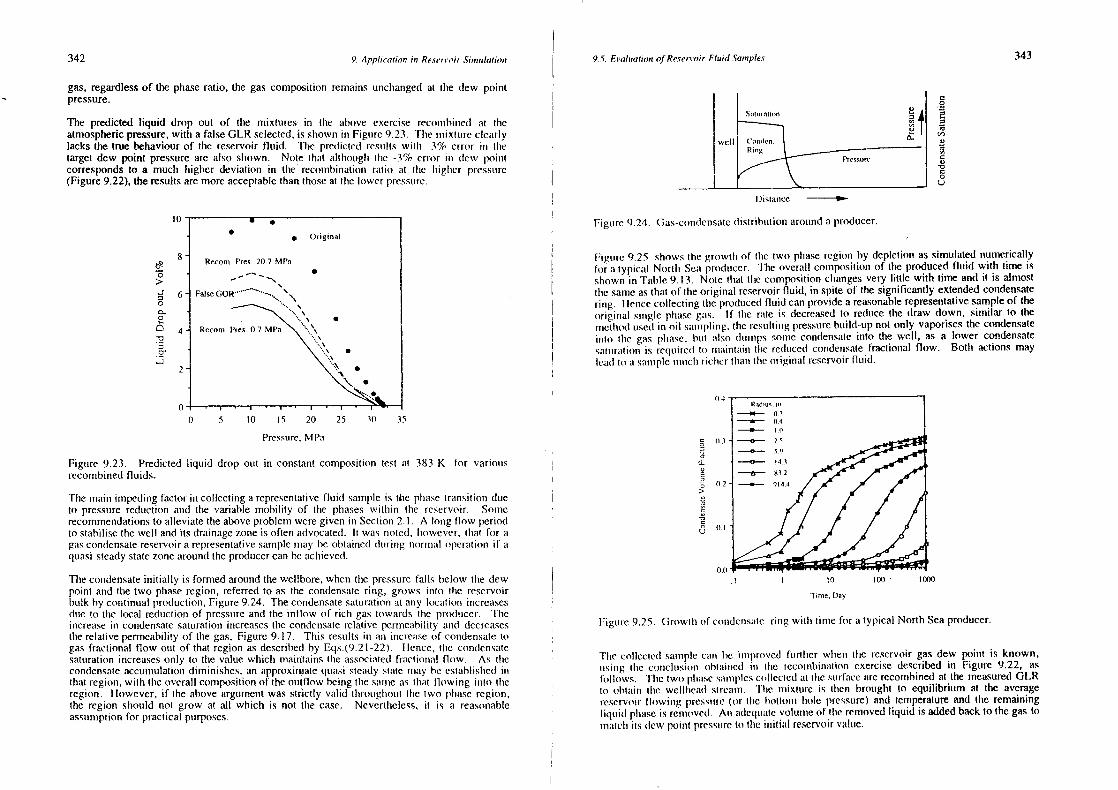
342 9. App!ieaOon in Reservoir Si,nulatio,u I 9.5. Eu.alima(no,u ofReservoir Fluid Sample.r 343
gas, regardlessof the phaseratio, the gas composition remains unclnangedat Ihe dew pointpressure.
The predicted liquid drop out of tine mixtumres in the above exercise recoussbinnedat timeatmosphericpressure,with a falseGLR selected,is shownin Figure9.23. Tlsemumixtunre clearlylacks the true behaviourof the reservoir fluid. The predicted resultswith -3% error its tinetarget dew point pressureare also simown. Note that mmltinoungln tIme -3% error inn dew poinntcorrespondsto a much higher deviation in the reconnhinmitioum rmulio at tine higImer pn’cssunre(Figure9.22),theresultsaremoreacceptablethanthoseat Ilse lower pressure.
10’
a>
aaa-a
0
a.’
8’
6’
4
-
FalseGOR -
: ~ is
Pressunre,MPa
Figure 9.23. Predicted liqunid drop Out in constantcomposition test at 383 K for variousreconnbinedfluids.
The rumain imnpcdingfactorin collectinga representativefluid sampleis the pinaselrmunsitiomm dueto pressurereduction aund the variable mobility of the phaseswitimin the reservoir. Somerecommendationsto alleviate theabove problemweregiven in Section2.1. A long flow periodto slahilise thewell andits drainagezoneis oftenadvocated.it was noted,Isowever, thmnt for agascon(lensatereservoira representativesamplemay he obtained (luring nonsnmml operaliounif aquasi-steadyStatezonearoundtheproducercanbe acinneved.
Tine condensateinitially is formed aroundthe weilbore, when the pressurefalls below line dewpoint and thetwo phaseregion, referredto as the condensatering, grows into tIne reservoirhulk by continualproduction,Figure9.24. Thecondensatesaturmnlionnat army locatiorn increuiscsdue to the local reduction of pressureand the inflow of rich gastowards the proiluncer. Tireincreasein condensatesaturationincreasestime condensaterelative permeushilitymind decreasesthe relativepermeabilityof tine gas, Figure 9. 17. Tisis results in amm increaseof coundensaletogasfractional flow out of that region asdescribedby Eqs.(9.2l-22). Hence,line condensmulesatuura(ionincreasesonly to thevalue winch nnaintmsins(tie associatedfrmictiomumil flow. As tinecondensateaccumulationdiminisises,nun unpproximnsatequuasisteadysImile msmmmy bc eslmublisimedinsthuit regiour,with theoverall coumnpositiomsof theountflow beinnglIne sunmnseas timmmt tlowinrg imsto tImeregion. However, if line abovearguumentwas strictly valid lisrougluouut tine two plsascregiusmi,the region should nol grow at all winich is not tine case. Nevertlseless,it is a rcasonmahIeassunmptionfor practicalpurposes.
Fignure9.24. Gas-condensumledistributionarouuumda producer.
U.
>
(It
C0
aCI5))0)
CI
C0)‘aCa0
Figmire 9.25 showstime growtlm of line two phaseregionby depletionas simulatednumericallyfor a typical Nortln Scum produmcer. ‘lime overall connnpositiounof the producedfluid with time issimowmm in Table9.13. Note tlsat tIme compositionchangesvery littlc with time andit is almostthesaneasthat of theoriginal reservoirfluid, in spiteof the significantly extendedcondensatering. I tencccollectingtire producedflunid canprovidea reasonablerepresentativesampleof theoriginal siumgle phumsegums. If lime rmute is decreasedto reducethe draw down, similar to thennnetlso(lusedin oil smnmnsplirmg. tIme resullinsgpressurebdmiid-up not only vaporisesthecondensateiuslo lire gas plsase.html mnlso dunmrps sonsseconmdemmsatcinto the well, as a lower condensatesmmlumrmmtiOn is requmiredto unmmuintmiin tine rcdunce(l condensatefractional flow. Both actionsmayleadto mm smmnmnpiemssunciuricher thununtIne original reservoirfluid.
Time. [lay
Figmure 9.25. Growtir of commdcnsmuterimmg witin linme for a typical North Seaproducer.
Tine collectedsausuplecminn he innrprovcd fuurtlncr winenr line reservoirgasdew poinmt is known,mnsiung lIme comnclumsiuimm ohtuummcd iun tIne mecombinuutionmexercise describedin Figunre 9.22, asfollows. The two plnumsc sulnnulslcscuullcctedat lime sumrfmmcemire rcconsbinedat the nnicasuredGLRto obtumin line welihmead stremmun. ‘lIne usnixture is linen brougist to equilibrium at the averagereservoirflowimrg pressmsre(or line imottonsn hole pressure)and temperatureand the remainingliquid plnunscis removed. Ann nmdeqummmle volumunseof line rensnovedliquid is addedback to thegastomnatcln its dewpoint pressmureto theinitimml reservoirvalume.
Sauur.uion
•
• Original
Recom.Pies. 20.7 MPa
to
a
cm’
Distaist~c
to tOO 000
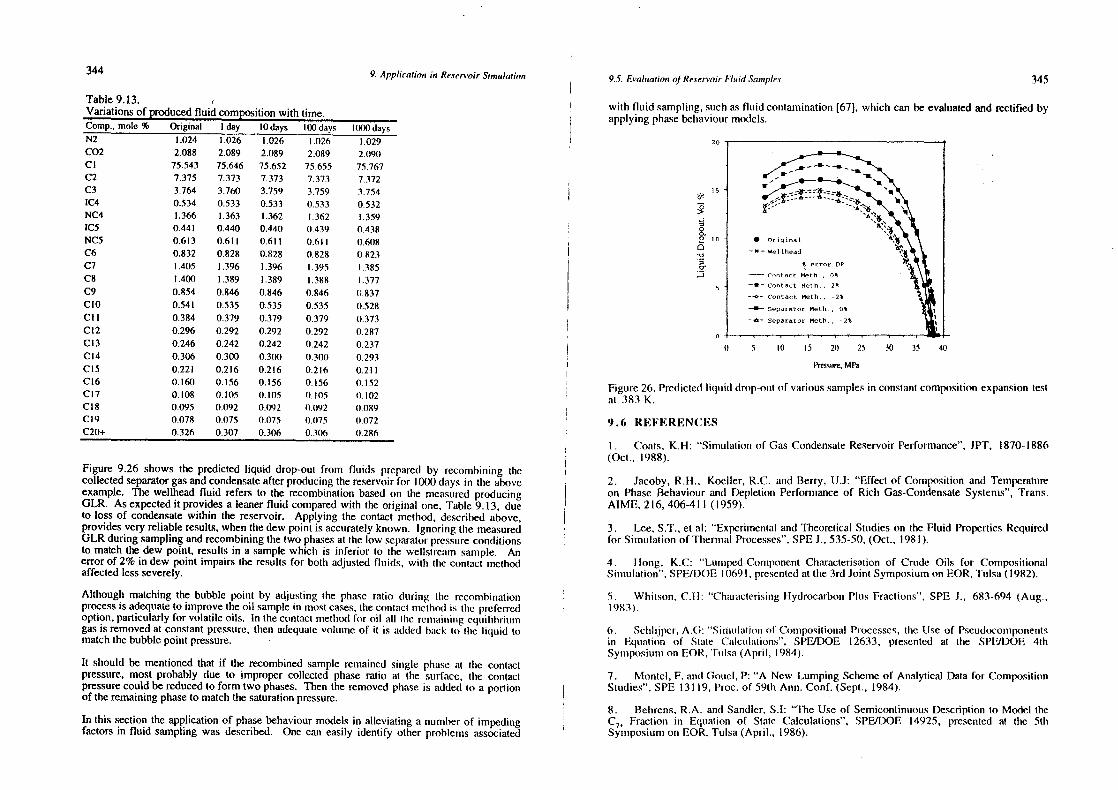
344 9. Application mum Reservoir Simulation 9.5. Evaluation of Reservoir Fluid Samples 345
Table9.13.Variationsof producedfluid cornp~tionwith time.Comp., mole % Original I day 10 days 100 days 1000 daysN2 1.024 1.026 1.026 1.026 1.029C02 2.088 2.089 2.089 2.089 2.090CI 75.543 75.646 75.652 75.655 75.767C2 7.375 7.373 7.373 7.373 7.372C3 3.764 3.760 3.759 3.759 3.7541C4 0.534 0.533 0.533 0.533 0.532NC4 1.366 1.363 1.362 1.362 1.3591C5 0.441 0.440 0.440 0.439 0.438NC5 0.613 0.611 0.611 0.611 0.608C6 0.832 0.828 0.828 0.828 0.1(23Cl 1.405 1.396 1.396 1.395 1.385C8 1.400 1.389 1.389 1.388 1.377C9 0.854 0.846 0.846 0.846 (1.837ClO 0.541 0.535 0.535 0.535 0.528Cli 0.384 0.379 0.379 0.379 0.373Ct2 0.296 0.292 0.292 0.292 0.287C13 0.246 0.242 0.242 0.242 0.237CI4 0.306 0.300 0.300 0.300 0.293CIS 0.221 0.216 0.216 0.216 0.211CI6 0.160 0.156 0.156 0.156 0.152C17 0.108 0.105 0.105 0.105 0.102C18 0.095 0.092 0.092 0(192 (i.089CI9 0.078 0.075 (1.075 0.075 1)072C20+ 0.326 0.307 0.306 0.306 0.286
Figure 9.26 shows the predictedliquid drop-out from flumids preparedby recombinmingthecollectedseparatorgasandcondensateafterproducingthereservoirfor 10(X) days in the aboveexample. The wellheadfluid refers to the recombinationbasedon the measuredproducingGLR. Asexpectedit providesa leanerfluid comparedwith the originalone, Table 9.13, dueto loss of condensatewithin the reservoir. Applying the contact method,describedabove.providesveryreliable results,whenthedew point is accuratelyknownm. Ignoring the measuredGLR duringsamplingandrecombiningthetwo phasesat thelow separatorpressureconditionsto match the dew point, resultsin a samplewhich is inferior to the wellstreunun sample. Anerrorof 2% in dew point impairs theresultsfor both adjustedfluids, with time contact methodaffectedlessseverely.
Although matchingthe bubble point by adjusting the phase ratio dunring tIme reconmhinationprocessis adequateo improvetheoil samplein mostcases,thecontunc unmethodis tine preferredoption,particularlyfor volatileoils. In thecontactnnetlmod for oil mill lIme remmmmuinminrg eqnilihriunngasis removedatconstantpressure.Omen adequatevoluumne of it is muddedbuick to time liquid tomatchthebubblepoint pressure.
It should be mentionedthat if the recombinedsampleremainedsingle plnase at the contactpressure,most probably due to improper collected phase ratio at the surface, the conntactpressurecouldbereducedto form two phases.Then theremovedphaseis addedto a portionof theremainingphaseto matchthesaturationpressure.
error OP— (‘rotact nieth. , 0%
—•— Cootact Seth.. 2%
0 5 tO 15 20 25
with fluid sampling,suchasflunid conntamination[671, which can beevaluatedandrectified byapplying phasebeinavmourmodels.
so
15520
aa2 ma0‘aaa.
-J
Figure26. Predictedliqumid drop-oumt(if various samplesin constantcompositionexpansiontestat 383 K.
9,6 REFERENCES
I. Coats, K.Fl: “Sinrmumlalion of GasCondensateReservoirPerformance”,JPT. 1870-1886(Oct., 1988).
2. Jacoby,R.l1., Koehler, R.C. and Berry, U.J: “Effect of Conspositionannd Temperatiureon PimaseBehaviour and Depletioum Performanceof Rich Gas-CondensateSystenms”, Trans.AIME, 216, 406-411(1959).
3. Lee, ST., et al: “Experinnemntaland TheoreticalStudieson theFluid PropertiesRequiredfor Sinmnulation of Tinermal Processes”,SPEJ., 535-50,(Oct., 1981).
4. IIommg, K.C: “Lunmmped-ConnmponentCharacterisationof Crtude Oils for CompositionalSiusnumlatioms”,SPE/DOE10691.presentedat time 3rd Joint Symposiunsnon FOR,Tulsa(1982).
5. Whitson. Cii: “CisaraclerisingHydrocarbonPlus Fractionss”, SPEJ., 683-694(Aug.,1983).
6. Scinlijpcr, AG: “Siuinuluntion of ConmmpositionnmlProcesses,theUse of Pscudoconmmponentsinn Eqsmmmtion of SImile Calcuulmitions”, St’E/DOE 12633, presented at the SPFJDOF 4thSynsmposiummmmon EOR, ‘fsulsmn (April, 1984).
7. Montel, F. mind Gouel,P: “A New Lumping Schemeof Analytical Data for CompositionStudies”,SPE 13119,i’roc. of 59tlm Ann. Conf. (Sept., 1984).
8. Behrcns,R.A. and Sandier,SI: “The Use of SemicontinuotusDescription to Model theC
70Fraction in Equation of State Calculations”, SPE/DOE 14925, presentedat the Stim
Symposiumon EOR, Tulsa(April., 1986).
• Oriqinai
“~%—Wet Ihead
-~- (‘oetaot C4eth.. -2%
—-“ SeparatorSeth., 0%
“A- SeparatorSeth. , -2%
Pressure,M1’a
30 35 40
In this sectiontheapplicationof phasebehaviourmodels in alleviating a numberof impedingfactorsin fluid samplingwas described. One can easily identify other problemsassociated
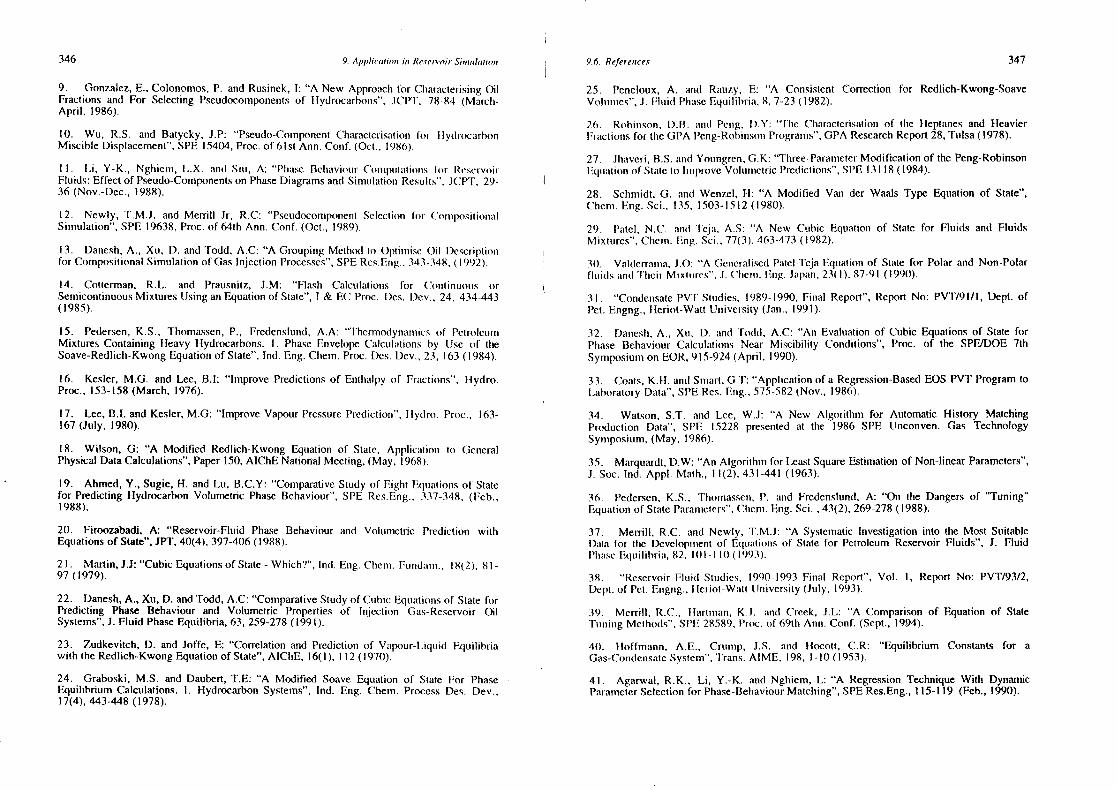
346 9. Applim’atiouu in Reservoir Si,,uu,latjo,n 9.6. Reference.u 347
9. Gonzalea,E..Colonomos,P. and Rusinek, i: “A New Approacim for ClsuuracterisingOil 25. Pemmeloux, A. aumd Raumzy. F: “A ConsistentCorrection for Redlich-Kwong-SoaveFractions and For SelectingPseudocousrponentsof liydrocmnrhonms”, JCPT. 78-84 (Marclm- Volununcs”,J. Fisuici PhmmseEqunihibria,8,7-23(1982).April. 1986).
26. Rohimmsonm, DR. mmmd Pcusg, l).Y: “tine Clmarunctcrisumtioum of lIne iteptanes and 1-leavierTO. Wu, R.S. and Batycky, J.P: “Pseudo-ConnponcntCharacterismutiourl’or llydrocmmrhon Fractionsfor theGPA Pensg-RohimmsomrProgranmss”,GPA ResearchReport28,Tulsa (1978).Miscible Displacement”.SPE15404, Proc.of 61stAnmn. Conf. (Oct., 1986).
27. Jhavcri,B.S.umumd Youngren,G.K: “Tisree-ParanuieterModificalion of thePeng-RobinsonI I . Li, Y— K., Nghicnmm, L.X . antI Siu, A: ‘‘Pinase Flelnmnvioumr Comiupumlmmtionns Ior Rescu’voir Equmntionof Stuiteto Inmnprovc VolumnmmctricPredictionns’’,SI’E 13 118 (1984).Fluids: Effect of Pseudo-Componentson PhaseDiagramsand SinnuiationnResults”, JCPT,29-36 (Nov-Dec., 1988). 28. Schmidt,G. and Wenzel,H: “A Modified Van der WaalsType Equationof State”,
Clmcnr. Eng. Sd., 135, 1503-1512 (1980).12. Newly, T.M.J. and Merrill Jr. R.C: “PseudocomponentSelection for ComnspositiounmslSimulation”,SPE 19638, Proc.of 64th Atm. Conf. (Oct., 1989). 29. Patel, N.(’. anmd Tejmm, AS: “A New Cubic Equmations of State for Fluids and Flumids
Mixtures”, Cinenm’u. Eng. Sci., 77(3), 463-473(1982).13. Daumesh,A., Xu, D. andTodd, A.C: “A GroupingMethod to Optinnisc Oil i)cscriptionmfor CompositionalSimulation of Gas InjectionProcesses”,SPERes.Eung.,343-348,(1992). 3t). Valderrannnmn,JO: “A GemmeralisedPumtcl-’I’eja Equatioum of State for Polar and Non-Polar
litmuls amid ‘their Mixluures”, J. (‘lucumu. Fusg. Japmmn. 23(l). 87—91 (1990).14. Cotternnan, R.L. and Prausnitz, J.M: “Flasln Calculatiorus for (‘onmliumuous orSemicontinuousMixturesUsingan Equationof State”, I & EC Proc. Des. Dcv., 24, 434-443 3 I “CondensatePV’I’ Stumdies, 1989-1990,Final Report”, ReportNo: PVT/9I/I, Dept. of(1985). Pet. Engng.,hleriot-Watt University (Jan., 1991).
15. Pedersen,KS., Thomassen,P., Fredensluumd,A.A: “Tinerurnodynmunmssics (11 Petroleummmm 32. [)nmnrcsim, A., Xtm, D. and Todd, AC: “An Evaluuation of Cubic Equationsof State forMixtures Containing Heavy Hydrocarbons.I. PhaseEnvelopeCalculmmtions by Use of the Pinase Behaviour Calculations Near Miscibility Conditions”, Proc. of the SPE/DOE 7thSoave-Redlich-KwongEquationof State”, md. Eng.Chem. Proc. Des. Dcv., 23, 163 (1984). Symposiuunon FOR,915-924(April, 1990).
16. Kesler, MG. and Lee, B.!: “Improve Predictionsof Ennthmulpy of Frmmctions”, 1Iydro. 33. Coats,Ku. andSnnnmnrt, G.T: “Application of a Regression-BasedEOS PVT ProgramtoProc., 153-158(March, 1976). LaboratoryData”, SPERes. Eung.,575-582(Nov., 1986).
17. Lee, B.!. andKesler.MG: “Improve VapourPressurePrediction”, Hydro. Proc., 163- 34, Watson, ST. ammd Lee, W.J: “A New Algorithun for Automatic History Matching167 (July, 1980). Production Data”, SPE 15228 preseumtedat the 1986 SPE Unconven. Gas Technology
Synrmposium,(May, 1986).18. Wilson, G: “A Modified Redlich-Kwong Equationof State, Applications 10 GeumeralPhysicalDataCalculations”,PaperISO,AIChENatiou)aI Meeting,(May, 1968). 35, Marquam-dt,D.W: “An Algoritlnnsn for LeastSquareEstimationof Non-linearParameters”,
J. Soc. md. AppI. Math., 11(2), 431-441 (1963).19. Ahmed, Y.,Sugie,H. and Lu, B.C.Y: “ComparativeStudyof Eight Equationsof Statefor PredictingHydrocarbonVolunmetric PhaseBehaviour”, SPE Res.Eng.,337-348, (Feb., 36, Pederscn,KS., Tlmouinasscn,P. aund Fredenslund,A: “0mm the Dangersof “Tuning”1988). Equumtionof State Paranmmctcrs”.Clncnn. Eng.Sci. .43(2), 269-278(1988).
20. Firoozabadi, A: “Reservoir-Fluid Phase Behaviour and Volunmetric Prediction with 37. Merrill, R.C. and Newly, ‘F.M.J: “A SystematicInvestigationinto the Most SuitableEquationsof State”,JPT,40(4). 397-406(1988). 1)ala for tIne 1)cvelopussentof Equnationsof State for Petroleum Reservoir Fluids”, J. Fluid
Plnmnsc Equuilibrimm, 82, Ii) I — lIt) (1993).21. Martin, i.J: “Cubic Equationsof State - Which?”, Ind. Emmg. C’lneunm. Funsdzmumm., 18(2), 81-97 (1979). 38. “ReservoirFluid Studies, 1990-1993Final Report”. Vol. I, Report No: PVT/9312,
Dept.of Pet. Enigung., 1 lcriot-Wmitl Utsiversity (July, 1993).22. Danesh,A., Xu, D. andTodd, A.C: “ComparativeStudyof Cubic Eqimultiounsof Stale forPredicting Phase Behaviour and Volumetric Properties of hnnjcction Gas-ReservoirOil 39, Merrill, R.C., Itarlminan, K.J. ausd Creek, iL: “A Comparisonof Equation of StateSystems”,J. FluidPhaseEquilibria, 63, 259-278(1991). Tunnming Metimods”. SPE28589, I’roc. of 69th Ann. Conmf. (Sept., 19.94).
23. Zudkevitch, D. and Joffe, E: “Correlationand Predictionof Vapour-Liquid Equilibria 40. lloffusmann, A.E., Crummmp, IS. and hlocott, CR: “Equilibrium Constants for awith theRedlich-KwongEquationof State”,AIChE, 16(1), 112(1970). . Gas-CondensateSystem”,Trans. AIME, 198, 1-10(1953).
24. Graboski, M.S. and Daubert, T.E: “A Modified Soave Equationof State For Pirase 41. Agarwal, R.K., Li, Y.-K. and Nglmiem, L: “A RegressionTechniqueWith DynamicEquilibrium Calculations. I. HydrocarbonSystems”, Ind. Eng. Cheun. ProcessDes. Dcv., ParameterSelectiommfor Phase-BehaviourMatching”,SPERes.Eng.,115-119 (Feb.,1990).17(4), 443-448(1978).
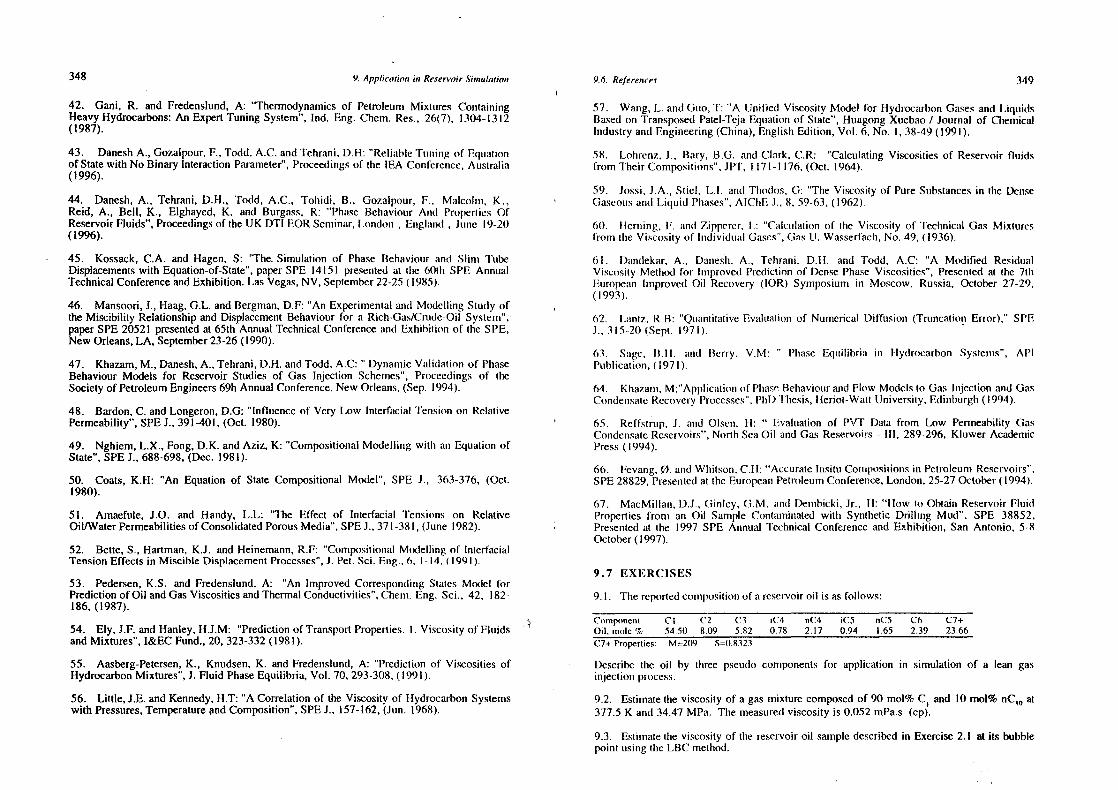
348 9. Application i,m Reservoir Sjrnula(jo,u 9.6. Refere,mr-e.a 349
42. Gani, R. and Fredenslund,A: “Thermodynaunicsof PetroleuunmMixltmres ContainingHeavyHydrocarbons:An Expert Tuning System”, Ind. Eng. Chem.Res., 26(7), 1304-1312(1987).
43. DaneshA., Gozalpour.F., Todd,AC. andTehrani,D.H: “Relimmhle Tunmminsg of Equmumlionof Statewith No Binary InteractionParameter”,Proceedingsof the lEA Conference,Australia(1996).
44. Danesh,A., Tehrani,D.H., Todd, A.C., Tohidi, B., Gozalpour,F., Mmmlcolusn, K.,Reid, A., Bell, K., Elghayed, K. and Burgass, R: “Phase Behaviounr And PropertiesOfReservoirFluids”, Proceedingsof theUK DTI EOR Seminar,London , Eunglaund , Jumne 19-20(1996).
45. Kossack, CA. and Hagen,S: “The. Simulation of PhaseBehaviounr mind Siitsm TubeDisplacementswith Equation-of-State”,paperSPE 14151 presentedat tine ôOlln SPE AnnualTechnicalConferenceandExhibition,LasVegas,NV, September22-25 (1985).
46. Mansoori,I., Haag,G.L. andBergman,D.F: “An Experimentaland Modelling Studyofthe Miscibility RelationshipandDisplacementBehaviourfor a Rich-Gas/Crude-OilSystenni”,paper SPE20521 presentedat 65th Annual TechnicalConferenceand Exhibition of the SPE,New Orleans,LA, September23-26(1990).
47. Khazam,M., Danesh,A., Tehrani,D.H. andTodd,AC: “ Dynamic Validation of PhaseBehaviour Models for Reservoir Studiesof Gas Injection Schenres”,Proceedingsof IheSociety of PetroleumEngineers69h AnnualConference,NewOrleans,(Sep. 1994).
48. Bardon,C. andLongeron.D.G: “Influence of Very Low lnterfnnciai Tenmsion mm RelativePermeability”,SPE1., 391-401,(Oct. 1980).
49. Nghiem,L.X., Fong,D.K. andAziz, K: “CompositionalModelling witim an EquationofState”,SPEJ., 688-698,(Dec. 1981).
50. Coats, K.H: “An Equationof State Compositional Model”, SPE J., 363-376, (Oct.1980).
51. Amaefule, J.0. and Handy, L.L: “The Effect of Interfacial Tensions on RelativeOil/WaterPermeabilitiesof ConsolidatedPorousMedia”, SPEJ., 371-381,(June 1982).
52. Bette,S., Hartman,K.J. and Heinemann,R.F: “Consnpositiomiuil Modelling of lunterfuncialTensionEffectsin Miscible DisplacementProcesses”,J. Pet.Sd. Eng..6, 1-14, (1991).
53. Pedersen,KS. and Fredenslund,A: “An improved CorrespondimngStatesModel forPredictionofOil andGasViscositiesandThermalConductivities”,Chens.Eng. Sci., 42, 182-186, (1987).
54. Ely, J.F. andHanley,H.J.M: “Predictionof TransportProperties.I. Viscosity of FluidsandMixtures”, I&EC Fund.,20, 323-332 (1981).
55. Aasberg-Petersen,K., Knudsen,K. and Fredenslund,A: “Prediction of Viscosities ofHydrocarbonMixtures”, J. Fluid PhaseEquilibria, Vol. 70, 293-308,(1991).
56. Little, J.E. andKennedy,H.T: “A Correlationof the Viscosity of HydrocarbonSystemswith Pressures,TemperatureandComposition”,SPEJ,, 157-162,(Jun. 1968).
57. Wang,L. andGino, T: “A Unified Viscosity Model for HydrocarbonGasesand LiqunidsBasedon TransposedPatel-TcjaEquationof State”, uluagongXuebaoI Jourumalof ChemicalIndustry andEngineering(China),EnglishEdition, Vol. 6, No. I, 38-49(1991).
58. Loinrenz, J., Bary, B.G. andClumrk, CR: “Calculating Viscositiesof Reservoir fluidsfrom Tlmeir Compositions”.JP’f, 1171-1176,(Oct. 1964).
59. Jossi,J.A., Stiel, LI. aumdl’hodos. 0: “The Viscosity of PureSubstancesin the DemmseGaseoumsmind Liquid Phases”,AIChE J., 8, 59-63,(1962).
60. I lernning, F. and Zippcrcr. L: “Cmulculation of tIme Viscosity of TechnicuniGas Mixturesfronsm theViscosity of IndividualGases”,GasU. Wasserfach,No. 49, (1936).
61. Dandekar, A., Dumumeslm, A., Tehrani, DII. anmd Todd, A.C: “A Modified ResidualViscosity Metis(xI for lnnprovedPredictionof DensePlmase Viscosities”, Presentedat the 7tinEuropeanimprovedOil Recovery (IOR) Syusmposiumnin Moscow, Russia, October 27-29.(1993).
62. Lusmrtz, RB: “Quuantitmntive Evalumalionof Numerical Diffusion (TruncationError),” SPFJ., 315-21) (Sept. 1971).
63. Smmge. 13.1I. mmd Berry, V.M: “ Plmuusc Equmilibrimi in Hydrocarbon Systeimms”, APIPuhlicationr,(1971).
64. Khazaunn,M:”Applicmmtionm of Pimmm.sc BehaviourandFlow Models to Gas innjection andGasCondenmsuiteRecoveryProcesses”,PinE) I’isesis, Ileriot-Watt University,Edinburgh(1994).
65. Reffstrunp, J. ammd Olsen, Fl: “ Evaluation of PVT Data from Low PermeabilityGasCondensateReservoirs”,North SeaOil and GasReservoirs - lii, 289-296, Kluwer AcademicPress(1994).
66. Fevang,0. antI Wlmitson,Cl!: “AccurateInsitu Conmmpositionsins PetroleunnReservoirs”,SPE28829.Presentedat theEuropeanPetroleumConferensce,London,25-27October(1994).
67. MmncMillan, Di.. Ginicy. G.M. mmnd Dennmhicki, Jr., Il: “ilow to Obtain ReservoirFluidPropertiesfrons an Oil Sanmple Contamtniunatedwitin Synthetic Drilliimg Mud”, SPE 38852,Presemmtedat the 1997 SPE Annual TechnicalConferenceand Exhibition, San Antonio, 5-8October(1997).
9.7 EXERCISES
9.1. Tine reportedcousnpositiounof a reservoiroil is asfollows:
Component CI C2 C3 C4 nC4 iC5 nC5 C6 C7+Oil, umiole % 54.5t) 8.09 5.82 0.78 2.17 0.94 1.65 2.39 23.66C7+ Properties: M=209 S=t).8323
Describe time oil by tinree pseudocomponentsfor application in simulation of a lean gasimmjectionm process.
9.2. Estimatetheviscosity of a gasmixture composedof 90 moi% Cu and 10 mol% nC10
al377.5 K and 34.47 MPa. The unmeasuredviscosity is 0.052 mPa.s (cp).
9.3. E.stinnumtetime viscosity of tIre reservoiroil sampledescribedin Exercise2.1 at its bubblepoint usingtIne LBC nsmetliod.
350 9. Apphcatron in Resen’oir Sinu;ilation 9. 7 Exercises 351
Group/mole t’rac. Oil Gas
I (unmeulmane) 0.446I I 0.79450II 0.28748 0.20083111 0.26641 0.00467
Liquid mote Iraction=0.62975
Compositionalanalysisof volatile oil.Component Moie%Cl 57.53C2 10.16C3 5.83i-C4 1.22nC4 2.06i-CS 1.01nC5 1.70C6 1.40 85 0.67 IC7 2.16 96 0.726C8 2.55 104 0.756C9 2.00 116 0.776ClO 1.55 131 0.781Cli 1.10 148 0.791Cl2 1.00 162 0.798Ct3 0.99 75 0.813Cl4 0.78 187 0.832ClS 0.85 201 0.831C16 0.72 218 0.837C17 0.49 229 0.828Ct8 0.60 243 0.839Ct9 0.5) 260 0.847C20÷ 3.81 419 0.903
9.4. Thereservoiroil in Exercise9.5 wasflashedatthereservoirteunperatureof 373.0K andpressureof 20.79MPa. Theoil wasdescribedby methaneand two componentgronmps, tusingtheequalzlnM metirodandmolaraveragedproperties,asgivenin Fxamnmple 9.3. ‘t’lne predictedresults by a phasebehaviourmodel, unsing the above flumid description, are givemn in thefollowing table. Calculatethe composition of equilibrated phasesin terms of tlme originalcomponents.
13.89 1.6424 42.56lt).45 2.0934 3t.57
7.00 2.9968 17.31* Summuraledliquid wimtn a tcnsiuy of 561 kg/mum’.
9.5. The following setof experimentaldata is avumi’)umhle on a volatile oil. ‘l’muse a pimasebehaviourmodel to the measureddata, and consmparethe predictions of tuned and untunedmodelswith theexperimentalresults.
MolecularWeiglst SpecificGravity
Differential liberatioumtestat 373.1 K.Pressure R
5d Solution 0
0,j Retamivc
MF’a Gas/OilRamin Oil Volunnccud, Relative
Tonal VolumeZ, LiberatedGa.sCompressibiliny
B8
.GasFormations
Factor VolumeFactor34.92 405 2.342 2.34233.54 356 2.168 2.368 1.040 0.0040632.t6 121 2.t)5t 2.395 t.t)07 0.0041030.44 286 I 940 2.429 0.956 (1.110411
28.72 258 1.854 2.487 0.948 0.1)0433
26.3t) 23)) 1.759 2.554 0.916 0.01)45624.24 203 1.689 2.66! 0890 0.0048121.48 177 1.622 2.787 0.818 0.00511
17.34 138 1.5)1 3.220 0.836 0.00639
13.89 lIt 1.441 3.767 0.839 0.0079!0.45 86 1.377 4.823 0.862 0.010827.01) 64 1.329 7.1 12 0.907 0.016993.55 38 I 252 13.777 0.927 0.03422
1.83 25 1.212 27.571 0.969 0.069560.79 4 1.168 63.435 0.963 0.15944
I 1) I .076 1.000
3.0352gramsof condensatewascollectedIromnu Ihe liberatedgasat 288 K and 0.1 MPaof mercurypressure.
Constantcompositionexpansiontestsat 373.1 K.Pressure RelativeVol. (VfVsam) Liquid Vol. Frac.
MPa %
Sepmmratortest at 293.6K.Prcssure (his / Oil Ralio Formnalion Voluuuie SeparatorVolume
5,27 225 1.1320.79 44 1.0390.10 17 1.004‘romal 286 1.764
Densiuyof lIne slock maskoil at288 K = 81)) kg/sun’
35.9635.8235.6)35.3434.9231.1327.6824.2420,7917.34
099540.99580.99700.99781.00001.03941.08721.15081.24701.3948
(I) Separamorflashedgasvolunnne (sc) per virliunune of smock lank oil.
(2) Votuniseof samuratedoil an 34.92 MPaand373.1 K pervolume of stocktankoil.
(3) Voluunc of oil at separalorpressureandmeunperauurepervolume ofstock tankoil.
100.00k83.6675,0068.1460.1052.54
Iorwmmrd conntmmctcxperinmmemnlaldatum witln mmncthanseat 373.1 K and 35.26MPa.3
l’lnasc Oil Gas Oil Gas Oil Gas Oil Gas._c3~ponenm
C1
57.87C
2787
C~ 4.89i.C
4.06
nC4
1.85
78.247.57
4.040.79
1.28
57.039 fit)
5,4))t.tS
I 98
74.468.914.690.92
1.49
57.109.715.691.19
2.03
72.259.725.060.99
.60
56.7310.015.801.212.06
71.4710.00
5.221.021.65
352 9. Application in ReservoirSimulation 353
i-C5
0.95 0.59 0.99nC
51.62 0.97 1.68
C6
1.41 0.75 1.41C
72.26 1.04 2.32
C8
2.76 1.12 2.6.5
C9 2.23 0.82 2.19Cno 1.69 0.58 1.66Cnn 1.36 0.36 1.30Cn2 1.14 0.33 1.07Cns 1.19 0.29 1.10
~ 0.96 0.23 0.87Cns 1.05 0.23 0.97
Cm6 0.86 0.18 0.74Cmi 0.66 0.11 0.63C
150.76 0.13 0.67
C19
0.65 0.10 0.61C
20, 4.92 0.26 4.57
V~d,cnn3
90.00* 22.50*9 40.52~Vequ). cm
367.98 43.71 34.39
Pc’ kg/rn3
604.3 312.0 580.9
0.69 1.01 0.74 1.02 0.761.12 1.70 1.20 1.72 1.240.85 1.41 0.92 1.42 0.951.23 2.27 1.33 2.27 1.361.26 2.55 1.36 2.58 1.42
0.98 2.11 1.05 2.11 1.08
0.69 1.52 0.77 1.47 (1.740.41 1.16 0.51 1.18 0.54
0.41 1.09 0.39 1.08 0.410.36 1.05 0.47 1.03 0.41)11.27 1)81 0.22 (1.82 11.31
0.28 (1.92 (1.31 0.90 (1.32
0.21 0.76 0.24 0.75 0.250.15 1)54 0.16 (1.54 11.160.16 0.65 0.18 t).64 m).190.13 0.56 0.15 11.55 11.150.33 4.17 1)38 4.13 1)39
90.00 22.50* 25.01) 51)00* 2t).tR)
67.98 43.71 27.77 48.96 211.92
61)4.3 312.0 350.5 564.8 358.5
Appendix A: Tables PageNunmher
A. I Properliesof Ptmre CounspoundsA.2 Propertiesof SinmgleCarbonNuumnberGroupsA.3 UniversalGasConstarmtA.4 Binary InteractiommParametersA.5 ConversionFactors
* Volumeof freshoil contactedwith adensityof 563 kg/ni’.** Volumeof methanecontactedat35.26MPa.
APPENDICES
354356357358363
AppendixB: Critical PropertyCorrelationsin Field Units 364
AppendixC: Eqtuatiommof SLoe Expressuomms 368
Appendix I): Equilibriumusm Rumlios 372
Equilibriums RatioCInumrts at 501)0psia (34.47MPa) ConvergencePressure(WA Copyrigtmt. Reproducedwilln permissionfrom: “SI LngineeringE)ataBook” (1980).
354 Appendux A l’able.s 355
Table Al.~~~rties of purecompounds.Name MW 1’, 1’~ v
K K MPa umm’/kgnunotP Z, acenlruc R,uckcu
factor ~kg/kgmuul
Methane 16.043 111.66 190.56 4.599 0.0986 0.2862 0.01)5 0.2894I
Ethane 30.070 184.55 305.32 4.872 0.1455 0.2793 0.0995 (1.28128
Propane 44.096 231.11 369.83 4.248 0.2000 0.2763 0.1523 0.27664
i-Bumane 58.123 261.43 408.14 3.648 0.2627 0.2824 0.1770 0.27569
n-Butane 58.123 272.65 425.12 3.796 0.2550 0.2739 1)2002 0.27331i~Pcntanc 72.150 300.99 460.43 3.381 0.3(158 0.2701 (1.2275 0.2706’
Neopennane 72.150 282.65 433.78 3.199 0.3036 0.2693 0.1964 0.27570
n-Penlane 72.150 309.22 469.7 3.370 0.3130 (1.2701 0.2515 1)26853
2-Melhylpcnlanc 86.177 333.41 497.5 3.010 0.3664 0.2666 1)2781 1)2662’
n-Flexanc 86.177 341.88 507.6 3.025 0.371 0.2659 11.3013 0.26355
n-Ilepnane 100.204 371.58 540.2 2.740 0.428 0.2611 0.3495 0.26074
n-Ocuane 114.231 39883 568.7 2.490 0.486 0.2559 0.3996 0.25678n-Nonanc 128.258 423.97 594.6 2.29(1 0.544 0.252)) (1.4435 I) 25456n.Dccane 142.285 447.3 617.7 2.110 0.601) (1.2465 (1,4923 1)25)17.1
n.tlnslrvaoe 156.312 469.08 639 1.949 (1.659 (1.2419 (1.5303 (1.24990n-Dcsiecane 17t).338 489.47 65% 1.820 0.716 0.2382 0.5764 (1.24692
n.Tridecaune 184.365 508.62 675 1.680 0.775 0.2320 0.6174 0.24698
n-Tetradecane 198.392 526.73 693 1.570 0.830 0.2262 1)6430 (1,24322
n-Penmadecane 212.419 543.83 708 1.481) 0.889 (12235 0.6861 0.2303*
n-Hesadecane 226.446 560.01 723 1.400 1)944 0.2199 (1,7174 (1.2276’
n.tlepuadecane 240.473 575.3 736 1.34)) 1.000 0.2190 (17697 0.21431
n-Ocmadecane 254.500 589.86 747 1.270 1.060 0.2168 (1.8114 (1.22917n-Non~Jecane 268.527 603,05 758 1.210 1.120 0.215)) 0.8522 1)2158’n-t2ico.sane 282.553 616.93 768 1.160 1.170 0.2126 0.9069 0.22811
n.Heneicosane 296.580 629.7 781.7 1.147 1.198 0.2114 0.9220 1)2(197*n-Docosanc 310.610 641.8 791.8 1.101 1.253 0.2095 11.9551) 11.2068’n-Tricosane 324.630 653.4 801.3 1.059 1.3(17 0.21)78 0.9890 0.2038’n-Tetracosane 338.680 664.4 810.4 1.019 .362 (1.2061 1.019)1 0.2011’
74.05 0 3()0()112.91 0.356254.03 0.5070
185.32 05629
(93.90 0.5840229,37 0.6247236.01) 0.5974216.18) 11.6111269.15 0,657%276.71 0.6638118.44 (1.6882359 13 0.707039u) 57 0.72 9.1.1)(.6~ (1 7142482.181 0.7445522.26 0.7527
563,77 0.7617606.05 0.7633647.43 (17722(u8%.50 (1 7772730.05 0.7797771.95 0.7820813.85 1)7869851.67 ().7924897.64 0.7954
939.55 1)7981981.43 0.8(8)4023.41) 0.8025
• Z,A Iroun 11.151exceptthoseidcnlitiedby • whictu are calculatedfrousi lIne Yannada-Gunmncou’rclanuon.
Eq.(l.l3).‘ Parachorvaluesareno be usedonly ins Eq.(8.2t).
Tumble A. I (Cont.).Propertiesof purecoummpotnnds.Naunme MW T, ‘I’, P~ v 4 aceintric Rackeltparaclmor Sp.Gr.
kg/kgunol K K MPa m’/kgmol factor Z9
,
Llhylenc 28.054 169.47 282.36 5.032 t).129l 0.2767 0.0852 0.28054 101.53 0.5000Propylene 42.08) 225.43 364.76 4.612 0.1810 0.2753 0.1424 0.27821 143.02 0.5210I -Bulene 56.107 266.9 4(9.59 4.020 (1.2199 0.2765 0.1867 0.27351 0.6005cis~2-t’5ulcne 56.11)7 276.87 435.58 4.206 0.2340 0.2717 (1.2030 0.27044 0.6286urans-2-Bulenc 56.107 274.03 428.63 4.103 0.2382 (1.2742 0.21820.27212 0.6112Propadiene 40.065 238.65 391.15 5.470 (1.1620 0.2711 0.1596 0.27283 0.5997I 2lltnlaulicnc 54.092 284 444 4.50)) t).2l90 0.2670 0.25090.2685’ 0.6576I 3.tlulaslicnuc 54(192 26874 425.37 4.331) (1,2208 0,2704 0.19320.27130 0.6273
l-l’cuuuene 70.134 101 Il 464.78 3.529 0.2960 0.2703 0.23290.27035 0.6458cis.2.Pcntenc 7(1.114 31(1.1)8 475.93 3.654 0.3021 0.2790 0.24060.2694’ 0.6598tuimns-2-Penmeune 70.114 309.49 475.17 3.654 0.3021 0.2793 0.23730.2697’ 0.65242.Mentuyt-l-Buulcnc 70 114 1)1.1.3 465 3.400 (1.2920 (1.2568 0.22870.2705’ 0.6563IMeslnyl I -l(uHcuue 7)) I It 291 2) 45(1.17 3 5)6 (1.3(121 (1.2817 (1.22860.2705* 0.6322
2 MelIlyl 2.l)nnicuuc 7)) I 14 311.71 .17) 1,4)8) 11.292(1 (1.2535 0.2767 0.2663’ t).66831-tlesenc 84,161 136 61 504113 3.140 0.3540 0.2653 t).2800 0.2660’ 0.6769I-HeplCume 98.188 366.79 537.29 2.810 0.4130 0.2616 0.3310 0.2615* 0.7015(‘yctopcnn~unmc 70.114 322.4 511.76 4.502 0.2583 0.2733 0.19430.26824 210.05 0.761)3Mcmtnytcyclopennane 84.161 344.96 532.79 3.784 0.3189 0.2725 0.23020.2704’ 0.7540Cyclotuesanc 84.161 153.87 551.54 4.075 (1.3079 0.2726 0.21180.27286 247.89 0.7835Me0nylcycluuhexanc 91) 18% 374.08 572.19 3 471 0.3680 (1.2685 0.2350 0.26986 289.0(1 0.7748Lltuylcyctopenmane 98.188 37662 569.52 3.197 0.3745 0.2687 0.2715 0.2667* 0.7712Ellmylcyclohexaunc 112.215 404.95 609.15 3.040 0.4500 0.2701 0.2455 0.2690’ 328.74 0.7921t’tcnicne 78,114 353.24 562)6 4.898 0.2589 (1.2714 0.2108 0.26967 210.96 0.8829‘I’otmucne 92.141 383.78 591.79 4.109 0.3158 0.2637 0.2641 0.2639* 252.33 0.8743Hlmythenneenc 11)6.167 4(19,35 6(7 17 3.609 (1.3738 t).2629 0.3036 0.26186 292.27 0.8744cu-Xylcne 106.167 417.58 63(1.37 3 714 0.3692 0.2630 0.3127 0.2620* 08849nu-Xyleuuc 1(16.167 412 27 617.05 3.541 ((.3758 0,2594 0.3260 0.2620’ 0,8694
s-Xylcnne 106 167 411.51 616.26 3.511 11.3791 0,2598 (1.3259 0.2870’ 0,8666Niun’gen 28.1)14 77.35 I 26.! 3.394 0(191)1 0.2917 0.0403 0.28971 61,12 0.8094Osvgeus 31 999 9(1.17 154.58 5.043 0.0734 0.2880 0.0218 0.28962 1.1421CambonMonoxide 28.010 81.7 132.92 3.499 0.0931 0.2948 0.0663 0.28966Carbon Dioside 44.01)) 194.67 304.19 7.382 0.0940 (1.2744 0.2276 0.27275 82.00 0.8180HydrogenSulptuide 34.082 212.8 373.53 8.963 0.0985 t).2843 0.0827 0.28476 85.50 0.8014SulptucrDioxide 64.065 263.13 430.75 7.884 0.1220 0.2686 0.2451 0.26729 1.3946Ilydrogen 2.1)16 21)39 33.18 1.313 0.0642 0.3053 -0.21500.31997Waler ~l 8.1)15 373.15 647.13 22.055 0.0560 0.2294 0.3449 1.0000* 7.,,irons II 151exceplmtnose idenlitied by * w)uicln arecalculauedfroun Inc Yamada.Gunncorrelation,
1.11)* * t’arachc,rvalues ire to he used only in Fq,(8 .2 I
virmctnu ur SpUr.
356 Appendix A Table.s 357
TableA.2.Generalisedsinglecarbonnumbergroupproperties.
TableA.2 (Commt.).Generalisedsiisglecarbonnunmbergromupproperties.
Ahrned’sConTelation’:
0= A-m-A2
(C,)+ A~(C,,)2
+A4
(C,,)1
+A5
/( C,)
where,
0: Any plsysic;mlproperty(‘,,: Cuirhon grotip nmtnmnnher
w itim connslusnmlsas follows:
SCN MW T, Sp.Gr. I P v 7.,
--(1.268
Acen.F’,ncu. Rackelt
- 4,((.251 (1.269C6 84
K
337
-0.690
K
510MPamVkgrnol
3.271 0.348C7 96 366 0.727 547 3.071 0.392 0.265 (l.28() 0.266C8C9
107121
390416
0.7490.768
574.603
2.877 0.4332.665 0.484
0.261(1,257
0.3120.352
(1.2631)261)
ClOCII
134147
439461
0.7820.793
627649
2.481 0.5322.310 0.584
0.2530.251)
(1.31)90.429
11.2560.253
CI2CI3
161175
482501
0.8040.815
670689
2.165 (1.6352.054 (1.681
(1.2470.244
11.467(1,61)1
(1.251)0,247
CI4 190 520 0.826 708 1.953 0.727 ((241 (IS (6 11.244C15 206 539 0.836 727 1.85.3 ((.777 11.23% (1.571 (1.24(1CI6Cli
222237
557573
0.8430.851
743758
1.752 0.831)1.679 0.874
0.2350.233
0.610(1.643
0.2370.234
C18 251 586 0.856 770 1.614 0.915 0.231 (1.672 0.232Cl9 263 598 0.861 781 1.559 0.951 0.229 (1.698 0.229C20 275 612 0.866 793 1.495 0.997 0.226 0.732 0.226C2l 291 624 0.871 804 1.446 1.034 0.224 0.759 0.224C22 300 637 0.876 815 1.393 1.077 1)221 0,789 0.221C23 312 648 0.881 825 1.356 1.110 0.22(1 (1.815 0.219C24 324 659 0.885 834 1.314 1.147 0.217 (1.841 0.217C25 337 671 0.888 844 1.263 1.193 (1.215 11.1)74 0.214C26 349 681 0.892 853 1.230 1.226 0.213 (1,897 0.212C27 360 691 0.896 862 1.2(10 1.259 (1.211 1)944 0.200C28 372 701 0.899 870 1.164 1.296 0.2(19 (1.96% 11.198C29 382 709 0.902 877 1.140 1.323 0.207 0.91(5 1)196C30 394 719 0.905 885 1.107 1.361 (1.2(15 1(11)8 0.194C31 404 728 0.909 1(93 1.085 1.389 (1.203 1.026 0.193C32 415 737 0.912 901 1.060 1.421 0.21)1 1.1146 (1.191C33 426 745 0.915 907 1.039 1.448 0.199 t.(t63 (1.189C34 437 753 0.917 914 1.013 1.480 0.197 1.1)82 0.188C35 445 760 0.920 920 0.998 1.502 0.196 1.095 (1.187C36 456 768 0.922 926 0.974 1.534 (1.194 1.114 (1.185C37 46-4 774 0.925 932 0.964 1.55(1 0.191 1.124 (1,184C38 475 782 0.927 938 0.941 1.583 (1.191 1.142 (1.11(2C39 484 788 0.929 943 0.927 1.604 0,19(1 1.154 0.181C40 495 796 0.931 950 0.905 1.636 0.188 1.172 0.180C41 502 801 0.933 954 0.896 1.652 0.187 1.181 11.179C42 512 807 (1.934 959 0.877 1.680 (1.185 1.11)5 11.17%C43 521 813 0.936 964 (1.864 1.71)1 11.184 1.2(17 11.177C44 531 821 0.938 970 0.844 1.733 0.181 1.224 0.175C45 539 826 0.940 974 0.83~L__.J.749 0.180 1.232 0.174
----~.--.-.----—--,-.~-L .~ ~&.__
24.96156 — 0.341)79022 2.4941184E-3M — 131.11375,
‘ .468.325751’~ ‘R
S434.38878
0.8671494950.125279
3.414341)8 [-3— 0.9(127283— 2.839627[-5
7.0280657E-32.49433118E-8
—401.856511.1627984
Cu) — 0.50862704 8.7(8)211 [.2 — 1.8484814E-5 1.4663890E-5 1.8518106T~, ‘R
P,, psiav1
,ft’/Ib
915.53747275.56275
5.223458E-2
41.42131712.522269
7.8709139E-4
—0.75861(590.29926384
— 1.9324432E-5
5.8675351E-3— 2.8452129E-3
1.754726412-i
— 1.3028779El1.7117226E34.4017952E-2
Time correlationgivesthecalcunlatedcritical propertiesby WhitsonusingtheRiazi-Daubertcorrelaliotm, Eq.(6.14), andnot tlmosegiveniI~TableA.2.
* Ahmed,T: “ElydrocusrbonPhaseBelnaviour”, Gulf PublishingConmpany,Houston(1989).
TumbleA.3.
Ic, Pc. andye: Calculanedfrom Twucorrelations.Eqs.(6.23-25).Zc: Catculaiedfrom Pcvc=ZcRTcAcenu.ricfactor: Calculatedfrom the Lee-Keslercorrelation,Eqs.(6.9-l0).ZEA. Calculatedfromthe Yamada-Gunncorrelation,Eq.(1.13).
Universalgasconstanivalues.- P. Pressur I’.,IJ_~r~l2r~,,~4 R
numb K cuui’/guunuul 1(2.0567bar K lil/gmot 0.083144MPa K m’/kgmol 0.0083144psia •R ft’/lbmol 10.732
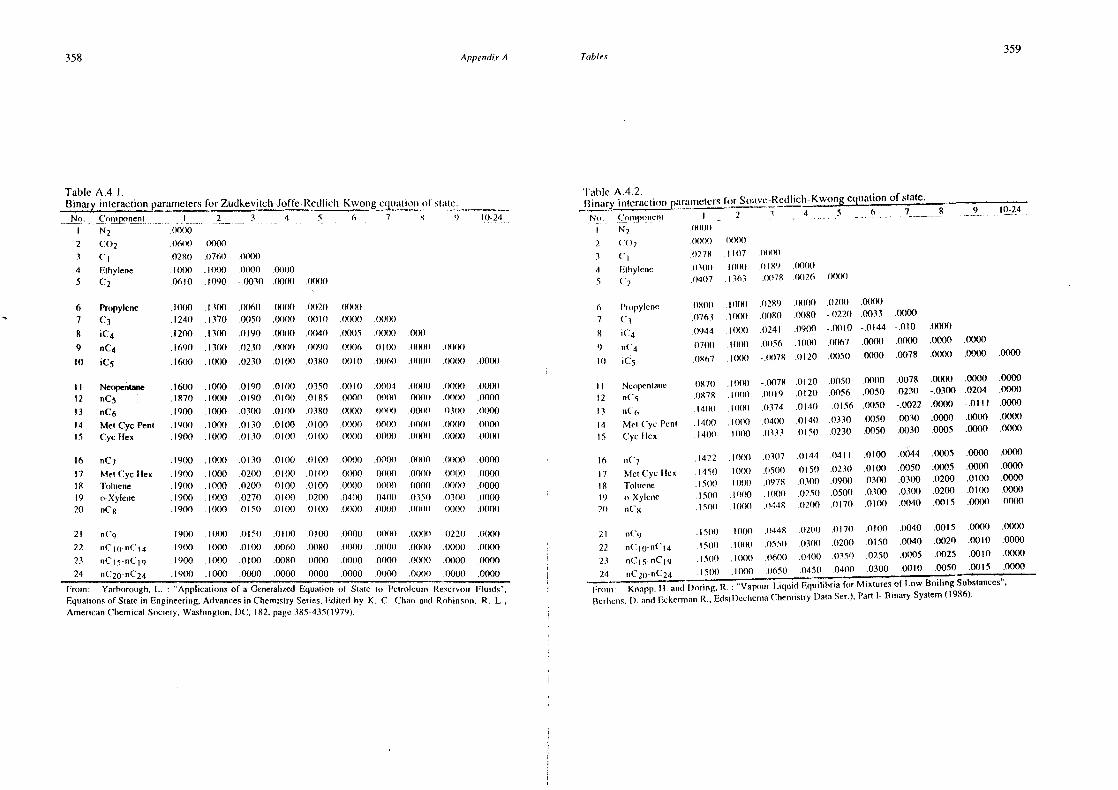
358 Appendix A TabIe.c359
6 Propylene7 C
38 iC
49 nC,~
It) iC~
II Neopent~ne12 nC
5II nC
614 Met Cyc PentIS Cyc Hex
16 nC7
17 Met Cyc Flex18 Totumene19 o-Xytene20 nCg
21 nC9
22 nC10~
n(4
23 uuCIy-n(,’t9
24 nC20
-nC24
.0601) (XXX)
.0280 .0760 .11(8)1)
1(1(10 - (8)0 1)000 .0(8)0.06610 .1090 -.0031) (8)111) .11(8%)
(.onn,pu’uieuuu
I N2
2 ~
3 ~l
4 Pn)uylene
S ~2
6 Propylene7 C
38 iC
49 nC
4I)) iC
5
II Ncopenlnmne12 n(y
13 nCti
4 Men (‘ye PennIS (‘ye Hex
lb nC~7 MelCycttCX8 ‘Toli.mene
19 o-Xyleuue21) nC1(
21 nsCq
22 nCIO-n(’14
23 nCls-nCl9
24 nC2
Q-uiC24
(611)1) 011)1)1
1)278 111)7 0)11)0
(((0(1 .1(118) ((18’) .00(1).0407 .1163 -(8)78 ((026 .0(1(111
((80)1 . 11)1%) .0289 .0000 1)200 .00(1)).0763 1(81)1 .0080 .0(180 -.0220 .0033 (8)00
.0944 1001) .0241 .0900 -.0010 -.0144 -.010 .0000
.0700 111)8) .0(156 . 1(1(1)) (1067 .0000 .0(88) .0000 .0000
.0867 .1(1)8) -.0078 .1)120 .0050 .0000 .0(178 .0000 .0000 .0000
.0870 .10(1) -.0078 .0120 .0050 .0000 .0078 .0000 .0000 .000001(78 .I(1(l() .0019 .0120 .0056 .0050 .0230 -.03(8) .0204 .0000.141))) .1(1)81 .1)374 .0140 -.0156 .0050 -.0022 .0000 -.0111 .000(1.141)0 .1(1)10 .1)418) .0140 .0330 .0050 .0030 .0000 .0000 .0001)1400 . 111)11) .0333.1)151) .0230 .0050 .0030 .0005 .0000 .0000
.1422 .10(1)) .03)17 .0144 .0411 .0100 .0044 .0005 .0000 .0000
.1450 toOl) .1)5(11) .0150 .0230 .0100 .0050 .0005 .00(8) .1)000.1501) .11)111) .0978 .0300 .0900 .0300 .0300 .0200 .0100 .00001500 .1(1(10 .1(11)0 .0250 .0500 .0300 .0300 .0200 .0100 .0000ISO)) 1(10(1 .11448 .02(10 .1)170 .0101) .0040 .0015 .0(11%) .00(10
ISO)) 10(11) .1(448 (1201) .0170 .1)101) .0040 .0015 (101)0 .0(8%)
I 51)1) . 1000 .0551) .0301) .0200 .0150 .0040 (8)20 .001(1 .000015(1(1 . 11)110 1)600 .04110 .035)) .0250 .0005 .0025 .0010 .0000
.1500 .1000 1)650 .0450 .0400 .0300 .0010 .0050 .0015 .0000
Table A.4.l.Binary insteraclionparansetersfor Zudkevitch-Joffe-Redlicls-Kwonsgc,~,atmommof stu~c. _______
— ~—.—.-,3 ~,,,4 , 6 ~ 8 10-24I N
2((000
2 (02
3 C1
4 I2lhylcnc5 C
2
‘I’umhle A.4.2.Binsary insteractionpumraummelCrsfor_S~mvc~Rcdlnclm~Kwofl~e~Iuat~.?n_ofstate. _______________
5 6 7 8 9 1(1-242 3,~4
(8)11(1
.1(11)0 .13(10 .0(16(1 .111)01) .1)0211 (111)1)).1240 .1370 .0050 .0(88) .0010 .11(118) (1)8%)
.1200 . I 30(1 .0190 .0(1(10 .1)040 .0005 .0001) .00(1
.I6’)() .13)81 .0230 .181(111 .1819(1 (111)6 1)1(1)) .11(81) (1111)1)
16(8) .1(1110 .0230 .0101) .0380 .0(11(1 .006)) .00(10 (8)00 .1881))
.1600 .101)0 .0190 .0100 .0350 .0(110 .0004 .0000 .111)01) .0000.1870 .1000 .0190 .0)01) .0185 .01)01) .000(1 .00(1)) .1)00(1 .11(11)0
1900 .1000 .03(10 .011)0 .0380 .18)00 (1(3(1(1 .0011) 1)300 .01)01)
1900 .1000 .0130 .01(10 .1)100 .000(1 .0(8)0 .0)1%) .0001) .0(1001900 . 1(1(11) .1)130 .01(8) .1)100 (81(10 .111)00 .0(1)))) .1811)1) (1001)
1900 - 10(8) .0131) .011)0 .1)101) .0001) .00)1) .0(8)0 .0000 .00(8)
1900 .11)00 .02(8) .0100 .0101) .01)00 .00(8) .001))) ((1))))) .0(11)01900 . 1000 .0200 .0100 .0100 .0000 .0000 .0000 .11)18) .0001)900 .1000 .0270 .01)10 .0201) .0400 .040)) .035)) 1131(1) 31000
.1900 .1(1(1(1 .0150 .01)1(3 1)100 .111)00 .0)100 .0000 (XXI) .11(1%)
19(10 . 000 .1)15)) .1)1(10 .1)1(11) .0000 .1)1)11) .0(11)1) .0220 .0000
9(11) . 0(10 .0100 .0060 .008(1 .18)0(1 .0000 .0001) .1)001) .00(X)
.1900 .1000 .0101) .0080 .0000 .0000 .0001) .000(1 .0001) .0000
.1900 .1000 .0000 .0000 .0000 .0000 .001)0 .00(11) .0000 .0000
Fronn: Yarhorosmgh.L. : ‘Applications of a GeneralizedEquation of Slate In PenroleuunReservoir Fluids’,Equalionsof Stale in Engineering.Advancesinn Cliemislry Series.Ediled by K. C. Chnuo auud Robinson. R. L.,AunmerucanClnetniical Society, Washungmon.DC, 182.page385-435(1979).
Prouun’ Knapp, II and Dorimmg.R. : “Vapour-liquid F.quitihruafor Mixtures of Low RoutingSubstances”,tserticns.1) and EckcrsuianiR.. Eds(l)ceheunsaChemusustryDataSer.),Part I- Binary System(1986).
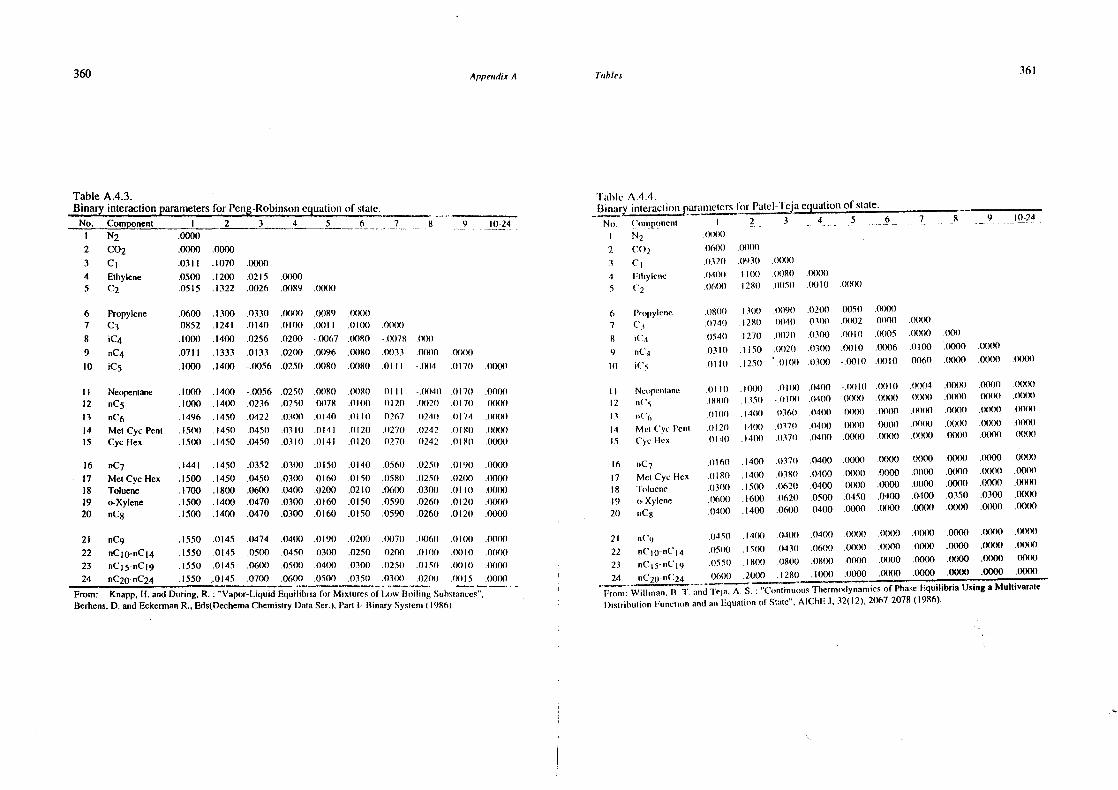
360 Appendix A Tables 361
No. ComponentI N
22 C023 C
14 Ethylene5 C
2
.00(8)
.0000 .0000
.0311 .1070 .0000.0500 .1200 .0215 (88)0.0515 .1322 .0026 (8)89 (11)00
.0600 .1300 .0330 (1)1(1)) .111)89 .18)1111
.0852 .1241 .0141) .011)0 .111)11 .111)10 .0(101)
.1001) .14(8) .0256 .021)0 -.18)67 .18)8(1 -.18)78 .1100
.0711 .1333 .0133 .02()0 .0096 .0080 .01)33 .0(100 .0(11(t)
.1000 .1400 -.0056 .0250 .1)080 .0080 .11111 -(11)4 .1)171) .0001)
21 nC9 .1550 .0145 .0474 .04(10 .0190 .0200 .01)71) .01)611 .1)1(1(1 .00(11)
22 nClO.nCl4 .1550 .0145 .0500 .0451) .0300 .0250 .02(11) .01(8) .111)1(1 .01111(1
23 nCl5-nCl9 .1550 .0145 .0601) .0500 ,()4(10 .030(1 .1)251) .0150 .1)1)1(1 .01)181
24 nC2(XnC24 .1550 .0145 .0700 .060(1 .0500 .035)) .03(11) .1)21(l) (NtIS .00(11)
From: Knapp,H.andDuring, R. : “Vapor-Liquid Equilibria ftsr Mixtures oIl.ow Rolling Subsuances”,Berhens.D. and EckermanR.. l2ds(DechemaChemistry DataSer.),PartI- Binary System(1986).
No.
1
4
5
Coumipoiucnt
N2
C1
[tluylenne
.0800 .131)1) 3)090 .11201) .0050 .00(1(1
.074)) .12811 .0040 .030(1 .0(8)2 0000 3)000
.0540 . I 270 3)02(1 .0301) .111)1)) 11005 .00(11) .1111(1
.1)311) . 1150 .0020 .0300 .01)10 .0()06 .0100 .1)000 (81(11)
OIl)) .1251) ‘~0t11)) .031)0 -.0010 .0010 .0060 .0001) .0000 .0188)
21 nC .0450 . 4(8) .1)11)11 .0400 .0000 .011(8) .00(11) .0001) (811%) (XXX)
22 nC0
-nC14 .0500 .1501) .1)4311 .0600 .0000 .11001) .0000 .0000 (XXX) (1811)
23 nC ).nC1
9 (15511 .18(10 .)t8t)0 .0800 .000() (8)00 .0000 .0(101) .0000 .11(11%)24 un(’
20-nC24 .061)0 .2(100 .128(1 .100(1 .11(8)0 .0000 (1000 .0000 .0000 .0000
Fronni’ Willnnnmn. 1) 1’ nnnd Tejnm. A. S. : “ConminuouusThermodynamicsof PhaseEquilibria Usinga MultivarameDistrihuiion Funclinin nmuuul an Equationof Slunle”, AIChEJ, 32(12),2067-2078(1986).
TableA.4.3.Binary interactionparametersfor Peng-Robinsonequationof state.
2 3 4 5 6 7 8 9 10-24
‘I’ahle A.4.4.Binary interactionsparaussetersfor_Patcl-Tejaequationof state.
6 Propylene7 C’~8 iC49 nC~10 iC
5
II Neopentane12 nC5I’) nC6
14 Mel Cyc PennIS Cyc Hex
I 2 3 4 5 6 7 S - 9 10-24.111)11(1
.11600 .00(11)
.0320 .11930 (((1(1(1
.1(401) .11(11) 11080 .1111(11)
.06)))) .128)1 .11050 .18)11) .11(8%)
16IiIS19
20
nCiMet CycHexlolueneo-XylenenC
1(
.1(100 .1400 -.0056 .0250 .01)80 .0(180 .1)111 -.111)40 .0171) .00(1111000 .14(8) .0236 .025(1 .0078 .0100 .1)1 2() .1)1)211 (1171) .001)0
1496 . 1450 .1)422 .1)3(8) .1)140 .1)11)) 0267 .1)21(1 .1)1 74 .1)0110
150(1 .1450 .04511 .1)31(1 .1)141 .1)12(1 .0270 .11242 .0)80 .1100(1.1500 .1450 .0450 .031(1 .1)141 .0121) .0270 .0242 .1)1 SIt .1)00(1
.1441 .1450 .0352 .03))0 .1)150 .0141) ((561) .1)25)) .019(1 .0000
.1500 .1450 .0450 .0300 .0160 .0150 .0580 .025(1 .0200 .0001)
.1700 .1800 .0600 .0400 .0200 .0210 .0600 .03(8) .011(1 .0001)
.1500 .1400 .0470 .0300 .0160 .01St) .0590 .026(1 .012(1 (XXX).1500 .1400 .0470 .0300 .0160 .0150 .0590 .0260 .0120 (XXX)
6 Propylene7 C~
8 iC4
9 nC,s10 i(’
5
II Nciupcnttanc
12 n(’5
3 nil’6
14 Mel (‘ye l’ennIS (‘ye lIes
lb nC717 Met Cyc HexI 8 l3uluemme19 o-Xylcne20 nC
1(
(1111) . ((XX) —.1)11(0 .0400 -.111111) .01)11) ((004 .11(811) (1(8%) .1111(1)(8)1)1) .I 350 - .1(1(Xi .0401) .1)0(11) .18)18) .11)1(11) .0001) .111)11) (XXX)
11100 .14181 ((360 .0400 .0(1(1(1 .11(8)1) .181%) .11(81)) .111118) .1111)8)
012)) .14(11) .1137(1 .0401) .11(811) (8100 .18)0(1 .0000 (88)0 (1(1111).1)14(1 . (401) .11371) .0400 .0(11%) .1)000 .1501)0 .00(1(1 (XXX) .111(8)
.0160 .141)1) .0371) .0400 .0001) .0(8)0 .01)00 .1111(1(1 .0(100 .111)01)
.0181) . 1401) .0380 .0400 .001)1) .0000 .0000 .0(100 .0000 .000(1
.03(11) .1500 .0620 .0400 .0(11)0 .0000 .0000 .001)1) .0000 .0(8%)
.1161(0 .16(X) .0620 .0501) .0450 .1)400 .0400 .0350 .03(11) .0004)
.1)400 .1400 .0600 .0400 .0000 .11118) .0001) .001)0 .01)01) .00(10
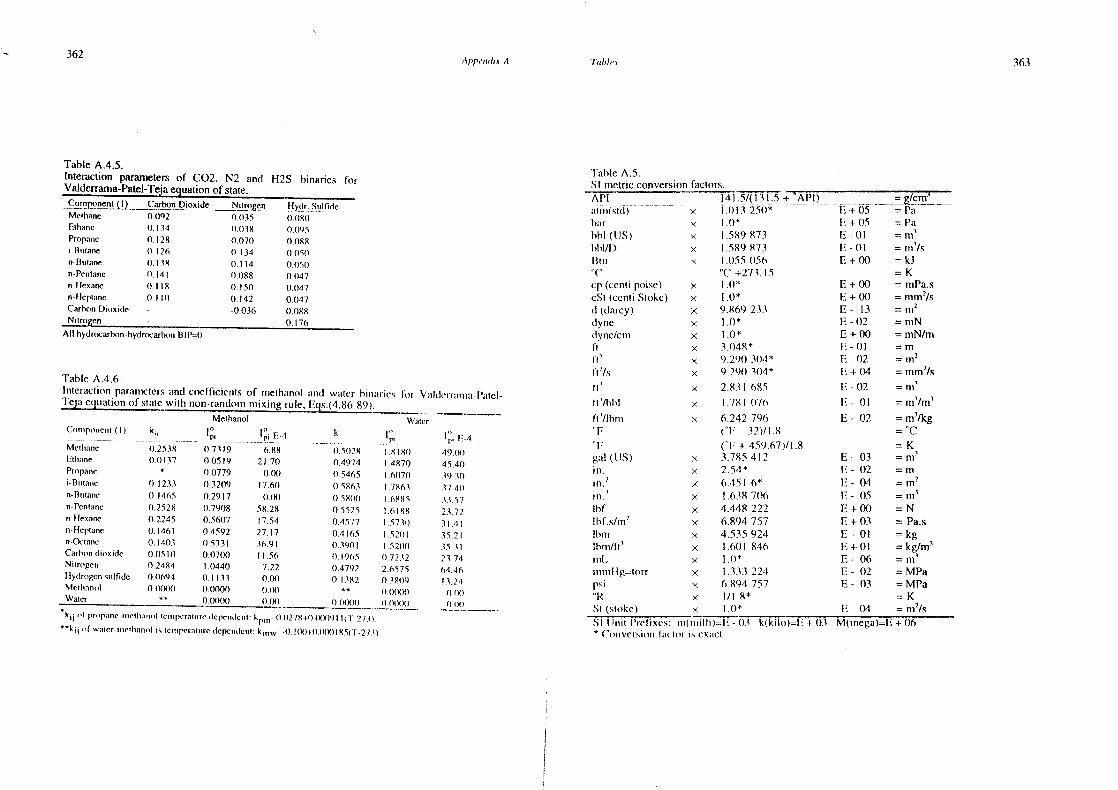
362 /tppendin .4 lable.s 363
Conuponenu(I) k,
Methane ((.2538
Ethane 00(37Propane-Otitane (1.1233
n-lltutane ()l46Sn-Pentane ((.2528n-llexane 0.2245n’Hcptane 0.1461n-Octane 0.1403Carbondioxide 0.1(510Nitrogen 0.2484Hydrogensulfide 00694
Methanol 1) 0000Waler
49.0))45.4))
39.3017 4))
33.5723.723 I .4 I3S.2135.112174
64.46I 3. 2’t
(1)1)
((.1)1)
CI) (ccnti poise)cSI (cenli Stoke)d (darcy)
dync/cnmift1’t”
II’
II ‘/bhl
fI5
/]hmin
gal (US)i Is.inn”jun.
hfhf. s/rn’
lhnnshtmi/ft’
mmml —
nsmuislIg=torrpsi
SI (s)oke)
>< 6.242 796(“F-- 32)/1.8(F + 459.67)/1.8
x 3.785412>< 2W
~< fi,45( fi*x 1.638 706
x 4.448 222x 6.894 757x 4.535 924x 1.601 846x 1.0*x 1.333224~< 6.894 757x
>< 1.0*
12+00E +0012- 13E - 1)2
12- 02 =rn1
/kg= ‘C
E-03 =m1
12-02 =rnE-04 =un~12 — 05 = mm
1
12+00 =N12+03 = Pa.sE-0l =kg12+01 =kg/m
3
E-06 =rn~E-02 =MPa12-03 ‘~~MPa
=K[2 1)4 = mnm’/s
M(nsnega)=13+ 06
TableA.4.5.Interaction parametersof C02. N2 and l-12S binaries forValderrama-Patel-Tejaequationof state.Cornponentjfl~çarbonsDdcN~~ I-lydr. Sulfide - -
Metttane 0.092 0.035 0.08))Ethane (1.134 0.038 0.095Propane 0.128 0.070 0.088u-Butane (1 I 26 1). I 34 (1.050n-Butane 0.138 ((114 0.050n-Penlanc (1,141 (11)88 0.047n-Hexane 0. 11(1 (1 ISO 0.047n-tleplane (1 I 0) (1. 142 0.047
CarbonDioxide - -0.036 0.081),j~~oen - - 0 176
All hydrocarbon-hydrocarbonDIP=0
TableAS.SI nmetricconversionfactors.API - - - ~ feAPI) =~/cm”aImn(sld~ x I .1)1:3 250* 12 + 05 = Pabar x I .0~ 12 + 05 = Pahhl (US) .589 873 12-01 = nss’hhl/I) x 1.589 873 12 -01 = Os’/SIliti 1.055 056 E + (8) = kJ“1’ ‘C+273.l5 =K
x I 1)* = umPa.sx 1.0* = rntn’/s
x 9.869 233 = m’dyne x 1 0~ = nmN
Table A.4.6.Interaclmonparatnletersandcoefficientsof usnellnanol and water hiusarics for Vaklci’ratmta-Patel—‘I’eja equationof statewith non-randonnmixing rule, Eqs.(4.86-89). —___________
Methanol
< 1.0” [2÷00 =rnN/m
x
x
x
3.048k9.291) 304*9.290 304”’
E-0l12 — 0212 + 04
=rn= ma’= nsmm’/s
2.831 685 12 - 02 = bin’
x 1.781(17(5 12 — (II = nls’/m’
Walerl l~~ k I~ 1’~~
- 0.7319 - 6.88 0.5021) 1.1)11)1)0.0519 21.70 ((.4974 1.4870
0.0779 0.01) (1.5465 1.60700.320’) 17.6(1 (1.5863 1.7861
((.2917 0.111) 0.581(0 I 6885(1.7908 58.28 0.5525 1.611180.5607 17.54 (14577 .57100.4592 27.17 ((.4165 1.521(10.5331 36.91 0.3901 1.5200
0.0700 11.56 0.(96S 0.72321.0440 7.22 (1.4792 2.6575
(1.1133 0.01) 0.1382 0.380’)
((1)001) 0.111) ** 11(1)8)))0.1)1)111) 0(1)) 0.00(1)) 0.1(000
ol propane-nietlian,,I ueiniperaturc ulcpendeuiu: kpin=O 0278+11(1111(911(‘I’ 271Y
of waler-uiietltasotus tcunperatunrculepettulcnu kiumw-0. 111(1 + 0.00(11115)‘I’ 271)~SIt
tusml l’,cltxcs: nnn(uniullt)=E—0.1 k(knlt)=l: + (1.1
* (“ouuvenu,ious laclor u.s exacl
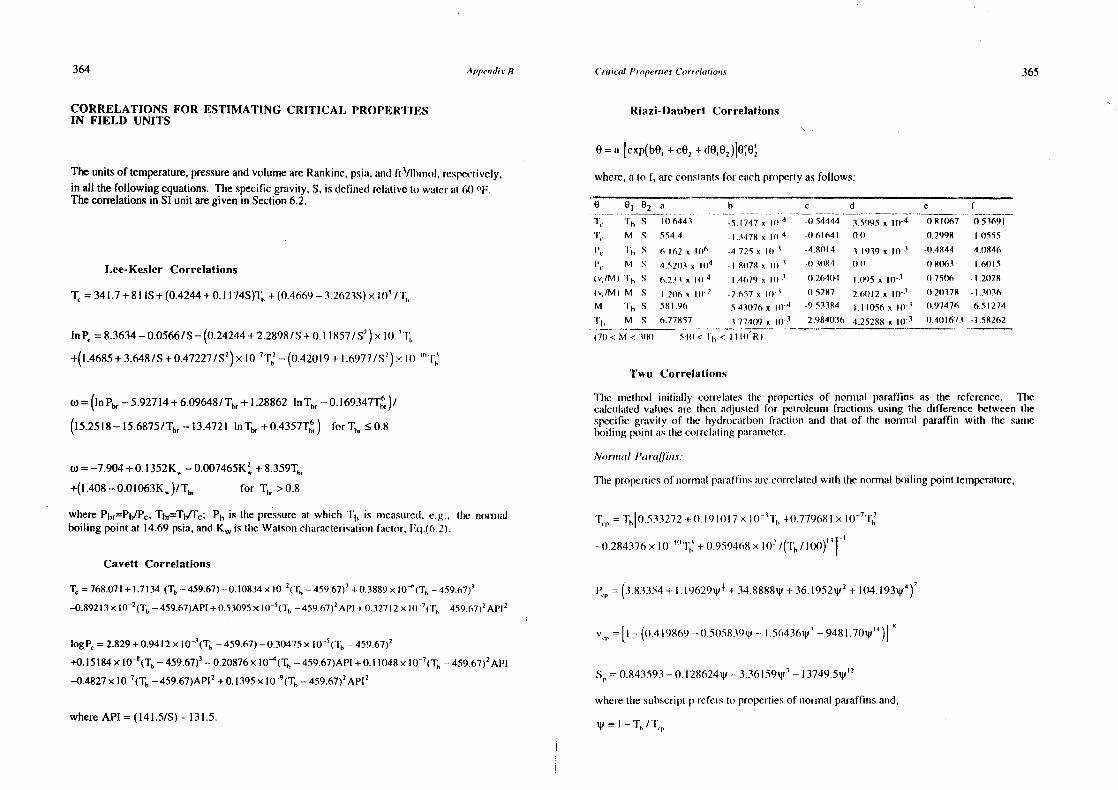
364 ~t,’i’e,udit R (‘ritical l’ropertie. C’orrelal,alu.s 365
CORRELATIONS FOR ESTIMATING CRITICAL PROPERTIES Riazi-Daubert CorrelationsIN FIELD UNITS
0=a [exp(b01
+cO,+d01
O,)J0~O~
I’
Theunitsof temperature,pressureandvolumeareRankine,psia.and ft3
/Ihnmol, m’especlively, where,a to f, areconstantsfor eachpropertyasfollows:
in all thefollowing equations.Thespecificgravity, S. is definedrelativeto waterat60 “F. __________________________ _________________________________________________
Thecorrelationsin SI unit aregivenin Section6.2. 0 ~l ~2 a c d e
‘I~Tt,.S 106443 - ~ -0.544445995k l0-~ 0.81067 - 0.53691
M S 554.4 1.3478 5 I(t~ -((.6164I 0(1 (1.2998 1.0555
l’,. It, ~ 6.162 x Itl~’ -4,725 5 1(1.1 -4.8(114 3.1939x p~3 0,4844 4.0846M S 4.621(3 s ml)~ -1.1(078 lO’~ O,3O84 ((.0 0.8(1663 1.6015
Lee-Kesler CorrelationsI vIM) ‘l’~, S (‘.23) s I ((.4 -l .4679 s 10 ~ -026404 1.095x l0-~ 0.750(1 - 1.21)28
341.7+ 81 IS + (0.4244+0.1 I74S)T~,+(0.4669—3.2623S)x ~ /T5
(vIM) M S .204, x 1(12 -2.657 x tO (1.5287 2.6(112 x lO’~ (1.2(0711 -1.3036M ‘l’~, S 581.96 543076x I))~ -9.53384 1.111)56x lt)-~ 0.97476 6.51274
S 6.77857-. — 3.77409x1(f3
2.984036 -4.25288 5 l0’~ 0.401673 -1.58262
lnP, = 8.3634—0.0566/S—(0.24244+2.2898/5+0.1 1857/5’)xIO ‘1~ ‘(71) < M < 30(1 54(1< ‘l’~, < II IO~R)
+(l.4685÷3.648/S+0.47227/S’)xlO’Tb’ —(0.42019+l.6977/S’)x 1(1 0.1.5
Twu Correlations
W=(lflPbr —S.927
l4
+6
.O9648
/Tb,+ 1.28862 lnTt,, —0.169347T~~,)/ TIne mellmod inilially con-elatesthe propertiesof normal paraffins as the reference. TInecalculatedvaluesare tlmems ad~usledfor petroleum fractiomms using the difference betweentIne
(15.2518— IS.6875
/Tb, —13.4721 InTb, +0.4357T~) for Tbr � 0.8 specificgravity of lIme hydrocarbonfraction andthat of the tsormal paraffin with the sameboilinsg point aslInecorrelatingparameter.
Nornnal Paraf/n,ns:w = —7.904+0.1352K,, — 0.007465K~,+ 8~359Tbr
TIne propertiesof normal paral’lnmnsarecorrelaledwith thenormalboilingpoinl temperature,+(l.408—o.01o63K~)/T~, for Tb. >0.8
wherePhr=Pb’Pc, Tb1
.=T~/T~:~b is the pressureat which Tb is nmeasured,e.g.. the nomnal ‘f = 3’ 10633272+ (1191017~ I 0~1
Tt,+0.779681x I0~7
T5
’boiling point at 14.69psia,andK~is tIme Watsonclnaracterismmlionfaclor. 11(1(6.2).
—0.2843761110tt
T + 0.969468x 10²/(‘I~/100)111Cavett Correlations
T, = 768.071+ 1.7134 (Tb — 459.67)—0.10834 x I02
(Tb —459.67)’+0.3889x 10⁶
(T5
— 459.67)’ P~,= (3.83354+ 1. I9629ip~+34
.8
888W+36.19525V’+ 104.193W~)’
—0.89213x I0’’(T~— 459.67)API+ 0.5309511I0’(T~—459.67)’API + 0.32712x Ill ~(‘1’~—459.67)’API’
= [i —(o.~19869—0.505839w— I .66436w’ —9481logP~= 2.829+0.941211I0
3(Tb —459.67)—0.3047511I0’
5(Tb — 459.67)2
+0.15184x I011
(T~,— 459.67)~ — 0.2087611l0~(Tb— 459.67)API+0.1104811I07
(T5
—459.67)’API
—0.4827x 10’(Tb — 459.67)API’ +0.1395xl0~9
(T5
— 459.67)’API’ S~ = 0.843693—(1.1 28624
W— 3.361691V’ — 13749
wlnere tine subscriptprefers to propertiesof norunalparaffimnsand,
whereAPI=(141,5/S)-131.5. w I — T5 IT,,
366 .41
,j,endiv I-I (ru(ical !‘roperlues (.orre’k,tions 367
Themolecularweightof paraffinsis givenby thefollowing imisplicil relation, 11) = ASp[12.53262_46.I955/7~_(t.(%o(271)1)5’Fh)+
T5
= exp[(5.714l9+2.71579lnM~—0.286590(lnMe)’ _39.8544/(lnM~)—0.122488/(lnMp)’I (I I.4277+252.I40l1~+0.(X)23O535ThJ~Sp]
—24.7522mM +35.3l55(lnM)’
which canhesolvediteratively rIsing thefollowing itnilial guess. AS~ ex~10. 6(S~— S) I —
Mv = ‘F,, /(11). 44 — 0.0062 -a,,) MolccuularWcighI
Pptroleu,,m Fractious. Iu~M = (Imn M~,)I (I f 2 f,,~)1(1 -- 2l’~)~‘
Thepropertiesof anypetroleum fraction areestiuim~ntedby adjusting line calculatedproperliesofthenormalparaffin with tine sameboiling point as,
Critical Temperature: ~uu A5si~’I+ (o.om 75691+ 0.193168/1~)AS0
I
‘F, T~,1(1+ 2fr)/(l —21))I’ “I’ = 0.0123420— 0.328086/T,~
.1. 1 AS,,,= expI5(S~— S)j — I1
T =A.St’ —41.362456/T~4 0.0398285—0.948125/T~ AST
AS.r=CXPF6(Sv S)J —
Critical Volume:
Vc = v~pt(l+2f,)/(l — 2f,)j’
= ~ ~ / T +(— 0.182421 + 3.01721/ T~)AS‘.1
AS, = exp[4(S~ — s2)]—
Critical Pressure:
Pcp(Te/Tcp)(vcpIvc)~I+2fp)/(I_2rp)~2
368 ~ ( -
EQUATION OF STATE EXPRESSIONS
Thegeneralcubic equationof state,Eq.(4.12),
~RT a
v—b v’+uv—w’
takesthefollowing dimensionlessform:
Z~_(1.4~B_U)Z’+(A_BU—U—W2
)Z—(AB—BW’-W’)=O
where
A~—~—, B~-~-, ~ W~!, and(RT)’ RT RT RT RT
flquazu’n of State E.mpre.t.cio~us 369
Immmpiemnsemnlingline raundommmsiximsgmrules for thetnnixlure EOSparameters(Sectiotm4.3.1),
a = ~ , b = ~ , u = ~xu , and w =
we ohlaimm,
B(b./h) A
— ,j___I2~x~a1/a— (u /u)U’ +4(w~/w)W’111lnu~,=—iui(Z—B)+ ‘ + U’ +4W’L t ~1
I 2Z + 1)— ,f~3~+4W21A[~(2z+U)(w /w)W’ +(UZ— 2W’)(u1
/u)U]mi I
[2Z+ [I + ~JtJ2.F4W2j (Z’ + lIZ— W’)(U’ +4W2
) -j
Solution of Cuhk Equation
Z1
-t-a1
Z’ +a,Z+a1
=0
Let,
II D>0, lIme eqtmation inasounly one realmoot:
Z~= (J + \/D) +(J — ,fD)t/~— a1/3
If D<0, tine equmatiomn Imas threerealrools:
Z1
=2,f1~
cos(O/3)—a1
I3
Z, =2,J—Qcos(0/3-l-120’)—at/3
= 2,/—Qcos(0/3+240°)—a1/3
where,
0=cos’t(J/~J_Ql)
A. E.......1 01 ~1 . B~ , ~‘. i[~rmu>~ , ~ufl(iW I Id(nw)1anL ~n Jn,~,.T b[, ~ in
1,1
,T ut ~)n1
Jn,,1
.T Ut ~)un1in,.~,T
with thetotal numberof moles,n, definedas,
fl
If D=0.One equmaliomu Isastinreemeal roots,at leasttwo of tlnern areequal:
= 2J°3
— a1
/3
Q = (3a, — a~>/9
Theaboveequationresultsin thefollowing expressionfor thefugacitycoeJ/Ic:euut0.10purecompound:
A 2Z+U+,JUc4W2ln4=(Z— I)— In(Z—B)— In
VU2÷4W2 2Z÷U-TV’+4W’
Theexpressionforfugacity ofa componentin a mixture is:
ln4 =—In(Z—B)+-~’~--+ A1
A,— uu’ +4WW21
I2Z+U_,fU2+4W21jln}Z—B ,Ju2+4w2L U’-)-4W’ .~ L2~~+tj+’~4’~”i
AE2(2z+U)W;W2‘l~(UZ_2W2)UU1
(Z’+UZ—W2
)(U2
+4W’) jwhere,thedimensionlessderivativesofEOS parametersaredefinedas,
J = (9aua,—27211 — 2a )/54 D=Q1
-fJ’
370 .41~
f~endInC l~.qt4ahiotuofStateExpressuon.i 371
THERMODYNAMIC PROPERTIESUSING PENG-ROBINSONFOS(PR) h, a’ h,\ (v—(~ _i)hJ v1
—(~ — l)b1
v1+(~+ i)b
1]+ Pv
1+—)lnI +
2~2h a’ b ~v+(’f2+l)h v—(’/~—l)h— v+(’12+I)b
P = RT/(v - b) - a~a/[v(v+ h) + b(v - b)] (4.27) wlnerev, is thepartial molarvolutsne.
Whenusingthevolumeshift, tIme correctedpartialmolarenthalpyis given by,~=[l +m(l Tr°5)12 (4.23)
h~”=h1
—c1
Pvcor=v~c (4.31)
Partial Molar Volume
Molar Enthalpy = ~)v ~
v’The total enthalpyis calculatedfrom thefollowing tlnernnodynauinicrelation, ~i)r.r n,.
N Converlimig the molar volume in PR 10 total volume, by multiplying it with in, andH =ç’íP_T(~) }mv + PV + ~ differentiating it, we obtain,
wherethelast term is thetotal internalenergyat low presstmreandprevailingIeulspcralure.and itis determinedby summingthe internalenergyof individual purecomnnponents.
N
(RT+ h,P)(v’ + 2hv — h’) + [2h1
RT—2~x~a11—2h
1P(v— h)}v — b) +b~a
________________________________________________ I ___________________________________________________________________________
Applying thePeng-Rohinsonequationof stateto calculate~,j~j)• using the randoumm mnnixuung =
wles, Eqs.(4.74)and(4.78). anddividing the obtaiunedexpressionby the total number of P(v2 ~2hv — h’) +2P(v— b)(v+b) — 2RT(v+ b)+ amoles, us, resultin.
— a’ (v—(,J~--l)b’ Nh = —InI — ~+ Pv+~x,U,,
2J2b ~v+(’f2+l)h) I
where,
NN
a’ = ~ xx,(l — k,1
)a~’’mm~’[mT,~’’+ x~12
Whenusitngthevoiutnneshift conceptto correcttIme predictedminolar volumne by PR, Eq.(4
.3
I),thecorrectedmolarenthalpyis givenby,
h”’ =Im—cP
Partial Molar Enthalpy
h,~ an,~
Multiplying tine molar enthalpy. h, derived above, by n and differenlualimng tine obtainedexpressionof theIotal entlmalpy. we obtaimn,
-3 53
——
3
,o.n
fl,*
C2
~•~
‘~,~
‘~01
020
000
nOn
3~
‘20
.00
PI
I[1
7—
”——
.-~
4~
“?~
-.~
-~i~
’..L
I-
-~
-~~
-.
I.
•.-.
°
I-
__
__
__
__
__
_:1
~.
/~,4
7--
‘-~
~~
±Jo
~
:~—
~~—
305
0%—
‘00
000
210
300
~O
300
300
‘00
0%00
0
Fig
ure
Dl.
Co
nve
rge
ncep
ressu
reo
fh
ydro
carb
onm
ixtu
res
for
use
with
GP
Ae
qu
ilib
riu
mra
tio
char
ts.
100=
0
30
=0
3000
0
.00
=
00=
0
_,_
l40
_‘~
-.0
-2
3000
0‘
a S S I
.1\-u
,
-~J~
’~!
I~-:
Th-
~~
30,1
“on
//:
~/H
a,
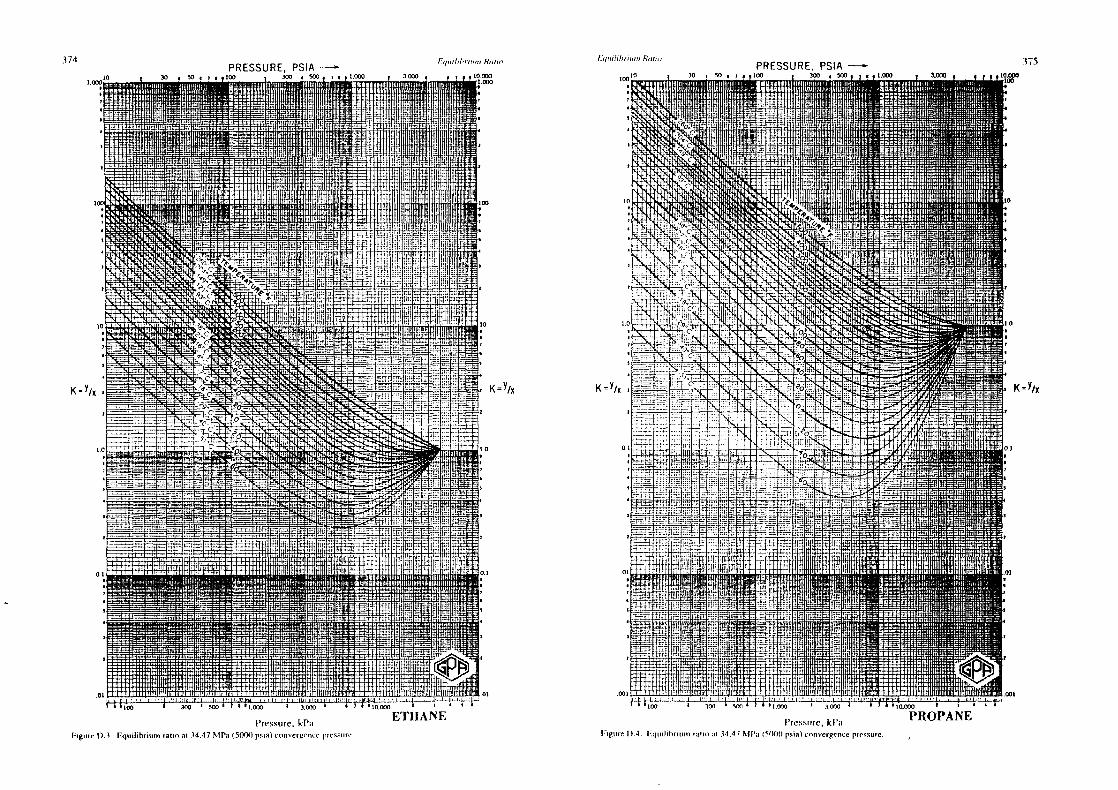
374 Fq,oiI,I~,lr,,;:fuji,, Eq,ul,/n, it,,,, U,,:,,, 375PRESSURE,PSIA,~0 30 , 00 , I 0 100 Y~ . Sam I i.~ 3.~ m3~~io
. . ‘ .. . IL— ~( ~I:. In ~ ~ ~ . , . 4 .1
0 ~ :, ‘ -0 ,C’ ~ ~ ~. .,t , , 3
. ~ .
. :, ;~~5.~ - . I
,-,
00 ~~ . ~ is
: ‘~v 0, _i ., . , .f.s ,,3. . ~ . ‘.
4p .~i,It”
, I :. ~ ., ~.:::s(~~ . ..S ;-~ . ,,~,~ , .. . . V~ . ~ ;,: ~ ~- —~
0 .~ ~ ~ ,.,..v.~ . ,.(‘ .,, , . ,— , , ~ I ~ _‘
!,,, ~ i~:~ l.~ ~3 , ~ 1’ - . . ‘ . , . , ~_i .01 oSno ~ ‘ ‘ ‘ ‘°~
‘Jv ~ . ‘ : . ~ _~. . . . . .. . .. . . —._...‘:c ~— : -- — 0
— ‘~~i1:~’’~.:. -, ~ .~‘ap,,t_ : ~‘. ‘ ‘ . -
; ~ ‘Ii c~,. -:: - - -‘ I.
ii I I .‘ lili ‘ t~ ‘4 I . ‘ .II ~ ~“o-~ ~~ , ,. ,., to
0 ~ _ ~ , . ., I
~ ~ ~ .- ~ . ~ ~
~ ~ ~ .~ .- — 3
~ ~ . . v’~~i~ :~
K =Y/5
~-= _~ _ C’~ _ ~o :._ _ K =Y/x
~ .- -0~ ~-‘. ~ — .0 ~ ~ — .- —. —— — 0
-~----- . - -. - -.~ —:-~-:‘, ~ . .:.. ~it~ o• ~ .. - ‘ .
It ~_.~Tt,.‘:;.. ,;~ —, . i~ ,. ::I~5. . ~ . ; . ,,, , ~. ,
3 - -~. ..~ ~. ., . , ~~ . .-. . ~0 ‘ ~. ~ ,. . ~ ~ ., 0
~ I ~ - — -- - 0
.- —_:~:a. ,—~- —.. ~1t..):. ~0 ~ ‘~-EH~- ~ ~ ‘~‘. ~ - . 3
~ ~ :0:. 4-.=.o- 0
~ ~ ~ ~ ~~~-Hl , ;th~ 0
00 ~ ~ ~1‘ j: , ~~I ~ F’ ~~ ~ ~ , . .0I
‘:.~ ~~,-_- ,~ ,.,..,.,,,‘ ~ , . (It ,
.~~rtIso:iij~. ):i:I5~.’ -~i~‘~.. 4:i~-’•_
0 ‘ ‘ (“1” ‘ :iia~~. _— _ 6 1 — • ~‘. 4
i~: ::;,.-.~:, ~a,;: ‘~:vv-( ‘ 0 0—.0%~ ~ P , ‘~: , loom
‘3
.c~1~~
’“~‘r’n’~’0
,0~
-’-~-‘L’~ ~1 -
PROPANEI ressure, kI aI-,g,orcI) 4 t~q,.,I,hr,um ral,,, ,,I 14 47 ~tll’,,I
115)))r~,o)c,,nvcrseoce prescore
PRESSURE,PSIA0 t •~I 1.
Pressiure,kPaFig,orn, 0+ Equilibrium mau,,, am 34.47 MPa (5(XX) ps,a) co,,ver~cncepressure.
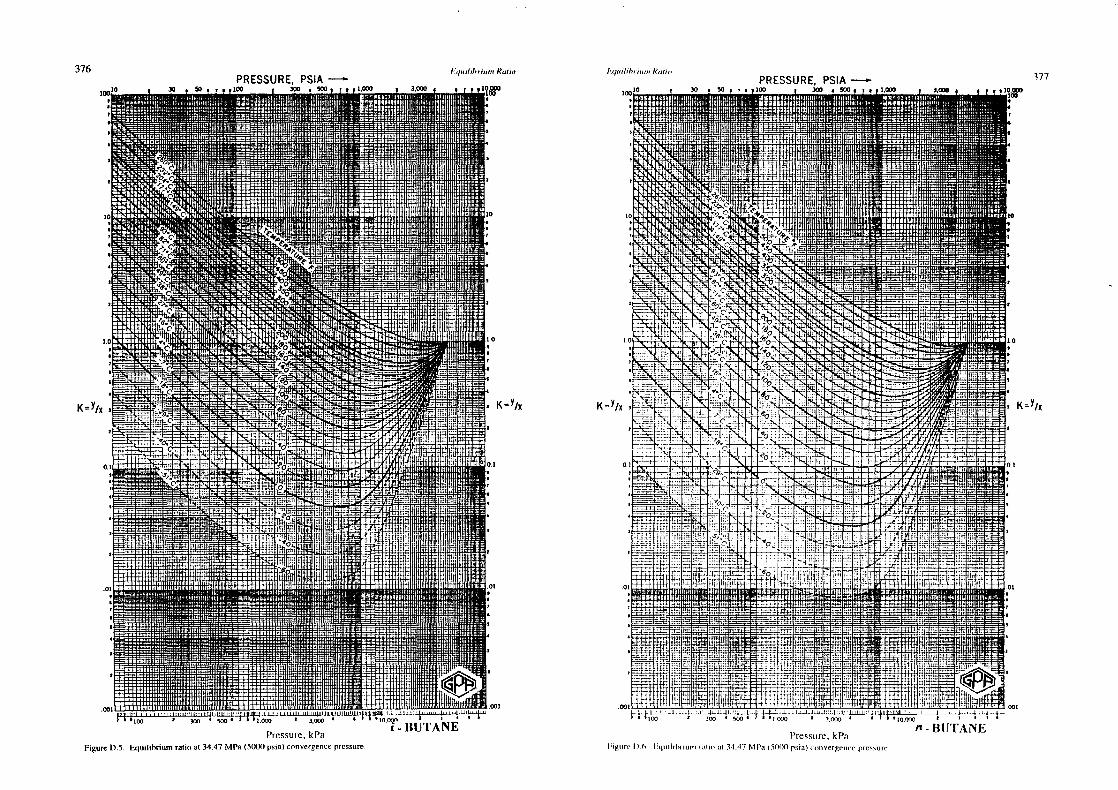
376
I’ressrmre, kP:mi’,g,ore i) (, Oqiii)~I’riut,~,.,:i,, at 34.47 NI Pa I515)1) psit~),~0,uvergeucepress,,Ie.
PRESSURE,PS1A300 ~ ,..1.0
!~,,,0,I,!,r:~,3ptkoathi Ij,0i/i/~~jti.i,~Riot,,,377
- BUTANEPressure, kPa
Figure 0.5. Equilibrium raujo at 34.47 MPa (501)0 psia) convergence pressure.
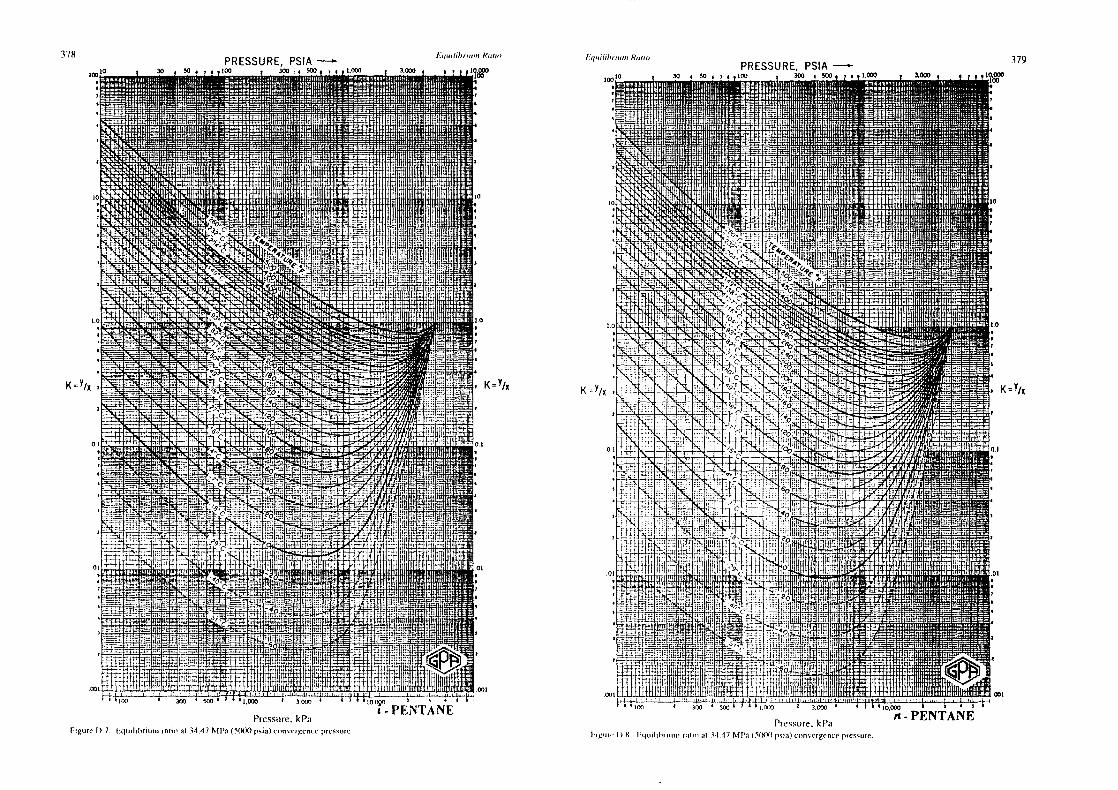
378 PRESSURE,PSIA — .,,00~/o)’3o~o~~JR,oto,’
I0~00
~ ~ 3 3 moo aoo . 500 . I.~ m,~
05 . 10
~.. ... . .‘ ,si). . ...,. ...4. . . . ‘“?(~‘ I IS ~ ‘ ~ ~ ..‘., a. ‘ , ,. 3
., ~‘4AI 2’ ~ ~
0 , ~ ~ , ~2 3. Ii~4~ = ,~I,,h. .j~ ~ II : ‘ :1
, j~~0
&4~ LI :~ .--~~- : ~ ~: ,, ~ ~ : ~ ~ fli.5:.r ~ ~ •~~~-:‘• ~ ..~
mu ~ ~ . ,.?, _ : .. ~ 10
: ~ -:. ~ ~? ~ ~‘ . ...‘..
- _5I .:..:: - .- c...~ - . . . .I ~ ~ 5,, — ... .— . . . . -. ., . . 0
. ...- . .,.- ~..: --.: -
. .,., .... “a. ~‘e ~ ... ,. .
K-8
/5
~ ~ _ :: ~ ~ _ ~ I ~ : ~ ~ I’ ~
30) _ — , - —— _~4 0 ~ ‘ I ~ , ~ _ , ~— ~ mmr, ,,~,, , ~ , ..,st •i.~o . n’it~ ‘ • ‘i50~) I , 2 3 1’PEN’rANE
J’rcssume.kP:uI tgure I) 7 I ,goiI.)’ri~or.,,;ii,~ ,) 1.1.11 Ptll’;. )S)$1() u’~.)c~’ns~-t)’,’r,e
Iq,o,l,I’,iu,,, Ru(,i; 379
PRESSURE,PSIA~ ,tOO!!1100 u
i 3 .3
- II-PENTANEPressure,kPa
I ~ I ) I) l~,I,0,I,l,r,,,,t,ri) ,i , at 74.47 r~it’a ( 5(55) psia)co~nvergcncep3cssoome.
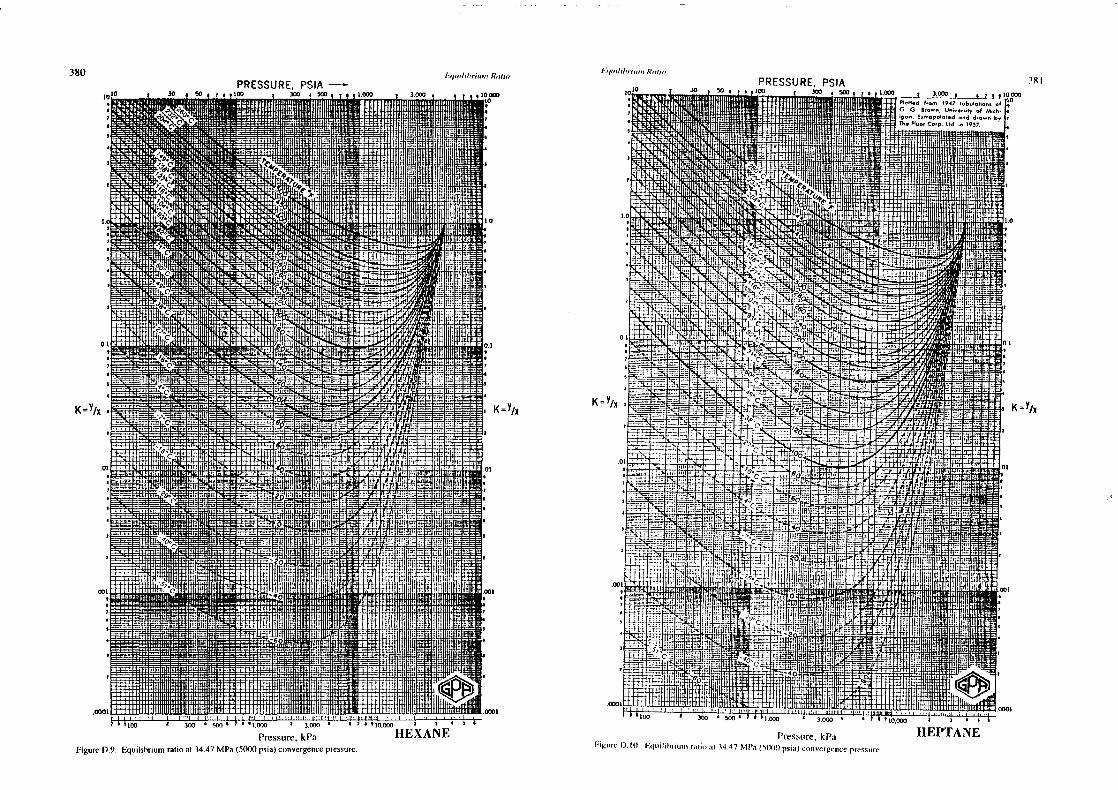
380 Iti)~Ill~),3i~0,,,Rmi,o F~,;,,o/,I,,,,,,,,Riot,,,PRESSURE,PSIA PRESSURE,PSIA
- - - -‘~‘ u 3 S I
181
IIEPTANEPressure,kPaFigure 13.9. Equilibrium ratio at 34.47 MPa (5000 psia) convergence pressure.
Pressure,kPaFigure I). 0. i,qoi,I,t,rtutit rat,,, at 34.47 Mt’a (5)))))) psia) convergence pressure
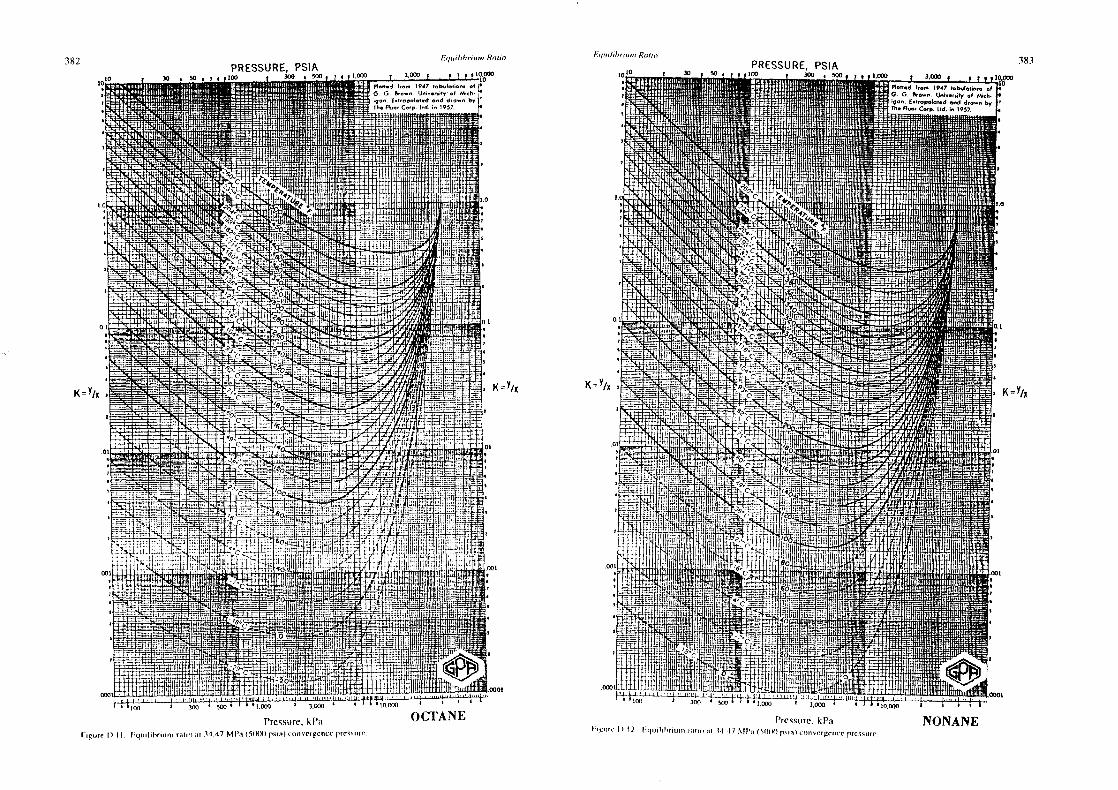
382 E,j,oi(ihriu,,o 8,0(0 ~ Rut,,, 383
Pretsrure,kPa NONANEl,g,,t,- I) 2 l,1o1),t,r,,ot,, at~,,a) 54 I/ Mt’,, (5)HH) pun) c~inverget,ceprcssoorc
PRESSURE,PSIAso m I 3.aso I .
~ Pt,o.~ 3,0,, )947 1flb0i0~i000, ufo 0 P.o~,. Un.,.o,,5~ of 302,5.
-~1~,, E.,’o#o0o,o~n,,d d~u’-n ~j
PRESSURE,PSIA-- I I . I
00.4 I ro,u 947 1,bootn~iuo,ofG. P,ow,., Uuio.,nto, of Uiuf,-
on. Euiro3
nntnt.dnod ~ 3,u~- 0, Corp. 54. 0 *907
OCTANEPressure,kPa
Figure 1) I) - l-qu,I,hr,un, rat,,, a) 5.) 47 MPa (5)5)0 psoa) convengenuc pR’ssi~re
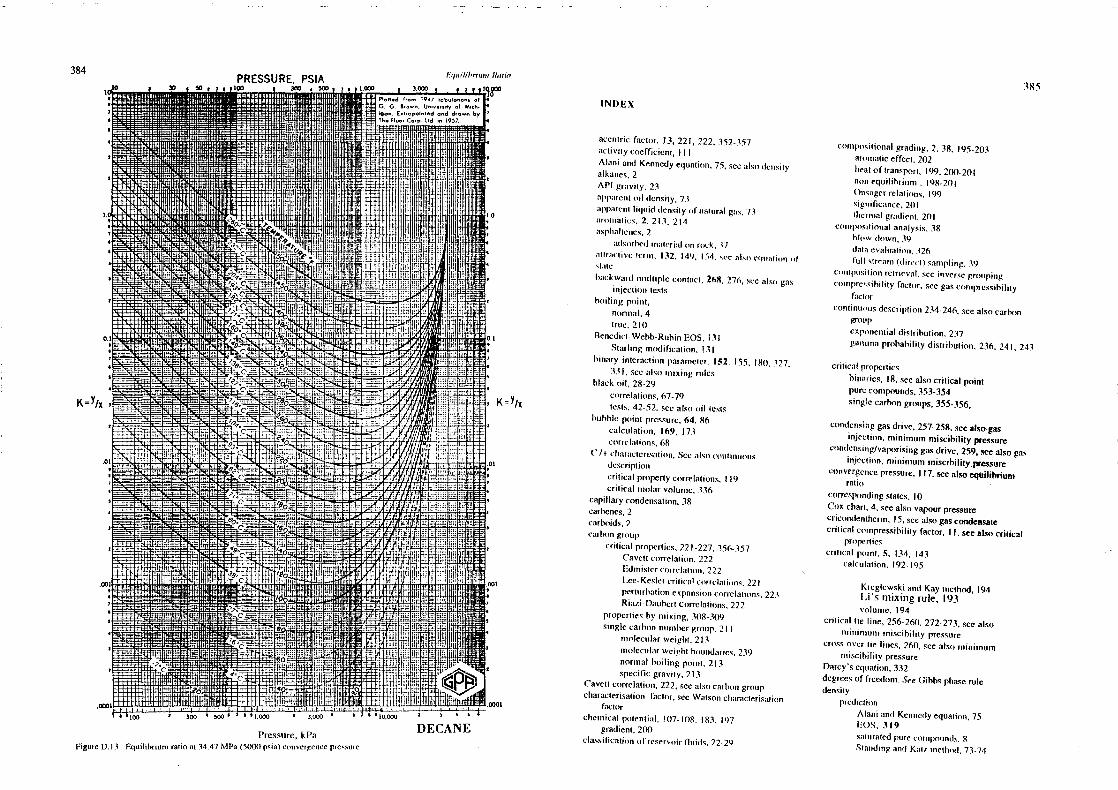
384
Pressure,kPaFigure 13.13 Equilibrium ratioat 34.47 MPa (5000 psia) c,,nvergeuce prcvsure
acentrtcfactor, 13, 221, 222, 352-357actuvuty c,,eflocient IllAtano and Kennedy equatittn, 75, see also density
alkanes, 2API gravily, 23apparcni oil densimy, 73appareni liqiuid rlensily onF natural gtis. 73aru,itoau cs, 2, 213, 214
aspltaliemnes, 2ads,,rhcnj untuleritml ,,utr,uit. 17
;tuuracfivc lenin, 132. 149, I 54, su’e abai ef;uattn,n ,,l
.sl;mfel~ickwaroluunuliiple clunusucl,268, ~ seentso,gas
injection iestshum ling point,
noruunal,4mruc, 211)
Benedici.Wehh-Ruhjn EOS. 131Slarlummg modification, 131
binary interacuion pimraunelcr. 152. (55, 181), 327.331, see tulsjt mmsmxing rules
black oil, 28-29corrctamiorms, 67-79le.sis, 42-52, seeills)) oil lesls
bubble p00mm pressure, 64, 86conlculamion, 169, 173corretamiorms, 68
(‘7 j- clisoracmerj,,~imion, SeeaI~t,cf,tfi Iinu,,uisdescripiioncrotucal propermy correlaliuns, 119criiteal mnnolar volume, 336
eapullary condensation, 38
carbenes, 2carboids, 2carbon group
criiical properties, 221-227, .156-157Caveim corretamion, 222Frlmusmercorrclalj),un 222I_cc- Kesler (‘tim cat eorrel,otj,,tts, 22 Iperuurhinliotmu expansoon c,,rrelalio,ns 223Riajj-[)auhcru coru-elalions 222
properuics by runiximug, 31)8-31)9singlecarbon muuuimhcr grotomp, 211
nsotlecular weiglut. 213msno,lecuolar wciglsl boundaries,239
norunsal ho,iling poi sm, 21 3specific gravimy, 213
Caveti eorrelatuon, 222, see also earhouu groupclmaracterisatiomo lactonr, see Walson characuerisaui,,n
lactorclseuncoil poiemiui:il, ((17—11)8. 183, 197
gradieni, 200cla.ssilicai,,,noI rescrv,,ir Ihoitls, 22.29
composilional grading, 2, 38. 195-203aro,unatic effecm. 2(12heal of Iransport, 199,200-201non equitibrittin , l98.201()unsagerrelati,ons.199sigutilicance,2111Ilterustiol gradient,2(11
Commup,osotionalanalysis, 38hto,w-down 39(Jal,) evaluaui,,n 126(toll s)rcauts(olirs’cu 1 sauusplinip. 39
co’inup,usflto,n reirievtnt. see inverse grmupingcomiipre.ssthllulyfacio,r, seegascommpressihilimy
factorconiinu,,us description 234.246, seealso carbon
grottipexp,,nentual dislrihumioin, 237g000uoma prohahiliuy disirihumion 236, 241, 241
critical properuieshmnsrfes, 18, see also critical poinipure connpounds, 353-354sungte carbon groups, 355-356,
condensinggasdrive, 257-258,seealso gasinjecuion,minimum miscihiliiy pressure
conndensiitg/vaporisunggas drive, 259, sec also gasin.lt’Cllon. mmnimusummiscibility presaure
convergencepressure, Ill, seealsoequilibriumrami~,
correspondingslates,10Cot charl, 4, see also vapourpressurecrico,ndentfnei-nm IS, see also gas condensatecritical cu’unpressmhiliuyfactor, II. see alsocritical
propertiescriiical pu~inm,5. 134, 143
calculation.192-195
Kreglewskiand Kay unmeihod, 194Li’s mixing rule, 193v,,lume 194
critical tie tone,256-26(1,272.273,seealsoriuuuluunnummo miscihilily pressure
crossover lie hines, 26(1, seealsonninimmnlunmniscmhulimy pressure
Darcy’s equalion, 332degrees of freedom. See Gibbs phase niledensity
prcducmionAlanu and Kennedy e(luaii,,n, 75
FOS, 319valuramedpurecompoion,Is.8SiandiungandKsoi, uuieuloosj, 73.74
INDEX
385PRESSURE, PSIA 1q~o,Iohr,,o,,, Rootot,
I ~ ~ ~ I 100 300 . 5f~ , 1,000 3,~0 - . - P’on.d ,oo, 947 ob,,Io,non. ofI . Os 0 5’o~n. U” ~ ‘y ofI ‘gon E,~.opuOoOod ond 4,0,’,,, bj~S Tb. tO,,
0. Co,p 130 ,n ~957
: . -I, ~( ,
I . .. .. . L’. — l.~I (.~i
I , . . ,,‘ .., ~I~~~I~I ~1 ~~h ~~
I I ~ ~ i~~ ,, ~ . t ~I~l~’~ ~ ‘‘ ~m.o ~ ,, , to
S ~b.i .,. 0~ ~ ~. . ,
S. ~..“ : ~ ,a ~‘4 ~ ~ ,. . . :0~
L2.’~’.U U’!F‘—.5. ‘-4n (t~/’~, I ( )) ~ 12
I ,,~ ~, ~ ...,., C’ ~i4
•.)j)~((~ ~. ~ i~’~u., ,, . . ,, 2 ‘ _~-1. ~ .‘ ) I “ ‘ ~ ~ .J ‘iiI -
i — ‘~0,,—~F5a 5 Ii ml ~ Ii’ ~ ~
-. .... . ,— ... ~ ‘ ‘ ~ ,,i,2 U .~‘) (‘ii ~,~i1:5 . jL~fl,. H1 T ~, ~ . rE.,t,
t(5
410... _~:I:.t... ,.,~.— .,,~c, ~ ‘d1~~E ‘~~3h. ~ ~
. , ~ ~s51
:~...’II:1~-. S ~1~~
ItP~ ~‘ It,0_I _ ‘ ~ . , C’ ,, (11 —. ~, . . ) . 1’~.‘ . , . ~
..__ -, , . - ,. . .0,
9.—ac’ ~,, . . ~ , ,, .,, , , 0
,—~._._. ,.-=i,:. ~ .,- . _c’-i—=— ~~‘O’. ~— ~ ‘ . ..,,,,,
o~- :~ - ‘~=- ~o -
I _~,, , ~ =~,~‘Ic
K~/x ~T=—-—“e~ -~~t = ~ I
I ::. _~ ~ r ~-:,~:H-- -~ C— ‘ -= .. ~‘7..- .- - . f .
— — . R1
~ —. — .. .4::_. ~ , ‘ : ~ I,’,
.... ,. , .0,t, ,,,O . ~ “: u• ~~ . 0 .‘.
01 _ _ r,, ~ ~, u ~ ~ _ _ I ~ I ~ jt ~ ~: , :~~ I ~ .~: . ~ ~,-: ,, .
3 : _ _ ~ ~: ~= __ mu
— ‘“- .e0~.-:’~.’’.’. ~ - r4
~
= . — c’e~ _5_ — -)— is’t~s-’j~,~ -. -.Y ‘~io..7~E((~i/.:(”.t,
2 — 19 ‘~0 — 2t
ut : ~ (22)
I) 4-)(’~’’.)’.’ - ,‘ r’’ 1~‘ t c t (~o1 ~ ~ Ii l~ 1
.001 ~‘‘~ , . , ‘~ , sot
8,,, ... — -— -‘ii .. ‘ ~-, .( .—. . ~ - ~iy’~ h, (~,
-— ‘~‘.atv,. . , j~,4((5s tj~g
16... ~ ),,b ,
LI, ‘5 5: i)~’ H~ ~. .60 .
8 ~ 40’.’ ~ ~~ ° ~: (~)
.osoi ,. .‘. .,‘. . ‘,,, soot100 30) ° 500 ‘ ° ‘ 0.~ 3.000 ‘ ‘ °i0,~ ‘
DECANE
386 1,t,Iex Index
dew point , 10, 19, 37, 56, 64, 341, 343, seealsogascondensatecalculation, 169
dislillalion, 2 1(1-215dry gas, 24Edrntoer correlation, 222, see also carbon groupenuhalpy
consuanuflash, 175definition, 106
equaloon of statecomparison, 314-323general van ,Ier Waals iype. 135l’a)el Feja. 147. 3)15. 314, 325, 347, 148l’eng- Robinson PUS. 141, 156, 172, 178.
314, 339predocooin reloahility
phasecomposition,316volumes, 320saturationpressure. 3)8
Redlicls-Kwong, 138, 314, 346rohtostness, 182, 322Schmidt and Wcts,el PUS. 146, 155.114selection . 325sensitivity, 327
Soave.Redliclt-Kwong, 140, 152, 156. 314,346, Grahoski and Daubert rosodification,
141Starling.Benedict-Wchb-Rubin,131tuning,see tuningValderrama-Patel-Teja PUS. 148, 160van ,k’rWaals PUS. 132,sinaI, 130-131voolume shtfi, 141
Jhaveriand Youngren.143near critical poinl. 143. 149Peneloux ci at, 142
Zoudkevilch -Joffe PUS. 13$, 314equilibrium ratio, 111-125,171, 310
estimation 116-125PUS, 317OPA K-value, 118intermediate pressures, 121Mollersopequaloon.123Wilson eqtoation, 122
internal consistency,59, 124split meth,d, 112
equtlihrn,in flash calculations 68- 0(3coutopulatiuinal I floe, 17’)— 152negatis’e flash. 175. I 89robustness. 182root selection. 175irivial solution, 171
first Contact miscibility. 255flashcalculations, see equilibrium flashcalculationsformation water, 86-94
forward multiple coniacl, 267-268,273, 329, seealso gas injection tesis
fugacity, 105-110I .ewis rule, 1(19
fugacity co’efficicunt. 109, 129. 157, 174pure substance, 136
gamnsa probability distribution. 236, 241. 243, seealso continuous descriptiongas
density, see gas compressibility factorformation volume factor, 40deal gas vo,Iuoiooe. Itoi,,lecular weight. 79specific gravity. 68viscosity, see viscosity
gaschromatography. 215.221capillary c,,lunons, 217
comparison wo lIt distil lati,,to, 21 5non-eluted fraction. 217
packed c,olutttns, 215gas compressthility factor,45
clnart, Ill)Dratuclnuk and Ahou- Kassetto c,,rrclation, 80H2S and C02 effect, 82
gascondensate, 25.27gas condensate tests. 52-65
constant cotssposo)uon expansioon. 53cu,nslant vottoinne depletion. 53colour change. 54dew point. 56, see also dew pointgas cycling, 2o,.~,sec ols,’ gas it, ject 000
uonaterial hala,,ce,59.f, Ipressoure btoilil.uip lest, 63
gas foonation volume facttir, 46,gas hydrates, 86gas injeclion leSis
backward tutultiple contact, 268, 276.gas cycling, -263forward multiple c,ontact, 267-268, 273. 329,rising bubble apparatus, 265swelling, 266single Contact, see swellungslim tube. 260-265. 332. 338
gas in solution, 50-SIgas recycling, see gas injectioto testsgas soluhility in water
Krucl,cvsky.Kasarnovsky colioatton, It 6llenrys law, 114, 116.
gas to oil ratiu,, 23. 340gas viscosity, see viscositygeneralised single carbon group, see carbon groupGibbs energy
clnange. 176definilion. 1(16miuiinisation, 83stability, 1(4, 185
Gibbs phase rule, 4Grouping, 3(12.314
Dtune,sli Ct al., 3(14eo
1ioal iioo,le Iuacli,,io 306
equal weight (iunass), 307Gaussian quadrature, 243inverse grouping, 31(1-311Newley and Merrill, 303, 306, 307, 309, 310optimum number, 305selection. 302-307Wlnius,on 302
I ce -Kesler crulical pru~periyci,rret,ot i,,uos 221, sec,olsio carho,tn gioutop
I leliiil,,,lti energy, 106. I 91, 193I lenry.s law, 114, 116. see als,, gas soluhilityI bit luiitiosn plol, 124, 326, sec also equi libriutti raliiiloytlrates, 1(6
unlerfacial tension
tuneasurennenl 282-255Inlerface curvaloore, 283-284
pendant (Imp, 282-283
rclatoi,n willn density olilference. 289preoliction metlt(xJ br lnydrocarl,,,ns
Lee andCinieti, 288Macleod-Sugden, 285scaling law, 288.cclteclnier and Gui,, 291Weonaug and Kati, 286
water.lsydrocmj-,oniuietlnane.waler 292predic) i,,n incubi ,uI. 292, 293salts in Water, 294waler nonssal octa,oc, 293
inoruuosuc stability, 190. see als,, stabilityinvariance condition l59, 16I, see als,, mixingrulesKay’.s tuotsing rule, 17I,ee.Kesler vapour pressure eorm-etati,in 13, see alsosapoour presstureLce-JKesler critical property correlati,,ns, 221, see
oils,, carbon groupl.ewus nile, 109. see als,, fugacitylimiting tie liune, 256.258. 260, 267-268, 273, see
ats,, tiiscihilityItitui,l-liqooid displacement, 338, see also, tuningI .i,tunen, Pray-Clark ri,rrelatf,,ui 1 4S see’ its,,
vtscirsiyiiielioing point , 5iutiscihility
couucepts, 254.26(1espcrttonental studies, 260-269, see also gas
injectionreal reservoir fluids, 258-260
mixung rules, 142-161tnvarmance condimi,,n 159, 161
387
local composition 159non’random 159-161polar.p,ilar inieracijon coefltcienus, 160raisdom usiising rules, 159
iuoiioiuitntui miscibility enrichment, 257mununsum muscibility pressure, 256-257
prediction methodsHenham ci al., 273carbon dioxide, 275Firroozahadi and A~iz,271, 277first coniact rriiscihiliiy, 270(ilasii, 274, 276Iliodgins el al,, 272Jensen and Michelsen 273Ku,,, 274, 276Peclrood 274, 276
utiunlecular weight
cottdensame 79measuremeunl, 212mixtures, 245rich gas. 42
utnuttiple contact tests, 304, 314, 321, see also gasinjecluon tests
naplnilsenc, 2, 2 13.214(oil compressibility, 43oil densily. 71. 73oil c,,rrclati,,n
bubble poini, 69formationvolumefactor,70usollicrunnal conuunpressihility coeffmcjenu,70t,itat forisiatjinio voilujme factor, 71—72sisciisiiy, see Viscosity
oil testscotnohunalion ofdam, 49-52(lofferentual liberalion 45
differential vaponisamjon 45separator, 46.49
oil specubmc gravity, 23olefmns. See alkenesparaff’uns, 2, 212, 214, 223Pamel-Teja EOS, 147, 305, 314, 325, 347, 348,
see also equamion of stalePeng.Rohjnson POS, 141, 151, 156, 172, 1711,
314, 339, see also equation of slateperturhaluon expansion critical properuy
courrelati,,ns 223, see also carbon groupphase uliaprauui
etluauoe.bocpmane, ISgas condensate, 26inulticotsiponent mixture, 19pure substance, 9 10
PNA, 220pseudo critical condilions, 176pseudocrimjcal values, 17pseudo reduced properties, 17. 192-194
388 Index
quadraturepoints,243-244, see also coniinuousdescription
Rackettcompressibility factor, 14, 142Rackets equation, 14Raoult’s law, 1(12Redlich-KwongEOS, 138, 314, 346, see alsoequationof statereducedproperties, IIrelativepermeability.333
miscible, 334relationwith IFT, 334
relative volume, 43-46, seealsoblackoilcorrelations
repulsiveterm, l54, see alsoequationof stateresidual oil, 45, see alsooil testsresidual viscosity.335, see also viscosityresins,2retrogradecondensation,19, 321, see alsogas
condensateretrogradevaporisation.19Riazi-Daubertcorrelations,222,seealso carbon
groupsampling
condensatering,342evaluationof reservoirfluid samples,340-345gascondensate,340
iso-kinetic sampling,36minimum gas well flow. 35recombination,36.341samplecollection,36-38surfacesampling.340well preparation,34
SchmidtandWenzelEOS. 146, 155, 314, seealsoequationof state
Soave-Redlich-Kwong, 140, 156, 314, 346. seealsoequationof statesolutiongas to oil ratio, 46, 47
ventedat stock tank, 68stability analysis , 183-192
limil, 189-190Michelsenmethod,187
Standingoil correlations, 67, 68, 69, see also blackoil correlations
siock tank oil, 47sublimationcurve,5swelling test, 266, seealsogasinjection teststemperaturedependency parameter, 136
MathiasandCopennancorrelation,150supercritical hydrocarboncomponents,153Twu et al. correlation, 151
ternary diagram, 254tie line, 254triplepoint, 5tuning, 323-331
consistencyof regressedparameters,330
dynamic, 331-340
experimentaldata. 325fluid characierisation, 324grid-time step suing, 339limits of paramoetersregression variables, 327weighting factors, 324
Valdenrama-Patel-Teja POS. 14$. 16(1, see als,nequation of slate
van der Wa~bsEOS. 132, seealson equatioit of stilevaporisong gas drive. 255-256, see also gas
injection, uniniussum miscibility pressurevapour pressure
Cox chart, 4Lee-Kesler correlation, 13water, 87
Vasquez-Beggs correlations, 67, 69. see also blackoil correlations
virial EOS. seealso equation of stateBenetlict-Wehh~RuhinFOS. 131Starling modification. 131virial coefficients, l30, 154
viscosityprediclion
corresponding states, 334Ely and Manley, 334gas,83 -
I-lerning-7.ipperer. 335Loltren,.- tlray-Clark, 335low pressure viscosity. 335
- oil, 77-78- water,93
tuning, 336 - -
volatile oil, 65, 27, see also oilvolume factor, see relative volumevolume shift, 141, 314, 330, see also equalion of
statewater
conspressihiliiy, 92contentof lnydro,carh,snphase,87, 89conteuni of tiquid hydrocarlsuons. 88
- density.91formation vo,bouooe factuir, 92hydroicarhon solluhility in water, 90-91, see
also gnssoluhility in watervapour pressure, 87viscosity, 93
Watson characterisation factor, 212-214, 330wet gas,25Wils,sn equation, 122. see alson equilibrium ratioY functiois, 43, seealso oil testingYainada-Gunn correlati,sn, 14, 354-356, see also
critical compressibility factinrZudkevitch -Joffe EOS. 13$, 314, see also
equation of state