Embed Size (px)
Citation preview
A Four Coefficient Model for Extending the Heptanes-Plus Fraction for Gas Condensate
Systems
Raffie Hosein*, The University of The West Indies, William D. McCain, Jr., Texas A&M Univsersity and Tennyson Jagai, University of Trinidad and
Tobago.
Slide 2
Extended analysis:A description of pseudo-component or SCN composition (Mole %, mole fraction, Wt % )
An integral part of the reservoir fluids characterization process
A fundamental requirement for EOS predictions
Slide 3
Extended analysis is obtained :
• Experimentally from Chromatographic analysis.
• Mathematical relationships between Composition and SCN or Molecular Weight.
— Yarborough (1978), Pedersen et el. (1984): Continuous Exponential relation
— Whitson (1983): Gamma Probability Function
— Ahmed (1985): Two coefficient Splitting Scheme
Slide 4
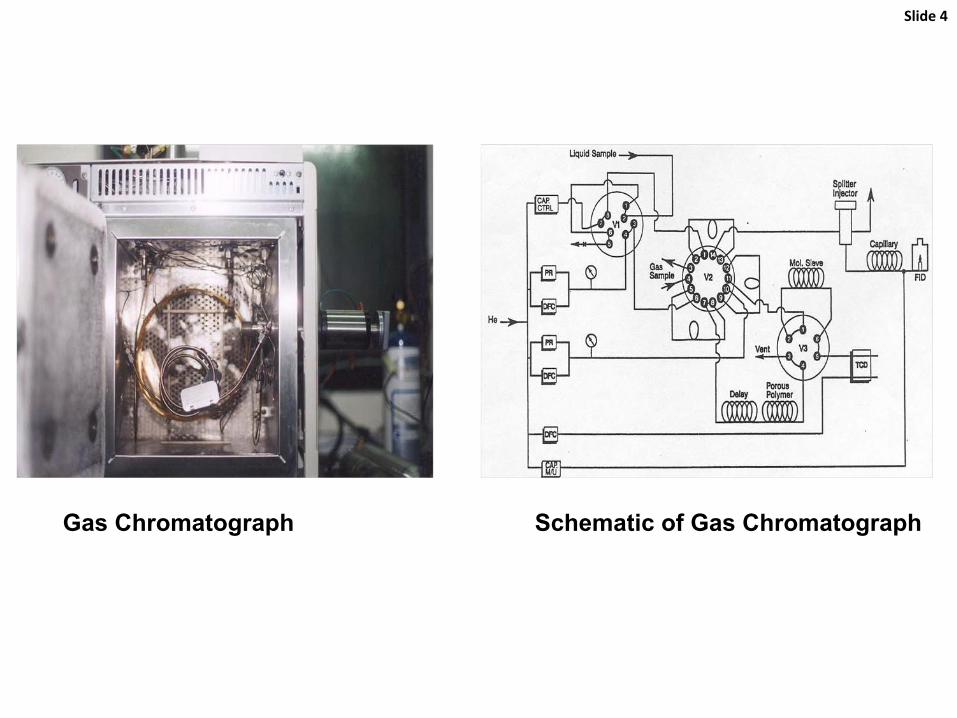
Gas Chromatograph Schematic of Gas Chromatograph
Slide 5
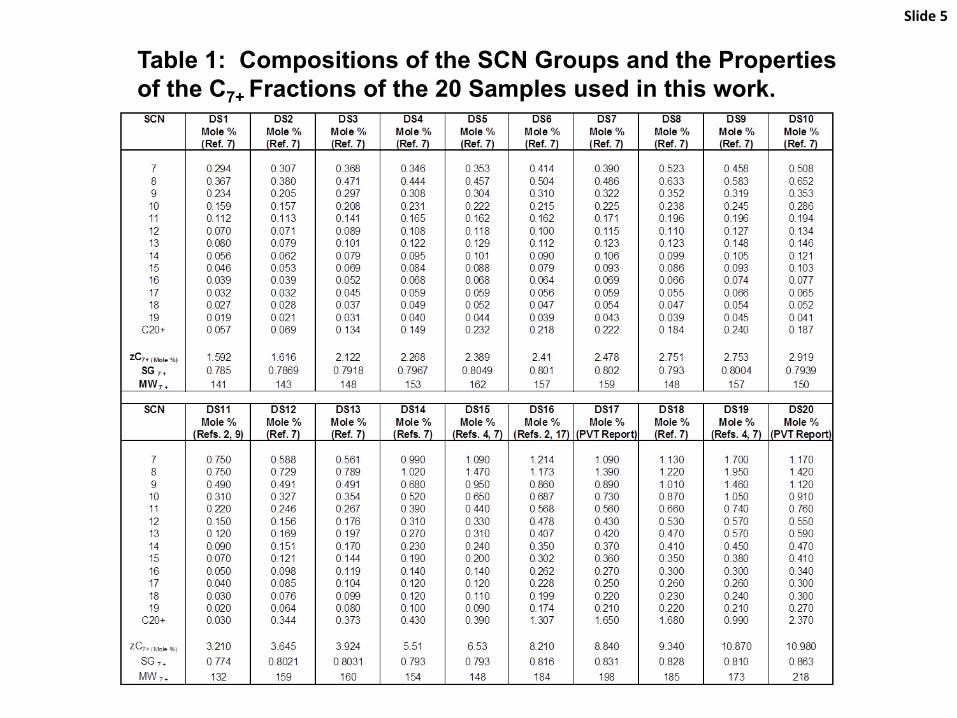
Table 1: Compositions of the SCN Groups and the Properties of the C7+ Fractions of the 20 Samples used in this work.
Slide 6
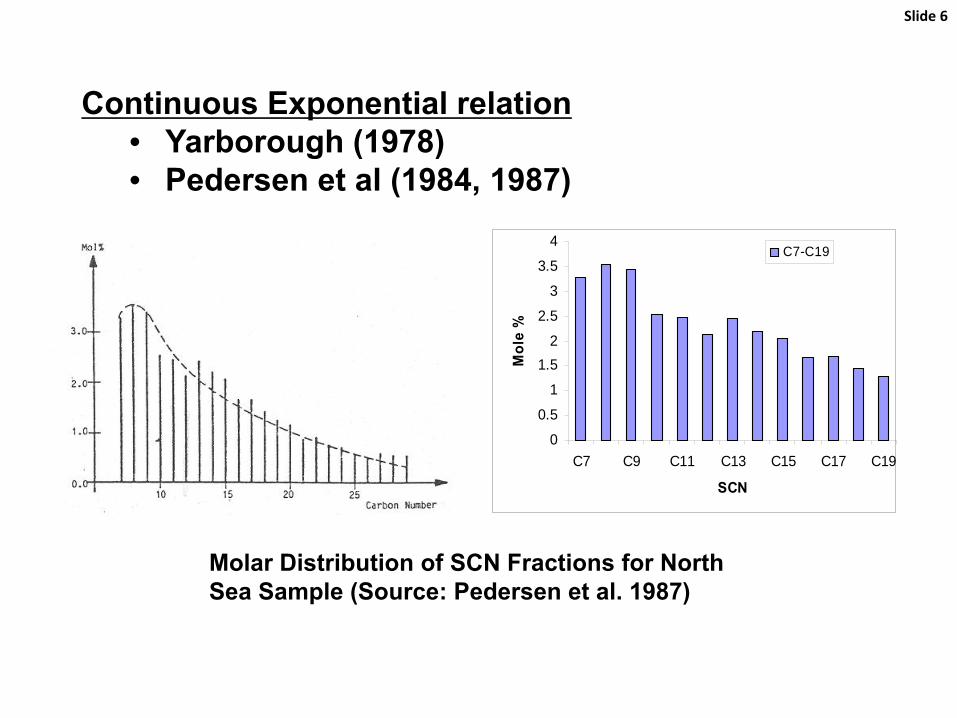
Continuous Exponential relation• Yarborough (1978)• Pedersen et al (1984, 1987)
0
0.5
1
1.52
2.5
3
3.5
4
C7 C9 C11 C13 C15 C17 C19
SCN
Mol
e %
C7-C19
Molar Distribution of SCN Fractions for North Sea Sample (Source: Pedersen et al. 1987)
Slide 7
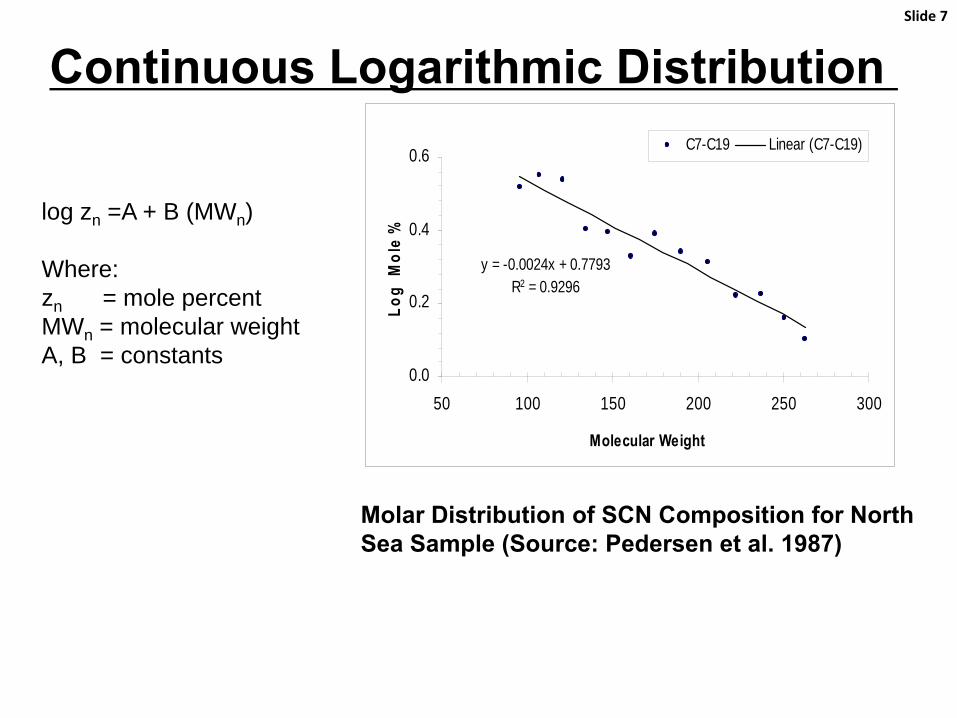
Continuous Logarithmic Distribution
log zn =A + B (MWn)
Where:zn = mole percentMWn = molecular weightA, B = constants
y = -0.0024x + 0.7793R2 = 0.9296
0.0
0.2
0.4
0.6
50 100 150 200 250 300
Molecular Weight
Log
Mol
e %
C7-C19 Linear (C7-C19)
Molar Distribution of SCN Composition for North Sea Sample (Source: Pedersen et al. 1987)
Slide 8
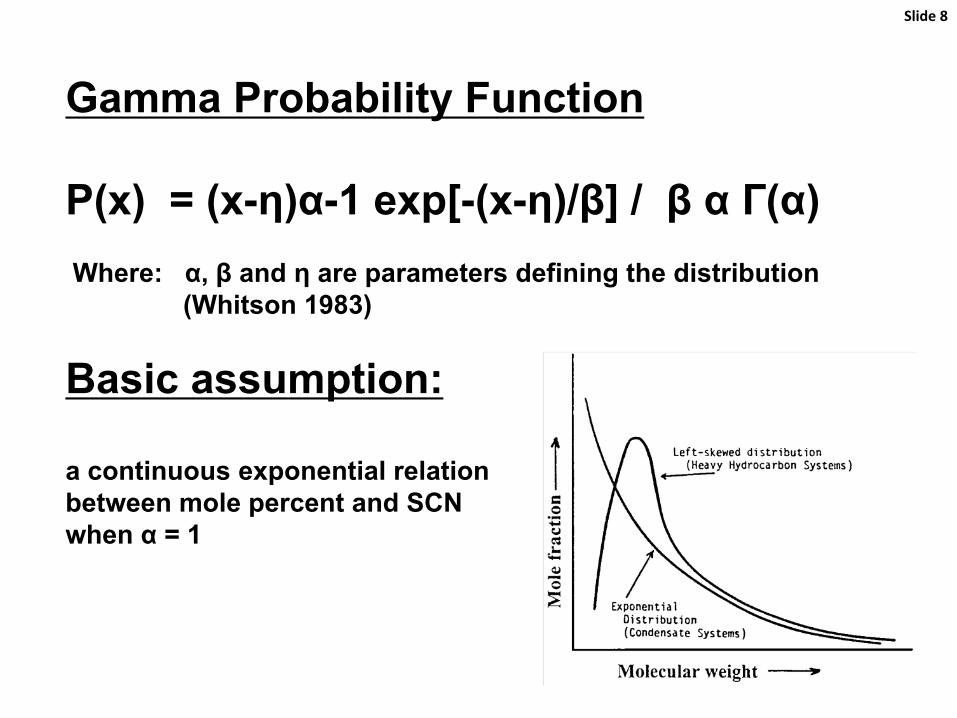
Gamma Probability Function
P(x) = (x-η)α-1 exp[-(x-η)/β] / β α Г(α)Where: α, β and η are parameters defining the distribution
(Whitson 1983)
Basic assumption:
a continuous exponential relationbetween mole percent and SCNwhen α = 1
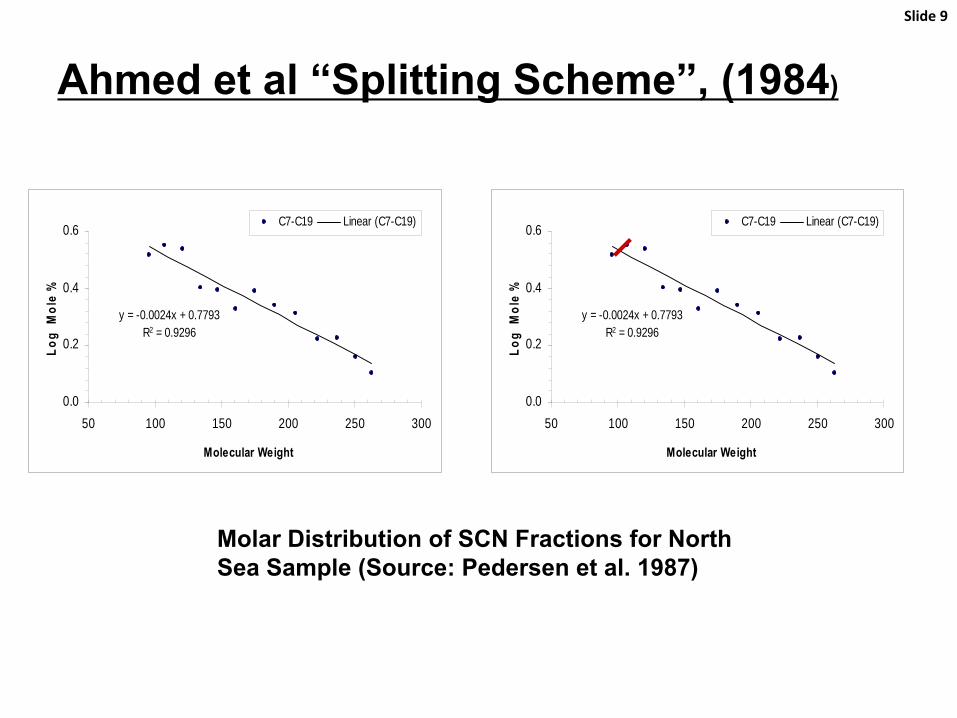
Ahmed et al “Splitting Scheme”, (1984)
Slide 9
Molar Distribution of SCN Fractions for North Sea Sample (Source: Pedersen et al. 1987)
y = -0.0024x + 0.7793R2 = 0.9296
0.0
0.2
0.4
0.6
50 100 150 200 250 300
Molecular Weight
Log
Mol
e %
C7-C19 Linear (C7-C19)
y = -0.0024x + 0.7793R2 = 0.9296
0.0
0.2
0.4
0.6
50 100 150 200 250 300
Molecular Weight
Log
Mol
e %
C7-C19 Linear (C7-C19)
Slide 10
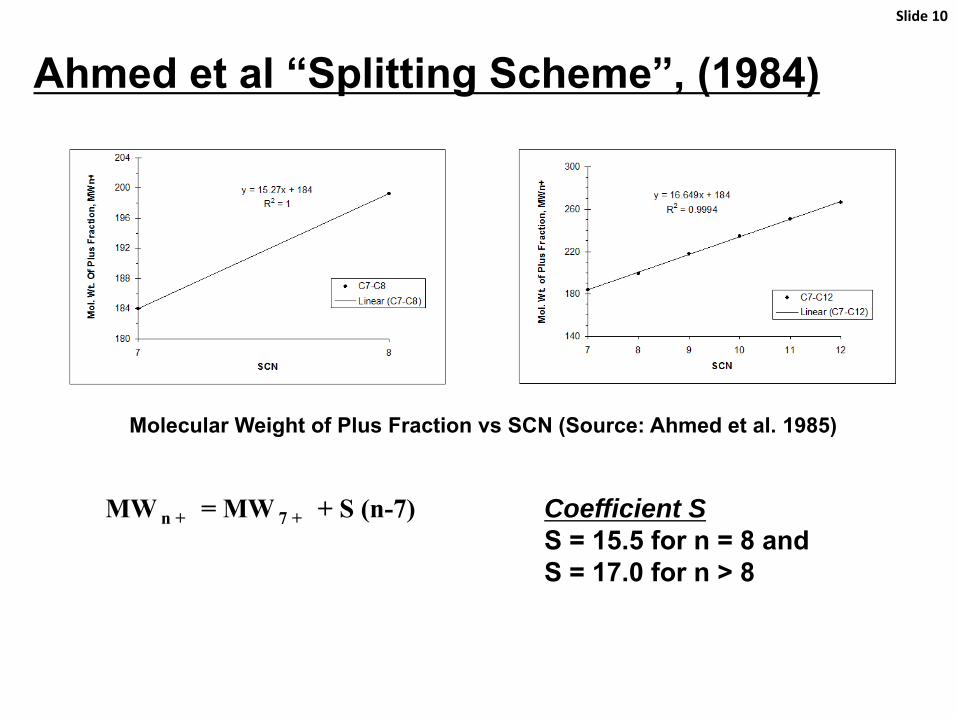
Ahmed et al “Splitting Scheme”, (1984)
Molecular Weight of Plus Fraction vs SCN (Source: Ahmed et al. 1985)
MW n + = MW 7 + + S (n-7) Coefficient SS = 15.5 for n = 8 and S = 17.0 for n > 8
Slide 11
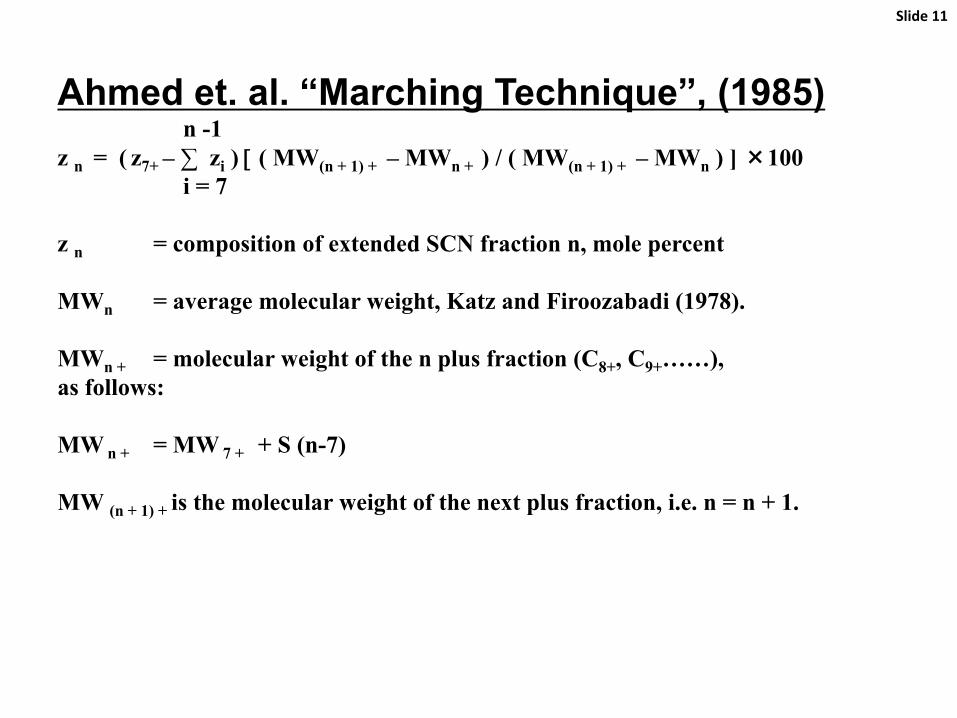
Ahmed et. al. “Marching Technique”, (1985)n -1
z n = ( z7+ – ∑ zi ) [ ( MW(n + 1) + – MWn + ) / ( MW(n + 1) + – MWn ) ] ×100i = 7
z n = composition of extended SCN fraction n, mole percent
MWn = average molecular weight, Katz and Firoozabadi (1978).
MWn + = molecular weight of the n plus fraction (C8+, C9+……),as follows:
MW n + = MW 7 + + S (n-7)
MW (n + 1) + is the molecular weight of the next plus fraction, i.e. n = n + 1.
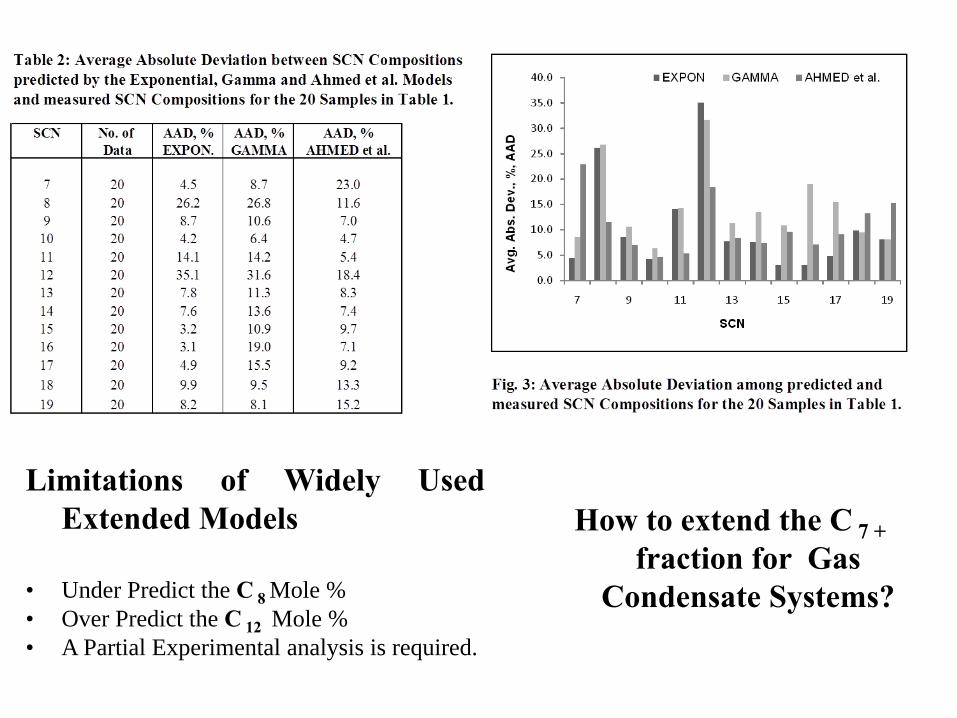
Limitations of Widely UsedExtended Models
• Under Predict the C 8 Mole %• Over Predict the C 12 Mole %• A Partial Experimental analysis is required.
How to extend the C 7 + fraction for Gas
Condensate Systems?
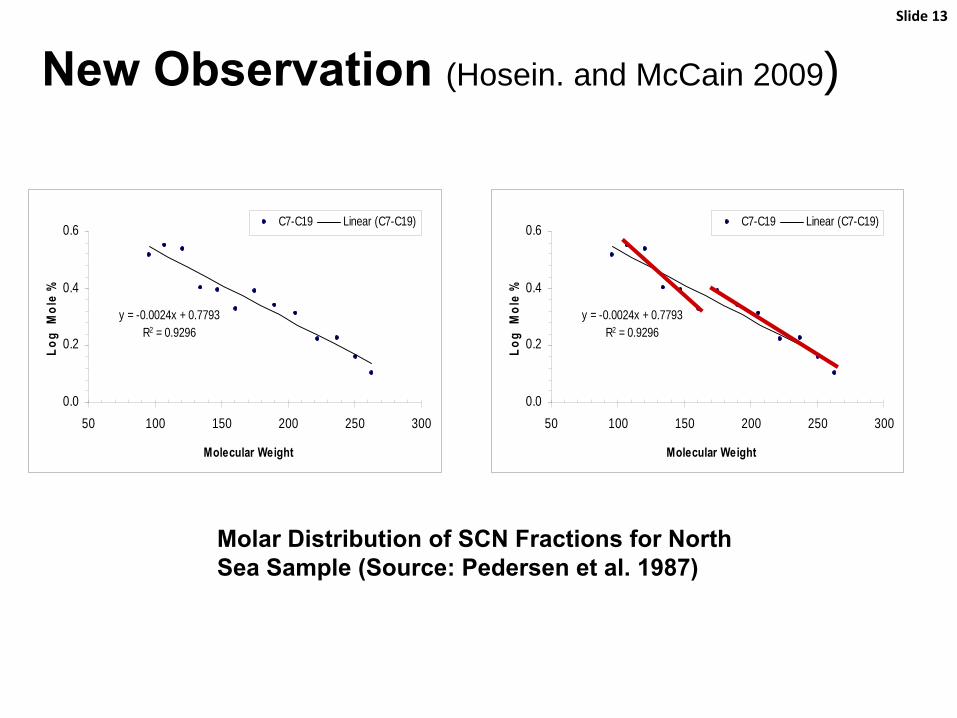
Slide 13
Molar Distribution of SCN Fractions for North Sea Sample (Source: Pedersen et al. 1987)
y = -0.0024x + 0.7793R2 = 0.9296
0.0
0.2
0.4
0.6
50 100 150 200 250 300
Molecular Weight
Log
Mol
e %
C7-C19 Linear (C7-C19)
y = -0.0024x + 0.7793R2 = 0.9296
0.0
0.2
0.4
0.6
50 100 150 200 250 300
Molecular Weight
Log
Mol
e %
C7-C19 Linear (C7-C19)
New Observation (Hosein. and McCain 2009)
Slide 14
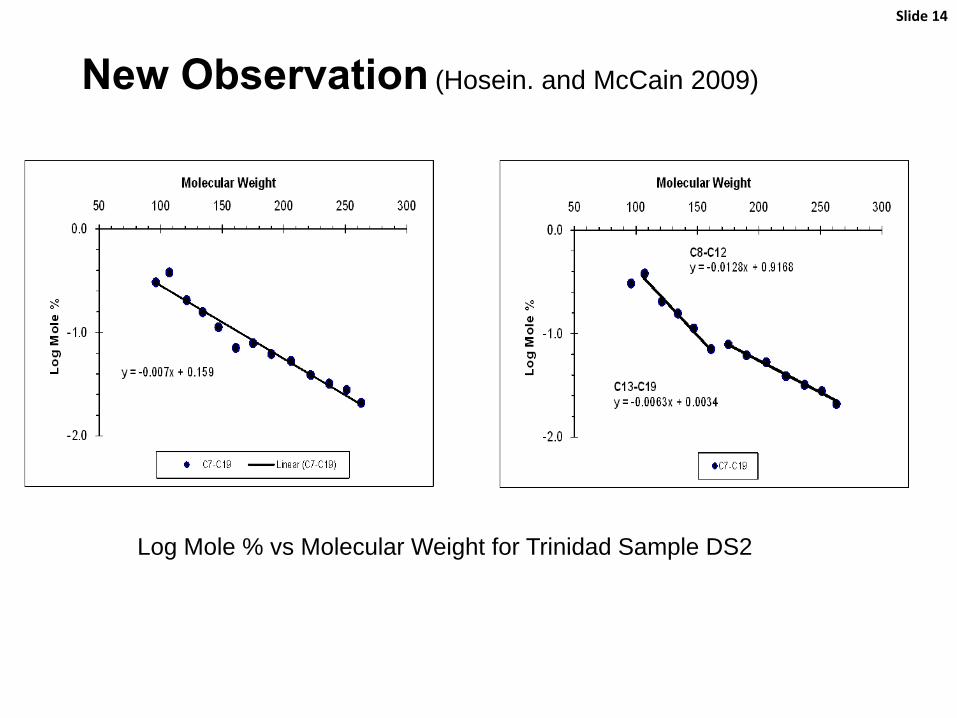
Log Mole % vs Molecular Weight for Trinidad Sample DS2
New Observation (Hosein. and McCain 2009)
Slide 15
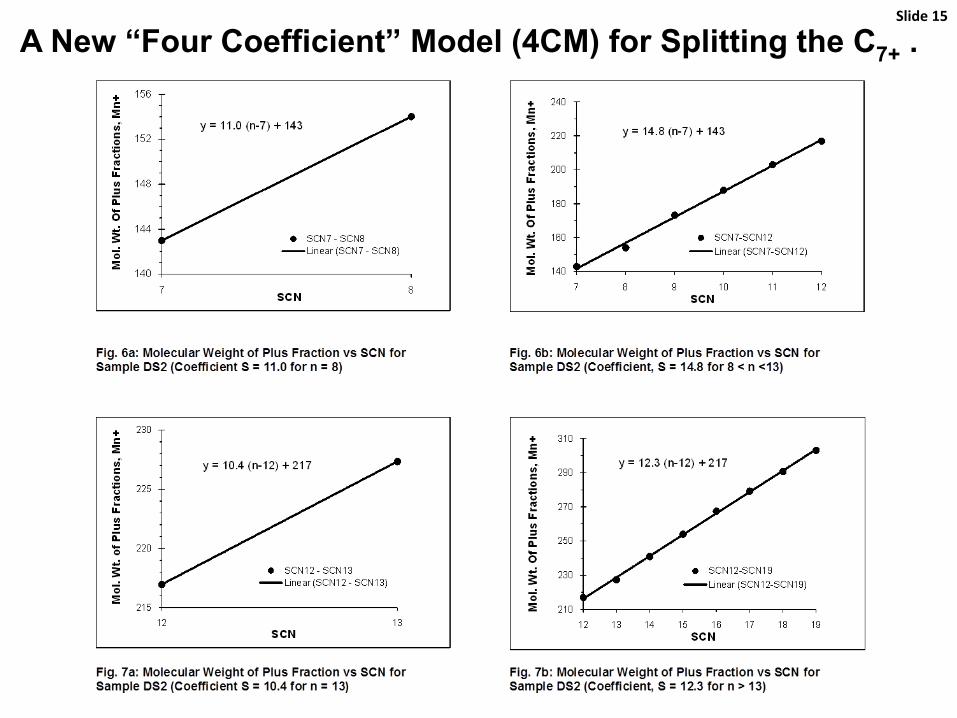
A New “Four Coefficient” Model (4CM) for Splitting the C7+ .
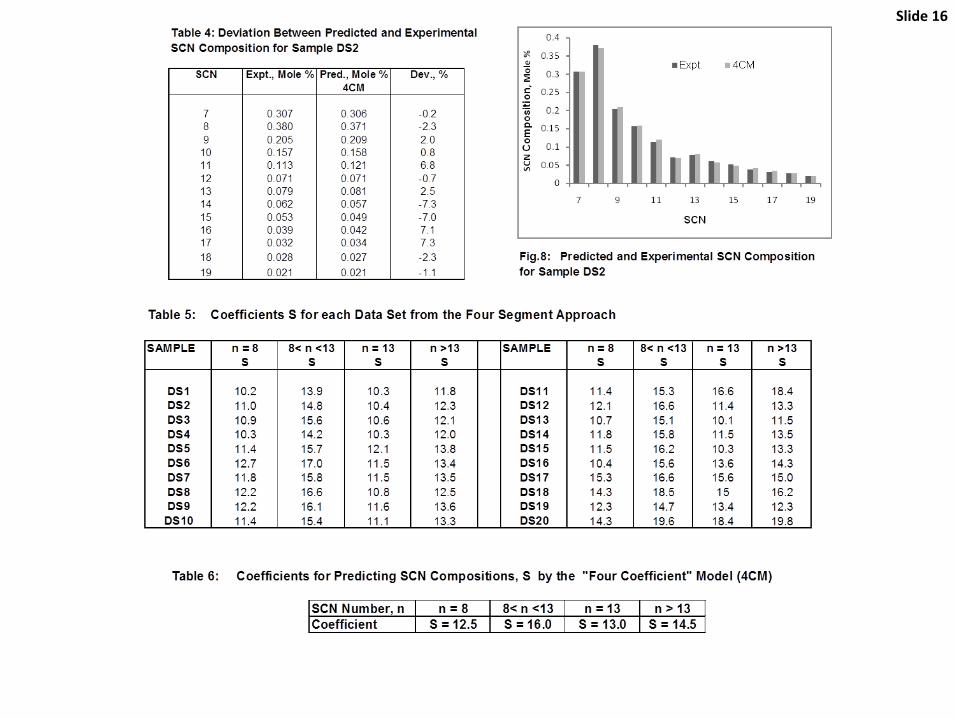
Slide 16
Slide 17
Slide 19
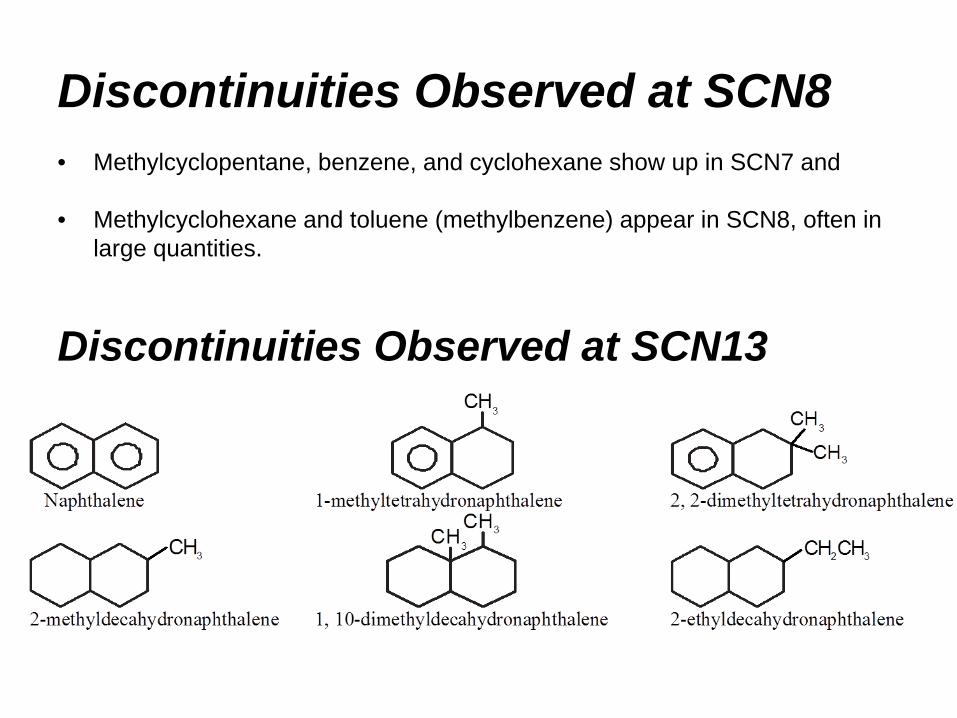
Discontinuities Observed at SCN8• Methylcyclopentane, benzene, and cyclohexane show up in SCN7 and
• Methylcyclohexane and toluene (methylbenzene) appear in SCN8, often in large quantities.
Discontinuities Observed at SCN13
Slide 22
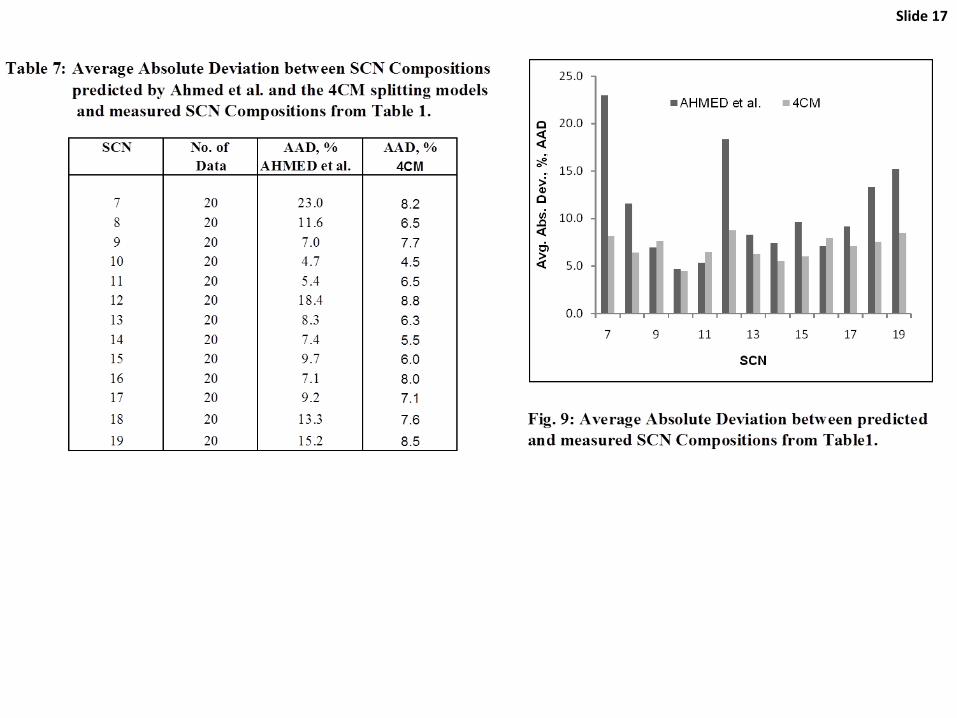
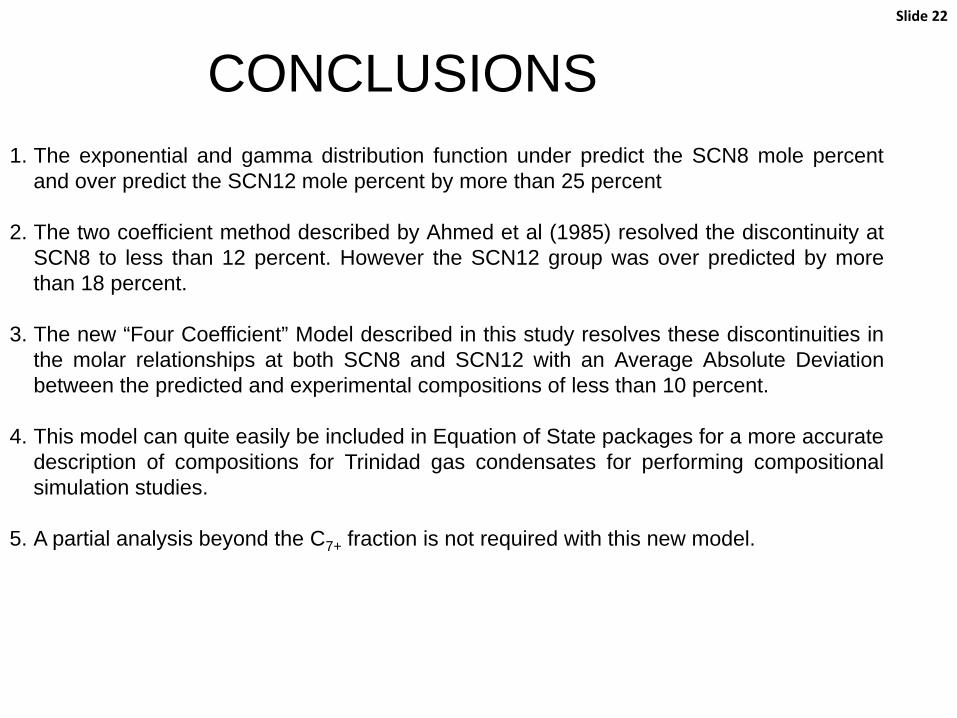
CONCLUSIONS1. The exponential and gamma distribution function under predict the SCN8 mole percent
and over predict the SCN12 mole percent by more than 25 percent
2. The two coefficient method described by Ahmed et al (1985) resolved the discontinuity atSCN8 to less than 12 percent. However the SCN12 group was over predicted by morethan 18 percent.
3. The new “Four Coefficient” Model described in this study resolves these discontinuities inthe molar relationships at both SCN8 and SCN12 with an Average Absolute Deviationbetween the predicted and experimental compositions of less than 10 percent.
4. This model can quite easily be included in Equation of State packages for a more accuratedescription of compositions for Trinidad gas condensates for performing compositionalsimulation studies.
5. A partial analysis beyond the C7+ fraction is not required with this new model.
Slide 23
References1. Ahmed, T. H., Cady, G. V. and Story A. L. 1985. A Generalized Correlation for Characterizing the Hydrocarbon
Heavy Fractions. SPE 14266.2. Ahmed, T. H., Cady, G. V., Story A. L., Verma, V., and Banerjee, S. 1984. An Accurate Method for Extending the
Analysis of C7+. SPE 12916.3. Danesh, A. 1998. PVT and Phase Behaviour of Petroleum Reservoir Fluids. Elsevier. Amsterdam4. Hosein, R. 2004. Phase Behaviour of Trinidad Gas Condensates. Ph.D. Dissertation. The University of The West
Indies, St Augustine, Trinidad.5. Hosein, R. and McCain W. Jr. 2009. Extended Analysis for Gas Condensate Systems. SPE 110152-PA. Reservoir
Evaluation and Engineering, Vol. 12, No. 1, Pgs. 159-166.6. McCain W. D. 1990. The Properties of Petroleum Fluids, Second Edition, Penn Well Publishing Co., Tulsa,
Oklahoma7. Pearson, K. 1895. Contributions to the Mathematical Theory of Evolution11. Skew Variations in Homogeneous
Material. Philosophical Trans. Royal Society of London, Series A. 186, Pgs. 343-414.8. Pedersen, K. S. Thomassen, P., and Fredenslund, Aa. 1984. Thermodynamics of Petroleum Mixtures Containing
Heavy Hydrocarbons. 1. Phase Envelope Calculations by use of the Soave-Redlich-Kwong Equation of State. Ind. Eng. Chem. Process Des. Dev. 23, Pgs. 163-175.
9. Pedersen, K. S. Thomassen, P., and Fredenslund, Aa. 1985. Thermodynamics of Petroleum Mixtures Containing Heavy Hydrocarbons. 3. Efficient Flash Calculation Procedures Using the SRK Equation of State. Ind. Eng. Chem. Process Des. Dev. 24, Pgs.948-954
10.Pedersen, K. S. Fredenslund Aa. and Thomassen, P. 1989. Properties of Oil and Natural Gases. Gulf Publishing Co., Houston.
11.Whitson, C. H. 1983 Characterizing Hydrocarbon Plus Fractions. Soc. Pet. Eng. J., Vol. 23, No. 4 683-694.12.Yarborough, L. 1978. Application of a Generalized Equation of State to Petroleum Reservoir Fluids, Amer. Chem.
Soc. 182: 386-439.
Acknowledgements / Thank You / QuestionsSlide 24
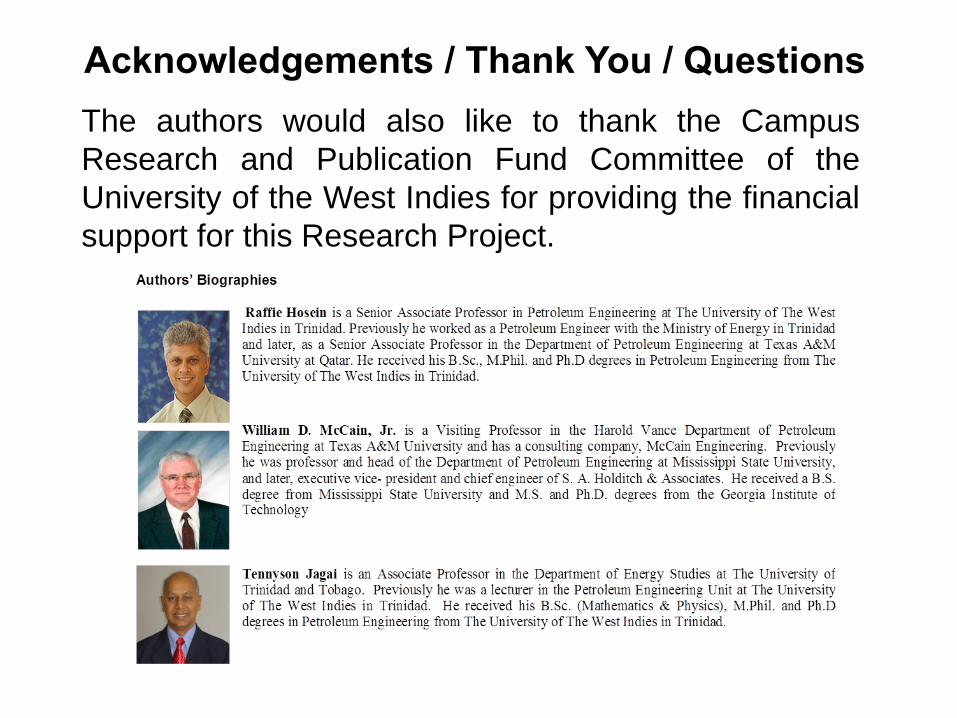
The authors would also like to thank the CampusResearch and Publication Fund Committee of theUniversity of the West Indies for providing the financialsupport for this Research Project.
![TERPENOID NMR STUDIES: NMR PARAMETERS FOR … · 2020. 4. 2. · entitled Terpenoid MR Studies': NMR Parameters for 6107010" [jS. 1. i] heptanes and Revised Structures for Archangelin](https://img.pdfslide.us/doc/110x75/60b24d5ace76f2582736c36b/terpenoid-nmr-studies-nmr-parameters-for-2020-4-2-entitled-terpenoid-mr-studies.jpg)