Embed Size (px)
Citation preview
SPE-169947-MS
Determination of Bubble-Point and Dew-Point Pressure Without a VisualCell
R. Hosein, and R. Mayrhoo, The University of The West Indies; W. D. McCain Jr., Texas A&M University
Copyright 2014, Society of Petroleum Engineers
This paper was prepared for presentation at the SPE Biennial Energy Resources Conference held in Port of Spain, Trinidad, 09–11 June 2014.
This paper was selected for presentation by an SPE program committee following review of information contained in an abstract submitted by the author(s). Contentsof the paper have not been reviewed by the Society of Petroleum Engineers and are subject to correction by the author(s). The material does not necessarily reflectany position of the Society of Petroleum Engineers, its officers, or members. Electronic reproduction, distribution, or storage of any part of this paper without the writtenconsent of the Society of Petroleum Engineers is prohibited. Permission to reproduce in print is restricted to an abstract of not more than 300 words; illustrations maynot be copied. The abstract must contain conspicuous acknowledgment of SPE copyright.
Abstract
Bubble-point and dew-point pressures of oil and gas condensate reservoir fluids are used for planning theproduction profile of these reservoirs. Usually the best method for determination of these saturationpressures is by visual observation when a Constant Mass Expansion (CME) test is performed on a samplein a high pressure cell fitted with a glass window. In this test the cell pressure is reduced in steps and thepressure at which the first sign of gas bubbles is observed is recorded as bubble-point pressure for the oilsamples and the first sign of liquid droplets is recorded as the dew-point pressure for the gas condensatesamples.
The experimental determination of saturation pressure especially for volatile oil and gas condensaterequire many small pressure reduction steps which make the observation method tedious, time consumingand expensive. In this study we have extended the Y-function which is often used to smooth out CME datafor black oils below the bubble-point to determine saturation pressure of reservoir fluids. We started fromthe initial measured pressure and volume and by plotting log of the extended Y function which we callthe YEXT function, with the corresponding pressure, two straight lines were obtained; one in the singlephase region and the other in the two phase region. The point at which these two lines intersect is thesaturation pressure.
The differences between the saturation pressures determined by our proposed YEXT function methodand the observation method was less than � 4.0 % for the gas condensate, black oil and volatile oilsamples studied. This extension of the Y function to determine dew-point and bubble-point pressures wasnot found elsewhere in the open literature. With this graphical method the determination of saturationpressures is less tedious and time consuming and expensive windowed cells are not required.
IntroductionIn the hydrocarbon industry, bubble point is known as the pressure at which gas begins to evolve fromoil and dew point as the pressure at which liquid begins to condense from natural gas (McCain, 1990). Oilproduction will decrease from oil reservoirs that are at the bubble point or below due to the preferentialflow of gas that escape from the oil. This is because gas has a lower viscosity than oil and therefore ahigher mobility. In the case of gas reservoirs at the dew point pressure or below, liquid condensationoccurs, initially near the wellbore region. Some of this liquid condensate flows to the surface with the

flowing gas whilst the remainder is trapped in the reservoir by interfacial forces and reduces the gas flowrate (Craft and Hawkins, 1959; Smith, Dawe and Kydd, 2007). With time a liquid condensate bank buildsup which can eventually “kill” the well. In many cases, from knowledge of bubble point and dew pointpressures, pressure maintenance schemes are applied to oil and gas reservoirs to sustain oil and gasproduction rates.
Saturation Pressures from Constant Mass Expansion (CME) TestThe determination of bubble point and dew point pressure (also known as saturation pressure) is importantto predict, design and manage oil and gas production from reservoirs (Coats and Smart, 1986; Hosein andDawe, 2011). Experimental observation during a CME test is the common route and is a standard test thatis performed during Pressure-Volume-Temperature (PVT) analyses on oil and gas samples taken veryearly from an exploratory well while reservoir pressure is still above the saturation pressure (Danesh,1998; Hosein, 2004). This test is conducted in a windowed cell (Figure 1), at reservoir temperature andwith reservoir pressure or higher as the starting point. The cell pressure is reduced in several pre-determined steps down to abandonment pressure with the change in the total hydrocarbon volume for eachpressure reduction step measured. During this process a second phase evolves – gas from an oil sampleand retrograde liquid (McCain, 1990) from a gas sample. The pressure at which the first bubble of gas isobserved from the oil sample and droplet of liquid from the gas sample is reported as the saturation orbubble point and dew point pressure respectively (Danesh, 1998). The hydrocarbon volume at saturationpressure is used as a reference volume and the total hydrocarbon volume measured for each pressuredepletion step is reported relative to this volume (Danesh, 1998; Hosein, 2004).
This method for determining bubble point for some black oils, volatile oils and dew point pressures forgas condensates, especially lean gases (McCain, 1990) (C7� composition of less than 4.0 mole percent)can be difficult and errors greater than � 500 psia are possible (Mesingset, 1998). In some cases, smallpressure reduction steps of less than 100 psia are needed in order to see the first sign of a change in phase(Hosein, 2004) which make the observation method extremely tedious, time consuming and expensive(Danesh, 1998). PVT cells equipped with optical devices for detecting a phase change further add to thecost for this test.
Dew Point Pressure from CorrelationsAn outline of correlations and genetic programming models developed over the years for determining dewpoint pressures for gas condensates have been documented by Eissa (2008). Basic data required for the
Figure 1—PVT Equipment and Three Windowed PVT Cell
2 SPE-169947-MS

correlations are condensate gas ratio (CGR) (Eilerts and Smith, 1942), composition and physicalproperties of the heptanes-plus fraction (Organic and Golding, 1952; Nemeth and Kennedy, 1967;Elsharkawy, 2002). The correlations themselves have been developed using data from specific geograph-ical regions and depends on the accuracy of the measured input data for example CGR at the time ofsampling, gas chromatography (GC) for compositional analysis and True Boiling Point Distillation (TBP)for the properties of the heptanes-plus fraction (Hosein 2004). Genetic programming models depend onthe accuracy of the compositional analysis and require a large data set of experimental dew point pressuresfor modeling (Eissa, 2008). CME experiments are therefore the preferred method compared to correla-tions.
Bubble Point Pressure from CorrelationsA comparison of correlations that were developed over the years for determining bubble point pressurefor black oils have been documented by Mc Cain et al (2010). Many of these correlations were developedfor specific regions for more accurate prediction of bubble point pressure, by using Standing’s (1947)correlation as a base. This difficulty of producing an accurate universal bubble point correlation for blackoils and the non-existent of a bubble point correlation for volatile oil also make CME experiments thepreferred method for determining bubble point pressure of these reservoir fluids. A Y function (Standing,1952; Craft and Hawkins, 1959; Amyx et. al., 1960) is commonly used by PVT analysts to smooth outdata below the bubble point so as to obtain an almost linear relationship with CME data (pressure andvolume) as follows:
The Y FunctionThe Y function is linear with pressure and is related to the two phase relative volume and pressure asfollows:
(1)
Where Pb � bubble point pressure, psiaP � pressure at any point.Vb � bubble point volume, ccV � two-phase volume at pressure PV/Vb � relative volume, Vt
It was derived from the compressibility equation (Standing 1952)
(2)
Where � � compressibility, 1/psiV � volume, cc�V / �P � change in volume due to change in pressure at constant temperature T.This Y function, which is dimensionless, is applied to CME data below the bubble point from black
oil PVT studies (Standing, 1952; Craft and Hawkins, 1959; Amyx et. al., 1960). In this study we haveextended the Y function in a new way to determine dew-point pressure for gas condensates and alsobubble point pressures for black oils and volatile oils.
Source of Constant Mass Expansion DataThe samples for this study were selected from different regions worldwide and were classified bycomposition as follows (summarized in Table 4) (McCain, 1990):
● Samples with C7� composition of � 4.0 mole percent are classified as lean gas condensates.● Samples with C7� composition � 4.0 mole percent but � 12.5 mole percent are classified as rich
gas condensates.
SPE-169947-MS 3

● Samples with C7� composition � 12.5 mole percent but � 20.0 mole percent are classified asvolatile oils.
● Samples with C7� composition � 20.0 mole percent are classified as black oils.
CME data for samples LS1 to LS7 were obtained from published literature and for RS1 to RS4 fromPVT reports analyzed by commercial PVT laboratories. Sample TS2 (Hosein and Dawe, 2011) wasobtained by recombination using the PVT laboratory (Figure 1) at UWI. The gas and liquid condensatesamples for the recombination were taken from a surface test separator located on one of the gasproduction platforms offshore the Southeast coast of Trinidad.
Sample TS2 has a C7� composition lesser than 4.0 mole percent (Hosein and Dawe, 2011) whichsuggests that it is a lean gas condensate (McCain, 1990). Details of the sampling procedures, samplequality test conducted, recombination calculation and composition analysis have been outlined by Hosein(2004). A CME test was conducted on sample TS2 using the PVT apparatus at the UWI (Mayrhoo, 2012).Sample LS2 has a C7� composition greater than 4.0 mole percent (Coats and Smart, 1986) which suggestthat it is a rich gas condensate (McCain, 1990). Samples TS2 and LS2 were used to establish a methodfor determining dew point pressure without a visual cell. The method was tested with the other lean andrich gas samples and also for determining bubble point of black oils and volatile oils. CME data forSample LS2 was taken from Coats and Smart (1986).
PVT EquipmentA photograph of the PVT equipment used in this study is shown in Figure 1. Basically it can be dividedinto three sections as follows:
1. A three windowed high pressure cell enclosed in a temperature controlled air oven (Figure 1).2. A high pressure mercury injection system.3. Pressure gauge
The operating procedures followed were outlined by Hosein (2004).
Constant Mass Expansion Test
Determination of Dew Point Pressure by Observation
A Constant Mass Expansion (CME) test was performed on the recombined Trinidad sample TS2 tosimulate pressure-volume relations and to determine:
1. Dew point pressure by the observation method2. Hydrocarbon volume as a function of pressure.
This test was conducted in the windowed PVT cell (Figure 1), at reservoir temperature, with reservoirpressure as the starting point. Mercury was removed from the cell and the change in the hydrocarbonvolume was measured for each pressure reduction step (Table 1). During this process a second phaseevolved – retrograde liquid (McCain, 1990). The pressure at which the first droplet of liquid was observed(with the aid of a cathetometer) was reported as the saturation or dew point pressure (Table 1). The volumeoccupied by the saturated fluid, at dew point pressure, Vd was used as a reference volume and the totalhydrocarbon volume measured for each pressure depletion step was reported relative to this volume(Table 1). The volume of the liquid condensate at each pressure step was recorded and expressed as apercentage of the hydrocarbon volume at dew point (saturation) pressure. The pressures and volumes wereread to within � 0.5 psia and � 0.1 cc respectively. Further details of the experimental proceduresinvolved were outlined by Hosein (2004). It should be noted that this is a standard laboratory test that isconducted for gas condensate samples and can be found in PVT reports (Amyx et. al., 1960). In this test,
4 SPE-169947-MS

no hydrocarbon is removed from the cell. The observed dew point pressure was 6545 psia as shown inTable 1.
Results and DiscussionDew Point Pressure by ObservationDew point pressures are recorded during pressure reduction when the first sign of liquid droplets isobserved and again when pressure is increased, at the point when the last few remaining liquid dropletsvaporize. The average of these two pressure readings are taken as the dew point. The above method fordetermining dew point pressures for lean gases (C7� composition of less than 4.0 mole percent) is ratherdifficult and errors greater than � 500 psia are possible. To attempt to reduce this error, small pressurereduction steps of less than 100 psia are needed in order to observe the first sign of liquid droplets.Because of these small pressure steps, the small sample size (cell volume is usually less than 600 cc) andthe small amount of heavy components that condenses during pressure reduction, the determination ofdew point pressures by the observation method become tedious, time consuming and expensive.
Dew Point Pressure by Pressure – Volume (PV) RelationsMost often a pressure - relative volume (defined earlier) plot for gas condensates is a continuous curveas obtained in Figure 2 from the CME data in Table 2, for samples TS2 (Mayrhoo, 2012) and LS2 (Coatsand Smart, 1986). A change in trend indicating single phase (gas) above dew point and two phases (gasand liquid condensate) below dew point is not noticeable as with black oil samples above and below thebubble point (Standing 1952).
In PVT reports a backup for the visual reading is included from a plot of liquid condensate volumeagainst pressure. This plot is extrapolated to zero liquid volume and the pressure at this point is recordedas the dew point pressure. However a visual cell is needed to determine separately the liquid volume fromthe total hydrocarbon (gas plus liquid condensate) for each pressure depletion step.
The difficulty of measuring liquid condensate volume was documented by Eyton (1987). Because ofthe small sample size and the small amount of heavy components present (� 4.0 % for lean gases), thefirst pressure reduction step below dew point can be greater than 200 psia in order to measure only lessthan 0.3 cc of liquid condensate (Table 1). Another 0.5 cc to 1.0 cc can be lost due to wetting of the
Table 1—Constant Mass Expansion Data for Trinidad Sample TS2 (lean gas)
Pressure psia Liquid Vol. in Cell, cc Gas Vol. in Cell, cc Total Vol. in Cell., cc Relative Volume (1)
7515 (Pi) 75.0 (Vi) 75.0 (Vi) 0.943(Vi)
7115 76.6 76.6 0.964
7043 76.9 76.9 0.968
6995 77.1 77.1 0.971
6895 77.6 77.6 0.977
6745 78.3 78.3 0.986
6645 78.9 78.9 0.992
6545 (Pd) 0.0 79.5(Vd) 79.5(Vd) 1.000
6295 0.3 80.6 80.9 1.018
5995 1.2 81.7 82.8 1.042
5645 2.2 83.2 85.4 1.075
5245 3.3 85.7 89.0 1.120
4765 4.0 90.4 94.4 1.188
4265 4.3 97.3 101.7 1.279
3715 4.3 108.3 112.6 1.418
3215 4.1 122.7 126.7 1.595
2895 3.9 135.1 138.9 1.748
Notes: Relative Volume, Vt � V/Vd
SPE-169947-MS 5
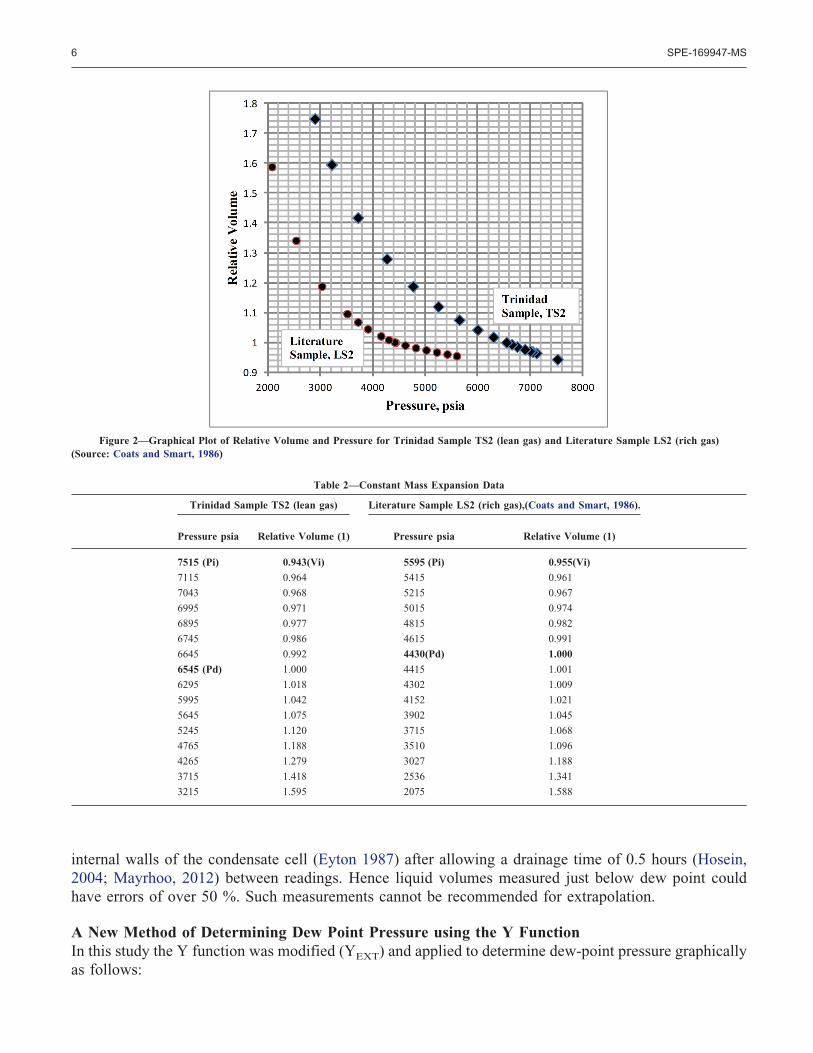
internal walls of the condensate cell (Eyton 1987) after allowing a drainage time of 0.5 hours (Hosein,2004; Mayrhoo, 2012) between readings. Hence liquid volumes measured just below dew point couldhave errors of over 50 %. Such measurements cannot be recommended for extrapolation.
A New Method of Determining Dew Point Pressure using the Y FunctionIn this study the Y function was modified (YEXT) and applied to determine dew-point pressure graphicallyas follows:
Figure 2—Graphical Plot of Relative Volume and Pressure for Trinidad Sample TS2 (lean gas) and Literature Sample LS2 (rich gas)(Source: Coats and Smart, 1986)
Table 2—Constant Mass Expansion Data
Trinidad Sample TS2 (lean gas) Literature Sample LS2 (rich gas),(Coats and Smart, 1986).
Pressure psia Relative Volume (1) Pressure psia Relative Volume (1)
7515 (Pi) 0.943(Vi) 5595 (Pi) 0.955(Vi)
7115 0.964 5415 0.961
7043 0.968 5215 0.967
6995 0.971 5015 0.974
6895 0.977 4815 0.982
6745 0.986 4615 0.991
6645 0.992 4430(Pd) 1.000
6545 (Pd) 1.000 4415 1.001
6295 1.018 4302 1.009
5995 1.042 4152 1.021
5645 1.075 3902 1.045
5245 1.120 3715 1.068
4765 1.188 3510 1.096
4265 1.279 3027 1.188
3715 1.418 2536 1.341
3215 1.595 2075 1.588
6 SPE-169947-MS

(3)
Where Pi � initial pressure (psia) at the start of the CME testP � pressure (psia) at any point.V � total hydrocarbon volume at pressure PVi � initial volume of hydrocarbon in the cell at Pi.The values of YEXT obtained at each pressure step for samples TS2 and LS2 are given in Table 3. When
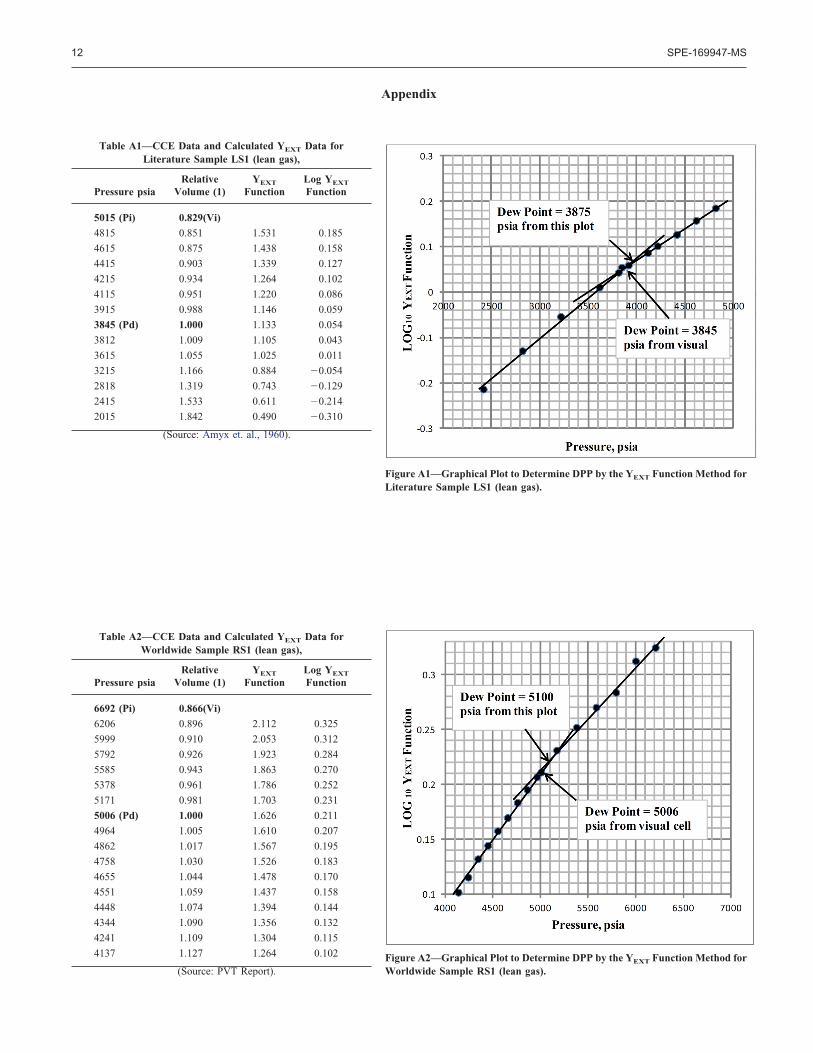
YEXT was plotted against pressure, a concave up and concave down plot was obtained as shown in Figure3 for Sample LS2. When log YEXT (Table 3) was plotted against pressure two straight lines were obtained,one above and one below the observed dew point. These lines were extended and the pressure at the pointwhere they met was recorded as the dew point pressure (Figures 4 and 5). The differences between theobserved and graphical values for both the lean and rich gas samples were less than � 2.0 %.
Table 3—Calculated YEXT and Log YEXT Data for Trinidad Sample TS2 (lean gas) and Literature Sample LS2 (rich gas).
Trinidad sample TS2 (lean gas). Literature Sample LS2 (rich gas) (Source: Coats and Smart, 1986).
Pressure psia YEXT Function Log YEXT Function Pressure psia YEXT Function Log YEXT Function
7515 (Pi) 5595 (Pi)
7115 2.403 0.381 5415 5.297 0.724
7043 2.370 0.375 5215 5.230 0.719
6995 2.374 0.375 5015 5.076 0.706
6895 2.344 0.370 4815 4.930 0.693
6745 2.291 0.360 4615 4.685 0.671
6645 2.247 0.352 4430(Pd) 4.409 0.644
6545 (Pd) 2.151 0.333 4415 4.378 0.641
6295 2.056 0.313 4302 4.094 0.612
5995 1.929 0.285 4152 3.703 0.569
5645 1.781 0.251 3902 3.207 0.506
5245 1.612 0.207 3715 2.834 0.452
4765 1.413 0.150 3510 2.522 0.402
4265 1.214 0.084 3027 1.882 0.275
3715 1.006 0.003 2536 1.351 0.131
Table 4—Comparison of Dew Point and Bubble Point Pressures Obtained by Observation and by the YEXT Graphical Method from this Study.
Samples Mole %C7� ClassificationExperimentalSat. P.,
(Psia) (Observed)YEXTSat. P., (Psia)
(Graphical) Difference (%)
LS1, (Amyx et al, 1960) 2.24 lean gas 3845 (dew point) 3875 (dew point) 0.8
RS1, (PVT Report) 3.9 lean gas 5006 (dew point) 5100 (dew point) 1.9
TS2 (Expt., this study) 3.92 lean gas 6545 (dew point) 6600 (dew point) 0.8
LS2, (Coats and Smart, 1986) 11.45 rich gas 4430 (dew point) 4500 (dew point) 1.6
LS3, (Pedersen et al, 1989) 5.69 rich gas 5820 (dew point) 5950 (dew point) 2.2
RS2, (PVT Report) 7.54 rich gas 6090 (dew point) 6100 (dew point) 0.2
LS4, (Coats and Smart, 1986) 35.97 black oil 1694 (bubble point) 1750 (bubble point) 3.3
LS5, (McCain, 1990) 33.29 black oil 2620 (bubble point) 2700 (bubble point) 3.1
RS3, (PVT Report) 36.49 black oil 4750 (bubble point) 4900 (bubble point) 3.2
LS6, (Coats and Smart, 1986) 18.51 volatile oil 2115 (bubble point) 2140 (bubble point) 1.2
LS7, (Coats and Smart, 1986) 16.92 volatile oil 4460 (bubble point) 4480 (bubble point) 0.4
RS4, (PVT Report) 15.66 volatile oil 7437 (bubble point) 7480 (bubble point) 0.6
Note: Difference, % � (Z YEXT. - Zobserved. / Z observed) � 100, where Z observed is the observed saturation pressure value and Z YEXT is the estimatedvalue from our YEXT Function Method.
SPE-169947-MS 7

This proposed YEXT function method was tested with CME data shown in Appendix Tables A1 to A4for these lean and rich gas condensate samples. Similar plots shown in Figures A1 to A4 were made toobtain graphical dew point pressures for these gas condensate samples by this method.
Figure 3—Graphical Plots of the YEXT Function and Pressure for Trinidad Sample TS2 (lean gas) and Literature Sample LS2 (rich gas), (Coats andSmart, 1986)
Figure 4—Graphical Plot to Determine Dew Point Pressure by the YEXT Function Method for Trinidad Sample TS2 (lean gas)
8 SPE-169947-MS

Application of the YEXT Function Method to Determine Bubble Point Pressure.The proposed YEXT function method was tested with CME data for black oils and volatile oil samplesshown in the Appendix Tables A5 to A10. Similar plots shown in Figures A5 to A10 were made to obtaingraphical bubble point pressures for these oil samples by this method.
Comparison of Saturation Pressure (Sat. P.) from Observation and the YEXT Function MethodThe observed dew point and bubble point pressures (Sat. P.) for the twelve samples can be seen in Table4. These were compared to the graphical values obtained by the proposed YEXT function method. Thedifferences between the observed and graphical values for the lean and rich gas samples, black oil andvolatile oil samples were less than � 4.0 %. These results show that with this new Y function method,dew point and bubble point pressures can be determined quickly and accurately without the use of a visualcell.
Conclusions
1. A technique using an EXTended Y function and called the YEXT function was developed todetermine dew point and bubble point pressures graphically.
2. The differences between the dew point and bubble point pressures determined by the proposedYEXT function method and the observation method were less than � 4.0 % for the lean and richgas condensate and oil samples tested.
3. A visual cell is not needed to determine dew point and bubble point pressures by the proposedYEXT function method. This new method is less tedious and time consuming when compared tothe visual method.
4. This application of the Y function to determine dew point and bubble point pressures for reservoirfluids was not found elsewhere in the open literature.
Figure 5—Graphical Plot to Determine Dew Point Pressure by the YEXT Function Method for Literature Sample LS2 (rich gas)(Source: Coats and Smart, 1986)
SPE-169947-MS 9

AcknowledgementsThe authors would like to thank the Campus Research and Publication Fund Committee of The Universityof the West Indies for providing the financial support for this Research Project.
ReferencesAhmed, T. 1989. Hydrocarbon Phase Behaviour. Gulf Publishing Company. Houston.Amyx, J. W., Bass, D. M. and Whiting R. L. 1960. Petroleum Reservoir Engineering Physical
Properties. McGraw Hill, Inc., New York, USA.Craft, B. C. and Hawkins, M. F. 1959. Applied Petroleum Reservoir Engineering. Prentice-Hall, Inc.,
Englewood Cliffs, New Jersey, USA.Coats, K. H. and Smart, G. T. 1986. Application of a Regression Based Equation of State PVT
Program to Laboratory Data. SPE 11197-PA. SPE Res. Eng., 1(3) 277–299.Danesh, A. 1998. PVT and Phase Behaviour of Petroleum Reservoir Fluids. Elsevier, Amsterdam.Dehane, A., Tiab, D. and Osisanya, S. O. 2000. Comparison of the Performance of Vertical and
Horizontal Wells in Gas Condensate Reservoirs. SPE 63164. Paper presented at the SPE AnnualTechnical Conference and Exhibition held in Dallas, Texas, October 1-4.
Eilerts K. and Smith R. V. 1942. Specific Volumes and Phase-Boundary Properties of Separator-Gasand Liquid-Hydrocarbon Mixtures. Technical report BM-RI-3642, Bureau of Mines, Bartlesville, Okla-homa, USA.
Eissa, M. and Shokir, El-M. 2008. Dewpoint Pressure Model for Gas Condensate Reservoirs Basedon Genetic Programming. SPE 114454. Paper presented at the CIPC/SPE Gas Technology Symposium2008 Joint Conference held in Calgary, Alberta, Canada, June 16-19.
Elsharkawy, A. 2002. Predicting the Dew point Pressure for Gas Condensate Reservoirs: EmpericalModels and Equations of State. Fluid Phase Equilibria, 193, 147–165.
Eyton, D. P. G. 1987. Practical Limitations in Obtaining PVT Data for Gas Condensate Systems. SPE15765. Paper presented at the Fifth Middle East Oil Show held in Manama, Bahrain. March 7-10.
Hosein, R. 2004. Phase Behaviour of Trinidad Gas Condensates, Ph.D. Dissertation. The Universityof the West Indies, St Augustine, Trinidad.
Hosein, R. and Dawe, R. A. 2011. A Parametric Methodology in Tuning the Peng-Robinson (PR)Equation of State for Gas Condensate Systems. Paper submitted to Journal of Petroleum Science andTechnology (accepted, in press).
Ikoku, C. U. 1992. Natural Production Engineering. The Pennsylvania State University. KriegerPublishing Co., Malabar, Florida, USA.
Mayrhoo, R. 2012. Determination of Dew Point Pressure with and without a Visual Cell ResearhProject Report, Department of Chemical Engineering archive, The University of the West Indies, St.Augustine, Trinidad.
McCain, W. D. Jr. 1990. The Properties of Petroleum Fluids, Second Edition, PennWell PublishingCo., Tulsa, Oklahoma.
McCain, W. D. Jr., Spivey, J. P. and Lenn, C. P. 2010. Petroleum Reservoir Fluid PropertyCorrelation. PennWell Publishing Co., Tulsa, Oklahoma.
Meisingset, K. K. 1998. Uncertainties in Reservoir Fluid Description for Reservoir Modelling. SPE57886. Paper presented at the Asia Pacific Conference. Kuala Lumpur. 23-24 March.
Nementh, L. K. and Kennedy, H. T. 1967. A Correlation of Dew Point Pressure with fluid compositionand Temperature. SPEJ June, 7(2) 99–104.
Organick, E. I. and Golding, B. H. 1952. Prediction of Saturation Pressures for Condensate-Gas andVolatile-Oil Mixtures. Trans. AIME 195, 135–148.
10 SPE-169947-MS

Pedersen, K. S., Fredenslund A. and Thomassen, P. 1989. Properties of Oil and Natural Gases. GulfPublishing Co., Houston.
Smith, J., Dawe, R. A. and Kydd, N. 2007. Flow Rate Effect on Retrograde Condensate Dropout inTrinidad Gas Reservoirs, Part A: Recovery, Utilization and Environmental Effects,. Energy Sources, 29,511–527.
Standing, M. B. 1952. Volumetric and Phase Behavior of Oil Field Hydrocarbon Systems. ReinholdPublishing Corp., New York, USA.
Walas, S. M. 1985. Chemical Engineering Thermodynamics. Butterworth Heinemann, Boston, USA.
SPE-169947-MS 11
Appendix
Table A1—CCE Data and Calculated YEXT Data forLiterature Sample LS1 (lean gas),
Pressure psiaRelative
Volume (1)YEXT
FunctionLog YEXT
Function
5015 (Pi) 0.829(Vi)
4815 0.851 1.531 0.185
4615 0.875 1.438 0.158
4415 0.903 1.339 0.127
4215 0.934 1.264 0.102
4115 0.951 1.220 0.086
3915 0.988 1.146 0.059
3845 (Pd) 1.000 1.133 0.054
3812 1.009 1.105 0.043
3615 1.055 1.025 0.011
3215 1.166 0.884 �0.054
2818 1.319 0.743 �0.129
2415 1.533 0.611 �0.214
2015 1.842 0.490 �0.310
(Source: Amyx et. al., 1960).
Table A2—CCE Data and Calculated YEXT Data forWorldwide Sample RS1 (lean gas),
Pressure psiaRelative
Volume (1)YEXT
FunctionLog YEXT
Function
6692 (Pi) 0.866(Vi)
6206 0.896 2.112 0.325
5999 0.910 2.053 0.312
5792 0.926 1.923 0.284
5585 0.943 1.863 0.270
5378 0.961 1.786 0.252
5171 0.981 1.703 0.231
5006 (Pd) 1.000 1.626 0.211
4964 1.005 1.610 0.207
4862 1.017 1.567 0.195
4758 1.030 1.526 0.183
4655 1.044 1.478 0.170
4551 1.059 1.437 0.158
4448 1.074 1.394 0.144
4344 1.090 1.356 0.132
4241 1.109 1.304 0.115
4137 1.127 1.264 0.102
(Source: PVT Report).
Figure A1—Graphical Plot to Determine DPP by the YEXT Function Method forLiterature Sample LS1 (lean gas).
Figure A2—Graphical Plot to Determine DPP by the YEXT Function Method forWorldwide Sample RS1 (lean gas).
12 SPE-169947-MS

Table A3—CCE Data and Calculated YEXT Data forLiterature Sample LS3 (rich gas),
Pressure psiaRelative
Volume (1)YEXT
FunctionLog YEXT
Function
7427 (Pi) 0.897(Vi)
7197 0.909 2.276 0.357
6941 0.923 2.225 0.347
6749 0.934 2.196 0.342
6522 0.948 2.130 0.328
6180 0.972 2.002 0.302
5895 0.996 1.867 0.271
5820 (Pd) 1.000 1.880 0.274
5777 1.004 1.868 0.271
5529 1.030 1.722 0.236
5177 1.071 1.563 0.194
4811 1.120 1.415 0.151
4508 1.173 1.278 0.106
4181 1.244 1.129 0.053
3834 1.325 1.013 0.006
3579 1.402 0.920 �0.036
(Source: Pedersen et. al., 1989).
Table A4—CCE Data and Calculated YEXT Data forWorldwide Sample RS2 (rich gas),
Pressure psiaRelative
Volume (1)YEXT
FunctionLog YEXT
Function
8015 (Pi) 0.914(Vi)
7515 0.931 3.353 0.525
7015 0.951 3.048 0.484
6550 0.974 2.793 0.446
6515 0.976 2.772 0.443
6315 0.986 2.670 0.426
6215 0.992 2.618 0.418
6115 0.998 2.567 0.409
6090 (Pd) 1.000 2.546 0.406
6064 1.002 2.528 0.403
6040 1.003 2.513 0.400
6018 1.005 2.496 0.397
5989 1.007 2.478 0.394
5969 1.008 2.466 0.392
5750 1.025 2.320 0.366
5363 1.060 2.075 0.317
4763 1.129 1.721 0.236
(Source: PVT Report).
Figure A3—Graphical Plot to Determine DPP by the YEXT Function Method forLiterature Sample LS3 (rich gas).
Figure A4—Graphical Plot to Determine DPP by the YEXT Function Methodfor Worldwide Sample RS2 (rich gas).
SPE-169947-MS 13

Table A5—CCE Data and Calculated YEXT Data forLiterature Sample LS4 (Black Oil),
Pressure psiaRelative
Volume (1)YEXT
FunctionLog YEXT
Function
5000 (Pi) 0.971(Vi)
4500 0.974 26.964 1.431
4000 0.978 25.213 1.402
3500 0.983 24.679 1.392
3000 0.987 23.676 1.374
2500 0.992 23.112 1.364
2100 0.996 22.520 1.353
1900 0.998 22.208 1.347
1694 (Pb) 1.000 21.905 1.341
1670 1.005 18.959 1.278
1642 1.010 16.588 1.220
1572 1.024 12.439 1.095
1475 1.048 8.888 0.949
1377 1.076 6.654 0.823
1263 1.118 4.915 0.692
1128 1.181 3.568 0.552
(Source: Coats and Smart, 1986).
Table A6—CCE Data and Calculated YEXT Data for LiteratureSample LS5 (Black Oil)
Pressure psiaRelative
Volume (1)YEXT
FunctionLog YEXT
Function
5000 (Pi) 0.964(Vi)
4500 0.970 15.061 1.178
4000 0.977 14.605 1.164
3500 0.985 13.970 1.145
3000 0.993 13.295 1.124
2900 0.995 13.187 1.120
2800 0.996 13.050 1.116
2700 0.998 12.889 1.110
2620 (Pb) 1.000 12.710 1.104
2605 1.002 12.055 1.081
2591 1.004 11.552 1.063
2516 1.015 9.298 0.968
2401 1.035 7.047 0.848
2253 1.065 5.264 0.721
2090 1.104 4.004 0.603
1897 1.163 3.000 0.477
(Source: McCain, 1990).
Figure A5—Graphical Plot to Determine BPP by the YEXT Function Method forLiterature Sample LS4 (Black Oil).
Figure A6—Graphical Plot to Determine BPP by the YEXT Function Method forLiterature Sample LS5 (Black Oil).
14 SPE-169947-MS
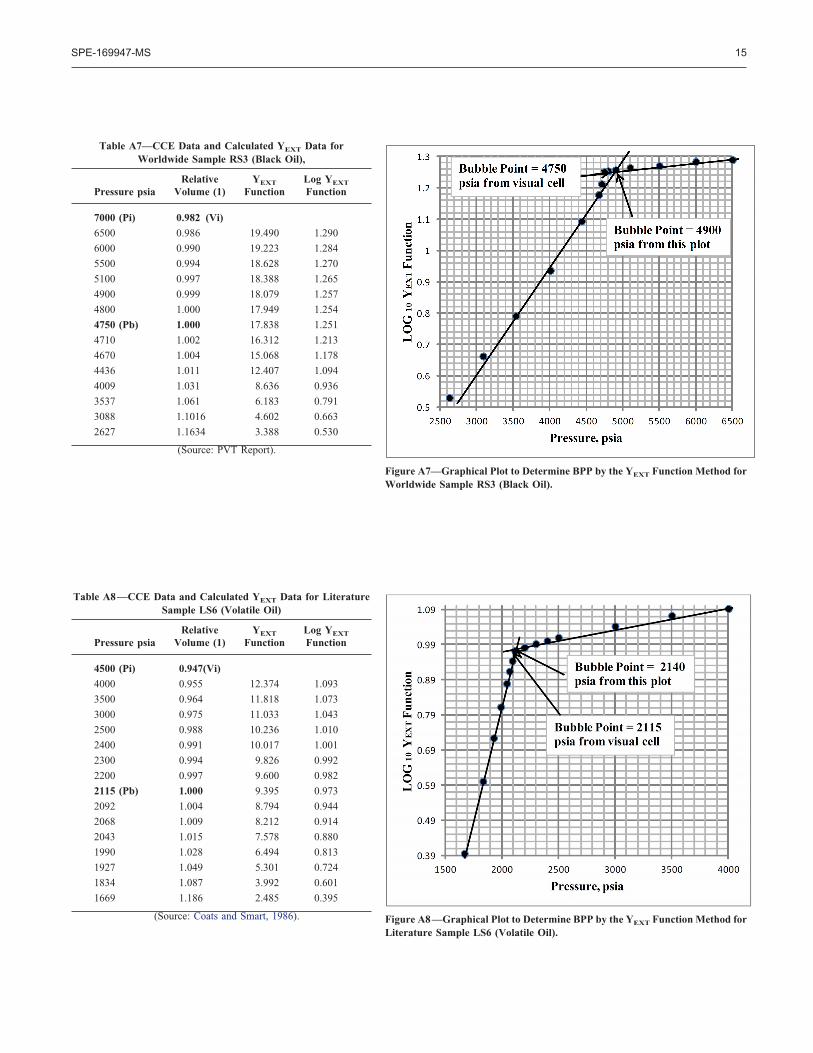
Table A7—CCE Data and Calculated YEXT Data forWorldwide Sample RS3 (Black Oil),
Pressure psiaRelative
Volume (1)YEXT
FunctionLog YEXT
Function
7000 (Pi) 0.982 (Vi)
6500 0.986 19.490 1.290
6000 0.990 19.223 1.284
5500 0.994 18.628 1.270
5100 0.997 18.388 1.265
4900 0.999 18.079 1.257
4800 1.000 17.949 1.254
4750 (Pb) 1.000 17.838 1.251
4710 1.002 16.312 1.213
4670 1.004 15.068 1.178
4436 1.011 12.407 1.094
4009 1.031 8.636 0.936
3537 1.061 6.183 0.791
3088 1.1016 4.602 0.663
2627 1.1634 3.388 0.530
(Source: PVT Report).
Table A8—CCE Data and Calculated YEXT Data for LiteratureSample LS6 (Volatile Oil)
Pressure psiaRelative
Volume (1)YEXT
FunctionLog YEXT
Function
4500 (Pi) 0.947(Vi)
4000 0.955 12.374 1.093
3500 0.964 11.818 1.073
3000 0.975 11.033 1.043
2500 0.988 10.236 1.010
2400 0.991 10.017 1.001
2300 0.994 9.826 0.992
2200 0.997 9.600 0.982
2115 (Pb) 1.000 9.395 0.973
2092 1.004 8.794 0.944
2068 1.009 8.212 0.914
2043 1.015 7.578 0.880
1990 1.028 6.494 0.813
1927 1.049 5.301 0.724
1834 1.087 3.992 0.601
1669 1.186 2.485 0.395
(Source: Coats and Smart, 1986).
Figure A7—Graphical Plot to Determine BPP by the YEXT Function Method forWorldwide Sample RS3 (Black Oil).
Figure A8—Graphical Plot to Determine BPP by the YEXT Function Method forLiterature Sample LS6 (Volatile Oil).
SPE-169947-MS 15

Table A9—CCE Data and Calculated YEXT Data for LiteratureSample LS7 (Volatile Oil),
Pressure psiaRelative
Volume (1)YEXT
FunctionLog YEXT
Function
6000 (Pi) 0.959(Vi)
5500 0.970 7.199 0.857
5000 0.983 6.715 0.827
4800 0.988 6.523 0.814
4700 0.992 6.296 0.799
4600 0.995 6.181 0.791
4500 0.998 6.069 0.783
4460 (Pb) 1.000 5.988 0.777
4443 1.001 5.925 0.773
4305 1.010 5.332 0.727
3900 1.041 4.078 0.610
3531 1.081 3.226 0.509
3132 1.143 2.496 0.397
2769 1.223 1.954 0.291
2422 1.336 1.518 0.181
2128 1.474 1.202 0.080
(Source: Coats and Smart, 1986).
Table A10—CCE Data and Calculated YEXT Data forWorldwide Sample RS4 (Volatile Oil),
Pressure psiaRelative
Volume (1)YEXT
FunctionLog YEXT
Function
10000 (Pi) 0.952(Vi)
9500 0.960 5.878 0.769
9000 0.969 5.668 0.753
8500 0.978 5.494 0.740
8000 0.988 5.320 0.726
7800 0.992 5.251 0.720
7700 0.994 5.215 0.717
7600 0.996 5.183 0.715
7500 0.999 5.142 0.711
7437 (Pb) 1.000 5.117 0.709
7419 1.001 5.099 0.708
7394 1.001 5.065 0.705
7370 1.002 5.049 0.703
7345 1.003 5.027 0.701
7322 1.003 5.010 0.700
7203 1.006 4.942 0.694
(Source: PVT Report).
Figure A9—Graphical Plot to Determine BPP by the YEXT Function Method forLiterature Sample LS7 (Volatile Oil).
Figure A10—Graphical Plot to Determine BPP by the YEXT Function Methodfor Worldwide Sample RS4 (Volatile Oil).
16 SPE-169947-MS