Embed Size (px)
Citation preview
Chapter- 5
PIGMENT ANALYSIS
5.1 Introduction
5.2 Materials and Methods
5.3 Results and Discussion
5.3.1 Chlorophyll a 5.3.2 Chlorophyll b 5.3.3 Chlorophyll c 5.3.4 Total Chlorophyll 5.3.5 Carotenoids 5.3.6 Pheophytin 5.3.7 Pheophytin : chlorophyll ratio
5.4 Summary
Co
nt
en
ts
Pigment Analysis
159
5.1 Introduction
A primary algal characteristic is the presence of photosynthetic
pigments- the chlorophylls, carotenoids and biliproteins. Chlorophyll a is
the primary photosynthetic pigment of all oxygen-evolving photosynthetic
organisms and is present in all algae and Cyanobacteria. Chlorophyll a has
two in vitro absorption bands; in the red-light region at 660-665 nm and at
lower wave lengths near 430nm. Chlorophyll b, although common in
higher plants, is found only in green algae, Euglenineae and certain other
minor groups. Chlorophyll b is a light-gathering pigment that transfers
absorbed light energy to chlorophyll a for primary photochemical reactions.
Chlorophyll c, consisting of three spectrally distinct components, is
probably an accessory pigment to photo system II (Wetzel 2001).
Algal pigment composition of pokkali and prawn fields of
N. Paravoor and Vypeen Island has not been studied so far. The adjacent
Cochin estuary has been studied extensively with regard to the various
groups of planktonic algae (George 1958; Qasim et al. 1969, 1972;
Gopinathan 1972; Gopinathan et al. 1984; Nair et al. 1975; Joseph and
Sreekumar 1993). Sivadasan and Joseph (1995) have studied the
photosynthetic pigments of benthic microflora in Cochin estuary. Renjith
et al. (2004) have studied the primary production and fishery potential of the
Panangad region of Cochin estuary and recorded the chlorophyll a content.
Pigment Analysis
160
Sanilkumar et al. (2009) had estimated the pigment composition of
microphytobenthos in Cochin estuary. Periphyton colonization on
different substrata, floral composition of the periphyton community and
its spatial and temporal variations in the Cochin estuary has been studied
(Sreekumar and Joseph, 1995a: 1995b). Periphytic algae have a significant
role in the primary production and contribute substantially to primary
production (Wetzel 1964) and these are responsible for about 90% of total
organic production (Wetzel 1990). Seasonal and spatial variations in
pigment composition of periphytic algae in pokkali and prawn fields of N.
Paravoor and Vypeen Island are presented in view of their importance in
primary production.
5.2 Materials and Methods
Quantitative determination of the pigments was done using
periphyton grown on glass slides of 25x75 mm size kept submerged at
different stations (APHA 1998). Pigments were extracted with aqueous
acetone and OD was measured with spectrophotometer (Hitachi U-2001).
Individual glass slides with periphyton colonies retrieved from different
stations were placed directly into 100 ml of a mixture of 90% aqueous
acetone and 10% saturated MgCO3 solution. The samples were frozen
protected from the light by wrapping in aluminum foil in the field and
kept steeped in acetone for 24 hours in the dark near 4o C. 3 ml. of
clarified extract was transferred to a 1 cm cuvette and absorbance read at
Pigment Analysis
161
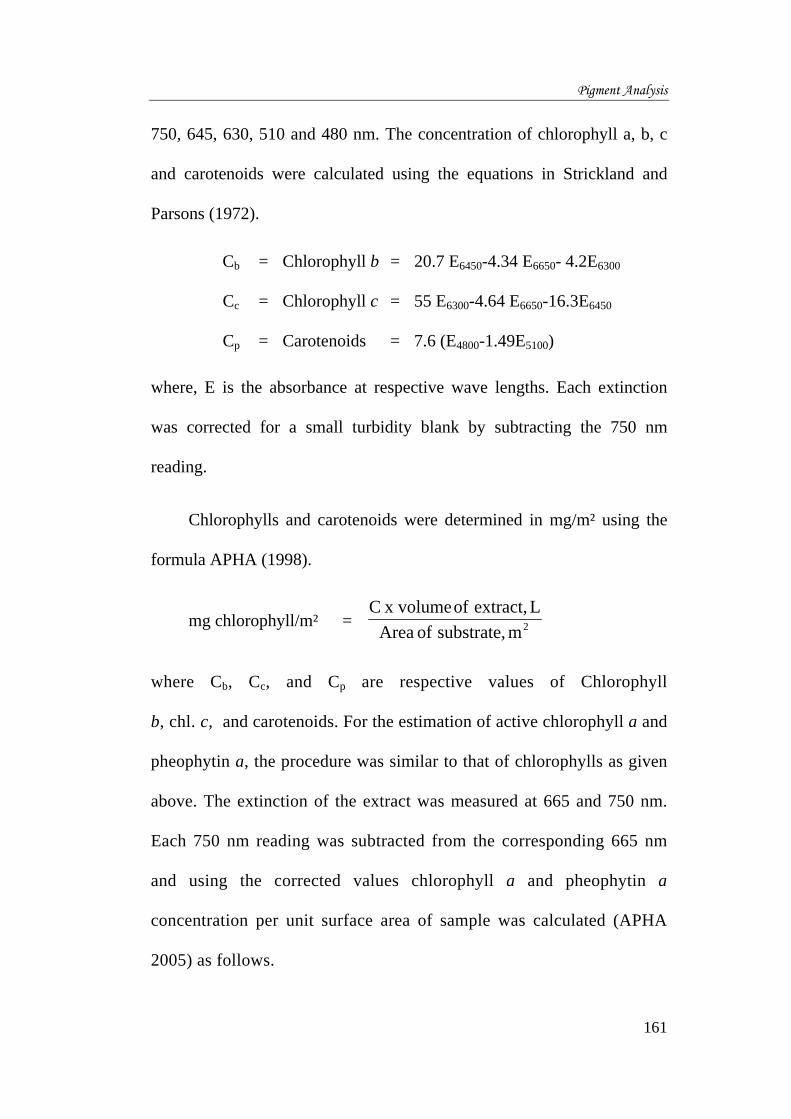
750, 645, 630, 510 and 480 nm. The concentration of chlorophyll a, b, c
and carotenoids were calculated using the equations in Strickland and
Parsons (1972).
Cb = Chlorophyll b = 20.7 E6450-4.34 E6650- 4.2E6300
Cc = Chlorophyll c = 55 E6300-4.64 E6650-16.3E6450
Cp = Carotenoids = 7.6 (E4800-1.49E5100)
where, E is the absorbance at respective wave lengths. Each extinction
was corrected for a small turbidity blank by subtracting the 750 nm
reading.
Chlorophylls and carotenoids were determined in mg/m² using the
formula APHA (1998).
mg chlorophyll/m² = 2m substrate, of AreaL extract, of x volumeC
where Cb, Cc, and Cp are respective values of Chlorophyll
b, chl. c, and carotenoids. For the estimation of active chlorophyll a and
pheophytin a, the procedure was similar to that of chlorophylls as given
above. The extinction of the extract was measured at 665 and 750 nm.
Each 750 nm reading was subtracted from the corresponding 665 nm
and using the corrected values chlorophyll a and pheophytin a
concentration per unit surface area of sample was calculated (APHA
2005) as follows.
Pigment Analysis
162
Chlorophyll a, mg/m² = m² substrate, of area v )665-(665 26.7 ab ×
pheophytin a, mg/m² = m² substrate, of area
}665 - ){1.7(665 26.7 ba
where 665 b = extinction at 665 nm before acidification.
665 a = extinction at 665 nm after acidification
v = volume of extract, L. The value 26.7 is
the absorbance correction and 1.7 is the
absorption peak ratio.
5.3 Results and Discussion 5.3.1 Chlorophyll a
Chlorophyll a (Chl. a) is probably the most frequently measured
compound of biological origin in aquatic sciences. The ease of its
extraction and the relatively wide-spread occurrence of instruments for its
measurement make it an attractive surrogate for estimation of algal
biomass (Yacobi and Zohary 2010).
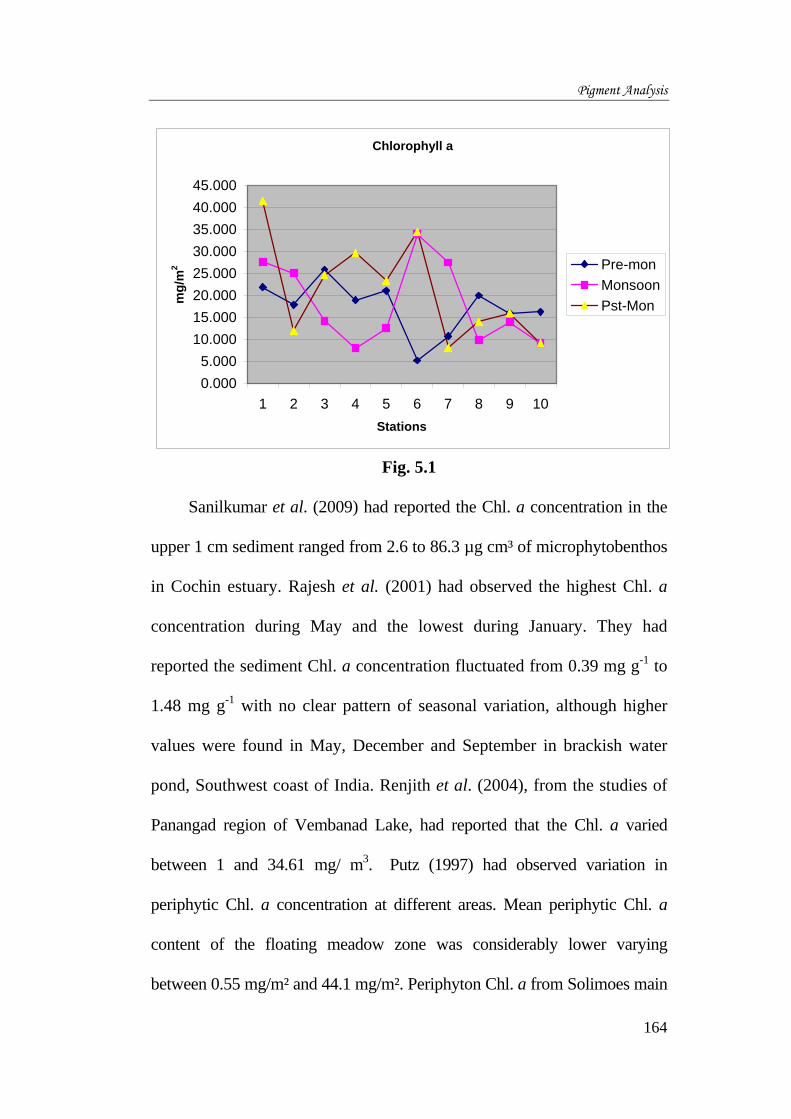
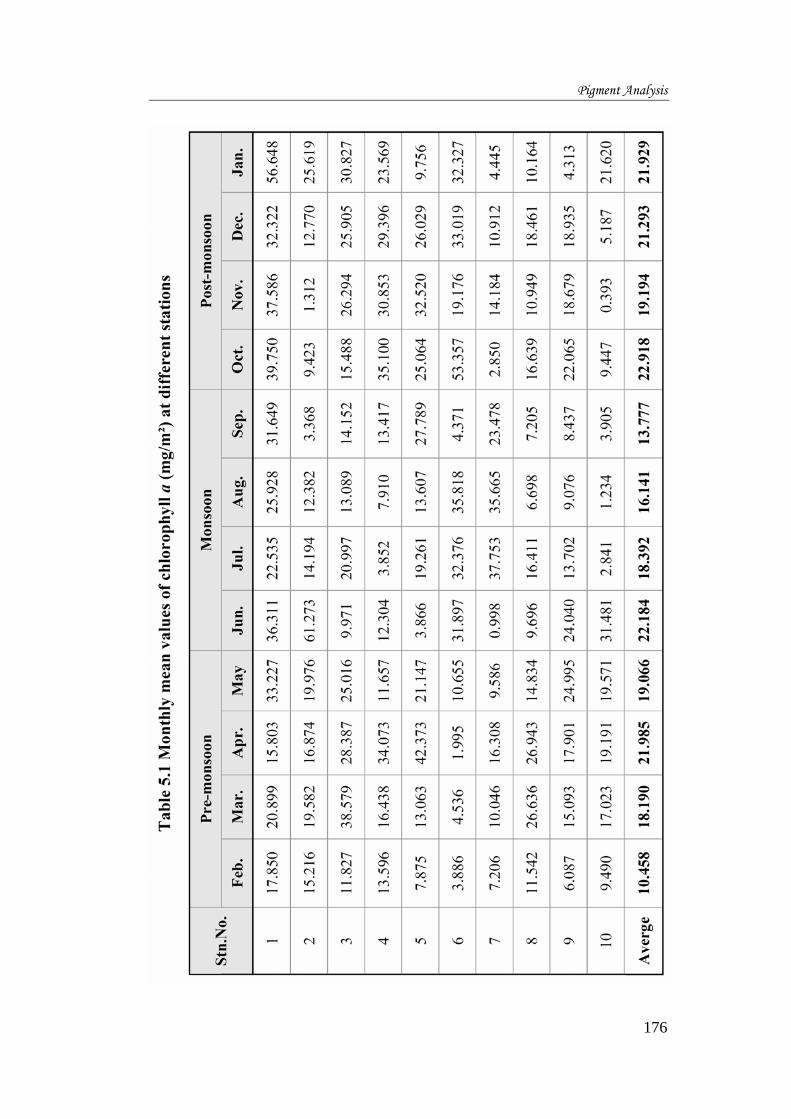
The seasonal and spatial variations of chlorophyll a at different
stations are shown in the Table 5.1. The annual mean concentration of
chlorophyll a in the study area was 18.80 mg m-2. The highest
concentration of chlorophyll a, 61.273 mg m-2 in the study area was
recorded at Pookad in June and the lowest, 0.393 mg m-2 at Pattanam
station during November. Chlorophyll values are generally taken as an
Pigment Analysis
163
index for standing crop of an ecosystem. During pre-monsoon the mean
chlorophyll a value was 17.425 ± 9.259 mg m-2 where as the monsoon and
post-monsoon values were 17.623 ±1 3.275 and 21.333 ± 13.302 mg m-2
respectively (Fig. 5.1). The Chl. a distribution followed the same trend of
standing crop showing the highest number during post-monsoon. The
concentration of Chl. a at different stations highlighted the magnitude of
periphyton bio-mass and its significance. The seasonal variations of
chlorophyll a values in the study area indicated that the post-monsoon
period was more suitable for periphyton growth.
Singh and Gaur (1989) reported Chl. a concentrations of 53.8, 34.58
and 59.34 mg m-2 for periphyton in a stream polluted with oil refinery
effluent at Digboi (Assam, India) in April , September, 1986 and January
1987 respectively. However Hansson (1992) had reported 30-270 mg m-2
Chl. a in Swedish Lakes and 20-400 mg m-2 in Antarctic Lakes. Joseph and
Pillai (1975) reported spatial seasonal variation in Chl. a values for the
planktonic algae in Cochin estuary. For the plankton, Chl. a was the lowest
during monsoon and the highest during post-monsoon. Sivadasan and Joseph
(1995) had reported the concentration benthic floral Chl. a from Cochin
estuary. The Chl. a concentration ranged from 57.26 mg/m² (post-monsoon)
to 78.36 mg/m² (pre-monsoon). However, in this study the periphytic Chl. a
showed maximum concentration during post-monsoon (Fig 5.1).
Pigment Analysis
164
Chlorophyll a
0.0005.000
10.00015.00020.00025.00030.00035.00040.00045.000
1 2 3 4 5 6 7 8 9 10Stations
mg/
m2 Pre-mon
MonsoonPst-Mon
Fig. 5.1
Sanilkumar et al. (2009) had reported the Chl. a concentration in the
upper 1 cm sediment ranged from 2.6 to 86.3 µg cm³ of microphytobenthos
in Cochin estuary. Rajesh et al. (2001) had observed the highest Chl. a
concentration during May and the lowest during January. They had
reported the sediment Chl. a concentration fluctuated from 0.39 mg g-1 to
1.48 mg g-1 with no clear pattern of seasonal variation, although higher
values were found in May, December and September in brackish water
pond, Southwest coast of India. Renjith et al. (2004), from the studies of
Panangad region of Vembanad Lake, had reported that the Chl. a varied
between 1 and 34.61 mg/ m3. Putz (1997) had observed variation in
periphytic Chl. a concentration at different areas. Mean periphytic Chl. a
content of the floating meadow zone was considerably lower varying
between 0.55 mg/m² and 44.1 mg/m². Periphyton Chl. a from Solimoes main
Pigment Analysis
165
stream oscillated between 0.0 mg/m² and 7.1 mg/m². Some days Chl. a was
undetectable, which indicated a heterotrophic attached assemblage
( Putz 1997).
Nayar et al. (2005) had reported the periphyton Chl. a ranging from 0.03
to 2.71 µg/ cm-2 and a mean of 1.32 µg cm-2 in Ponggol estuary, Singapore.
Bothwell (1983) reported Chl. a concentration ranging from 0.006 to
5 .0 µg cm-2 in periphyton studies in Thompson River, British Columbia.
Ishida et al. (2006) had reported the Chl. a values of epilithic algae
ranging from 1.7 to 112.5 mg m-2.
Mc Minn et al. (2007) had reported the areal Chl. a concentrations
varied from a minimum of 0.025 mg m-2 to a maximum of 5.18 mg m-2
with a mean of 2.16 mg m-2 in their experiments in eastern Antarctica.
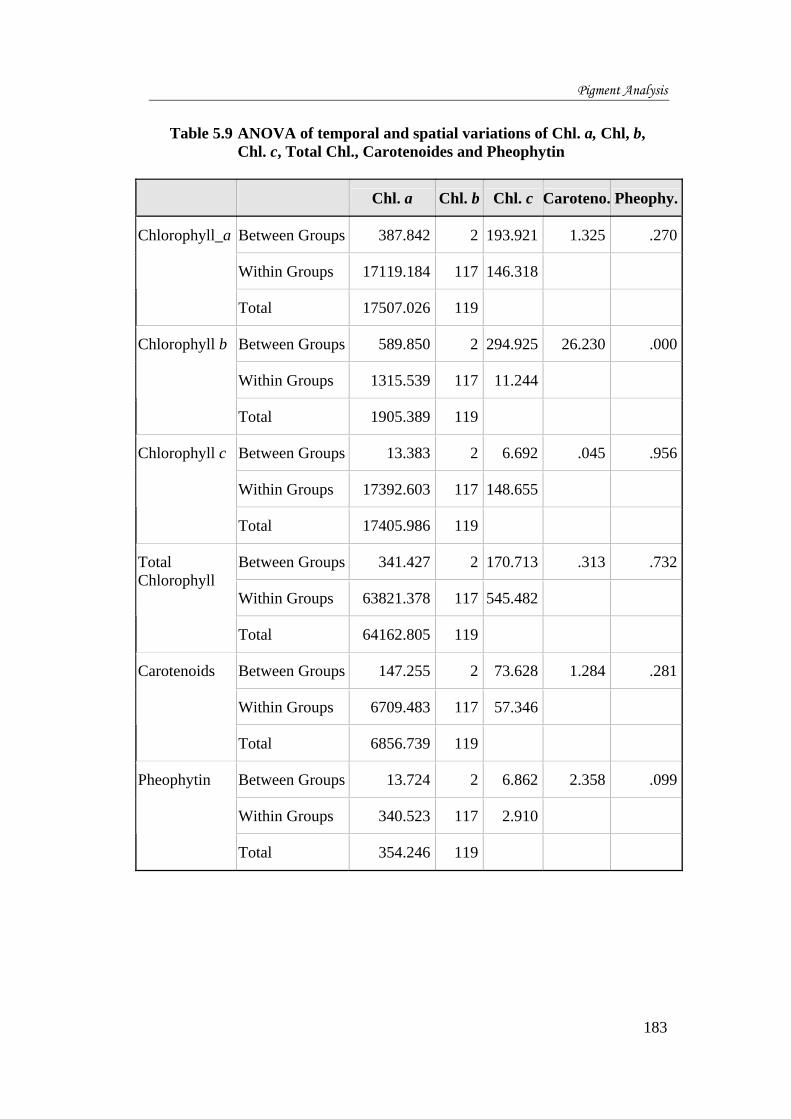
Seasonal and spatial variations in the concentration of Chl. a were
examined using two way ANOVA (Table5.9). A significant difference in
Chl. a values were observed between different stations. However, there
was no significant variation noticed between seasons. Correlation between
the monthly mean values of Chl. a and hydrological parameters such as
dissolved oxygen, nitrate, nitrite, silicate, phosphate, pH, temperature and
salinity were analysed (Table 5.8). No significant correlation between
Chl. a and any hydrological parameters except temperature were
observed. Chl. a showed positive correlation to temperature.
Pigment Analysis
166
The low chlorophyll a values could be due to the type of dominant
algae in this community. Welch et al. (1988) pointed out that periphyton
communities dominated by Chlorophyceae always show the highest
chlorophyll a values. 75.6 % of the periphytic algae of the study area
comprised with diatoms.
Posey et al. (2006) has recorded the highest benthic Chl. a values
(350-375 mg m-2) in Cape Fear estuary, southeastern North Carolina,
where nitrogen and phosphorus concentrations were very high.
5.3.2 Chlorophyll b
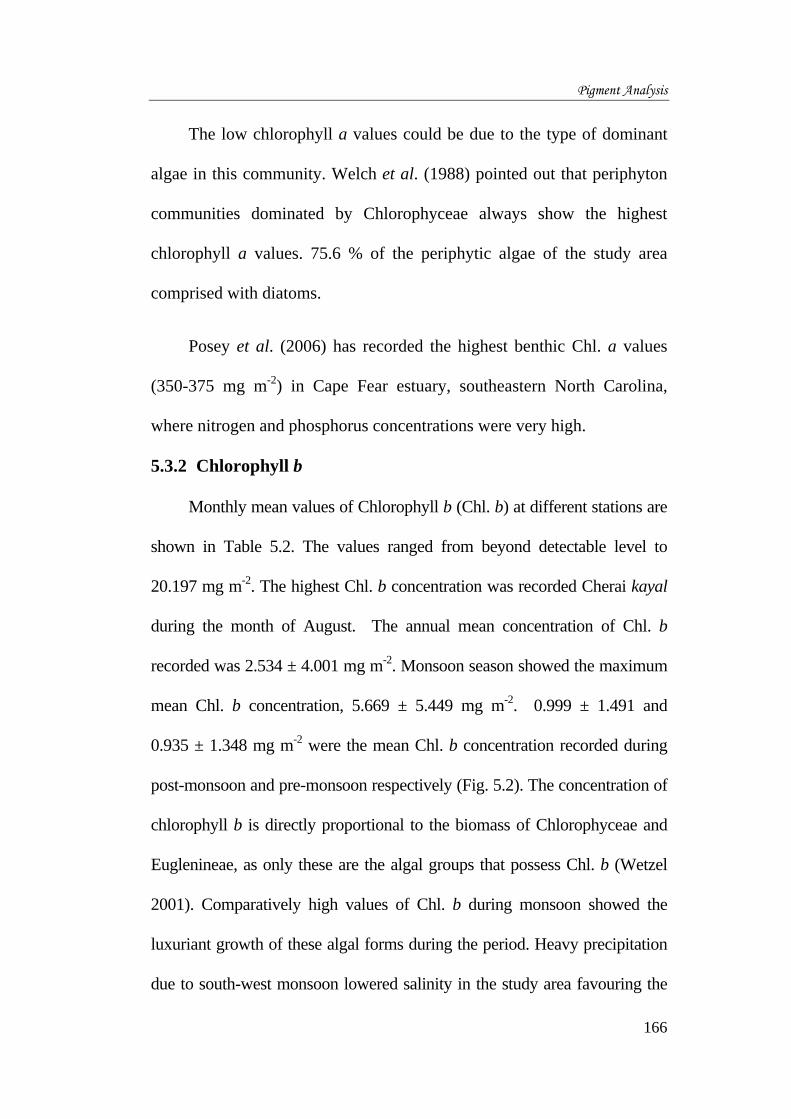
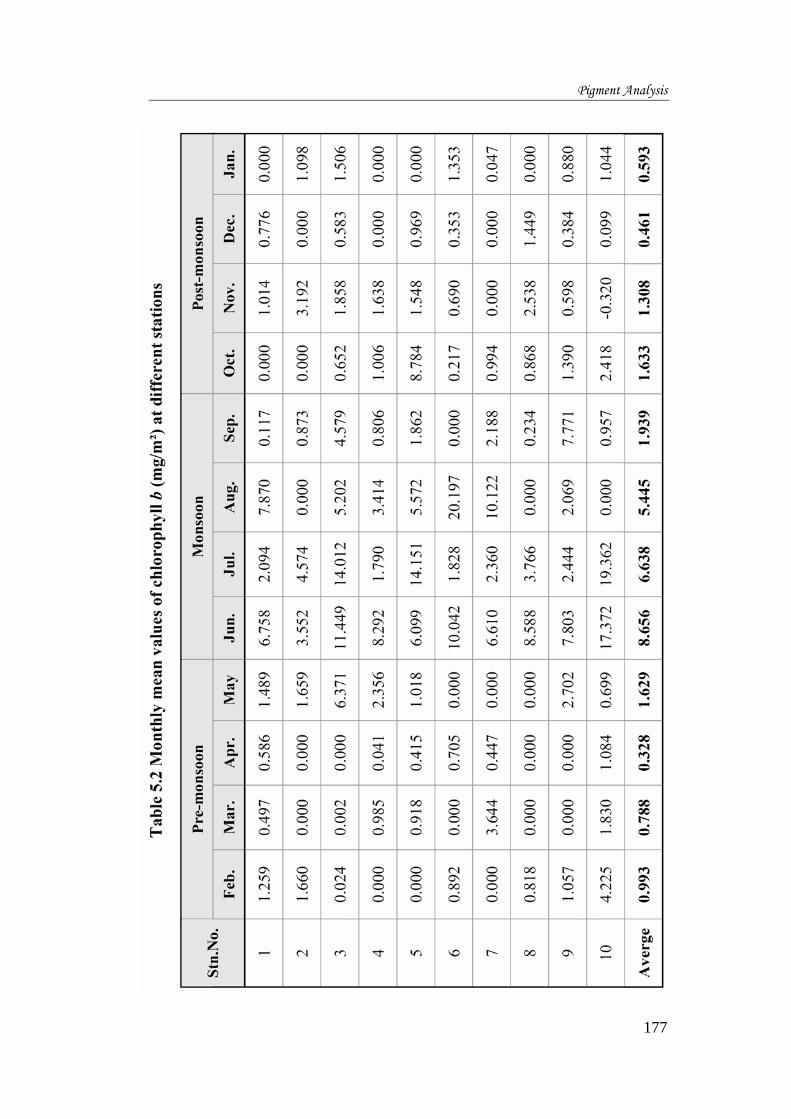
Monthly mean values of Chlorophyll b (Chl. b) at different stations are
shown in Table 5.2. The values ranged from beyond detectable level to
20.197 mg m-2. The highest Chl. b concentration was recorded Cherai kayal
during the month of August. The annual mean concentration of Chl. b
recorded was 2.534 ± 4.001 mg m-2. Monsoon season showed the maximum
mean Chl. b concentration, 5.669 ± 5.449 mg m-2. 0.999 ± 1.491 and
0.935 ± 1.348 mg m-2 were the mean Chl. b concentration recorded during
post-monsoon and pre-monsoon respectively (Fig. 5.2). The concentration of
chlorophyll b is directly proportional to the biomass of Chlorophyceae and
Euglenineae, as only these are the algal groups that possess Chl. b (Wetzel
2001). Comparatively high values of Chl. b during monsoon showed the
luxuriant growth of these algal forms during the period. Heavy precipitation
due to south-west monsoon lowered salinity in the study area favouring the
Pigment Analysis
167
growth of freshwater algae like Stigeoclonium, Mougeotia, Oedogonium,
Spirogyra and Cladophora. The low concentration of Chl. b may be due to
the low distribution of Chl. b bearing microflora. 75.6 % of the periphyton
recorded in the study belonged to Bacillariophyceae. Diatoms do not carry
Chl. b (Wetzel 2001).
Cherai kayal located near the Arabian Sea showed the maximum
Chl. b concentration during August. Compared to the values of Chl. a,
Chl. b values were very low. During the monsoon the study area
maintained more or less fresh water conditions but salinity increased
gradually through post-monsoon and reaching the maximum during the
pre-monsoon which favoured the diatoms.
Chlorophyll b
0.000
2.000
4.000
6.000
8.000
10.000
1 2 3 4 5 6 7 8 9 10Stations
mg/
m2 Pre-mon
MonsoonPst-Mon
Fig. 5.2
However the Chl. b values were the maximum during monsoon and
gradually decreased through post-monsoon reaching the lowest during pre-
Pigment Analysis
168
monsoon. The monsoon favoured the growth Chlorophycean members and
this attributed the high Chl. b concentration during monsoon.
Sreekumar (1998) had reported concentration of chlorophyll b in
periphytic algae in Cochin estuary which varied from 0 to 51.98 mg m-2 and
an annual mean of 6.36 mg m-2. Sivadasan and Joseph (1995) have estimated
the chlorophyll b of benthic microflora in Cochin estuary. The monthly
average values varied from 2.01 mg m-2, in October to 14.85 mg m-2 in
August. The concentration of Chl. b was almost negligible at many stations
in the present study. This was due to the occurrence of diatoms which carry
no chlorophyll b. Sanilkumar et al. (2009) also reported a low
concentration of Chl. b in microphytobenthos of Cochin estuary.
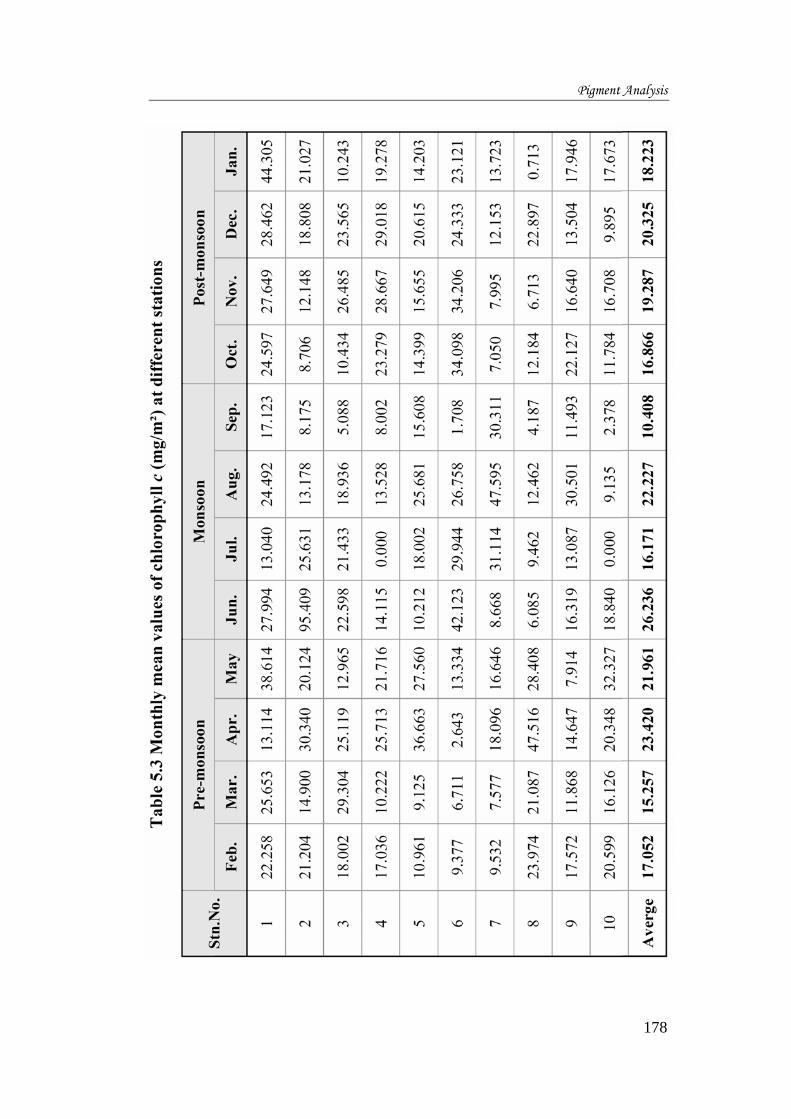
5.3.3 Chlorophyll c
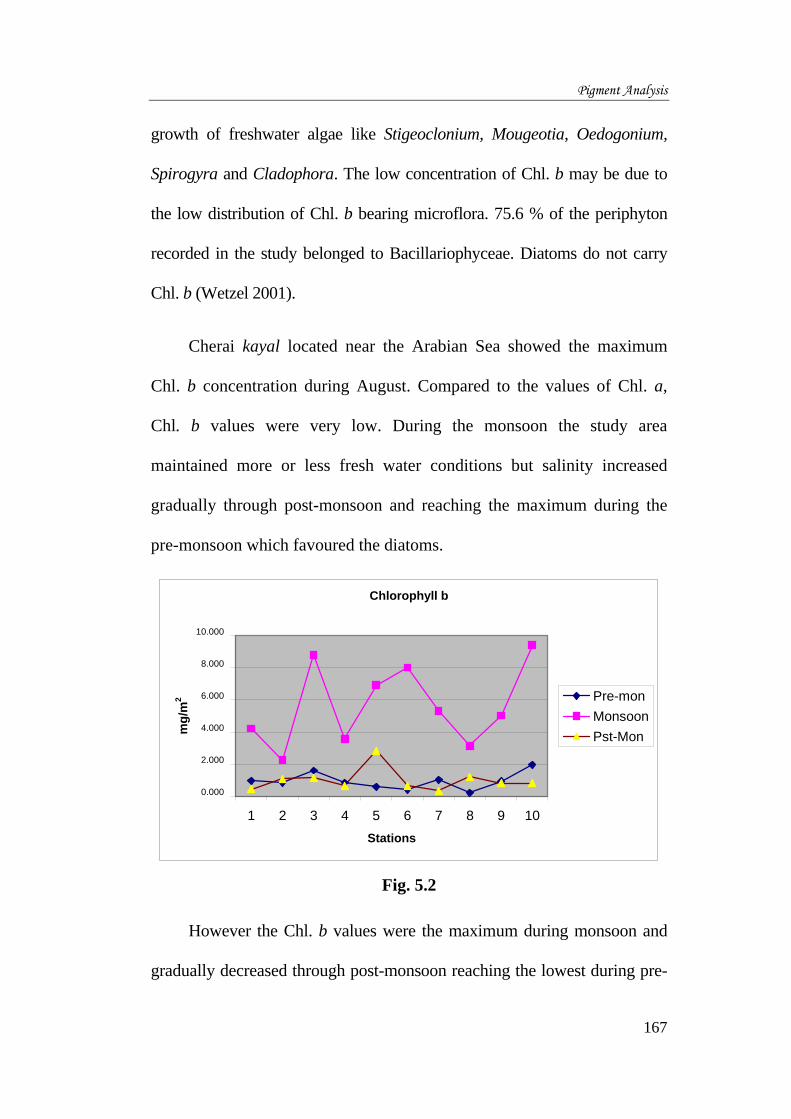
Monthly mean values of the chlorophyll c (Chl.c) at different
stations are summarized in Table 5.3. The annual mean concentration of
Chl. c was 18.827 mg m-2. The lowest concentration of Chl. c recorded
was below beyond detection at Pattanam station during July and the
highest, 95.410 mg m-2 at Pukkad during June. The average
concentrations of Chl. c during pre-monsoon, monsoon and post-monsoon
were 19.422 ± 9.259, 18.760 ±16.611 and 18.675 ± 8.865 mg m-2
respectively (Fig. 5.3). Both monsoon and post-monsoon seasons recorded
almost similar quantity of Chl. c concentrations and the pre-monsoon
Pigment Analysis
169
recorded the highest. With the increase of the salinity in backwaters there
was a corresponding increase in the diatom standing crop as indicated by
the higher values of Chl. c during pre-monsoon.
Chlorophyll c
0.0005.000
10.000
15.00020.00025.00030.000
35.00040.000
1 2 3 4 5 6 7 8 9 10
Stations
mg/
m2 Pre-mon
MonsoonPst-Mon
Fig. 5.3
Sreekumar (1998) had recorded the same pattern of distribution of
periphytic Chl. c in Cochin estuary. Sivadasan and Joseph(1995) had
reported the Chl. c concentrations in benthic microflora in Cochin estuary
ranged from 11.3 mg m-2 to 44.31 mg m-2. Sanilkumar (2009) had noticed
Chl. c concentration in phytomicrobenthos of Cochin estuary ranged from
0 to 14.29 µg/cm³ in the top most layers.
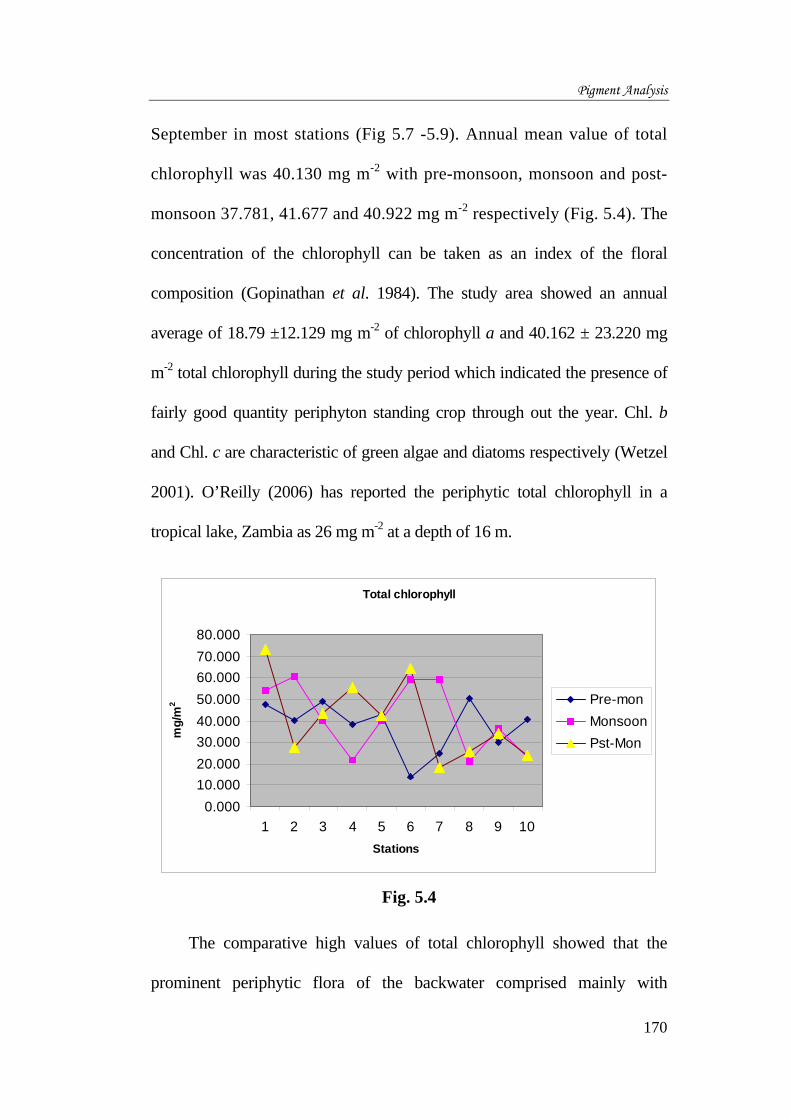
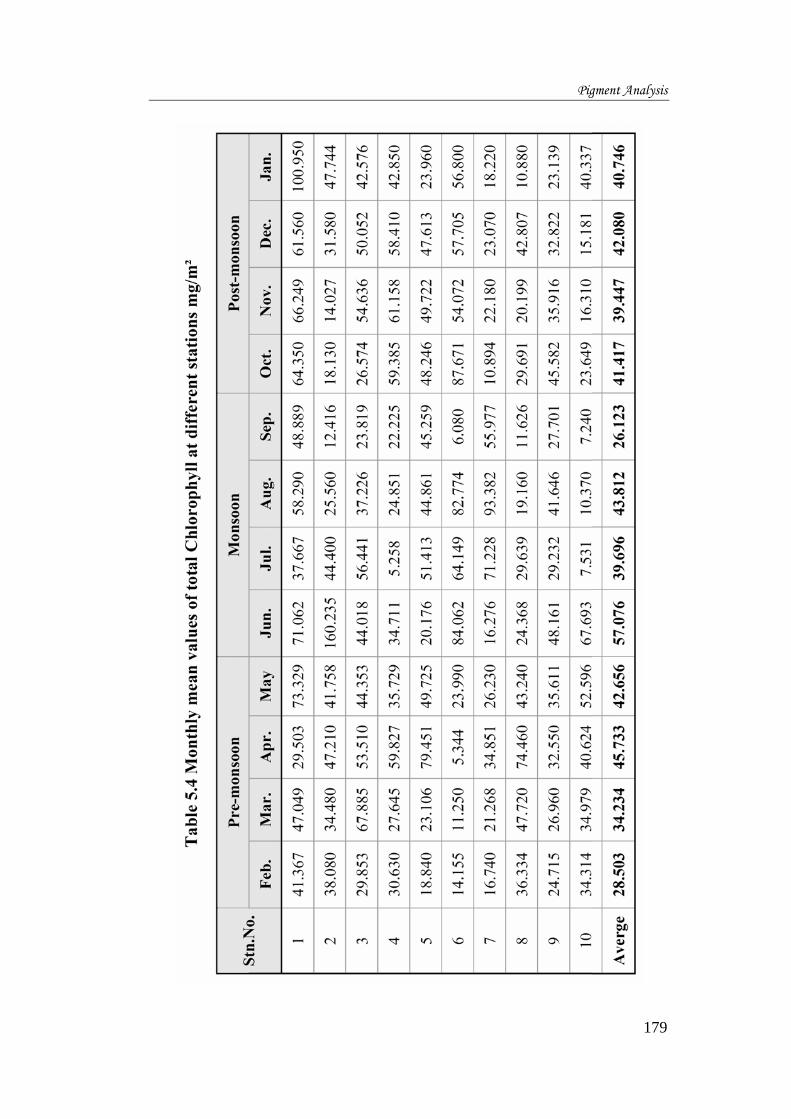
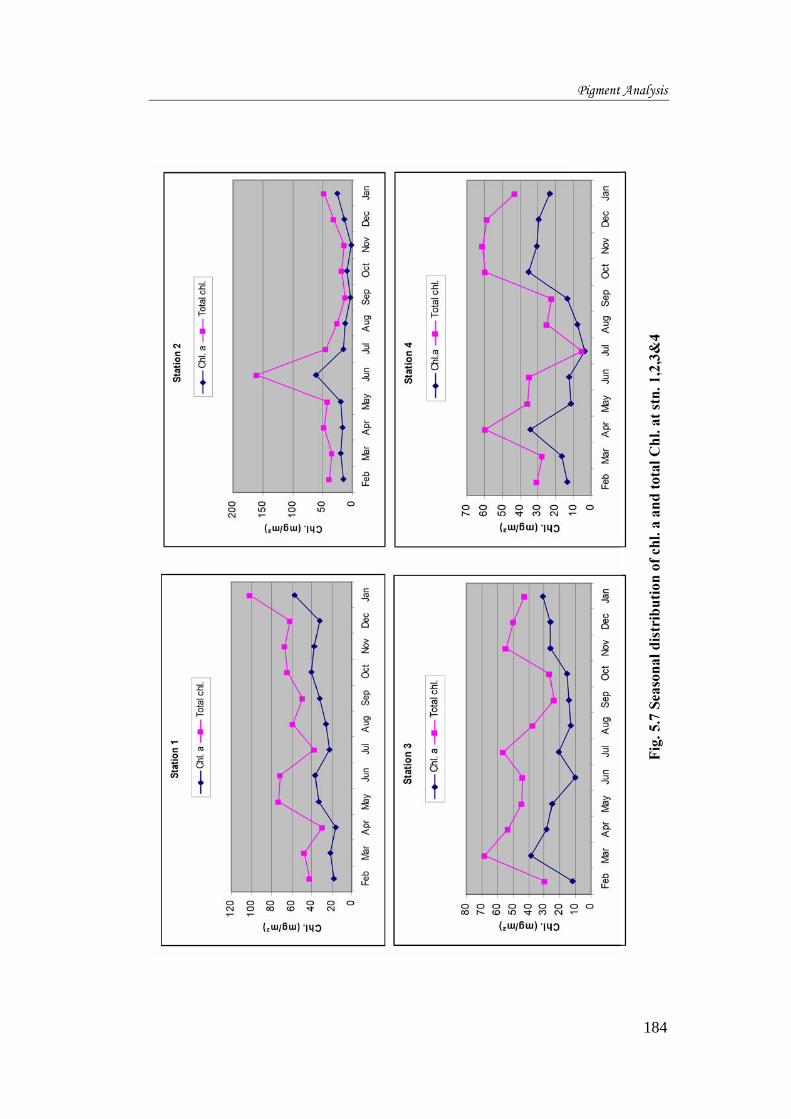
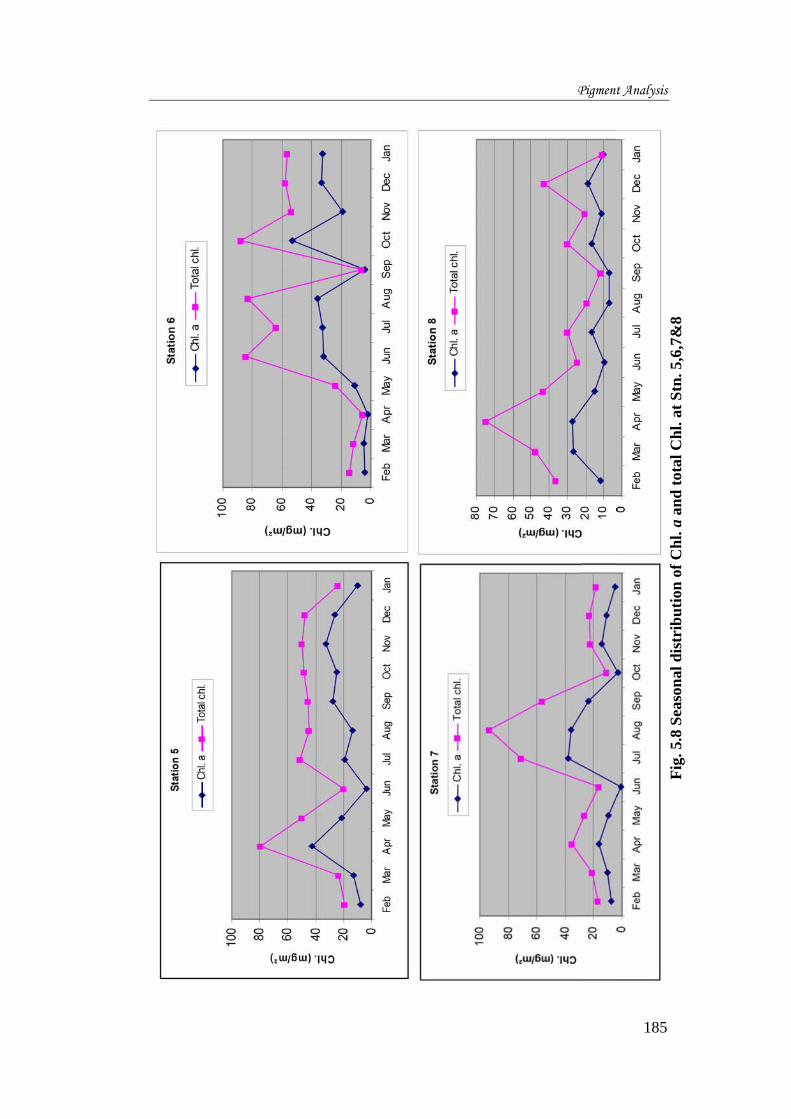
5.3.4 Total Chlorophyll
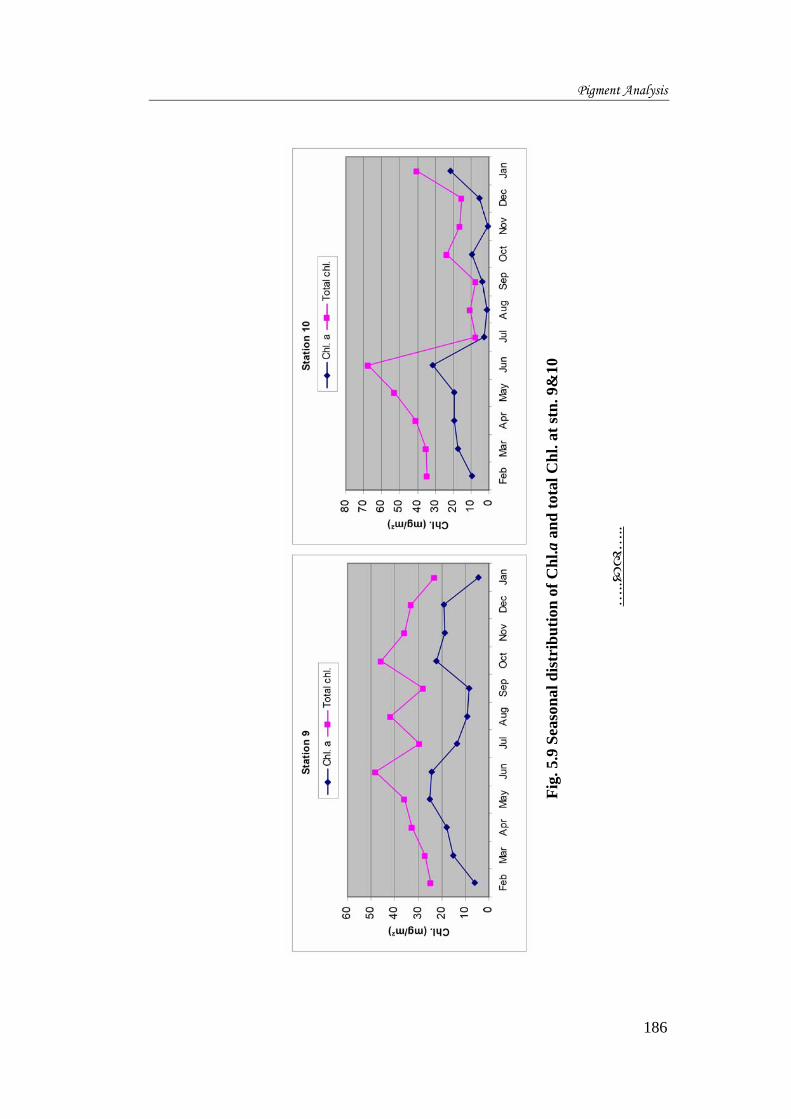
The monthly mean values of total chlorophyll (a+b+c) at different
stations are given in Table 5.4. The distribution was similar to that of
chlorophyll a, both being maximum in June and minimum during
Pigment Analysis
170
September in most stations (Fig 5.7 -5.9). Annual mean value of total
chlorophyll was 40.130 mg m-2 with pre-monsoon, monsoon and post-
monsoon 37.781, 41.677 and 40.922 mg m-2 respectively (Fig. 5.4). The
concentration of the chlorophyll can be taken as an index of the floral
composition (Gopinathan et al. 1984). The study area showed an annual
average of 18.79 ±12.129 mg m-2 of chlorophyll a and 40.162 ± 23.220 mg
m-2 total chlorophyll during the study period which indicated the presence of
fairly good quantity periphyton standing crop through out the year. Chl. b
and Chl. c are characteristic of green algae and diatoms respectively (Wetzel
2001). O’Reilly (2006) has reported the periphytic total chlorophyll in a
tropical lake, Zambia as 26 mg m-2 at a depth of 16 m.
Total chlorophyll
0.00010.00020.00030.00040.00050.00060.00070.00080.000
1 2 3 4 5 6 7 8 9 10Stations
mg/
m2 Pre-mon
MonsoonPst-Mon
Fig. 5.4
The comparative high values of total chlorophyll showed that the
prominent periphytic flora of the backwater comprised mainly with
Pigment Analysis
171
diatoms. This is evident from the floral composition of the study area
(Table 3.1). Diatoms formed 75.50 % where as blue green algae and green
algae comprised 13.87 % and 9.79 % of total periphytic algae respectively.
Thus the pigment compositions agree well with the composition of
periphytic flora of the backwaters.
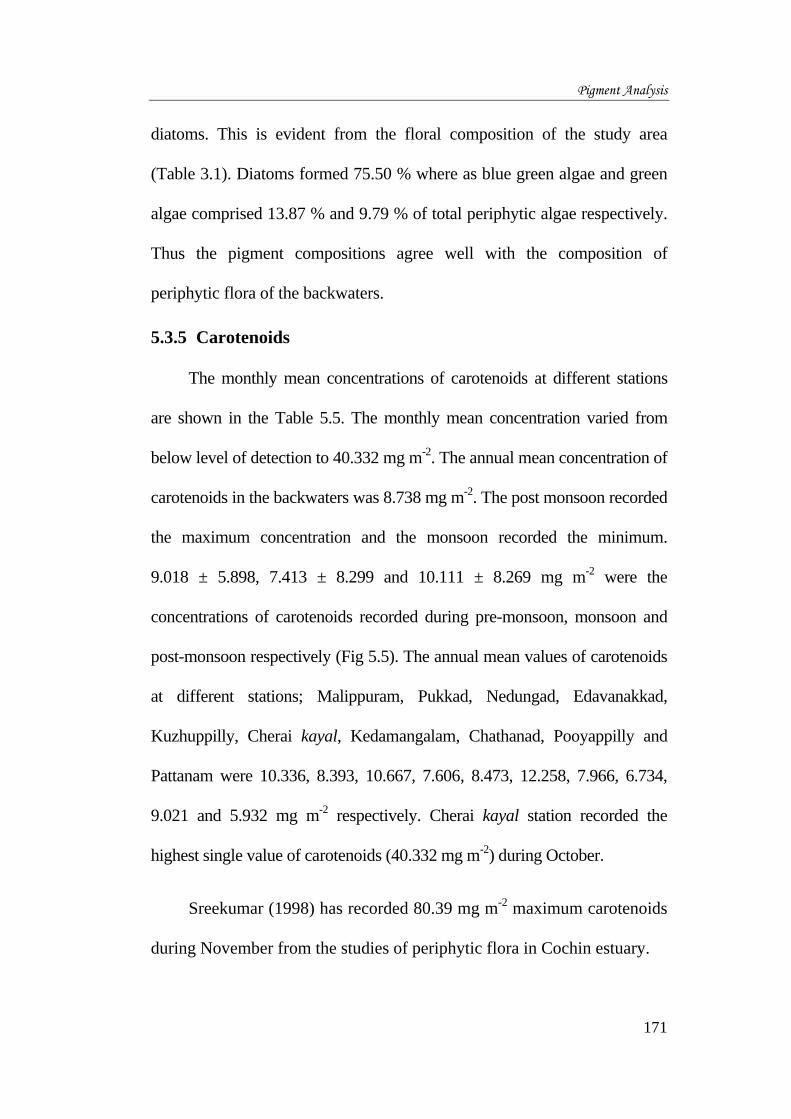
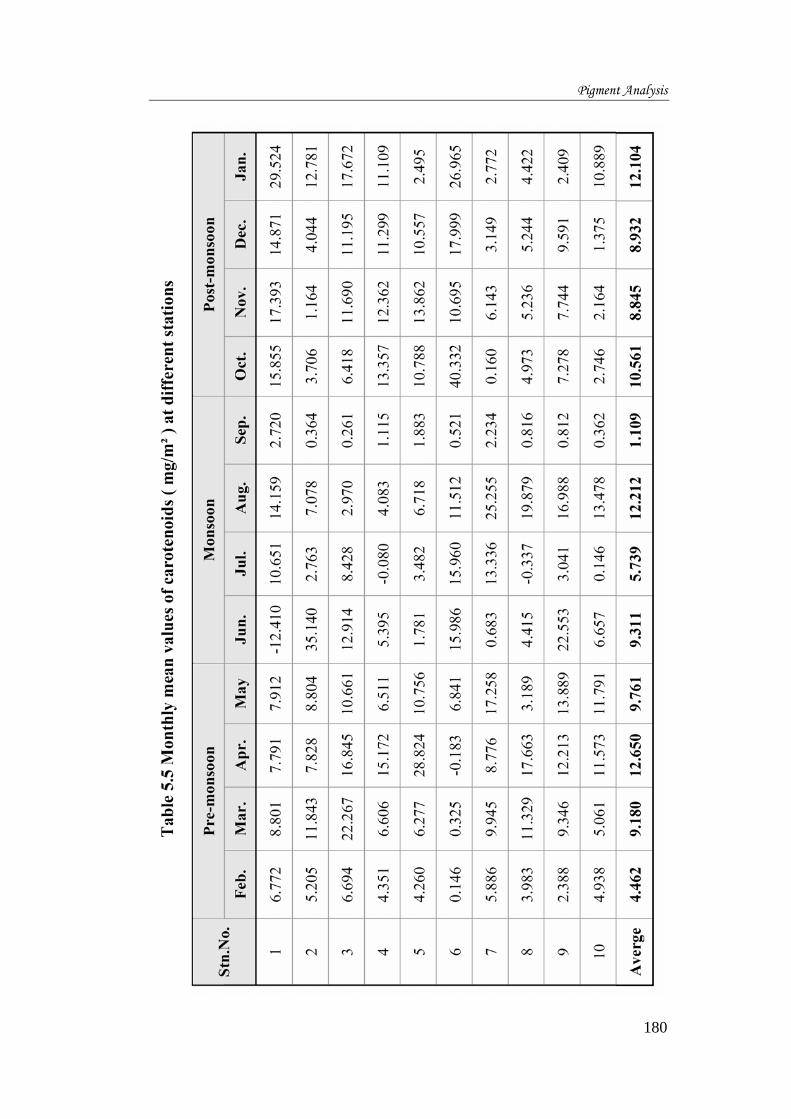
5.3.5 Carotenoids
The monthly mean concentrations of carotenoids at different stations
are shown in the Table 5.5. The monthly mean concentration varied from
below level of detection to 40.332 mg m-2. The annual mean concentration of
carotenoids in the backwaters was 8.738 mg m-2. The post monsoon recorded
the maximum concentration and the monsoon recorded the minimum.
9.018 ± 5.898, 7.413 ± 8.299 and 10.111 ± 8.269 mg m-2 were the
concentrations of carotenoids recorded during pre-monsoon, monsoon and
post-monsoon respectively (Fig 5.5). The annual mean values of carotenoids
at different stations; Malippuram, Pukkad, Nedungad, Edavanakkad,
Kuzhuppilly, Cherai kayal, Kedamangalam, Chathanad, Pooyappilly and
Pattanam were 10.336, 8.393, 10.667, 7.606, 8.473, 12.258, 7.966, 6.734,
9.021 and 5.932 mg m-2 respectively. Cherai kayal station recorded the
highest single value of carotenoids (40.332 mg m-2) during October.
Sreekumar (1998) has recorded 80.39 mg m-2 maximum carotenoids
during November from the studies of periphytic flora in Cochin estuary.
Pigment Analysis
172
Sivadasan and Joseph (1995) had reported the annual mean benthic
concentration of carotenoids as 33.07 mg m-2 and ranged from 19.31 to
48.85 mg m-2.
Fig. 5.5
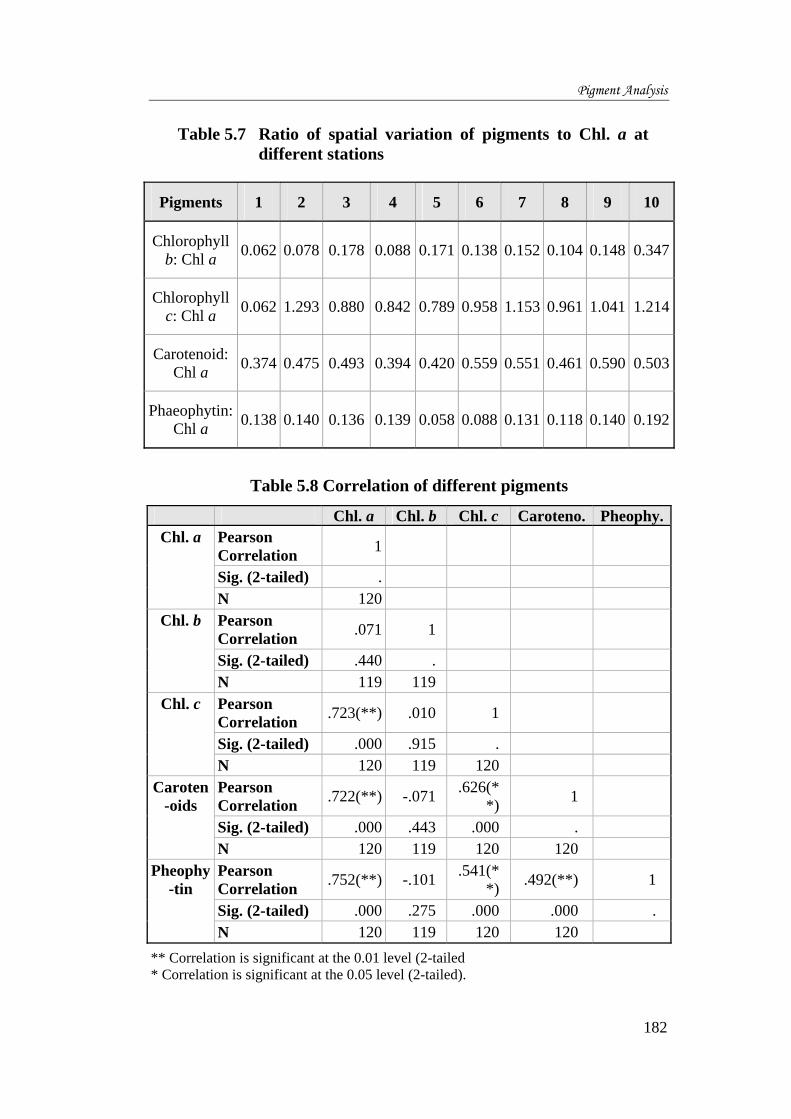
The ratios of carotenoids: Chl. a at all the stations were < 1 (Table 5.7).
The ratios <1 indicated the physiologically active state of periphytic flora
in the backwaters. The lower ratios of carotenoids to Chl.a indicate the
active state of benthic microflora (Sivadasan and Joseph 1995).
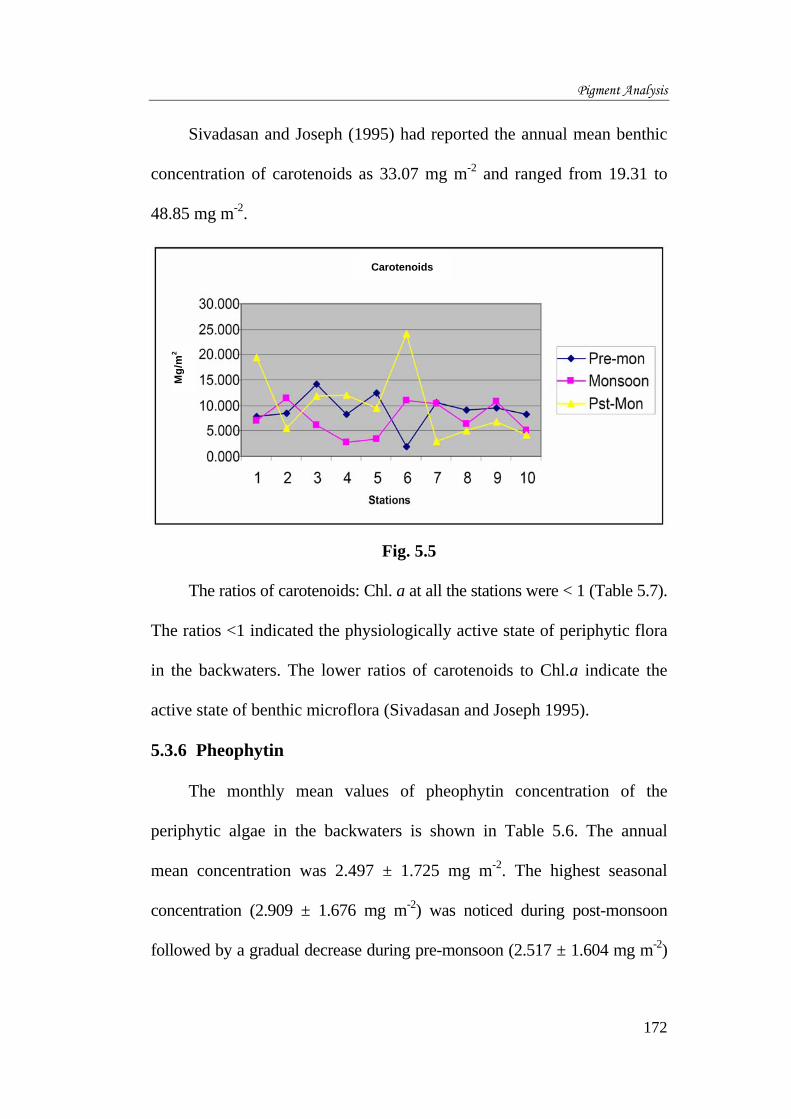
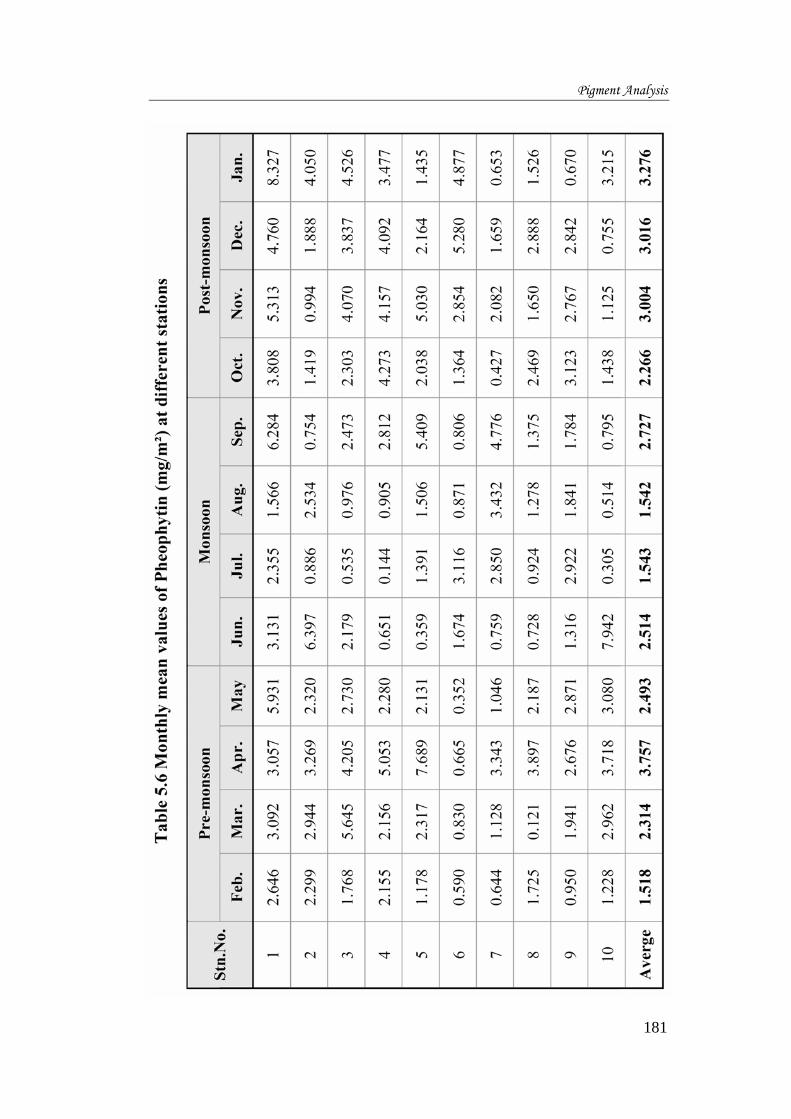
5.3.6 Pheophytin
The monthly mean values of pheophytin concentration of the
periphytic algae in the backwaters is shown in Table 5.6. The annual
mean concentration was 2.497 ± 1.725 mg m-2. The highest seasonal
concentration (2.909 ± 1.676 mg m-2) was noticed during post-monsoon
followed by a gradual decrease during pre-monsoon (2.517 ± 1.604 mg m-2)
Mg/
m2
Carotenoids
Pigment Analysis
173
and the lowest (2.082 ± 1.829 mg m-2) during monsoon (fig.5.6) The highest
concentration of pheophytin (8.327 mg m-2) was recorded from station 1
during January and the lowest at station 8 (0.121 mg m-2) during March.
The ratio of pheophytin to Chl. a (Table 5.7) varied from 0.129 to
0.145 with 0.133, 0.145 and 0.129 for pre-monsoon, monsoon and post-
monsoon respectively.
Sreekumar (1998) had reported a higher concentration of periphytic
pheophytin in Cochin estuary with the highest concentration 16.04 mg/m²
during monsoon and the lowest 8.78 mg/m² during post-monsoon.
Pheophytin
0.000
1.000
2.000
3.000
4.000
5.000
6.000
1 2 3 4 5 6 7 8 9 10Stations
mg/
m2 Pre-mon
MonsoonPst-Mon
Fig. 5.6
Sanilkumar (2009) had reported the highest benthic pheophytin as
13.03µg L-1 during post-monsoon in some stations in Cochin estuary.
Pigment Analysis
174
5.3.7 Pheophytin : chlorophyll ratio
The ratio of pheophytin to Chl. a concentration gives a general
indication of the physiological or grazing state of microalgal community.
High ratio (Range; 0.5 to 1) indicates a stressed or declined community,
while low rates (Range; 0 to 0.5) represent actively growing community
relatively free of grazing pressure (Bidigare et al. 1986; Light and Beardall
1998; Mundree et al. 2003). The monthly ratio of pheophytin to Chl. a in this
study ranged from 0.088 to 0.192 (Table 5.7). Thus the ratio suggests that a
physiologically healthy periphytic community was present in the study area.
The correlation analysis of pigments (Table 5.8) revealed that all of
them have significant correlation with each other except Chl.b (p< 0.01).
The strongest positive correlation (0.723) was noticed between Chl. a and
Chl. c. This is an indication of the predominance of periphytic diatoms in
this area. ANOVA of the spatial and temporal distribution of pigments
were also analysed (Table 5.9). There was no significant spatial and
temporal variation in the distribution of various pigments.
5.4 Summary
The quantitative determination of the pigments was done using
periphyton growth on glass slides. The annual mean concentration of
chlorophyll a in pokkali and prawn fields of N. Paravoor and Vypeen
Island was 18.794 ± 12.129 mg m-2. The post monsoon recorded the
Pigment Analysis
175
highest seasonal average, 21.333 mg m-2. The concentrations of
chlorophyll a reported were comparatively lower than recorded in Cochin
estuary (Sreekumar 1998; Sivadasan and Joseph 1995). This is due to the
hetrotrophic attached assemblage.
The annual mean value of chlorophyll b was 2.534 mg m-2. The
monsoon season recorded the maximum chlorophyll b concentration,
5.669 mg m-2. The concentration of Chl. b is directly proportional to the
biomass of Chlorophyceae and Euglenineae as only these algae possess
Chl. b. Comparatively high concentration of Chl. b during monsoon was
due to the high growth of Chlorophyceae and Euglenineae.
The annual mean value of chlorophyll c concentration was
18.953 mg m-2. Pre-monsoon recorded higher concentration. The values of
pigment concentrations agree to the floral composition described in
chapter 3. The annual mean value of total chlorophyll was 40.126 mg m-2
and the monsoon recorded the maximum value.
8.847 ± 7.591 mg m-2 was the annual mean concentration of
carotenoids recorded. Post-monsoon recoded the maximum value i.e.
10.111 mg m-2. The ratio of various pigments to Chl. a was less than 1.
The annual mean concentration of pheophytin was 2.503 ± 1.725 mg m-2.
The highest concentration was noticed during post-monsoon followed by
a gradual decrease during pre-monsoon and the lowest during monsoon.
Pigment Analysis
176
Pigment Analysis
177
Pigment Analysis
178
Pigment Analysis
179
Pigment Analysis
180
Pigment Analysis
181
Pigment Analysis
182
Table 5.7 Ratio of spatial variation of pigments to Chl. a at different stations
Pigments 1 2 3 4 5 6 7 8 9 10
Chlorophyll b: Chl a 0.062 0.078 0.178 0.088 0.171 0.138 0.152 0.104 0.148 0.347
Chlorophyll c: Chl a 0.062 1.293 0.880 0.842 0.789 0.958 1.153 0.961 1.041 1.214
Carotenoid: Chl a 0.374 0.475 0.493 0.394 0.420 0.559 0.551 0.461 0.590 0.503
Phaeophytin: Chl a 0.138 0.140 0.136 0.139 0.058 0.088 0.131 0.118 0.140 0.192
Table 5.8 Correlation of different pigments
Chl. a Chl. b Chl. c Caroteno. Pheophy.Pearson Correlation 1
Sig. (2-tailed) .
Chl. a
N 120 Pearson Correlation .071 1
Sig. (2-tailed) .440 .
Chl. b
N 119 119 Pearson Correlation .723(**) .010 1
Sig. (2-tailed) .000 .915 .
Chl. c
N 120 119 120 Pearson Correlation .722(**) -.071 .626(*
*) 1
Sig. (2-tailed) .000 .443 .000 .
Caroten-oids
N 120 119 120 120 Pearson Correlation .752(**) -.101 .541(*
*) .492(**) 1
Sig. (2-tailed) .000 .275 .000 .000 .
Pheophy-tin
N 120 119 120 120 ** Correlation is significant at the 0.01 level (2-tailed * Correlation is significant at the 0.05 level (2-tailed).
Pigment Analysis
183
Table 5.9 ANOVA of temporal and spatial variations of Chl. a, Chl, b, Chl. c, Total Chl., Carotenoides and Pheophytin
Chl. a Chl. b Chl. c Caroteno. Pheophy.
Between Groups 387.842 2 193.921 1.325 .270
Within Groups 17119.184 117 146.318
Chlorophyll_a
Total 17507.026 119
Between Groups 589.850 2 294.925 26.230 .000
Within Groups 1315.539 117 11.244
Chlorophyll b
Total 1905.389 119
Between Groups 13.383 2 6.692 .045 .956
Within Groups 17392.603 117 148.655
Chlorophyll c
Total 17405.986 119
Between Groups 341.427 2 170.713 .313 .732
Within Groups 63821.378 117 545.482
Total Chlorophyll
Total 64162.805 119
Between Groups 147.255 2 73.628 1.284 .281
Within Groups 6709.483 117 57.346
Carotenoids
Total 6856.739 119
Between Groups 13.724 2 6.862 2.358 .099
Within Groups 340.523 117 2.910
Pheophytin
Total 354.246 119
Pigment Analysis
184
Pigment Analysis
185
Fig.
5.8
Sea
sona
l dis
trib
utio
n of
Chl
. a a
nd to
tal C
hl. a
t Stn
. 5,6
,7&
8
Pigment Analysis
186
…..
…..
Fig.
5.9
Sea
sona
l dis
trib
utio
n of
Chl
.a a
nd to
tal C
hl. a
t stn
. 9&
10


![[DIRECTION MATTERS]dost mohammad etc. aura & co. versus the state of jharkhand i.a. no. 13252/2020- application for amendment in cause title ia no. 13252/2020 - amendment in cause](https://img.pdfslide.us/doc/110x75/5e98716328dbe2753d4c14e6/direction-matters-dost-mohammad-etc-aura-co-versus-the-state-of-jharkhand.jpg)