Embed Size (px)
Citation preview
Initial Molecular Characterization of Planarian Pigment Cells, a New Model for Studying Lineage Specification and
Gut Excretion
by
Xinwen He
A thesis submitted in conformity with the requirements for the degree of Master of Science
Department of Molecular Genetics University of Toronto
© Copyright by Xinwen He 2016
ii
Initial Molecular Characterization of Planarian Pigment Cells, a
New Model for Studying Lineage Specification and Gut Excretion
Xinwen He
Master of Science
Department of Molecular Genetics
University of Toronto
2016
Abstract
ASCs play crucial roles in tissue homeostasis and regeneration. Here, I established pigment cells
in Schmidtea mediterranea as a novel model to study ASC lineage specification by identification
of hmbs and alas as makers for pigment cells, and ans as a marker for their progenitors. Co-
expression analysis between hmbs and tryptophan metabolism enzyme, kmo, suggests
ommochrome as one of the responsible pigments for planarian body pigmentation. Initial
characterization of this lineage reveals an fst homolog as a negative regulator of pigment cell
regeneration and proliferation. Functional studies of light-induced depigmentation also uncover
homologs of draper and epimerase as positive regulators of gut excretion mediated pigment cell
removal. Together, these findings in pigment cell lineage and gut excretion pave ways to future
studies of ASC regulations.

iii
Acknowledgments
Life is about passing down messages. Primitive organisms pass down their messages in
the form of genetic materials. We human beings pass down our messages to our future
generations, not only with our genetic materials, but also in the forms of knowledge and
experiences. This thesis presented here is a recording of the knowledge and experiences I
gathered through my shallow studies in planarians, through the guidance from my supervisor,
and through working and living with my colleagues, families, and friends.
First and foremost, I would like to thank my supervisor Dr. Bret Pearson for his
continued support and guidance through my scientific endeavors. Using his own knowledge and
experiences, he showed me how to design and perform experiments, and how to think critically
and scientifically. More importantly, he is a great role model that inspires me on the meanings of
my career and personal life. It is my privilege to work with him, to do science together, and to
make discoveries that will benefit our society and the future generations. I would also like to
thank my supervisory committee, Dr. Marc Meneghini, and Dr. Nadeem Moghal, as well as my
collaborator, Dr. Jason Pellettieri. I have benefited greatly with their scientific expertise in their
fields and their different perspectives on the project. I am grateful to all past and present
members of the Pearson Lab. My work is only possible because of their optimization of
techniques, their advice on scientific problems, and the enjoyable lab environment they created.
I am sincerely thankful for my parents and grandparents. Their constant support since my
childhood has accompanied me to travel around the globe. I can never forget the encyclopedias
they bought me when I was little, which opened the doors for me to the magnificent world of
science. I am extremely lucky to have such a great family and have the resources and support for
me to freely develop my career and become the person I want to be. I would also like to thank
my girlfriend, Kelly. She is the best friend that I have ever had in my life. For over eight years,
her constant motivation, support, and love are the key to helping me staying focused on my
studies.
Last but not least, I thank all the planarians that have sacrificed for this study. Their lives
perished with a meaning. And I hope the messages of the knowledge generated can be passed on.
iv
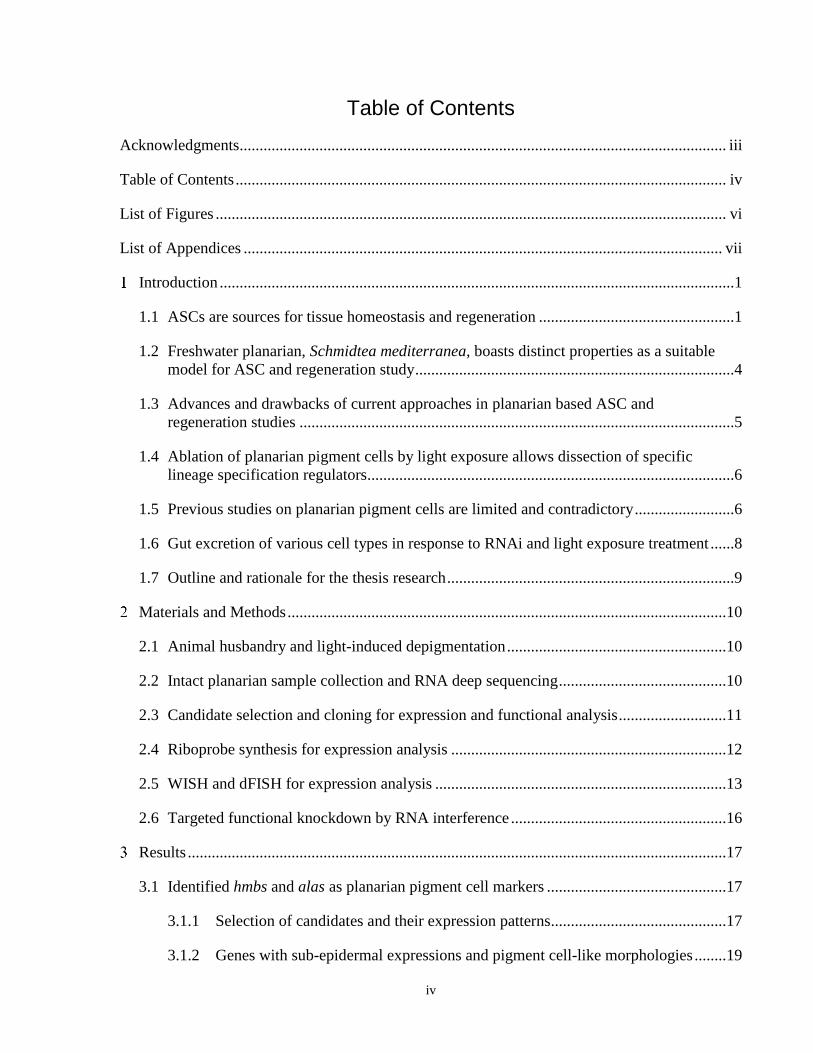
Table of Contents
Acknowledgments.......................................................................................................................... iii
Table of Contents ........................................................................................................................... iv
List of Figures ................................................................................................................................ vi
List of Appendices ........................................................................................................................ vii
Introduction .................................................................................................................................1
1.1 ASCs are sources for tissue homeostasis and regeneration .................................................1
1.2 Freshwater planarian, Schmidtea mediterranea, boasts distinct properties as a suitable
model for ASC and regeneration study ................................................................................4
1.3 Advances and drawbacks of current approaches in planarian based ASC and
regeneration studies .............................................................................................................5
1.4 Ablation of planarian pigment cells by light exposure allows dissection of specific
lineage specification regulators ............................................................................................6
1.5 Previous studies on planarian pigment cells are limited and contradictory .........................6
1.6 Gut excretion of various cell types in response to RNAi and light exposure treatment ......8
1.7 Outline and rationale for the thesis research ........................................................................9
Materials and Methods ..............................................................................................................10
2.1 Animal husbandry and light-induced depigmentation .......................................................10
2.2 Intact planarian sample collection and RNA deep sequencing ..........................................10
2.3 Candidate selection and cloning for expression and functional analysis ...........................11
2.4 Riboprobe synthesis for expression analysis .....................................................................12
2.5 WISH and dFISH for expression analysis .........................................................................13
2.6 Targeted functional knockdown by RNA interference ......................................................16
Results .......................................................................................................................................17
3.1 Identified hmbs and alas as planarian pigment cell markers .............................................17
3.1.1 Selection of candidates and their expression patterns............................................17
3.1.2 Genes with sub-epidermal expressions and pigment cell-like morphologies ........19
v
3.1.3 Expression of spider markers correlates to pigment status of planarian tissue ......20
3.1.4 hmbs is functionally required for pigment production and maintenance ...............22
3.1.5 hmbs is co-expressed with other spider markers and kmo .....................................23
3.1.6 Pigment cells show inward migration toward gut during depigmentation in
response to light exposure ......................................................................................26
3.1.7 Pigment cells display fast regeneration timeline during repigmentation ...............28
3.1.8 Decreasing levels of co-expression between punctate and spider markers as
repigmentation progresses .....................................................................................30
3.2 Identified regulators of depigmentation and pigment cell regeneration ............................32
3.2.1 hmbs is not required for pigment cell survival .......................................................32
3.2.2 Presence of pigment is required for light-induced pigment cell loss .....................32
3.2.3 epimerase positively regulates depigmentation in response to light .....................34
3.2.4 draper positively regulates depigmentation in response to light ...........................34
3.2.5 Disruption of draper function leads to formation of wrinkles on epidermis and
ectopic expressions of lineage markers ..................................................................36
3.2.6 follistatin negatively regulates pigment cell regeneration and homeostasis ..........37
Discussion .................................................................................................................................40
4.1 Identified markers, and established pigment cells as a novel model for ASC and
regeneration study ..............................................................................................................40
4.2 Regulation of depigmentation and pigment cell regeneration ...........................................43
4.3 Future directions ................................................................................................................46
4.3.1 Deeper analysis of pigment cell and potential progenitors ....................................46
4.3.2 Continued screening of pigment cell lineage markers and regulators ...................46
4.3.3 Further analysis of depigmentation regulators .......................................................48
4.3.4 Further analysis of pigment cell regeneration regulators .......................................48
4.3.5 Comparative transcriptomics for identification of gut excretion regulators ..........49
References ......................................................................................................................................50
Appendices .....................................................................................................................................57
vi
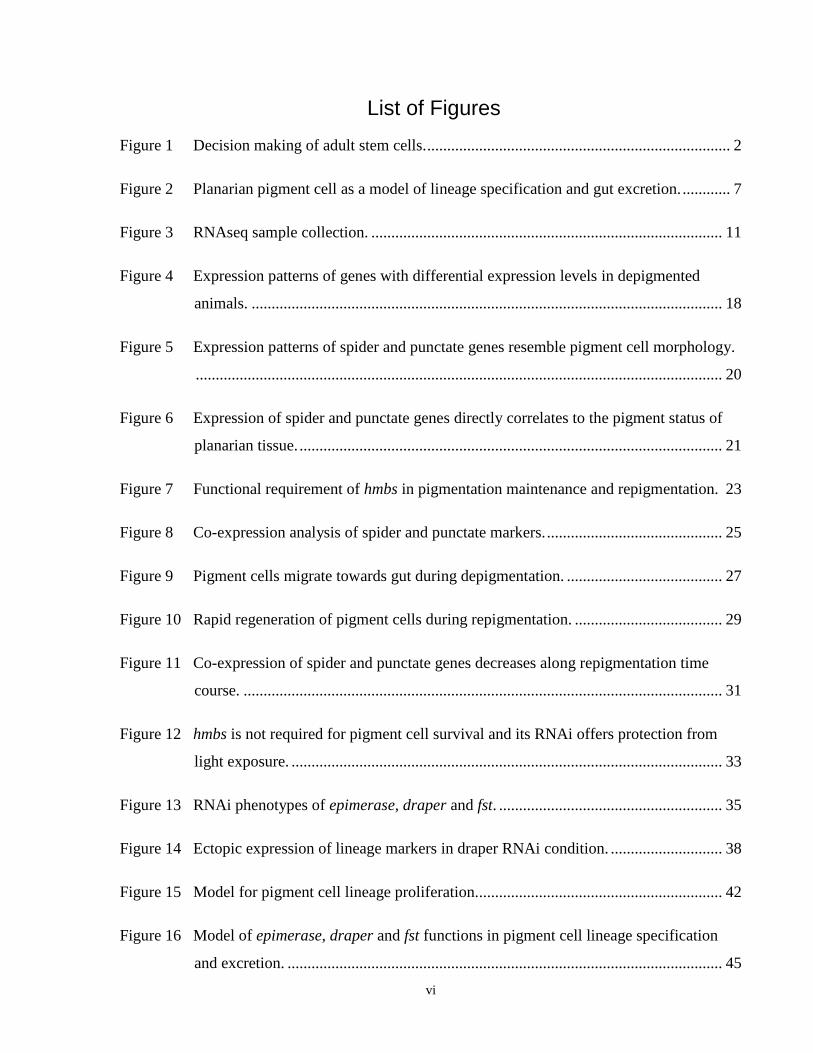
List of Figures
Figure 1 Decision making of adult stem cells. ............................................................................ 2
Figure 2 Planarian pigment cell as a model of lineage specification and gut excretion. ............ 7
Figure 3 RNAseq sample collection. ........................................................................................ 11
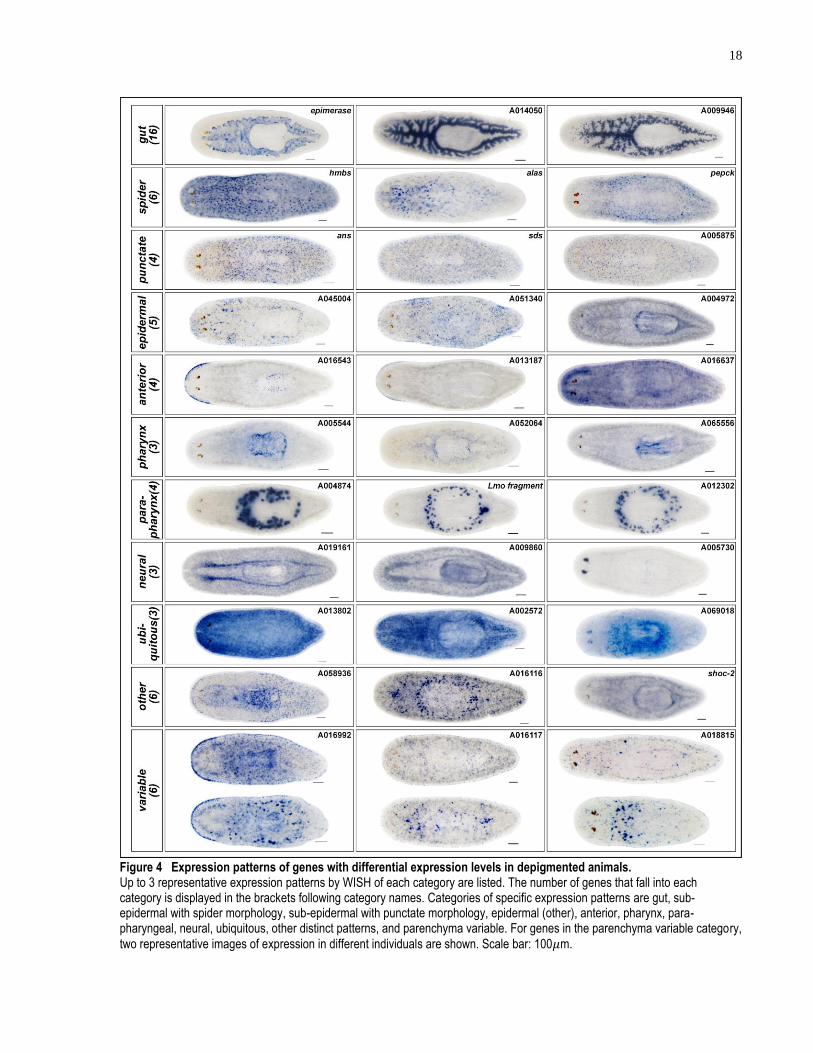
Figure 4 Expression patterns of genes with differential expression levels in depigmented
animals. ...................................................................................................................... 18
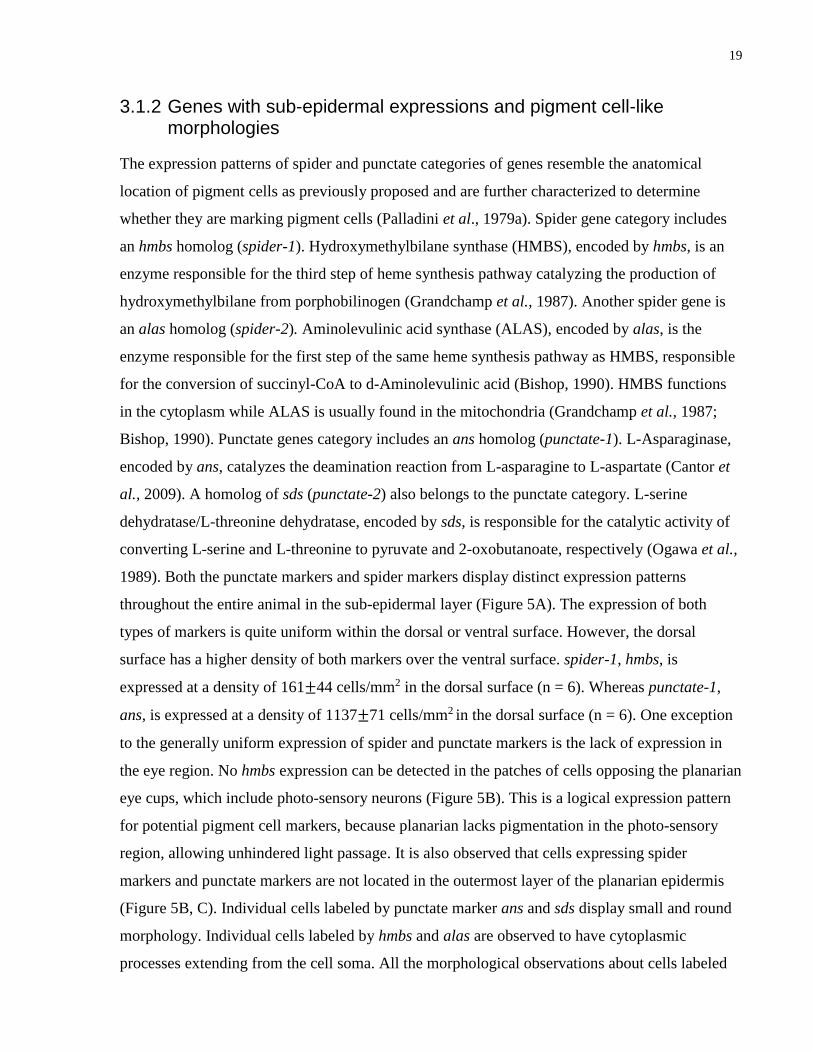
Figure 5 Expression patterns of spider and punctate genes resemble pigment cell morphology.
.................................................................................................................................... 20
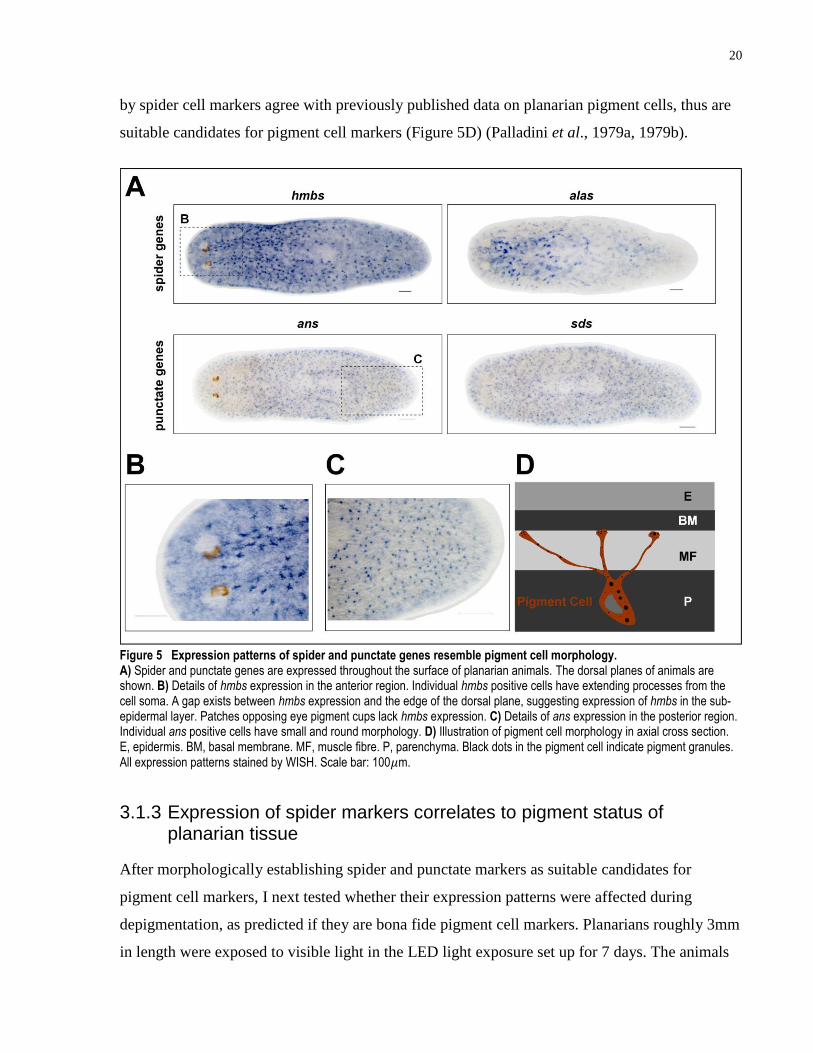
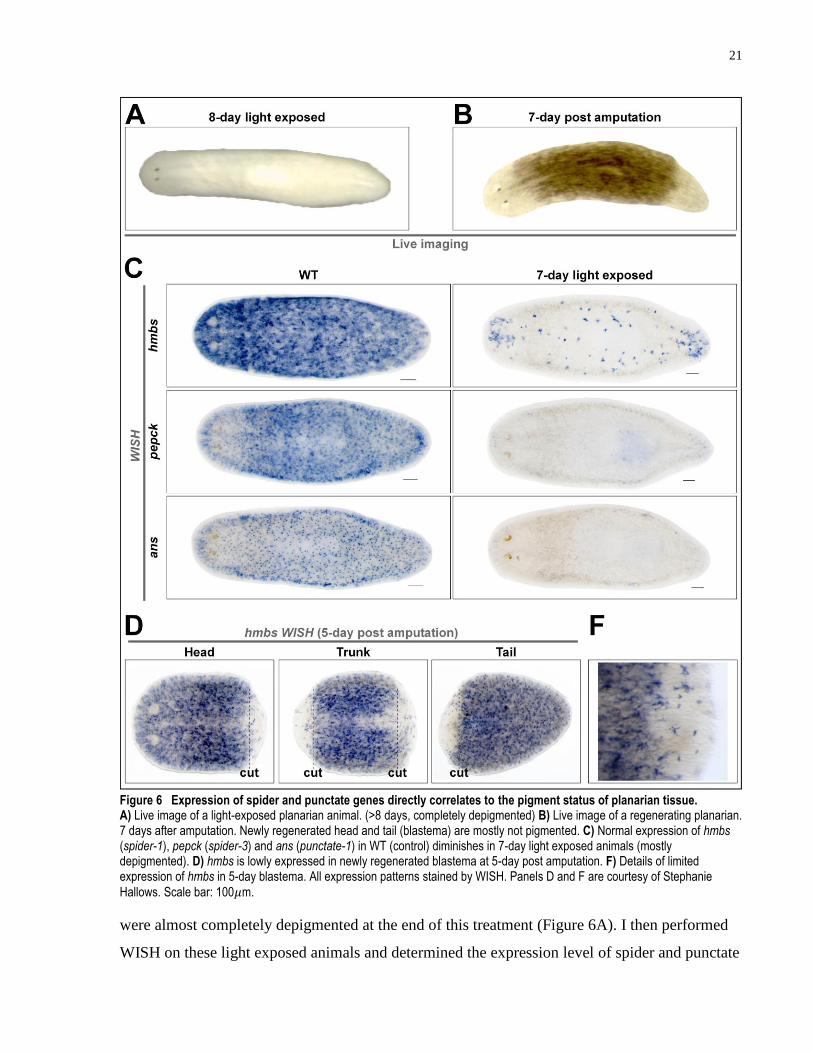
Figure 6 Expression of spider and punctate genes directly correlates to the pigment status of
planarian tissue. .......................................................................................................... 21
Figure 7 Functional requirement of hmbs in pigmentation maintenance and repigmentation. 23
Figure 8 Co-expression analysis of spider and punctate markers. ............................................ 25
Figure 9 Pigment cells migrate towards gut during depigmentation. ....................................... 27
Figure 10 Rapid regeneration of pigment cells during repigmentation. ..................................... 29
Figure 11 Co-expression of spider and punctate genes decreases along repigmentation time
course. ........................................................................................................................ 31
Figure 12 hmbs is not required for pigment cell survival and its RNAi offers protection from
light exposure. ............................................................................................................ 33
Figure 13 RNAi phenotypes of epimerase, draper and fst. ........................................................ 35
Figure 14 Ectopic expression of lineage markers in draper RNAi condition. ............................ 38
Figure 15 Model for pigment cell lineage proliferation.............................................................. 42
Figure 16 Model of epimerase, draper and fst functions in pigment cell lineage specification
and excretion. ............................................................................................................. 45

vii
List of Appendices
Appendix 1 List of in situ patterns identified but not included in the main text. ..................... 57
Appendix 2 List of genes cloned and screened in this study. ................................................... 58
Appendix 3 List of phenotypes observed during RNAi screen. ............................................... 61
1
Introduction
1.1 ASCs are sources for tissue homeostasis and regeneration
Adult stem cells (ASCs) are the ultimate source for the tissue turnover of approximately 50 – 70
billion cells per day in humans (Reed, 1999). Many mysteries lie behind the phenomenal power
of ASCs, not only can they regulate the exact type, and the exact number of differentiated cells
to replace, but also can they maintain a stable population of themselves in the long term.
Terminal selector transcription factors play key roles in determining the types of differentiated
cells. In some cases, a single terminal selector can regulate hundreds of downstream effector
genes, and its ectopic expression can even reprogram cells to adopt a different fate (Eastman et
al., 1999; Flames and Hobert, 2009; Hobert, 2011). For instance, unc-30, a C. elegans homeobox
gene, controls the expression of crucial genes, including unc-25 and unc-47, for the identity and
function of GABAergic neurons (Eastman et al., 1999). And the ectopic expression of unc-30 is
capable of driving wild-type unc-25 and unc-47 promoters in other tissue types (Eastman et al.,
1999). Despite a relatively rich knowledge of terminal selector transcription factors for the
differentiation of neuron types, understanding of such mechanisms in many other tissue types is
lacking. In addition to the determination of tissue types, what is even more poorly understood is
the regulation of the exact amount of differentiated cells to replace. The feedback control
between differentiated cells and ASCs is one interesting mechanism to be investigated, a
mechanism that could be compromised in the case of cancer development.
In order to maintain a stable population of ASCs, establishing an asymmetry between the
proliferation and differentiation is crucial (Figure 1) (Sherley, 2002; Simons and Clevers, 2011).
Such asymmetry can be achieved intrinsically, by disproportionate distribution of RNA and
protein molecules that drive different cell fates (Bossing et al., 1996; Doe, 1996, 2008; Doe and
Bowerman, 2001; Bayraktar, 2010). For example, Inscuteable, Prospero, and Numb are
asymmetrically localized to the apical cortex in neuroectodermal cells in Drosophila embryos
and physically segregated to daughter cells after neuroblast divisions (Doe, 1996). Prospero,
with a homeodomain and nuclear localization signals, then drives the differentiation and
suppresses the stem cell identity in the daughter cells (Doe, 1996; Bayraktar, 2010). Asymmetry
can also be achieved extrinsically, such as receiving different signals from the stem cell and
differentiated tissue microenvironment (Snippert et al., 2010; Sato et al., 2011). For example, the
2
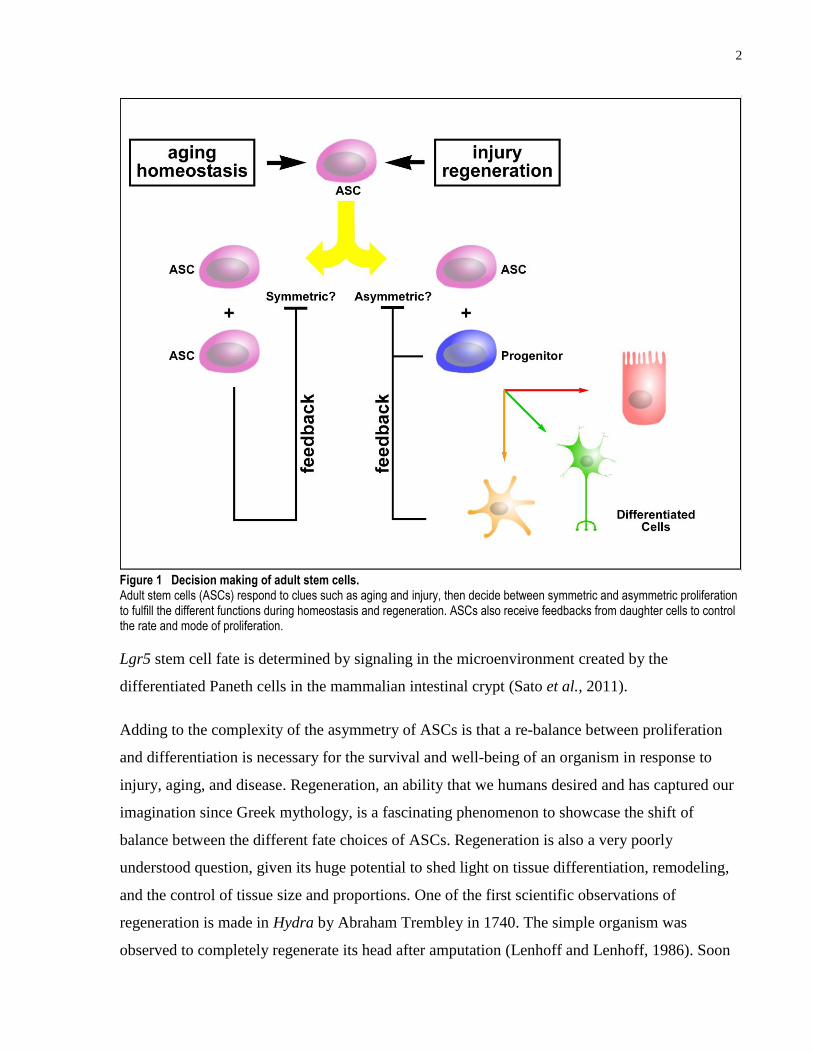
Figure 1 Decision making of adult stem cells. Adult stem cells (ASCs) respond to clues such as aging and injury, then decide between symmetric and asymmetric proliferation to fulfill the different functions during homeostasis and regeneration. ASCs also receive feedbacks from daughter cells to control the rate and mode of proliferation.
Lgr5 stem cell fate is determined by signaling in the microenvironment created by the
differentiated Paneth cells in the mammalian intestinal crypt (Sato et al., 2011).
Adding to the complexity of the asymmetry of ASCs is that a re-balance between proliferation
and differentiation is necessary for the survival and well-being of an organism in response to
injury, aging, and disease. Regeneration, an ability that we humans desired and has captured our
imagination since Greek mythology, is a fascinating phenomenon to showcase the shift of
balance between the different fate choices of ASCs. Regeneration is also a very poorly
understood question, given its huge potential to shed light on tissue differentiation, remodeling,
and the control of tissue size and proportions. One of the first scientific observations of
regeneration is made in Hydra by Abraham Trembley in 1740. The simple organism was
observed to completely regenerate its head after amputation (Lenhoff and Lenhoff, 1986). Soon
3
after, discoveries of regeneration in more and more complicated organisms were made, including
planarians, amphibian tadpoles, and salamanders (Pallas, 1766; Spallanzani, 1769; Sánchez
Alvarado A, 2000). And more than 200 years later since Trembley’s initial discovery, the
regeneration ability of human liver was noticed (Widmann and Fahimi, 1975). Many different
types of regeneration exist and can be categorized into two categories based on their requirement
of blastema formation. The blastema is a mass of morphologically undifferentiated cells formed
at the end of the stump during regeneration, similar in form and function to the vertebrate
embryonic limb bud (Sánchez Alvarado A, 2000; Tasaki et al., 2011). For instance, human liver
regeneration requires limited proliferation of the surviving cells while bone regeneration requires
proliferation and differentiation of stem cells already present in the tissue (Michalopoulos and
DeFrances, 1997; Prockop, 1997). Both types of regeneration are non-blastema based. In
comparison, more robust regeneration programs involve blastema formation (Sánchez Alvarado
A, 2000). Examples of this type of regeneration are used by planarians, mollusks, and also by
vertebrates during limb and tail regeneration (Brøndsted, 1969; Newth, 1958; Needham, 1952;
Lange, 1920; Brockes, 1997; Iten and Bryant, 1976; Morgan, 1901). Previous studies have
established the developmental programs across the animal kingdom as a conserved mechanism
(Wolpert, 1994; De Robertis and Sasai, 1996). It has also been shown that the regeneration
program shares a lot of similarities between the tissue differentiation and proliferation control
during embryonic development (Needham, 1952). It is very likely that the regeneration program
is also a conserved mechanism and has common origins to a wide variety of regeneration
phenomena. Thus, studies of regeneration in different model animals can be cross-related.
The understanding of ASC and regeneration biology would not only allow us to gain insights to
the elegant developmental and differentiation programs of multicellular organisms but also to
better appreciate many disease states and realize the therapeutic potentials in regenerative
medicine. Despite these great implications, many areas of these subjects await further
investigations. It is of my interests in this thesis research presented here to gain more insights on
a few key steps toward a better understanding of the ASC biology and regeneration. Specifically,
by identifying and investigating the regulators of ASC asymmetric proliferation and
differentiation, regulators that determining the fate commitment during lineage specifications,
and the mechanisms mediating the feedback control between differentiated tissue and ASCs
during homeostasis and during regeneration (Figure 1).
4
1.2 Freshwater planarian, Schmidtea mediterranea, boasts distinct properties as a suitable model for ASC and regeneration study
ASCs are rare and hard to access in almost all model organisms, making in vivo studies of ASC
biology extremely difficult. Common model organisms, including Drosophila melanogaster,
Caenorhabditis elegans, Mus musculus, lack robust regeneration events to be studied. While
animals traditionally used to study regeneration, including axolotls and salamanders, are
extremely refractory to genetic and molecular manipulations (Sánchez Alvarado A, 2000). In
comparison, the freshwater planarian, Schmidtea mediterranea, hosts a large and accessible
population of ASCs (neoblasts), representing 10-20% of their cells, has robust regeneration
programs, and recent advances in molecular biology techniques in these animals really made
them an ideal model for ASC and regeneration studies (Morgan, 1901; Krichinskaya and
Martynova, 1975; Hayashi et al., 2006; Wagner et al., 2011; Saló and Baguñà, 2002; Sánchez
Alvarado A. 2003, 2006; Cebrià, 2007; Rossi et al., 2008; Saló et al., 2009; Aboobaker, 2011;
Elliott and Sánchez Alvarado, 2013; Rink, 2013). S. mediterranea is a type of free-living
flatworm belonging to the Lophotrochozoan superphylum (Aguinaldo et al., 1997). Standing at
this unique phylogenetic location in relation to mammals while hosting a wide variety of
homologs of essential genes to humans, planarians are an ideal model for studies to provide us
with valuable information in the conservation and evolution of ASCs and regeneration regulators
(Labbé et al., 2012). Showcasing their large population of ASCs, planarians display amazing
regeneration capabilities, with reported regeneration into an entire functional animal from an
amputated piece of as little as 1/279th of the body mass of the original animal (Morgan, 1901).
Regeneration of an entire planarian body is extraordinary from limited ASCs in small amputation
fragments, especially when one considers the extremely complicated anatomy of the flatworm,
with a central brain and a PNS that contain all neuron types that can be found in an invertebrate
system, a muscular pharynx and a triclad gut for uptake of food and nutrient intake involving
phagocytosis, and a primitive excretory system protonephridia (Cebrià, 2007; Cebrià et al., 2002;
Reddien and Sánchez Alvarado, 2004; Forsthoefel et al., 2011; Scimone et al., 2011). In addition
to the robust regeneration, planarians are also able to replace their aging tissue with a fast
turnover rate leading to an immortal lifestyle (Eisenhoffer et al., 2008; Pellettieri and Sánchez
Alvarado, 2007). How planarians balance their regeneration/immortality without tumor
development is an interesting question as well (Pearson and Sánchez Alvarado, 2008). Finally, S.
5
mediterranea is a constitutive adult, thus allowing a number of gene functions to be investigated
that may be required during embryonic development in other model organisms (Newmark and
Sánchez Alvarado, 2002). Combining all the above attributes, planarians are an ideal model for
studying the molecular mechanisms underlying regeneration, and ASC proliferation and
differentiation.
1.3 Advances and drawbacks of current approaches in planarian based ASC and regeneration studies
Research in S. mediterranea has greatly expanded in the past decade as a result of the increasing
availability of molecular and genetic tools. Available techniques include whole-mount in situ
hybridization (WISH) to investigate gene expression patterns and double fluorescent WISH
(dFISH) to perform co-localization study on gene products (Pearson et al., 2009). Planarians are
also amenable to gene function study by RNA interference (RNAi), where double strand RNA
(dsRNA)-expressing bacteria are fed to the animals and subsequently spreads to all tissue types
(Sánchez Alvarado and Newmark, 1999). The S. mediterranea genome has been sequenced and
five transcriptomes of this species have been generated (Robb et al., 2008; Robb et al., 2015;
Labbé et al., 2012; Zhu et al., 2015; Solana et al., 2012). These sequencing datasets made
possible to perform a number of comparative transcriptomic studies to dissect the involvement of
different genes under different conditions. All differentiated planarian tissue are post-mitotic and
the ASCs are the only dividing cells in the animal, allowing researchers to use gamma irradiation
to specifically ablate all ASC population (Eisenhoffer et al., 2008). A number of studies have
been published using this technique to analyze the gene expression in ASCs versus differentiated
tissue (Eisenhoffer et al., 2008; Zhu et al., 2015; Reddien et al., 2005). Another technique is to
induce planarian regeneration, most commonly by amputation, to observe changes in gene
expression in wound response. A number of studies were able to identify regulators of ASC
proliferation and migration, and of program cell death during tissue remodeling (Kao et al.,
2013; Pellettieri et al., 2010; Gaviño et al., 2013; Currie and Pearson, 2013). The amputation
method, however, causes loss of multiple tissue types, making it difficult to dissect the
involvement of regulators in individual lineage specification. Methods that allow identification
for ASC regulators following a specific cell type loss, without inducing physical injuries, are
urgently needed.
6
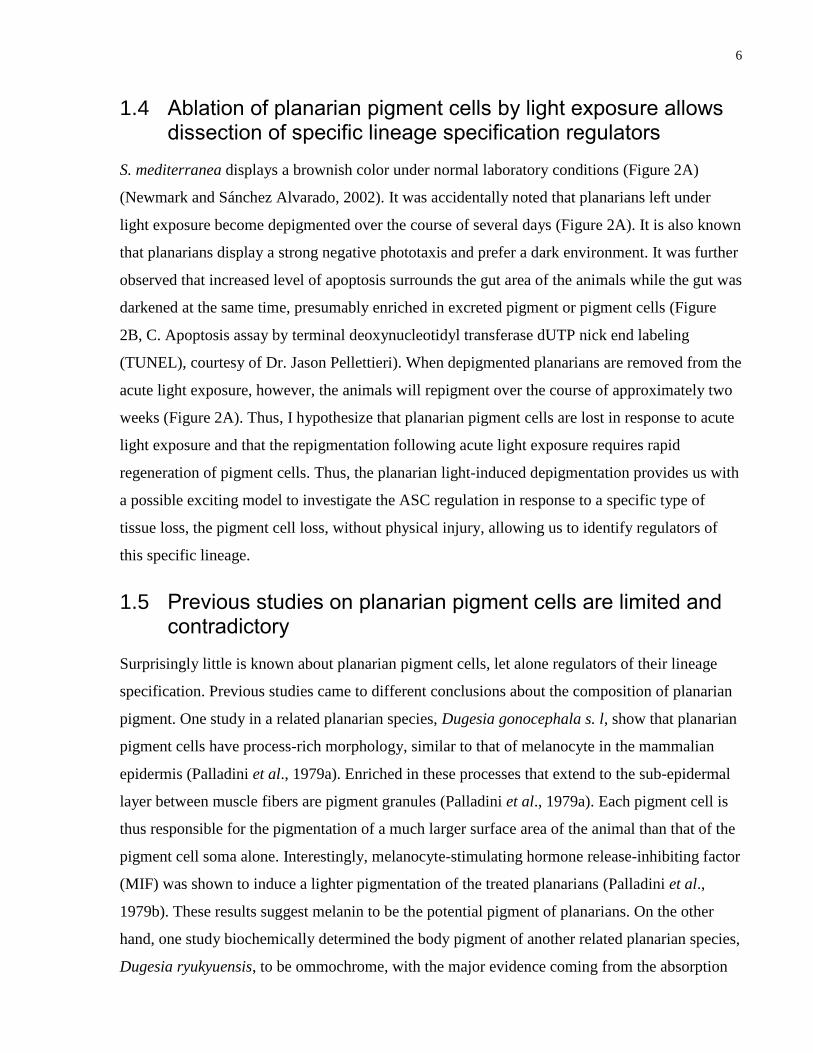
1.4 Ablation of planarian pigment cells by light exposure allows dissection of specific lineage specification regulators
S. mediterranea displays a brownish color under normal laboratory conditions (Figure 2A)
(Newmark and Sánchez Alvarado, 2002). It was accidentally noted that planarians left under
light exposure become depigmented over the course of several days (Figure 2A). It is also known
that planarians display a strong negative phototaxis and prefer a dark environment. It was further
observed that increased level of apoptosis surrounds the gut area of the animals while the gut was
darkened at the same time, presumably enriched in excreted pigment or pigment cells (Figure
2B, C. Apoptosis assay by terminal deoxynucleotidyl transferase dUTP nick end labeling
(TUNEL), courtesy of Dr. Jason Pellettieri). When depigmented planarians are removed from the
acute light exposure, however, the animals will repigment over the course of approximately two
weeks (Figure 2A). Thus, I hypothesize that planarian pigment cells are lost in response to acute
light exposure and that the repigmentation following acute light exposure requires rapid
regeneration of pigment cells. Thus, the planarian light-induced depigmentation provides us with
a possible exciting model to investigate the ASC regulation in response to a specific type of
tissue loss, the pigment cell loss, without physical injury, allowing us to identify regulators of
this specific lineage.
1.5 Previous studies on planarian pigment cells are limited and contradictory
Surprisingly little is known about planarian pigment cells, let alone regulators of their lineage
specification. Previous studies came to different conclusions about the composition of planarian
pigment. One study in a related planarian species, Dugesia gonocephala s. l, show that planarian
pigment cells have process-rich morphology, similar to that of melanocyte in the mammalian
epidermis (Palladini et al., 1979a). Enriched in these processes that extend to the sub-epidermal
layer between muscle fibers are pigment granules (Palladini et al., 1979a). Each pigment cell is
thus responsible for the pigmentation of a much larger surface area of the animal than that of the
pigment cell soma alone. Interestingly, melanocyte-stimulating hormone release-inhibiting factor
(MIF) was shown to induce a lighter pigmentation of the treated planarians (Palladini et al.,
1979b). These results suggest melanin to be the potential pigment of planarians. On the other
hand, one study biochemically determined the body pigment of another related planarian species,
Dugesia ryukyuensis, to be ommochrome, with the major evidence coming from the absorption
7
Figure 2 Planarian pigment cell as a model of lineage specification and gut excretion. A) Planarians under normal laboratory conditions exhibit a brownish body pigmentation. After ~10 days of light exposure, planarians are depigmented. The body pigmentation recovers in ~2 weeks following removal of light exposure. B) Planarian gut darkens during depigmentation (lower left) and an increased level of apoptosis was detected by TUNEL (upper right). The increased level of TUNEL staining is associated with the darkened gut (upper left). C) Details of TUNEL stains overlapping with darkened gut. D) Outline of major goals for the thesis study. 1. Establishing molecular markers for planarian pigment cells and their progenitors. 2. Identifying regulators of pigment cell differentiation, regeneration and gut excretion. (Live imaging and TUNEL stain images (Panel B and C) courtesy of Dr. Jason Pellettieri.)
8
maxima of the extracted body pigment at 256nm, 367nm, and 463nm, characteristic of
ommochromes (Hase et al., 2006). We know from studies of pigment in other organisms that
melanin and ommochromes are derivatives of tyrosine and tryptophan metabolism, respectively
(Ando et al., 2007; Croucher et al., 2013). It is of my interest to investigate perturbation in which
of the two amino acid metabolism pathways would affect planarian pigmentation.
1.6 Gut excretion of various cell types in response to RNAi and light exposure treatment
Planarians are acoelomates without body cavities, neither do they have specialized circulatory or
respiratory systems (Carranza et al., 1997). These attributes limit planarians to adopt a flattened
body shape for diffusion of oxygen and nutrients. Their triclad gut, although having only one
opening for both ingestion and egestion, is one of the few specialized organs that cover the entire
length and width of the animals (Forsthoefel et al., 2011). One would speculate if planarian gut
plays important roles that are fulfilled by the circulatory or lymphatic system in other animals.
Indeed, planarian gut has been noted to take part in the excretion of cells under various
conditions, a typical role played by lymphatic system in vertebrates. Under p53 RNAi condition,
planarians display an over-proliferation of stem cells, while at the same time, an ectopic
expression of cyclinB positive cells can be observed in the gut cavity of the animals (Pearson and
Sánchez Alvarado, 2010). It is unknown whether the cell excretion function of planarian gut is
one of the mechanisms used to remove detrimental cells and guard against tumor development.
In the same study, when p53 RNAi was applied to animals following amputation, head and tail
fragments, which no longer possess a pharynx and thus no opening of the gut to the external
environment, were noticed to develop tissue dysplasia (Pearson and Sánchez Alvarado, 2010).
No such tissue dysplasia was observed in the trunk fragment, however, presumably because the
gut is still open due to the presence of the pharynx on these fragments and able to remove the
detrimental cells excreted by the animal. Another event of gut excretion of cells was noticed
under mex-3 RNAi condition, which causes loss of progeny cells and eventually the failure of
tissue turnover (Zhu et al., 2015). Progeny cells marked by prog-2 in the parenchyma were
ectopically found inside the gut and eventually excreted (Zhu et al., 2015). Considering these
previous observations, the darkening and increased apoptosis activity in planarian gut during
acute light exposure is likely to be gut excretion as well, and it is of my interest to identify
9
regulators of this process. In comparison to previous RNAi-based approaches, the light exposure
induced depigmentation offers a novel model on gut excretion.
1.7 Outline and rationale for the thesis research
In collaboration with Dr. Jason Pellettieri’s lab (Keene State University, NH, USA), we have
generated an RNA-deep sequencing (RNAseq) dataset of S. mediterranea, by collecting intact
animals at several time points during the acute light exposure induced depigmentation and the
repigmentation process 4 days after returning to the dark. Comparing the RNAseq results
between the Day 10 (completely depigmented) time point and the control, expression levels of
more than one hundred transcripts were either increased or decreased by more than two-folds.
Working with these candidates of differentially-expressed transcripts, I have two goals in this
thesis research. First, I will establish the first molecular markers for planarian pigment cells
(Figure 2D). I hypothesize that a number of transcripts with decreased expression level in the
depigmented animals are specifically expressed in the pigment cells and can be demonstrated to
be pigment cell markers. My rationale is that if pigment cells are lost during light exposure, the
specifically expressed transcripts are no longer present in the animals, thus showing a decreased
expression level in the RNAseq data of depigmented worms. Second, I aim to identify regulators
of planarian pigment cell lineage specification, regeneration, and gut excretion (Figure 2D). I
hypothesize that certain genes with altered expressions, either with increased or decreased
expression in planarians in response to light exposure are key regulators of these processes. My
rationale is that planarians would activate specific genetic machinery to replenish pigment cells
after sensing a reduction in the pigment cell population and that the active removal of pigment
cells through gut excretion is mediated by genes that are specifically regulated during light
exposure. Both of the two processes would lead to altered expressions of responsible genes that
can be identified in the RNAseq data. To the end of these two goals, I performed a screen of 40
up-regulated and 69 down-regulated genes in the depigmented animals. In addition, I also
screened a few candidate genes with suspected involvement, by analyzing their expression
patterns and their functional involvement during depigmentation, gut excretion, pigment cell
lineage specification and regeneration.
10
Materials and Methods
2.1 Animal husbandry and light-induced depigmentation
A diploid, asexual CIW4 strain of Schmidtea mediterranea originally collected in Barcelona,
Spain was reared as previously described (Benazzi et al., 1972; Newmark and Sánchez Alvarado,
2002). The animals used in this study were kept in a dark incubator at 20°C under default/control
conditions. The animals were cultured in planarian water (Milli-Q H2O supplemented with 21g/L
Instant OceanTM, 0.9mM NaHCO3, 0.83mM MgSO4, 0.9mM CaCl2 and 0.04mM KHCO3 salts,
as previously described; Zhu et al., 2015) Animals were fed with beef liver paste every 10 days,
but a starvation period of one week was carried out before performing experiments on the animal
subjects. For the experiment of collecting whole planarian samples for RNAseq during the light-
induced depigmentation and repigmentation time course, a light exposure set up in a Styrofoam
box using CFL bulb was used. Specifically, a 14W, 2700K CFL bulb was placed approximately
30cm away from a tissue culturing plate containing the planarians. A piece of UV-resistant glass
was placed between the tissue culturing plate and the light source. A fan was used in this set up
to keep the circulation of the air and to prevent overheating of planarians. The animals were
treated with 5 cycles of 24 hours of light exposure and 24 hours of dark exposure (dark exposure
by placing the samples in the normal condition incubator) for a total of 10 days, at which point
the animals were completely depigmented on their dorsal surface. The animals were then
returned to the normal condition dark incubator for the rest of the experiment and to be observed
for repigment. For the light-induced depigmentation performed during the RNAi functional
screens, an alternative LED light exposure set up was used. The LED set up bares the sample
principle of the CFL set up, and unless otherwise noted, a cycle of 15-minute light and 225-
minute dark exposure was performed for 48 times (a total of 8 days at 6 cycles per day). This
alternative setup and light exposure schedule were used in the RNAi screen instead for its
shortened timeline and more consistent animal health at the end of the treatment.
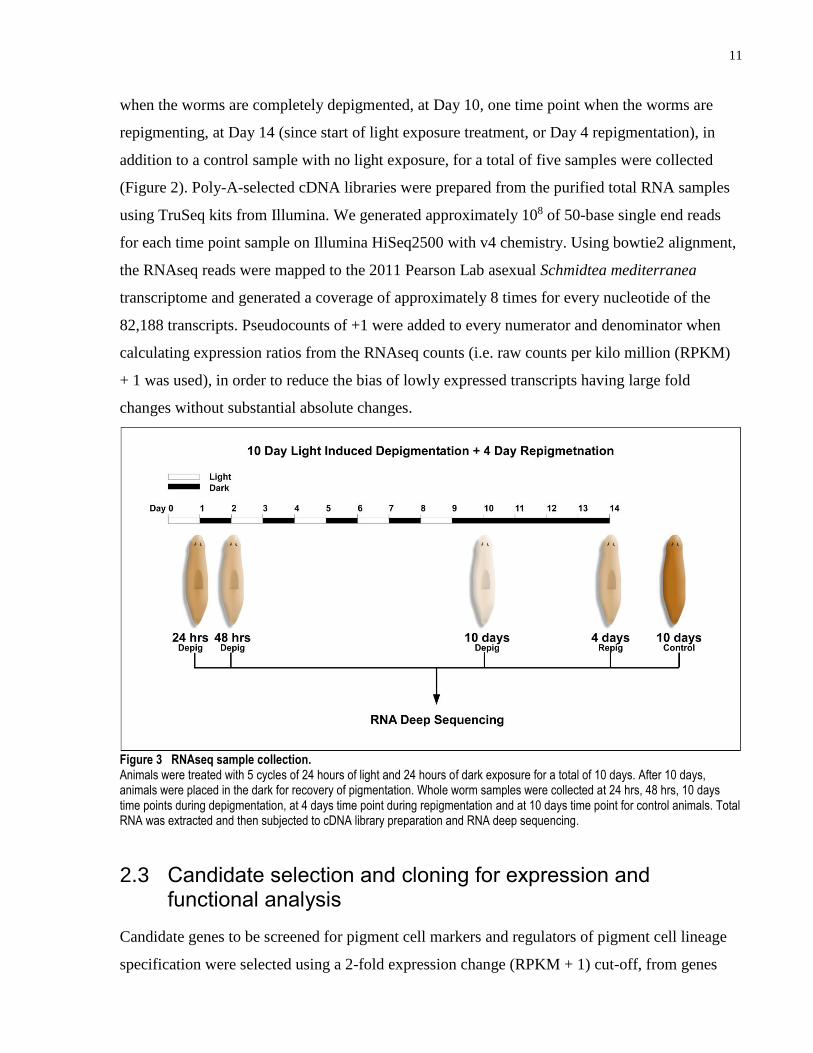
2.2 Intact planarian sample collection and RNA deep sequencing
In collaboration with Dr. Jason Pellettieri’s Laboratory, 5 to 10 intact planarian animals were
collected from 3 biological replicates under the CFL light-induced depigmentation set up for
total RNA extraction using TRIzol® Reagent (Invitrogen, catalog number 15596-026) (Figure 3).
Two time points during the depigmentation, at Day 1 (24hr) and Day 2 (48hr), one time point
11
when the worms are completely depigmented, at Day 10, one time point when the worms are
repigmenting, at Day 14 (since start of light exposure treatment, or Day 4 repigmentation), in
addition to a control sample with no light exposure, for a total of five samples were collected
(Figure 2). Poly-A-selected cDNA libraries were prepared from the purified total RNA samples
using TruSeq kits from Illumina. We generated approximately 108 of 50-base single end reads
for each time point sample on Illumina HiSeq2500 with v4 chemistry. Using bowtie2 alignment,
the RNAseq reads were mapped to the 2011 Pearson Lab asexual Schmidtea mediterranea
transcriptome and generated a coverage of approximately 8 times for every nucleotide of the
82,188 transcripts. Pseudocounts of +1 were added to every numerator and denominator when
calculating expression ratios from the RNAseq counts (i.e. raw counts per kilo million (RPKM)
+ 1 was used), in order to reduce the bias of lowly expressed transcripts having large fold
changes without substantial absolute changes.
Figure 3 RNAseq sample collection. Animals were treated with 5 cycles of 24 hours of light and 24 hours of dark exposure for a total of 10 days. After 10 days, animals were placed in the dark for recovery of pigmentation. Whole worm samples were collected at 24 hrs, 48 hrs, 10 days time points during depigmentation, at 4 days time point during repigmentation and at 10 days time point for control animals. Total RNA was extracted and then subjected to cDNA library preparation and RNA deep sequencing.
2.3 Candidate selection and cloning for expression and functional analysis
Candidate genes to be screened for pigment cell markers and regulators of pigment cell lineage
specification were selected using a 2-fold expression change (RPKM + 1) cut-off, from genes
12
with either increased or decreased expression in Day 10 (depigmented) animals in comparison to
control animals. Near full-length transcript of the established candidate genes were cloned using
gene-specific forward and reverse primers into a double stranded RNA expression vector (pT4P)
as previously described (Rink et al., 2009). For transcripts longer than 1.5kb, up to 1.5kb of 5’
sequences of the transcripts were cloned. Forward and reverse primers were designed to have an
18-22 nucleotide identity to the binding region of the transcript with a melting temperature
around 54°C, then additional sequences of 5’-CATTACCATCCCG-3’ and
5’-CCAATTCTACCCG-3’ were added to the 5’ of forward and reverse primers, respectively.
Total RNA was extracted from 7-day planarian regeneration time course and used as the
template to generate cDNA by SuperScript III Reverse Transcriptase (Thermo Scientific, Catalog
number: 18080-051). Polymerase chain reaction (PCR) was then performed with the forward and
reverse primer sets using the cDNA as the template. PCR products were gel extracted and treated
by T4 DNA polymerase (Thermo Scientific, Catalog number: EP0061) with dCTP as the only
nucleotide available in the reaction mix. The predominant 3’-5’ exonuclease activity of the T4
DNA polymerase generates 5’-CATTACCATCCC-3’ and 5’-CCAATTCTACCC-3’ overhangs
at either end of the PCR products. Using a similar method but with the addition of dGTP instead,
complementary overhangs were generated on the SmaI restriction enzyme digested pT4P vectors
using T4 DNA polymerase, for directional insertion of the PCR product. The T4 DNA
polymerase-treated PCR product and pT4P vector were then mixed and allowed spontaneous
overhang binding, without an enzyme-mediated ligation step, and then transformed into DH5𝛼
E. coli. Positive clones of the candidate transcripts were then verified by Sanger sequencing.
2.4 Riboprobe synthesis for expression analysis
Primer set AA18 (5’-CATTACCATCCCGCCACCGGTTCCATGG-3’) and PR244F (5’-
GGCCCCAAGGGGTTATGTGG-3’) was used with the templates of cloned transcripts in pT4P
vectors in order to generate PCR products containing one T7 site in the antisense direction to the
3’ ends of the inserted transcripts. Then using a previously published method, antisense
riboprobes were synthesized using T7 RNA-polymerase (Thermo Scientific, Catalog number:
EP0111) for a reaction time of 3 hours (Pearson et al., 2009). During this reaction, 400ng of the
abovementioned PCR product was used as the DNA template. And either digoxigenin (DIG,
Roche, Product No. 11277073910) or fluorescein (Roche, Product No. 11685619910) was used
13
for RNA riboprobe labeling. A hydrolysis reaction was performed on the synthesized riboprobes
prior to use in whole-mount in situ hybridization (WISH) experiments.
2.5 WISH and dFISH for expression analysis
Whole-mount in situ hybridization (WISH) and double fluorescent in situ hybridization were
performed by adapting previously published methods (Pearson et al., 2009). In both cases,
planarian animals roughly 4mm in length were killed using 5% N-acetyl-cysteine (NAC; Sigma)
in PBS, a mucolytic compound, and then fixed with 4% formaldehyde in PBSTx (formaldehyde:
Sigma; PBSTx: 1× PBS + 0.5% Triton X-100). The fixed animals were treated with a reduction
solution (reduction solution: 50 mM DTT, 1% NP-40, 0.5% SDS, in 1× PBS) and then subjected
to dehydration in 50% methanol solution and 100% methanol solution sequentially (50%
methanol solution: equal volumes of 1× PBSTx and 100% methanol). Both the reduction and
dehydration steps function to permeabilize the fixed animal samples allowing access of
riboprobes, antibodies, and substrates for in situ development. The dehydrated samples were then
treated with a 6% bleach solution (6% H2O2 in Methanol) to bleach pigment present in the
animals to help with in situ pattern imaging. After overnight treatment in 6% bleach solution, the
animal samples were rehydrated using 50% methanol and PBSTx solutions sequentially.
Hybridization of riboprobes was then performed after a 2-hour Prehyb incubation of the animal
samples in riboprobe mix (Hybridization solution: 50% De-ionized Formamide (Roche); 5%
Dextran Sulfate (Sigma); 5× SSC (from 20× stock); 1× Denhardt’s solution (Sigma); 100𝜇g/ml
Heparin (Sigma, from porcine intestine, from 100× stock); 1mg/ml yeast torula RNA (Sigma);
1% Tween-20 (Sigma); 0.6% DTT. Prehyb solution: Hybridization solution without dextran
sulfate, Heparin or DTT. Riboprobe mix: 1:500 to 1:1000 times dilution of DIG-labeled
riboprobe or 1:200 to 1:250 times dilution of fluorescein labeled riboprobes in Hybridization
solution). Hybridization was performed at 56℃ for more than 16 hours and then the animal
samples were washed at 56℃ with each of the following solutions twice, 2× SSC solution, 0.2×
SSC solution and 0.05× solution, for a duration of 30 minutes per wash (2× SSC solution: 2×
SSC + 0.1% Triton-X. 0.2× SSC solution: 0.2× SSC + 0.1% Triton-X. 0.05× SSC solution:
0.05× SSC + 0.1% Triton-X. All using H2O as the solvent). After the SSC washes, the animal
samples were blocked with 5% horse serum plus 5% western blocking reagent (Roche) in MABT
(MABT: 100 mM maleic acid, 150 mM NaCl, 0.1% Tween-20, pH to 7.5 with NaOH). After 2
hours of blocking, the animal samples were then incubated with anti-DIG-AP, anti-DIG-POD or
14
anti-fluorescein-POD antibodies (All three of the antibodies from Roche. anti-DIG-AP, used at
1:4,000, anti-DIG-POD, used at 1: 500, and anti-fluorescein-POD, used at 1:400 in blocking
solution) overnight at room temperature. 6 times of washes with MABT at 20 minutes each were
performed after the antibody incubation. The animal samples were then ready for signal
detection by colorimetric development or fluorescent development.
For samples with epitope detection by anti-DIG-AP undergoing colorimetric development, a pre-
incubation of 10 minutes in AP buffer was performed (AP buffer: 100 mM Tris, pH 9.5; 100 mM
NaCl; 50 mM MgCl2; 0.1% Tween-20 brought up to volume with 10% polyvinylalcohol solution
(PVA; Sigma P8136)). AP buffer was replaced with Developmental buffer containing the
NBT/BCIP substrate (Development buffer: AP buffer with 4.5𝜇L/mL NBT (Roche) and
4.5𝜇L/mL BCIP (Roche)). The colorimetric development was carried out for a duration of 10
minutes to 3 hours, until an optimal signal to background ratio was achieved. The
colorimetrically developed animals were washed with PBSTx twice and post-fixed with 4%
formaldehyde in PBSTx for 20 minutes. Another two PBSTx washes were performed after the
fixation before the post-fixed samples were treated with 100% Ethanol. Samples were incubated
in 100% Ethanol, which removes the unspecific background staining and turns the NBT/BCIP
precipitate dark blue, for 5-20 minutes until optimal signal to background ratio was achieved.
100% Ethanol was then replaced with another PBSTx wash and the samples were then placed in
80% Glycerol solution overnight, before mounted onto slides for imaging (80% Glycerol
solution: 80% Glycerol; 10mM Tris, pH 7.5; 1mM EDTA). The colorimetric WISH stains
prepared according to the above procedure were imaged on a Leica M165 fluorescent dissecting
microscope. Images were post-processed in Adobe Photoshop. All colorimetric quantification
were performed with the freely available ImageJ software (http://rsb.info.nih.gov/ij/).
Two types of fluorescent developments were performed for samples undergoing fluorescent
development. FastBlue development was performed on samples with epitope detection by anti-
DIG-AP, as previously described (Zhu et al., 2015; Lauter et al., 2011). Samples after MABT
washes were incubated in SB8.2 buffer for 10 minutes (SB8.2 buffer: 100 mM Tris, pH 8.2; 100
mM NaCl; 50 mM MgCl2; 0.1% Tween-20 brought up to volume with 10% polyvinylalcohol
solution (PVA; Sigma P8136)). SB 8.2 buffer was then replaced with FastBlue development
buffer containing the FastBlue and NAMP substrates (FastBlue development buffer: mix equal
volume of 5𝜇L/mL Fast Blue BB (Sigma F3378) and 5𝜇L/mL of naphtol-AS-MX-phosphate
15
(NAMP, Sigma N5000), for a final concentration of 2.5𝜇L/mL of each substrate). Development
of FastBlue stain was monitored by its blue colorimetric development for a duration ranging
from 10 minutes to 3 hours. The development was stopped as soon as a faint colorimetric pattern
similar to that observed with NBT/BCIP development can be observed under dissecting scope.
In the cases of epitope detection by anti-DIG-POD and anti-fluorescein-POD, the in situ stains
were developed with FITC or Cy3 tyramides. To prepare for the tyramide development, samples
after the MABT washes were first incubated in PBSTx for 30 minutes. Then PBSTx was
replaced with tyramide solution for another 30-minute incubation (Tyramide solution: 1:500
dilution of Cy3 tyramide or 1:2000 dilution of FITC tyramide in PBSTx). After the tyramide
solution incubation, two spikes at 25 minutes apart of H2O2 at a final concentration of 1 part per
10,000 were performed to the samples in tyramide solution. After 45 minutes of the initial spike
of H2O2, the tyramide development was stopped by replacing the tyramide solution with PBSTx.
Another 2 washes of PBSTx for 5 minutes each was performed before the animals were put into
AntiFade mounting media (AntiFade mounting media: 80% Glycerol solution + 1% DABCO
(Sigma)).
Tyramide development was coupled with FastBlue development or another tyramide
development to produce multicolor fluorescent in situ hybridization stains. Multiple riboprobes
labeled with different epitopes, for instance, DIG and fluorescein, were added to the same
riboprobe mix. The hybridization and first round tyramide development were performed
similarly as in the case of single riboprobe in situ. In the case of a second round development
using FastBlue, anti-DIG-AP is already added during the antibody incubation for the first round
development, thus, the samples after first round tyramide development were incubated in SB 8.2
buffer and proceed as normal for FastBlue development. In the case of a second round
development using another tyramide development, the first round POD-conjugated antibody
activity was quenched by incubating the samples in sodium azide solution for 60 minutes
(Sodium azide solution: 100mM sodium azide in PBSTx). The sodium azide solution was then
washed 5 times with PBSTx for 5 minutes each before the samples were incubated in the next
round of antibody overnight in blocking solution. And the second round tyramide development
proceeded similarly as first round development with a different tyramide. After all developments
are done, samples were placed in AntiFade mounting media. All fluorescently developed
samples, including FastBlue and tyramide stains, were imaged on an Olympus IX81 Quorum
16
Spinning Disk Confocal with a Hamamatsu C9100-13 EM-CCD camera and a Yokogawa CSU
X1 scanhead. Whole-animal images were stitched together using the application Volocity, and
all images were post-processed in Adobe Photoshop.
2.6 Targeted functional knockdown by RNA interference
RNA interference (RNAi) targeting cloned candidate transcripts was performed as previously
described to knock down their functions in planarian pigmentation and pigment cell lineage
specification (Newmark et al., 2003). RNAi in this study was performed by feeding planarians
with RNAi food in the form of a beef liver paste containing bacteria expressing double-strand
RNAs of the targeted transcript. In order to produce the bacteria culture to make the RNAi food,
pT4P vectors containing target transcript sequence, as described in section 2.3, were transformed
into HT115 E. coli strain, which is capable of RNA synthesis by T7 RNA polymerase when
induced by isopropyl 𝛽-D-1-thiogalactopyranoside (IPTG). In the pT4P vector backbone, there
are two T7 promoters flanking and going in the direction towards the insertion site of the cloned
transcript, which are key to produce complementary strands of the double-stranded RNA
responsible for RNA interference. E. coli bacteria containing the cloned pT4P vectors were
grown to an optical density at 600nm (OD600) of 0.8 and then induced with 1mM IPTG. The
induced bacteria culture was then incubated at 37℃ for another 2 hours, allowing RNA
production by T7 RNA polymerase. Bacteria were then pelleted and mixed with beef liver paste
at a ratio of 333𝜇L of liver per 100 mL of original bacteria culture volume. After thorough
mixing of the beef liver paste and the bacteria pellet, blue food coloring was added to the mixture
at 1 𝜇L coloring /60 𝜇L food. The RNAi food was then aliquoted to 60𝜇L per feeding, which is
sufficient to feed 40 worms in the size range of 2-4mm in length, and stored at -80℃ until use.
The negative control RNAi was prepared in a similar way but with a pT4P vector containing
GFP sequence at the insertion site. During the screening of all genes in this study, RNAi food
was fed to >7 day starved planarians at a frequency of twice per week for 5 weeks, for a total of
10 feedings. Certain phenotypes take fewer feeds and less time to display, and the time points in
figures denote the number of feeds for the specific gene being knocked down as well as days
after the last feeding of RNAi food. For example, 10fd14 denotes 10 RNAi feedings and 14 days
after the last feeding, and 12fd7 corresponds to 12 RNAi feedings and 7 days after the last
feeding.
17
Results
3.1 Identified hmbs and alas as planarian pigment cell markers
3.1.1 Selection of candidates and their expression patterns
Analysis of Day 10 depigmented animal and control animal RNAseq data yields 149 genes with
more than 2-fold decreased and 162 genes with more than 2-fold increased expression levels in
the depigmented animals. Of these 311 candidates, 69 down-regulated and 40 up-regulated genes
were cloned based on the descending order of their fold changes. Among the 109 cloned genes,
60 of them give specific WISH patterns. Expression patterns can be categorized as expression in
the gut, in the sub-epidermis with spider morphology (rich in processes extruding from cell
soma), in the sub-epidermis with punctate morphology, in the epidermis with unknown
morphology, in the anterior, in the pharynx, in the para-pharyngeal region, in the neural system
and in the parenchyma with variable expressions across individual animals (Figure 4). Most sub-
epidermal expression patterns (spider and punctate patterns) are generated by genes with down-
regulated expression in depigmented animals. All the variable parenchyma expression patterns
are generated by genes with up-regulated expression in depigmented animals. Other categories of
expression patterns are generated by either down- or up-regulated genes. Up to 3 representative
genes of each category were listed in Figure 3. The expression pattern screen of differentially
expressed genes presented here provides guidance for later functional studies of planarian
depigmentation and repigmentation. In order to establish molecular markers of pigment cells,
genes with distinct sub-epidermal expressions were prioritized for RNAi screening (Figure 4,
rows 2-4). For the identification of regulators of depigmentation and repigmentation, genes with
distinct gut and variable parenchyma expression patterns were prioritized for screening (Figure
4, first and last rows). Many up-regulated genes without distinct wild-type stains were also
screen by RNAi knockdown. The rationale behind screening of these genes is that up-regulated
genes without a distinct expression pattern in normally pigmented animals may still have a
dramatically different expression during, and possibly be required for, depigmentation and
pigment cell regeneration.
18
Figure 4 Expression patterns of genes with differential expression levels in depigmented animals. Up to 3 representative expression patterns by WISH of each category are listed. The number of genes that fall into each category is displayed in the brackets following category names. Categories of specific expression patterns are gut, sub-epidermal with spider morphology, sub-epidermal with punctate morphology, epidermal (other), anterior, pharynx, para-pharyngeal, neural, ubiquitous, other distinct patterns, and parenchyma variable. For genes in the parenchyma variable category,
two representative images of expression in different individuals are shown. Scale bar: 100𝜇m.
19
3.1.2 Genes with sub-epidermal expressions and pigment cell-like morphologies
The expression patterns of spider and punctate categories of genes resemble the anatomical
location of pigment cells as previously proposed and are further characterized to determine
whether they are marking pigment cells (Palladini et al., 1979a). Spider gene category includes
an hmbs homolog (spider-1). Hydroxymethylbilane synthase (HMBS), encoded by hmbs, is an
enzyme responsible for the third step of heme synthesis pathway catalyzing the production of
hydroxymethylbilane from porphobilinogen (Grandchamp et al., 1987). Another spider gene is
an alas homolog (spider-2). Aminolevulinic acid synthase (ALAS), encoded by alas, is the
enzyme responsible for the first step of the same heme synthesis pathway as HMBS, responsible
for the conversion of succinyl-CoA to d-Aminolevulinic acid (Bishop, 1990). HMBS functions
in the cytoplasm while ALAS is usually found in the mitochondria (Grandchamp et al., 1987;
Bishop, 1990). Punctate genes category includes an ans homolog (punctate-1). L-Asparaginase,
encoded by ans, catalyzes the deamination reaction from L-asparagine to L-aspartate (Cantor et
al., 2009). A homolog of sds (punctate-2) also belongs to the punctate category. L-serine
dehydratase/L-threonine dehydratase, encoded by sds, is responsible for the catalytic activity of
converting L-serine and L-threonine to pyruvate and 2-oxobutanoate, respectively (Ogawa et al.,
1989). Both the punctate markers and spider markers display distinct expression patterns
throughout the entire animal in the sub-epidermal layer (Figure 5A). The expression of both
types of markers is quite uniform within the dorsal or ventral surface. However, the dorsal
surface has a higher density of both markers over the ventral surface. spider-1, hmbs, is
expressed at a density of 161±44 cells/mm2 in the dorsal surface (n = 6). Whereas punctate-1,
ans, is expressed at a density of 1137±71 cells/mm2 in the dorsal surface (n = 6). One exception
to the generally uniform expression of spider and punctate markers is the lack of expression in
the eye region. No hmbs expression can be detected in the patches of cells opposing the planarian
eye cups, which include photo-sensory neurons (Figure 5B). This is a logical expression pattern
for potential pigment cell markers, because planarian lacks pigmentation in the photo-sensory
region, allowing unhindered light passage. It is also observed that cells expressing spider
markers and punctate markers are not located in the outermost layer of the planarian epidermis
(Figure 5B, C). Individual cells labeled by punctate marker ans and sds display small and round
morphology. Individual cells labeled by hmbs and alas are observed to have cytoplasmic
processes extending from the cell soma. All the morphological observations about cells labeled
20
by spider cell markers agree with previously published data on planarian pigment cells, thus are
suitable candidates for pigment cell markers (Figure 5D) (Palladini et al., 1979a, 1979b).
Figure 5 Expression patterns of spider and punctate genes resemble pigment cell morphology. A) Spider and punctate genes are expressed throughout the surface of planarian animals. The dorsal planes of animals are shown. B) Details of hmbs expression in the anterior region. Individual hmbs positive cells have extending processes from the cell soma. A gap exists between hmbs expression and the edge of the dorsal plane, suggesting expression of hmbs in the sub-epidermal layer. Patches opposing eye pigment cups lack hmbs expression. C) Details of ans expression in the posterior region. Individual ans positive cells have small and round morphology. D) Illustration of pigment cell morphology in axial cross section. E, epidermis. BM, basal membrane. MF, muscle fibre. P, parenchyma. Black dots in the pigment cell indicate pigment granules. All expression patterns stained by WISH. Scale bar: 100𝜇m.
3.1.3 Expression of spider markers correlates to pigment status of planarian tissue
After morphologically establishing spider and punctate markers as suitable candidates for
pigment cell markers, I next tested whether their expression patterns were affected during
depigmentation, as predicted if they are bona fide pigment cell markers. Planarians roughly 3mm
in length were exposed to visible light in the LED light exposure set up for 7 days. The animals
21
Figure 6 Expression of spider and punctate genes directly correlates to the pigment status of planarian tissue. A) Live image of a light-exposed planarian animal. (>8 days, completely depigmented) B) Live image of a regenerating planarian. 7 days after amputation. Newly regenerated head and tail (blastema) are mostly not pigmented. C) Normal expression of hmbs (spider-1), pepck (spider-3) and ans (punctate-1) in WT (control) diminishes in 7-day light exposed animals (mostly depigmented). D) hmbs is lowly expressed in newly regenerated blastema at 5-day post amputation. F) Details of limited expression of hmbs in 5-day blastema. All expression patterns stained by WISH. Panels D and F are courtesy of Stephanie
Hallows. Scale bar: 100𝜇m.
were almost completely depigmented at the end of this treatment (Figure 6A). I then performed
WISH on these light exposed animals and determined the expression level of spider and punctate
22
markers. The expression of punctate markers is undetectable while spider marker expression is
greatly reduced (n ≥ 3 for each WISH stains of both conditions) (Figure 6C). The positive
correlation between the pigment status of planarians and the expression of spider and punctate
markers supports these genes as pigment cell markers.
Another method to generate unpigmented planarian tissue is by amputation (Figure 6B). The
newly regenerated blastema after amputation is unpigmented and it takes about 2 weeks before
the pigment status is restored to a similar level to that of the old body part. With assistance from
the Pearson Laboratory technician, Stephanie Hallows, we performed WISH of spider markers in
newly regenerated blastema at 5 days post amputation. Only a handful of cells displayed
expression of the spider-1 marker in both the anterior and posterior blastema (n > 10, counting
head, trunk, and tail fragments) (Figure 6D, F), further supporting the positive correlation
between the expression of spider markers and pigment status of the planarian tissue.
3.1.4 hmbs is functionally required for pigment production and maintenance
For a marker with high specificity, its expression should be exclusive within the pigment cell
population only. And logically, I hypothesized that the exclusive expression of these genes in
pigment cells are crucial for pigment cell functions, for instance, pigment production and
maintenance. Thus, I performed functional knockdown of several punctate and spider genes by
RNAi and observed changes in planarian pigmentation. After 12 feeds of RNAi, functional
knockdown of punctate genes did not show any effect on planarian pigmentation or the recovery
of pigmentation after light exposure (n = 28). On the other hand, when spider-1, hmbs, was
functionally knocked down by RNAi, the pigmentation of hmbs RNAi animals became much
lighter than that of control animals (n = 35) (Figure 7A). spider-1 RNAi animals did not display
any apparent health or behavioral defects. Although the treated animals are much lighter in
pigmentation, residual pigmentation with similar expression morphology to that of control
animals can still be observed.
I next tested the functional requirement of spider-1 during the repigmentation of blastema after
amputation. Control and spider-1 RNAi worms after 12 feeds were amputated at 7 days after the
last feeding of RNAi food and allowed to regenerate for 30 days. Roughly 7 days is required for
planarians to regenerate new head and tail tissue after amputation and morphallax to similar body
proportions as before amputation (Newmark and Sánchez Alvarado, 2002). In this experiment,
23
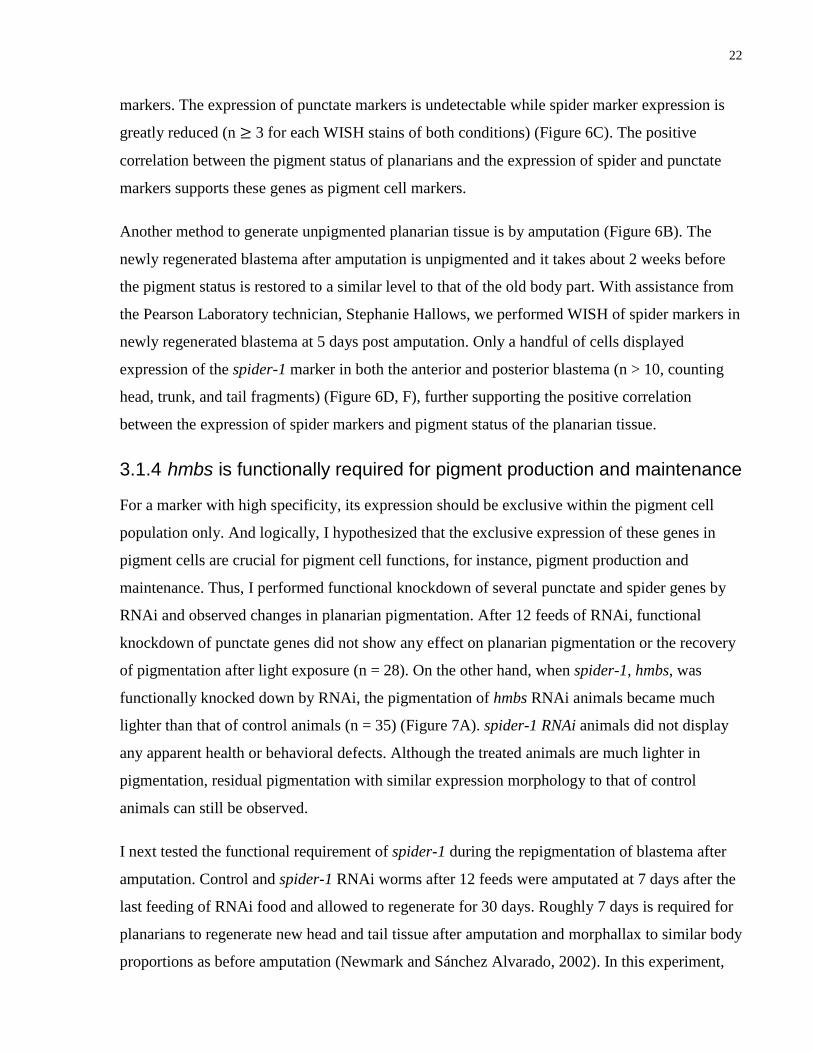
Figure 7 Functional requirement of hmbs in pigmentation maintenance and repigmentation. A) Representative live images of animals after 12 feeds of RNAi food and 7 days after the last feeding. Control animals display normal pigmentation while hmbs RNAi worms are no longer pigmented. B) Representative live images of animals after similar treatment as in A), but imaged with amputation performed at 7 days post RNAi feedings and after 30 days of regeneration. In control animals, pigmentation and boundaries of clearing around eyes are established in newly regenerated tissue. In hmbs RNAi animals, pigmentation is not established in neither the old body parts nor the newly regenerate tissue.
an extensive 30-day regeneration period allowed the amputated animals to fully regenerate their
pigment cells in the new tissue and produce body pigment. In the control animals, I observed that
the newly regenerated head and tail tissue have recovered substantial pigmentation, although still
slightly lighter than the old body parts, at the end of the regeneration period (n = 4, counting
trunk fragments only) (Figure 7B). I also observed that the boundaries of the characteristic
pigment-less patches in the eye region have been re-established, due to sufficient body pigment
deposition in the surrounding tissues. In the spider-1 RNAi worms, however, the newly
regenerated head and tail contained no detectable recovery of body pigment (n = 6, counting
trunk fragments only) (Figure 7B). There is no discernible boundary of pigmentation between the
eye region and the surrounding tissues to be detected, either. Furthermore, even the old body
parts remained largely unpigmented. These results suggest that hmbs is responsible for the
maintenance of planarian body pigmentation during homeostasis and for the pigment production
in newly regenerated tissues, supporting hmbs as the planarian pigment cell marker functionally.
3.1.5 hmbs is co-expressed with other spider markers and kmo
After establishing hmbs as planarian pigment cell markers with morphological and functional
evidence, I then determined its co-expression with several other spider and punctate markers
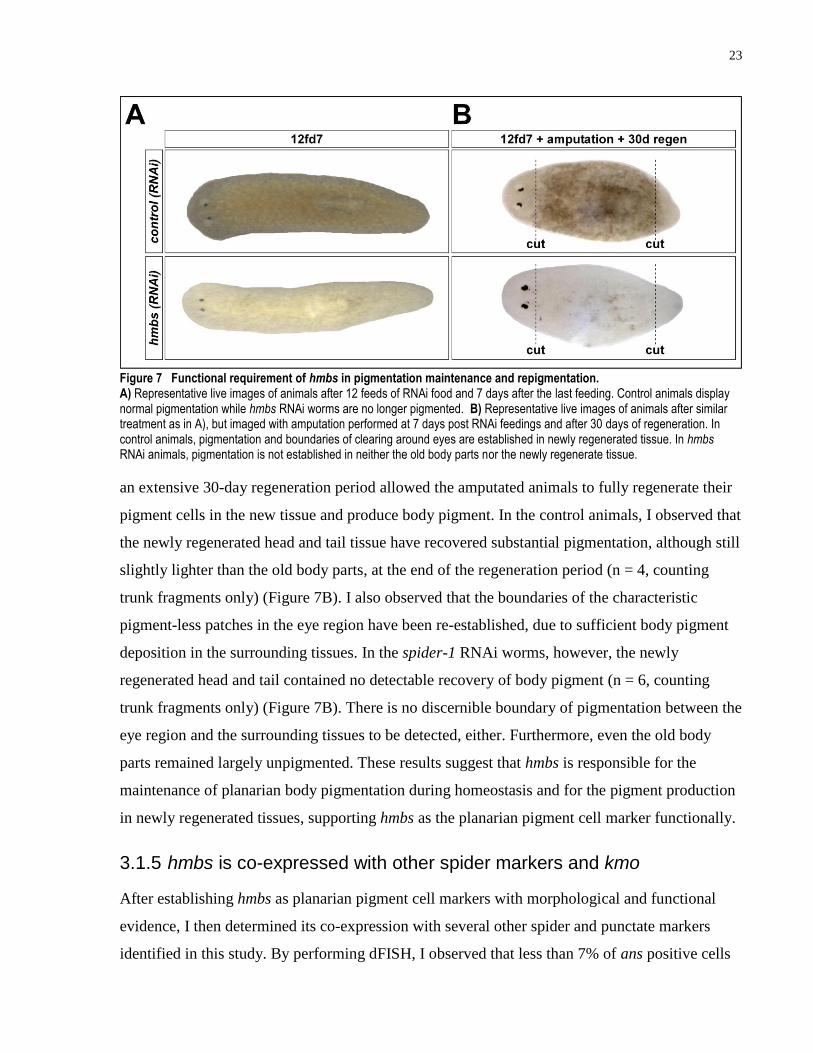
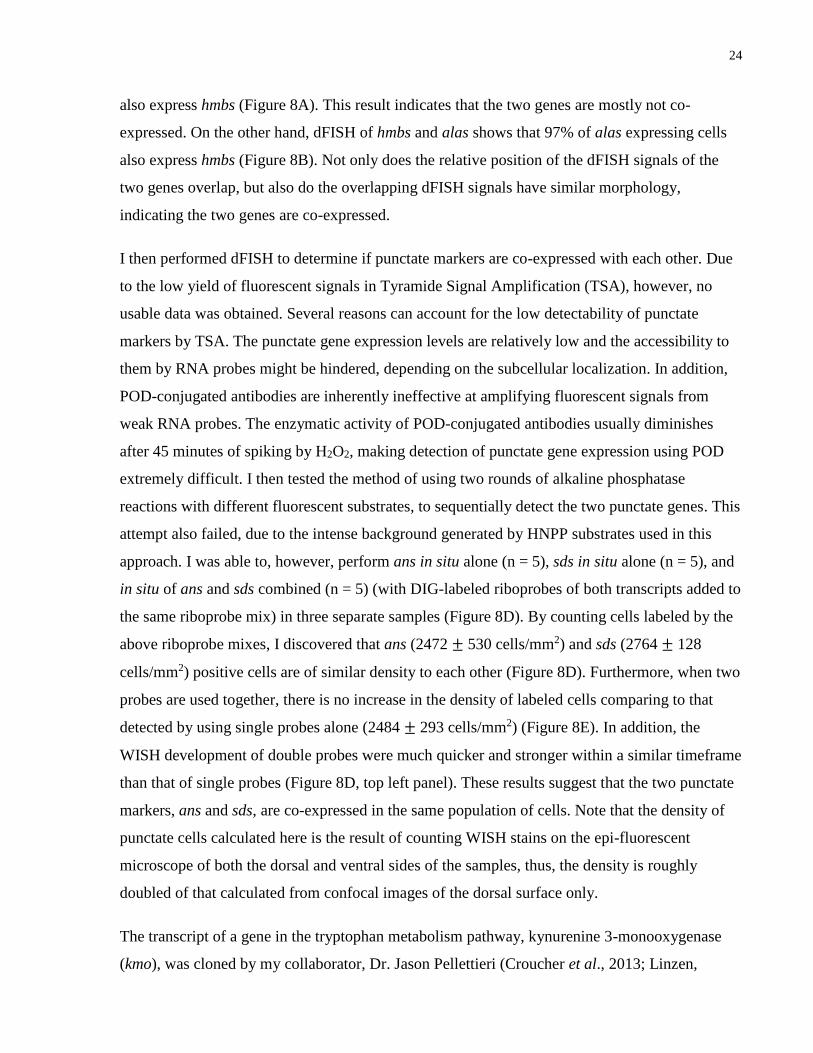
identified in this study. By performing dFISH, I observed that less than 7% of ans positive cells
24
also express hmbs (Figure 8A). This result indicates that the two genes are mostly not co-
expressed. On the other hand, dFISH of hmbs and alas shows that 97% of alas expressing cells
also express hmbs (Figure 8B). Not only does the relative position of the dFISH signals of the
two genes overlap, but also do the overlapping dFISH signals have similar morphology,
indicating the two genes are co-expressed.
I then performed dFISH to determine if punctate markers are co-expressed with each other. Due
to the low yield of fluorescent signals in Tyramide Signal Amplification (TSA), however, no
usable data was obtained. Several reasons can account for the low detectability of punctate
markers by TSA. The punctate gene expression levels are relatively low and the accessibility to
them by RNA probes might be hindered, depending on the subcellular localization. In addition,
POD-conjugated antibodies are inherently ineffective at amplifying fluorescent signals from
weak RNA probes. The enzymatic activity of POD-conjugated antibodies usually diminishes
after 45 minutes of spiking by H2O2, making detection of punctate gene expression using POD
extremely difficult. I then tested the method of using two rounds of alkaline phosphatase
reactions with different fluorescent substrates, to sequentially detect the two punctate genes. This
attempt also failed, due to the intense background generated by HNPP substrates used in this
approach. I was able to, however, perform ans in situ alone (n = 5), sds in situ alone (n = 5), and
in situ of ans and sds combined (n = 5) (with DIG-labeled riboprobes of both transcripts added to
the same riboprobe mix) in three separate samples (Figure 8D). By counting cells labeled by the
above riboprobe mixes, I discovered that ans (2472 ± 530 cells/mm2) and sds (2764 ± 128
cells/mm2) positive cells are of similar density to each other (Figure 8D). Furthermore, when two
probes are used together, there is no increase in the density of labeled cells comparing to that
detected by using single probes alone (2484 ± 293 cells/mm2) (Figure 8E). In addition, the
WISH development of double probes were much quicker and stronger within a similar timeframe
than that of single probes (Figure 8D, top left panel). These results suggest that the two punctate
markers, ans and sds, are co-expressed in the same population of cells. Note that the density of
punctate cells calculated here is the result of counting WISH stains on the epi-fluorescent
microscope of both the dorsal and ventral sides of the samples, thus, the density is roughly
doubled of that calculated from confocal images of the dorsal surface only.
The transcript of a gene in the tryptophan metabolism pathway, kynurenine 3-monooxygenase
(kmo), was cloned by my collaborator, Dr. Jason Pellettieri (Croucher et al., 2013; Linzen,
25
Figure 8 Co-expression analysis of spider and punctate markers. A) Most hmbs or ans positive cells do not co-express with each other. B) hmbs and alas are highly co-expressed. C) hmbs and kmo are highly co-expressed. White arrows indicate a lack of co-expression in A), and cells that are co-expressing markers in B) and C). Approximate locations on the dorsal plane of the animals imaged were shown to the right. D) ans and sds expression are similar in cellular population and morphology. WISH with combined ans and sds probes generates similar expression pattern to individual probes without apparent changes in population or morphology. E) The density of positively stained cells in each
condition shown in D). Error bar: Standard deviation. Scale bar: 100𝜇m.
26
1974). kmo shows an expression pattern similar in morphology and density to that of other spider
markers (Figure 8C). I then performed dFISH between kmo and hmbs and observed that hmbs is
co-expressed in 96 ± 4.2% of kmo positive cells (Figure 8C). The tryptophan metabolism
pathway, in which kmo functions, is key to the production of ommochromes, one of the major
types of pigments found in the animal kingdom. Reports of studies in mosquitos and silk worms
show that kmo is required for proper pigmentation of the eyes and silk color, in either organism,
respectively (Han et al., 2003; Osanai-Futahashi et al., 2012). I also tested the expression pattern
of 6 transcripts involved in tyrosine metabolism, a pathway involved in melanin production, and
did not find any spider cell-like expression patterns. In summary, the co-expression of kmo and
hmbs in pigment cells strongly suggests that ommochrome is one of the responsible pigments for
the body pigmentation of S. mediterranea. This result agrees with previous studies on purified
planarian body pigment using spectrophotometry in the UV region (Hase et al., 2006).
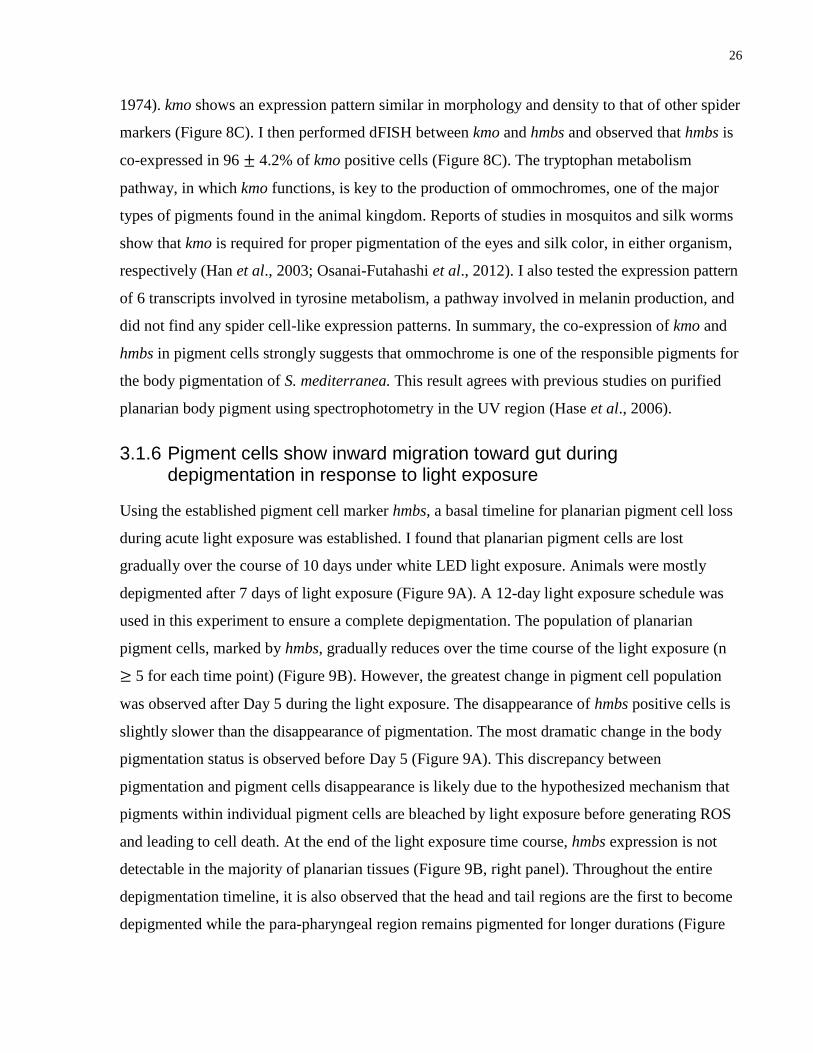
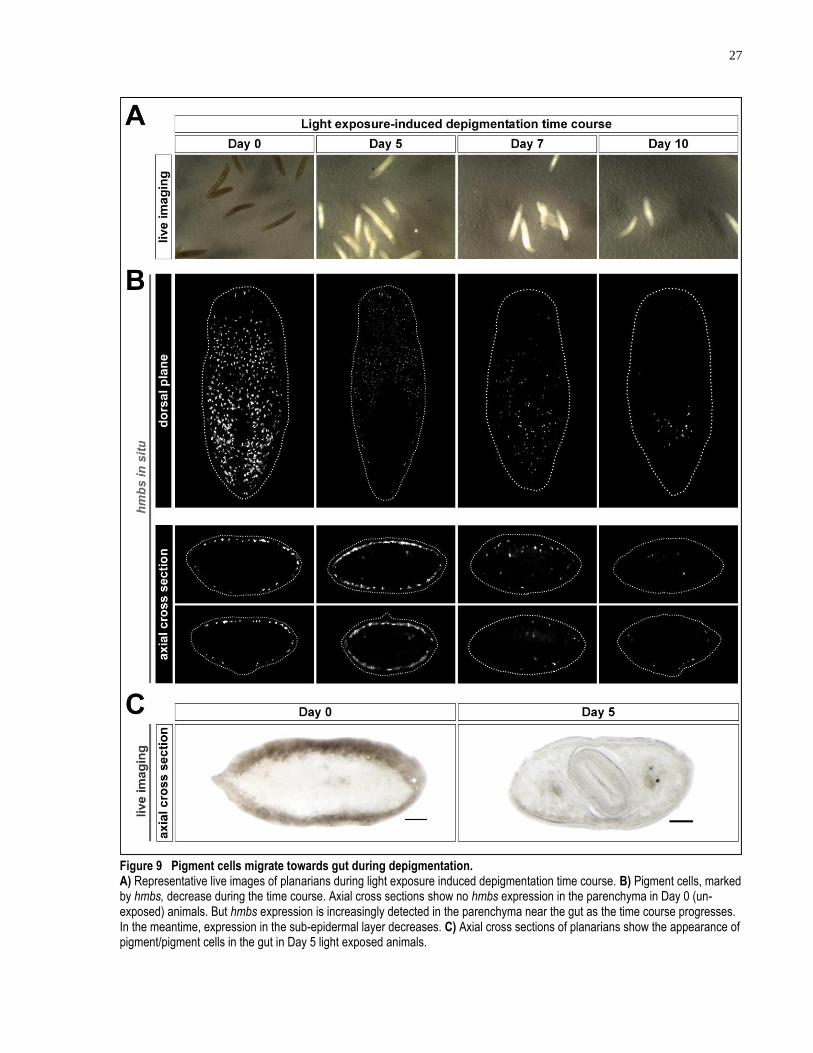
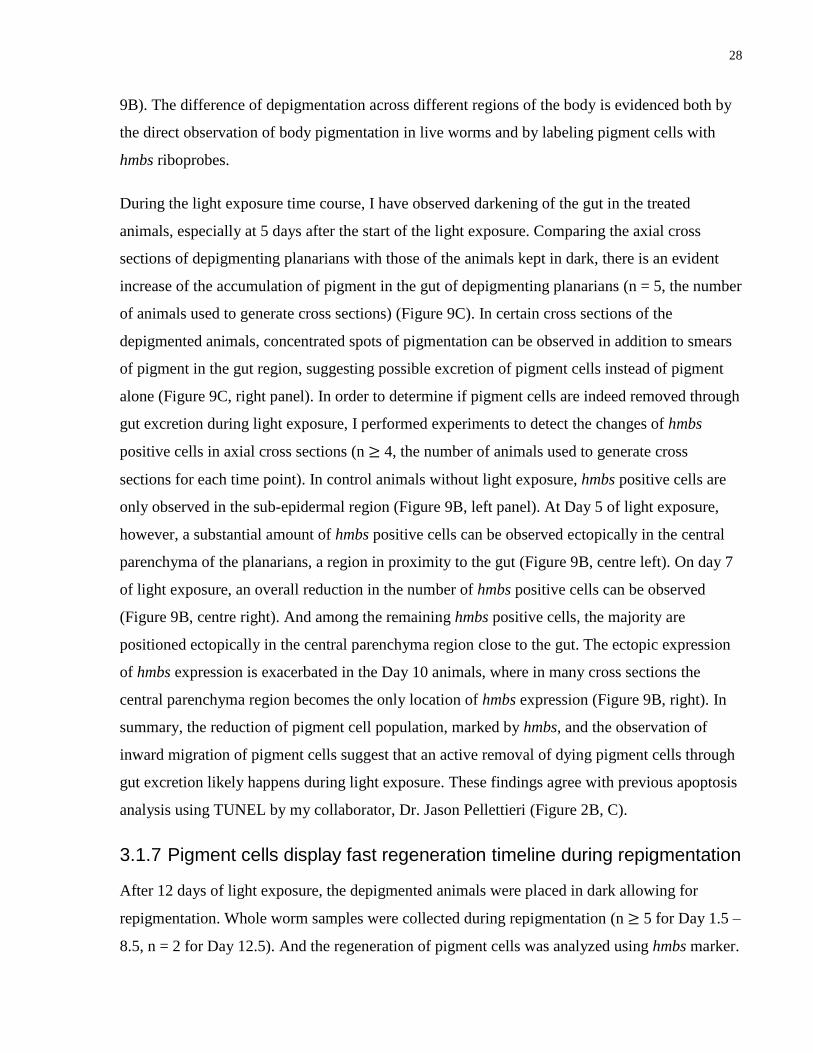
3.1.6 Pigment cells show inward migration toward gut during depigmentation in response to light exposure
Using the established pigment cell marker hmbs, a basal timeline for planarian pigment cell loss
during acute light exposure was established. I found that planarian pigment cells are lost
gradually over the course of 10 days under white LED light exposure. Animals were mostly
depigmented after 7 days of light exposure (Figure 9A). A 12-day light exposure schedule was
used in this experiment to ensure a complete depigmentation. The population of planarian
pigment cells, marked by hmbs, gradually reduces over the time course of the light exposure (n
≥ 5 for each time point) (Figure 9B). However, the greatest change in pigment cell population
was observed after Day 5 during the light exposure. The disappearance of hmbs positive cells is
slightly slower than the disappearance of pigmentation. The most dramatic change in the body
pigmentation status is observed before Day 5 (Figure 9A). This discrepancy between
pigmentation and pigment cells disappearance is likely due to the hypothesized mechanism that
pigments within individual pigment cells are bleached by light exposure before generating ROS
and leading to cell death. At the end of the light exposure time course, hmbs expression is not
detectable in the majority of planarian tissues (Figure 9B, right panel). Throughout the entire
depigmentation timeline, it is also observed that the head and tail regions are the first to become
depigmented while the para-pharyngeal region remains pigmented for longer durations (Figure
27
Figure 9 Pigment cells migrate towards gut during depigmentation. A) Representative live images of planarians during light exposure induced depigmentation time course. B) Pigment cells, marked by hmbs, decrease during the time course. Axial cross sections show no hmbs expression in the parenchyma in Day 0 (un-exposed) animals. But hmbs expression is increasingly detected in the parenchyma near the gut as the time course progresses. In the meantime, expression in the sub-epidermal layer decreases. C) Axial cross sections of planarians show the appearance of pigment/pigment cells in the gut in Day 5 light exposed animals.
28
9B). The difference of depigmentation across different regions of the body is evidenced both by
the direct observation of body pigmentation in live worms and by labeling pigment cells with
hmbs riboprobes.
During the light exposure time course, I have observed darkening of the gut in the treated
animals, especially at 5 days after the start of the light exposure. Comparing the axial cross
sections of depigmenting planarians with those of the animals kept in dark, there is an evident
increase of the accumulation of pigment in the gut of depigmenting planarians (n = 5, the number
of animals used to generate cross sections) (Figure 9C). In certain cross sections of the
depigmented animals, concentrated spots of pigmentation can be observed in addition to smears
of pigment in the gut region, suggesting possible excretion of pigment cells instead of pigment
alone (Figure 9C, right panel). In order to determine if pigment cells are indeed removed through
gut excretion during light exposure, I performed experiments to detect the changes of hmbs
positive cells in axial cross sections (n ≥ 4, the number of animals used to generate cross
sections for each time point). In control animals without light exposure, hmbs positive cells are
only observed in the sub-epidermal region (Figure 9B, left panel). At Day 5 of light exposure,
however, a substantial amount of hmbs positive cells can be observed ectopically in the central
parenchyma of the planarians, a region in proximity to the gut (Figure 9B, centre left). On day 7
of light exposure, an overall reduction in the number of hmbs positive cells can be observed
(Figure 9B, centre right). And among the remaining hmbs positive cells, the majority are
positioned ectopically in the central parenchyma region close to the gut. The ectopic expression
of hmbs expression is exacerbated in the Day 10 animals, where in many cross sections the
central parenchyma region becomes the only location of hmbs expression (Figure 9B, right). In
summary, the reduction of pigment cell population, marked by hmbs, and the observation of
inward migration of pigment cells suggest that an active removal of dying pigment cells through
gut excretion likely happens during light exposure. These findings agree with previous apoptosis
analysis using TUNEL by my collaborator, Dr. Jason Pellettieri (Figure 2B, C).
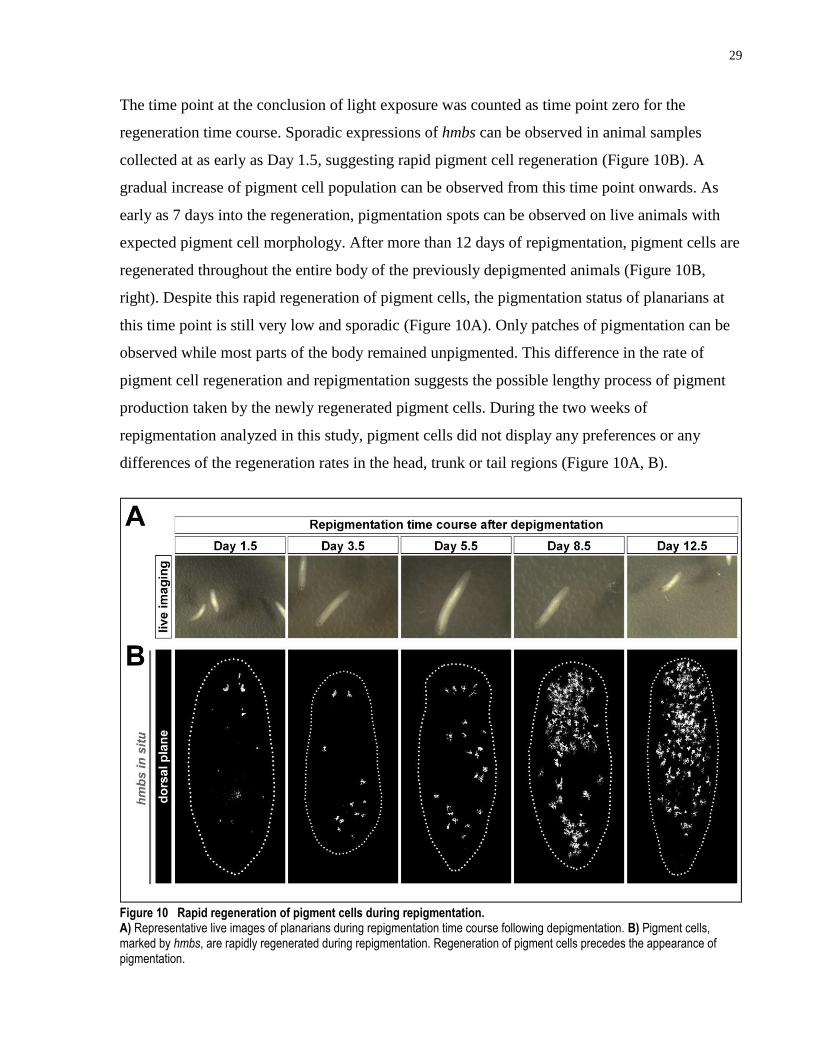
3.1.7 Pigment cells display fast regeneration timeline during repigmentation
After 12 days of light exposure, the depigmented animals were placed in dark allowing for
repigmentation. Whole worm samples were collected during repigmentation (n ≥ 5 for Day 1.5 –
8.5, n = 2 for Day 12.5). And the regeneration of pigment cells was analyzed using hmbs marker.
29
The time point at the conclusion of light exposure was counted as time point zero for the
regeneration time course. Sporadic expressions of hmbs can be observed in animal samples
collected at as early as Day 1.5, suggesting rapid pigment cell regeneration (Figure 10B). A
gradual increase of pigment cell population can be observed from this time point onwards. As
early as 7 days into the regeneration, pigmentation spots can be observed on live animals with
expected pigment cell morphology. After more than 12 days of repigmentation, pigment cells are
regenerated throughout the entire body of the previously depigmented animals (Figure 10B,
right). Despite this rapid regeneration of pigment cells, the pigmentation status of planarians at
this time point is still very low and sporadic (Figure 10A). Only patches of pigmentation can be
observed while most parts of the body remained unpigmented. This difference in the rate of
pigment cell regeneration and repigmentation suggests the possible lengthy process of pigment
production taken by the newly regenerated pigment cells. During the two weeks of
repigmentation analyzed in this study, pigment cells did not display any preferences or any
differences of the regeneration rates in the head, trunk or tail regions (Figure 10A, B).
Figure 10 Rapid regeneration of pigment cells during repigmentation. A) Representative live images of planarians during repigmentation time course following depigmentation. B) Pigment cells, marked by hmbs, are rapidly regenerated during repigmentation. Regeneration of pigment cells precedes the appearance of pigmentation.
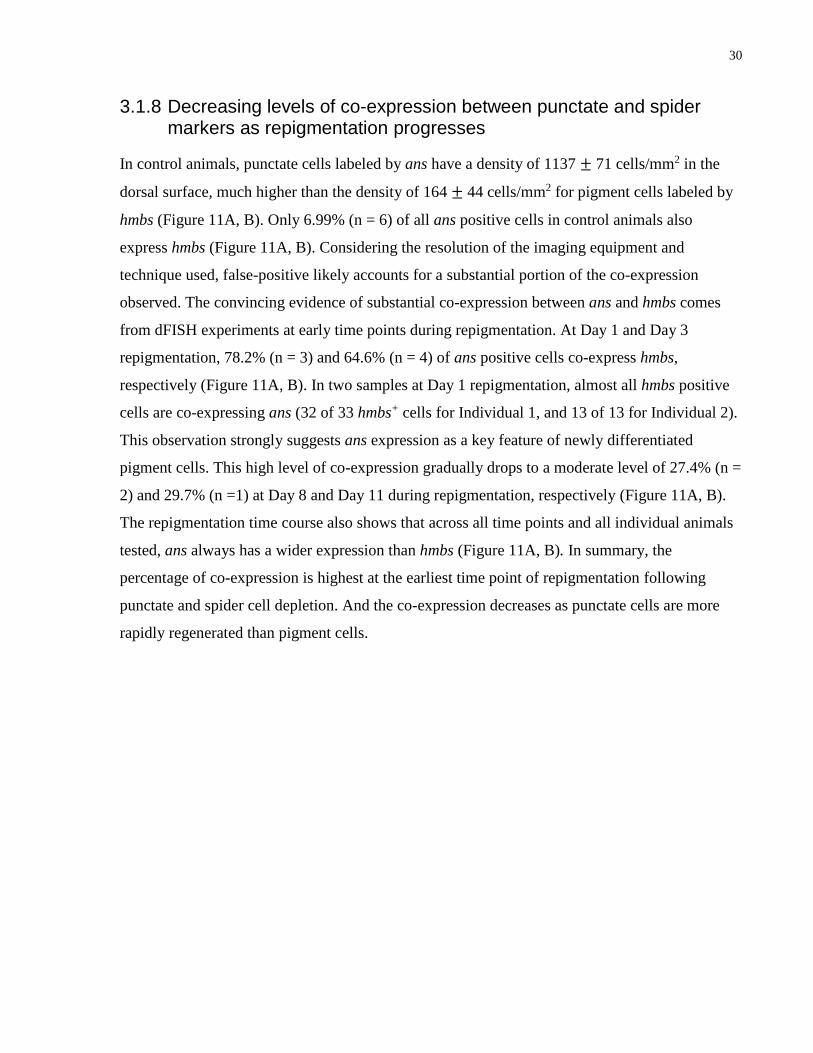
30
3.1.8 Decreasing levels of co-expression between punctate and spider markers as repigmentation progresses
In control animals, punctate cells labeled by ans have a density of 1137 ± 71 cells/mm2 in the
dorsal surface, much higher than the density of 164 ± 44 cells/mm2 for pigment cells labeled by
hmbs (Figure 11A, B). Only 6.99% (n = 6) of all ans positive cells in control animals also
express hmbs (Figure 11A, B). Considering the resolution of the imaging equipment and
technique used, false-positive likely accounts for a substantial portion of the co-expression
observed. The convincing evidence of substantial co-expression between ans and hmbs comes
from dFISH experiments at early time points during repigmentation. At Day 1 and Day 3
repigmentation, 78.2% (n = 3) and 64.6% (n = 4) of ans positive cells co-express hmbs,
respectively (Figure 11A, B). In two samples at Day 1 repigmentation, almost all hmbs positive
cells are co-expressing ans (32 of 33 hmbs+ cells for Individual 1, and 13 of 13 for Individual 2).
This observation strongly suggests ans expression as a key feature of newly differentiated
pigment cells. This high level of co-expression gradually drops to a moderate level of 27.4% (n =
2) and 29.7% (n =1) at Day 8 and Day 11 during repigmentation, respectively (Figure 11A, B).
The repigmentation time course also shows that across all time points and all individual animals
tested, ans always has a wider expression than hmbs (Figure 11A, B). In summary, the
percentage of co-expression is highest at the earliest time point of repigmentation following
punctate and spider cell depletion. And the co-expression decreases as punctate cells are more
rapidly regenerated than pigment cells.
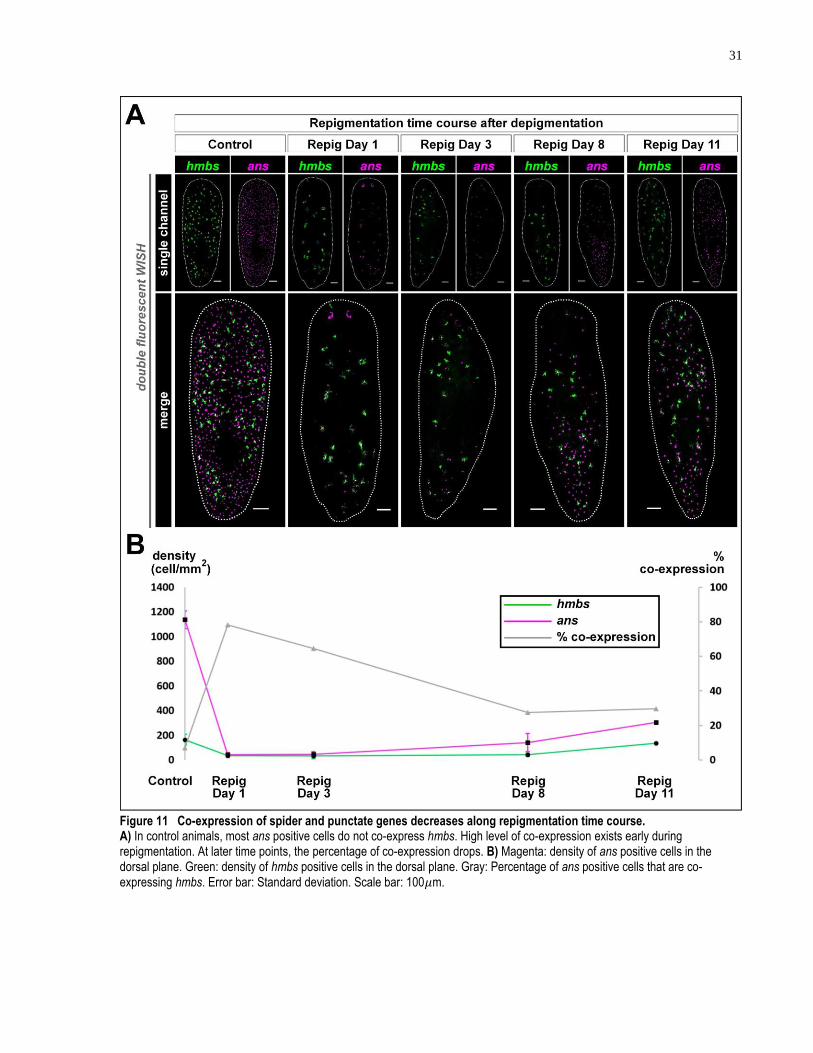
31
Figure 11 Co-expression of spider and punctate genes decreases along repigmentation time course. A) In control animals, most ans positive cells do not co-express hmbs. High level of co-expression exists early during repigmentation. At later time points, the percentage of co-expression drops. B) Magenta: density of ans positive cells in the dorsal plane. Green: density of hmbs positive cells in the dorsal plane. Gray: Percentage of ans positive cells that are co-expressing hmbs. Error bar: Standard deviation. Scale bar: 100𝜇m.
32
3.2 Identified regulators of depigmentation and pigment cell regeneration
3.2.1 hmbs is not required for pigment cell survival
Earlier, I showed that RNAi knockdown of hmbs leads to depigmentation of planarians and
argued the finding to be a functional evidence to establish hmbs as a molecular marker for
pigment cells. I further analyzed hmbs RNAi knockdown to study its effect on pigment cells and
related cells (n ≥ 8 for each of the stains). It is observed that after 12 feedings of hmbs RNAi, the
expression level of hmbs transcripts is no longer detectable by WISH (Figure 12A). On the
contrary, the expression level and the number of cells expressing alas is similar to that in the
control animals (Figure 12A). As mentioned earlier, alas is a redundant marker to hmbs that also
labels pigment cells (Figure 8B). I also tested the effect of hmbs RNAi on the punctate marker
ans, which potentially marks pigment cell progenitors, but found that the expression level and
the population of positive cells are not affected (Figure 12A). This experiment demonstrates that
although hmbs is required for pigment production and maintenance, it is not required for the
survival of pigment cells or their potential progenitor cells.
3.2.2 Presence of pigment is required for light-induced pigment cell loss
Several previous studies suggested that various types of animal pigment can produce reactive
oxygen species (ROS) in response to light exposure. At high levels, ROS is detrimental to
cellular functions and can lead to cell death (Shen et al., 2015; Pospíšil et al., 2014). I
hypothesized that ROS produced by planarian pigment causes pigment cell death and removal
during light exposure. It has been established that hmbs RNAi leads to pigment loss without loss
of pigment cells. Thus, working with hmbs RNAi animals, I investigated the effects of light
exposure on pigment cells without the presence of pigment. Animals were fed with control and
hmbs RNAi food for 10 times. At the conclusion of RNAi feedings, the hmbs RNAi animals
appeared almost unpigmented while the control animals displayed normal body pigmentation (n
= 10 for both). The RNAi animals were then treated with light exposure for 9 days, a period that
is sufficient to completely depigment the control animals. The hmbs RNAi animals remained
unpigmented throughout the light exposure treatment. I then determined the population of
pigment cells in the light exposed animals using the secondary pigment cell marker alas. As
predicted, almost no pigment cells were detectable by WISH in the control RNAi animals
33
Figure 12 hmbs is not required for pigment cell survival and its RNAi offers protection from light exposure. A) WISH analysis of pigment cell lineage markers in control and hmbs RNAi animals. hmbs RNAi results in undetectable levels of hmbs transcripts by WISH, but does not affect the survival of pigment cells, marked by alas, or pigment cell progenitors, marked by ans. B) hmbs RNAi animals retain a population of pigment cells, marked by alas, after 9 days of depigmentation,
while control animals lose all pigment cells. Scale bar: 100𝜇m.
(Figure 12B). In the hmbs RNAi worms, despite appeared as unpigmented, the expression level
of alas remained high in individual cells and the population of alas positive cells remained at a
comparable level to untreated animals (Figure 12B). These results support the hypothesis of ROS
generated by body pigment in response to light being the cause of planarian depigmentation and
pigment cell loss after light exposure.
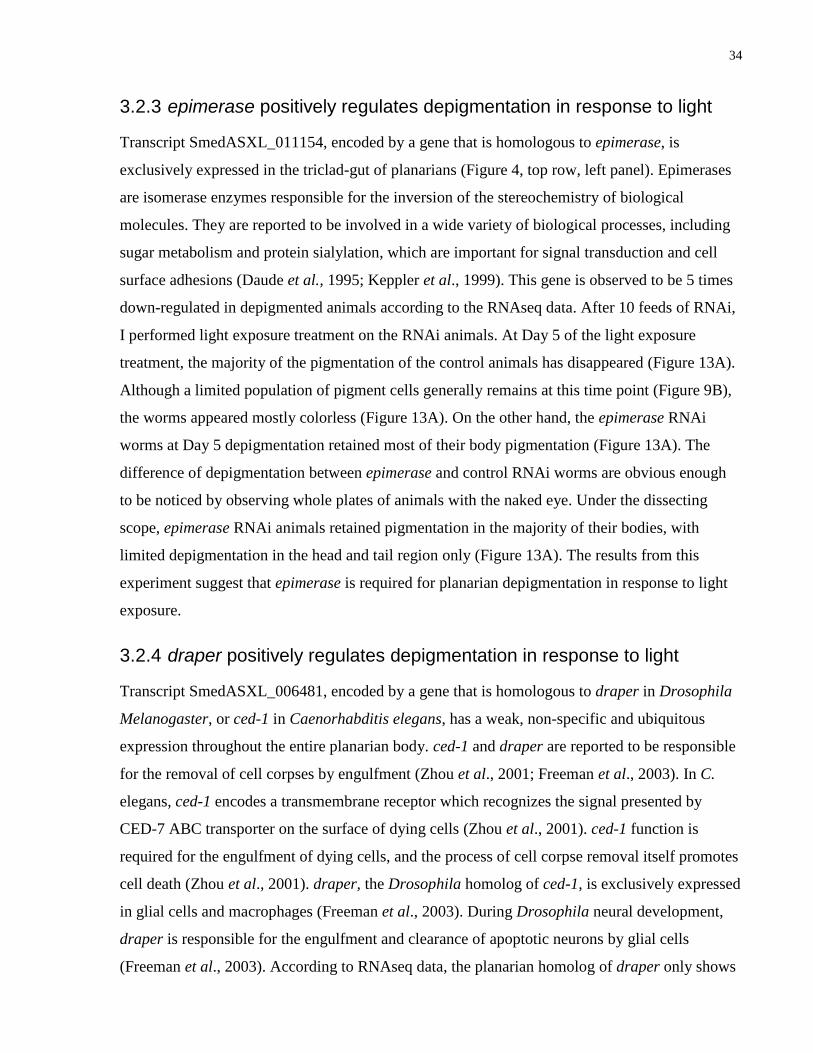
34
3.2.3 epimerase positively regulates depigmentation in response to light
Transcript SmedASXL_011154, encoded by a gene that is homologous to epimerase, is
exclusively expressed in the triclad-gut of planarians (Figure 4, top row, left panel). Epimerases
are isomerase enzymes responsible for the inversion of the stereochemistry of biological
molecules. They are reported to be involved in a wide variety of biological processes, including
sugar metabolism and protein sialylation, which are important for signal transduction and cell
surface adhesions (Daude et al., 1995; Keppler et al., 1999). This gene is observed to be 5 times
down-regulated in depigmented animals according to the RNAseq data. After 10 feeds of RNAi,
I performed light exposure treatment on the RNAi animals. At Day 5 of the light exposure
treatment, the majority of the pigmentation of the control animals has disappeared (Figure 13A).
Although a limited population of pigment cells generally remains at this time point (Figure 9B),
the worms appeared mostly colorless (Figure 13A). On the other hand, the epimerase RNAi
worms at Day 5 depigmentation retained most of their body pigmentation (Figure 13A). The
difference of depigmentation between epimerase and control RNAi worms are obvious enough
to be noticed by observing whole plates of animals with the naked eye. Under the dissecting
scope, epimerase RNAi animals retained pigmentation in the majority of their bodies, with
limited depigmentation in the head and tail region only (Figure 13A). The results from this
experiment suggest that epimerase is required for planarian depigmentation in response to light
exposure.
3.2.4 draper positively regulates depigmentation in response to light
Transcript SmedASXL_006481, encoded by a gene that is homologous to draper in Drosophila
Melanogaster, or ced-1 in Caenorhabditis elegans, has a weak, non-specific and ubiquitous
expression throughout the entire planarian body. ced-1 and draper are reported to be responsible
for the removal of cell corpses by engulfment (Zhou et al., 2001; Freeman et al., 2003). In C.
elegans, ced-1 encodes a transmembrane receptor which recognizes the signal presented by
CED-7 ABC transporter on the surface of dying cells (Zhou et al., 2001). ced-1 function is
required for the engulfment of dying cells, and the process of cell corpse removal itself promotes
cell death (Zhou et al., 2001). draper, the Drosophila homolog of ced-1, is exclusively expressed
in glial cells and macrophages (Freeman et al., 2003). During Drosophila neural development,
draper is responsible for the engulfment and clearance of apoptotic neurons by glial cells
(Freeman et al., 2003). According to RNAseq data, the planarian homolog of draper only shows
35
Figure 13 RNAi phenotypes of epimerase, draper and fst. A) epimerase RNAi leads to decreased rate of depigmentation. B) draper RNAi leads to decreased pigment cell removal during light exposure. C) draper RNAi leads to the formation of pigment-less patches on planarian skin. D) fst RNAi leads to increased rate of pigment cell regeneration during repigmentation. E) fst RNAi leads to increased rate of pigment cell production during homeostasis. Percentages of increase in the head, trunk and tail regions are shown in the right panel. Scale bar: 100𝜇m.
36
a moderate 1.3-fold downregulation in the depigmented animals. I tested its effects on light-
induced depigmentation to determine whether it is required for the clearance of dying pigment
cells. I performed 10 feeds of RNAi and then placed the animals under light exposure treatment.
After 6 days of light exposure treatment, the control animals had no pigment cells remaining as
detected by marker hmbs (n = 5) (Figure 13B). At the same time point, however, draper RNAi
worms still had large numbers of pigment cells in the sub-epidermal layer (n = 6) (Figure 13B).
The impaired pigment cell clearance during light exposure in draper RNAi worms is not biased
toward the head, trunk or tail regions. Locally, however, the distribution of remaining pigment
cells is inconsistent, with randomly distributed pigment cell-free patches and pigment cell-
concentrated areas.
3.2.5 Disruption of draper function leads to formation of wrinkles on epidermis and ectopic expressions of lineage markers
In addition to the defective pigment cell removal caused by draper RNAi, the treated animals
also display wrinkles on their skin tissues. Specifically, during the post-feeding homeostasis,
wrinkles were formed across the entire epidermis, with uniform severity from head to tail. In
addition, draper RNAi worms display pigment-less patches at random locations of the animal
body. A closer look at these patches reveals that they are uprising bumps on the skin. I confirmed
the absence of pigment cells in the pigment-less patches by performing WISH of hmbs on 14
days post-feeding homeostatic RNAi worms (n = 5). In comparison to control, the tissue bumps
in draper RNAi animals were completely devoid of hmbs positive cells (Figure 13C). The
cellular composition in these tissue bumps is unclear and their relation to the defective pigment
cell removal during light exposure is not understood. To address these questions, I tested the
expression of epidermal lineage markers in 10-feed RNAi animals after 14 days of homeostasis
following the last RNAi feed (n ≥ 4 for intact animals of each condition; n = 2, the number of
animals used for both types of axial cross sections). In control animals, piwi-1, a stem cell
marker, is solely expressed in the parenchyma and is absent from the epidermis marked by vim-1
(Figure 14A). The stem cell compartment labeled by piwi-1 is clearly separated from the
epidermal cells, with a gap constituted of other cell types, as shown in axial cross sections of the
dFISH samples (Figure 14A). Early progeny cells in the epidermal lineage, marked by prog-2,
are situated closer to the epidermis than piwi-1 cells, but are absent in the outermost layer of the
planarian tissue, as evidenced by the lack of prog-2 expression at the edges of dorsal planes
37
(Figure 14B). In the draper RNAi animals, however, the compartmentalized expression of both
piwi-1 and prog-2 is disrupted. piwi-1 and prog-2 positive cells can be detected in close
proximity to vim-1 cells and at the outermost edges of dorsal planes (Figure 14A, B). In axial
cross sections, piwi-1 positive cells show smaller gap with vim-1 cells, and ectopic expressions
of piwi-1 can be detected directly in the epidermis (Figure 14A). It is also observed that the
consistency of epidermis is disrupted in draper RNAi animals. The epidermis is filled by ridges
and ruptures with ectopic expressions of other lineage markers instead of the distinct smooth and
continuous epidermis marked by vim-1 in control animals. These results suggest that draper is
required for the maintenance of the compartmentalization of gene expressions in planarians. The
loss of planarian tissue integrity is likely contributing to the impaired pigment cell removal
during light exposure in draper RNAi worms. However, it is unclear if this function of draper is
related to its cell corpse removal function reported in other organisms (Zhou et al., 2001;
Freeman et al., 2003).
3.2.6 follistatin negatively regulates pigment cell regeneration and homeostasis
Transcript SmedASXL_012581, encoded by a gene that is homologous to follistatin (fst), has
sparse expression throughout the intact planarian and at the anterior pole (Gaviño et al., 2013;
Roberts-Galbraith et al., 2013). Follistatin is a bioneutralizer of ligands in the TGF-𝛽
superfamily, including activins (Knight, 1996; Roberts-Galbraith et al., 2013). TGF-𝛽 and BMP
ligands bind to cell surface receptors which then directs SMAD proteins to regulate transcription
of downstream effector genes (Rahman et al., 2015; Itoh et al., 2014). fst, as a modulator of
TGF-𝛽 signaling pathway, is important for an array of biological processes, including stem cell
pluripotency maintenance and differentiation (Itoh et al., 2014). Previous studies in planarians
demonstrated that fst displays robust expression near wound sites and its function is required for
regeneration following amputation (Gaviño et al., 2013). RNAi knockdown of fst results in
failure of blastema formation after amputation (Gaviño et al., 2013). Here, I performed
experiments to determine the functional requirement of fst in the regeneration of pigment cells
following light-induced depigmentation. Animals were fed with control or fst RNAi food for 10
times and treated with 10 days of light exposure. After the depigmentation, the worms were
placed in dark allowing repigmentation. Whole worm samples were collected for detection of
pigment cells by hmbs riboprobe. The control animals displayed a normal extent of pigment cell
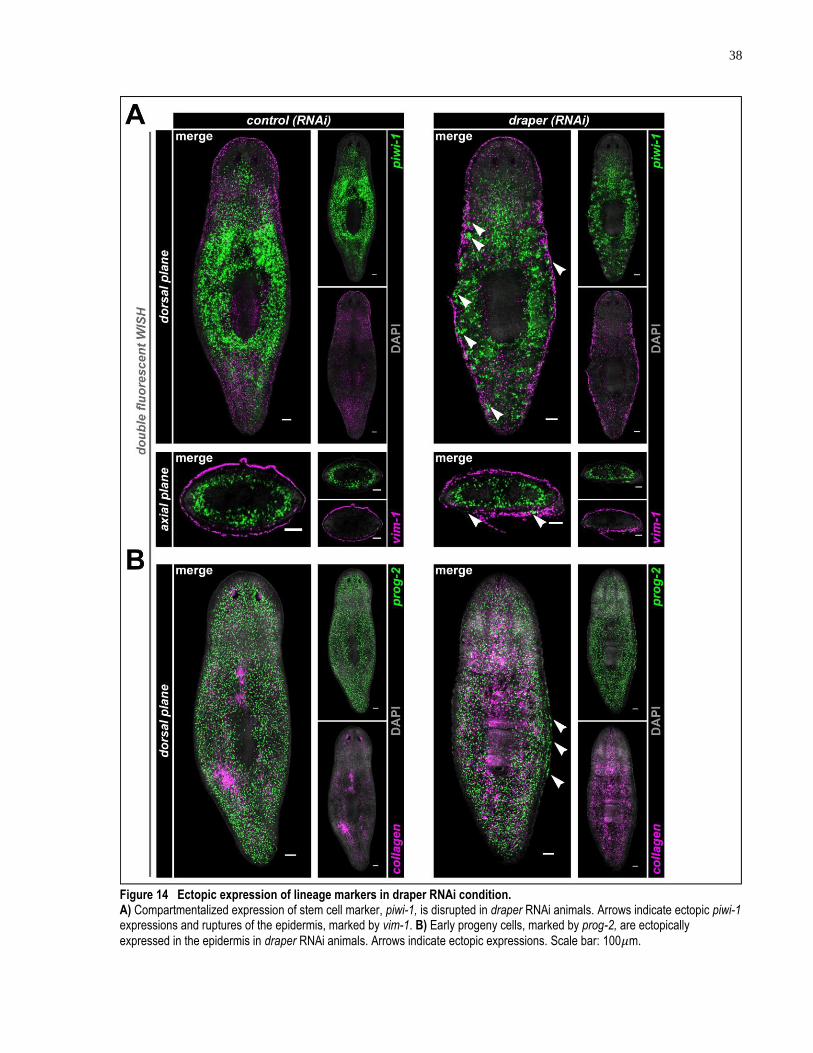
38
Figure 14 Ectopic expression of lineage markers in draper RNAi condition. A) Compartmentalized expression of stem cell marker, piwi-1, is disrupted in draper RNAi animals. Arrows indicate ectopic piwi-1 expressions and ruptures of the epidermis, marked by vim-1. B) Early progeny cells, marked by prog-2, are ectopically
expressed in the epidermis in draper RNAi animals. Arrows indicate ectopic expressions. Scale bar: 100𝜇m.
39
regeneration at Day 8 of repigmentation (n = 6) (Figure 13D). The fst RNAi worms are evidently
more pigmented by viewing the whole plate of animals with the naked eye. Using WISH, a much
larger population of regenerating pigment cells were detected in these animals (n = 4) (Figure
13D). This proliferative phenotype is in contrast to the previously published results
demonstrating the failure of regeneration under fst RNAi conditions. To test whether fst RNAi
affects pigment cell proliferation during homeostasis as well, I collected whole worm samples
after 14 days of homeostasis following the same RNAi treatment. Comparing to the control
animals, the fst RNAi worms displayed a significant increase of pigment cell density across the
entire body, ranging from 14.9% increase in the trunk region to the 54.1% increase in the neck
region (n = 3 for both control and fst RNAi) (Figure 13E). These results suggest that follistatin
negatively regulates pigment cell regeneration and homeostasis.
40
Discussion
My initial molecular characterization of pigment cell lineage in planarians presented a novel
model to study regeneration and ASC regulation. The light-induced depigmentation allows
investigation in the regeneration of specific tissue types without introducing physical injuries. In
addition, the kinetics of pigment cell and progenitor cell regeneration demonstrate distinct modes
of regulations between different stages of lineage specification. Finally, investigations of gut
excretion mediated pigment cell removal identified regulators of potential cell corpse engulfment
mechanism during the depigmentation process. Taken together, these findings provide new
avenues toward future studies in ASC regulation and gut excretion in planarians.
4.1 Identified markers, and established pigment cells as a novel model for ASC and regeneration study
As hypothesized, I have established several genes with reduced expressions in the depigmented
animals as molecular markers for planarian pigment cells. The expression patterns of pigment
cell markers, hmbs and alas, show a high resemblance of previously published pigment cell
morphology (Palladini et al., 1979a). A direct correlation between the expression pattern and the
pigment status of planarian tissue also supports these genes as pigment cell markers. Finally, the
functional requirement of hmbs in the maintenance and production of planarian body pigment
further supports it as a pigment cell marker. The establishment of these molecular markers made
possible to further study the lineage specification and regeneration of pigment cells in planarians.
Combining with the method of pigment cell ablation by acute light exposure, this new model
allows one to dissect the specific regulators of lineage commitment and to investigate the
mechanisms regulating regeneration, without the introduction of physical injuries.
Important insights of the planarian body pigment composition were gained by co-expression
analysis of pigment cell marker hmbs with other related genes. The lack of epidermal expression
patterns of tyrosine metabolism pathway genes suggests that it is unlikely for melanin to be the
planarian body pigment. On the other hand, hmbs highly co-expresses with a key enzyme
encoded by a kmo homolog in the tryptophan metabolism pathway. kmo is responsible for the
synthesis of ommochrome, the pigment that is responsible for the color of silk worm cocoons
and mosquito eyes (Linzen, 1974; Osanai-Futahashi et al., 2012; Han et al., 2003). In addition,
my preliminary results show that kmo RNAi indeed leads to decreased pigmentation, although
41
not as profound as hmbs RNAi. This observation provides a direct link between ommochrome
synthesis and planarian body pigmentation. Considering this link with ommochrome, however, it
is unclear why the function of HMBS is highly required for planarian pigment maintenance.
Both hmbs and alas encode key enzymes in the heme synthesis pathway. But heme is not a direct
component of ommochrome synthesis. Heme is, however, a cofactor required for the enzymatic
activity of TDO and IDO, the enzymes responsible for the initial step of ommochrome synthesis
(Meng et al., 2014; Forouhar et al., 2007; Huang et al., 2013). It is unclear why the perturbation
of heme synthesis has a greater impact on pigmentation than the perturbation of ommochrome
synthesis itself. It is possible that planarian body pigment consists of ommochromes in addition
to some other types of pigments, including porphyrins, in which heme is a direct component.
Further characterization of the composition of body pigment could be key to the understanding
of planarian pigment cells. Additional biochemical assays are necessary to address these
questions, including testing for the presence of cytochrome P450 and cytochrome c in planarian
pigment cells.
Pigment cells marked by hmbs were also observed to migrate inwards toward close proximity of
the gut during light exposure. This observation agrees with the previous findings by my
collaborator that planarian gut darkens and shows increased level of apoptosis during
depigmentation. The unique gut excretion phenomenon awaits further investigation to determine
their possible roles as an active mechanism utilized by planarians for removal of detrimental
cells and contributing to their cancer-free immortal lifestyle. During the repigmentation time
course, I discovered a swift regeneration response of planarian pigment cells, marked by hmbs.
Interestingly, it is known that pigment cells have a low turnover rate. One evidence comes from
the retaining of proper pigmentation in lethally irradiated worms, who possess no stem cells to
produce new pigment cells. The swift regeneration response suggests that a possible feedback
mechanism exists between pigment cells and ASCs allowing the increased level of pigment cell
differentiation in response to reduction of its population size. The punctate markers ans and sds
show a high level of co-expression in pigment cells during early repigmentation. The punctate
cells display a much faster regeneration kinetics, and a population expansion outside of pigment
cells is observed in late repigmentation. These observations suggest that punctate cells are likely
progenitors to mature pigment cells. A few possible explanations can accommodate the different
observations of spider and punctate cell regenerations (Figure 15). First, ans positive cells pause
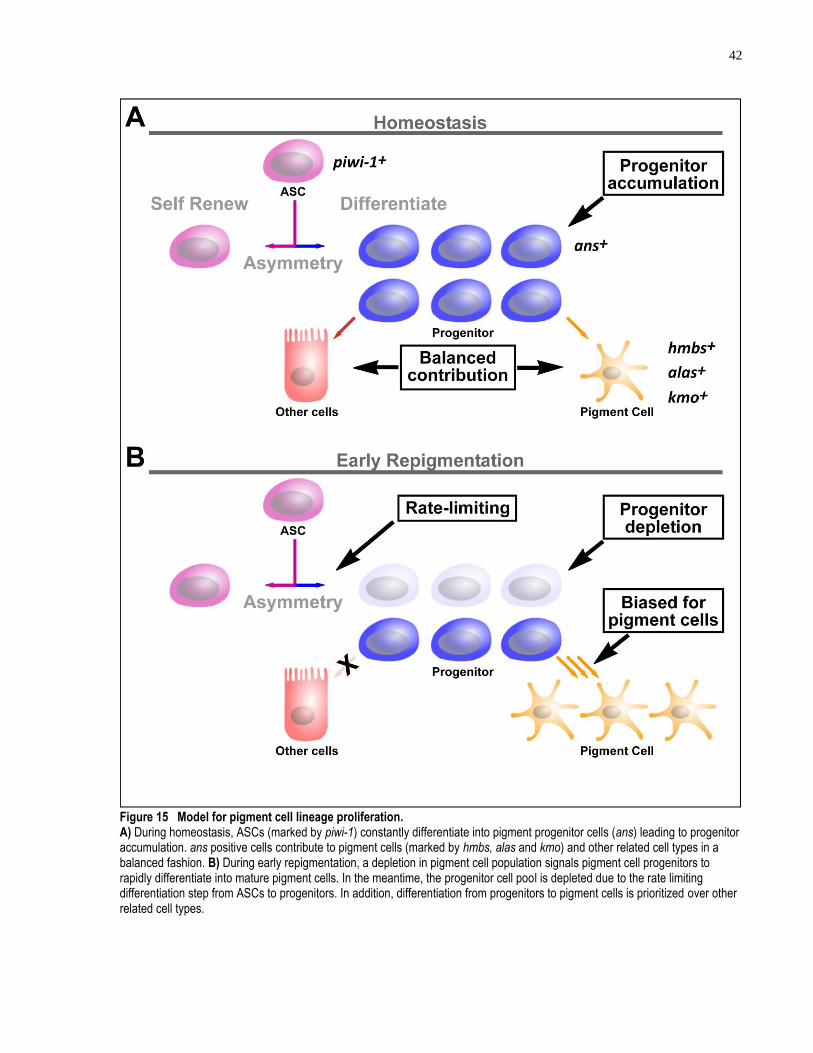
42
Figure 15 Model for pigment cell lineage proliferation. A) During homeostasis, ASCs (marked by piwi-1) constantly differentiate into pigment progenitor cells (ans) leading to progenitor accumulation. ans positive cells contribute to pigment cells (marked by hmbs, alas and kmo) and other related cell types in a balanced fashion. B) During early repigmentation, a depletion in pigment cell population signals pigment cell progenitors to rapidly differentiate into mature pigment cells. In the meantime, the progenitor cell pool is depleted due to the rate limiting differentiation step from ASCs to progenitors. In addition, differentiation from progenitors to pigment cells is prioritized over other related cell types.
43
at the progenitor stage and accumulate due to the slow turnover rate of pigment cells (Figure
15A). After depigmentation, ans positive cells are swiftly turned into mature pigment cells as an
immediate response of regeneration (Figure 15B). However, the step of differentiation from
ASCs to progenitors is likely rate-limiting, thus leading to a depletion of progenitor cell pool
during the regeneration response. As the population of pigment cells increases, the differentiation
step from progenitor cells to mature pigment cells is slowed down, and progenitor cells are
accumulated again. These explanations corroborate with the observations of the depletion of
punctate cells during depigmentation, and the much larger population of punctate cells than
pigment cells. Second, ans positive cells may also contribute to the differentiation of other
related cell types. During homeostasis, progenitor cells adopt a balanced contribution toward
pigment cells and other cell types (Figure 15A). In the event of depigmentation, contribution
toward pigment cells is likely prioritized over other cell types (Figure 15B). These explanations
corroborate with the observation of extensive co-expression between punctate and pigment
markers during early repigmentation.
4.2 Regulation of depigmentation and pigment cell regeneration
A number of genes were screened by RNAi to investigate their functions in depigmentation and
pigment cell regeneration. Among the genes with down-regulation in depigmented animals,
epimerase, hmbs and alas were observed to regulate depigmentation. Among both the up- and
down-regulated genes, however, regulators of pigment cell lineage specification were not
identified. Nevertheless, RNAi studies of draper and fst, which are candidate genes with reported
functions in cell corpses removal and missing tissue response, generated intriguing phenotypes
(Zhou et al., 2001; Freeman et al., 2003; Gaviño et al., 2013). The RNAi screens proved the
principle that important regulators of pigment cell biology can be identified by analysis of
differentially expressed genes, especially for genes with roles in depigmentation. It is noticed,
however, that essentially no transcription factors were picked up in the RNAseq data with a two-
fold change cut-off in differential expression of depigmented animals. It is possible that some
transcription factors only require subtle changes in their own expression to initiate transcription
of the downstream target and amplify the effect of its transcriptional regulation. These subtle
changes are likely masked by the overwhelming background of transcriptional events in
unrelated cell types in the whole worm sample used for RNAseq. Considering the relatively large
sizes of animal samples used for RNAseq in this study, the minute changes of transcription
44
factors in a small portion of pigment and pigment progenitor cells are likely not picked up by the
whole worms RNAseq.
Demonstrated by the hmbs RNAi experiment, the presence of pigment is required for the light-
induced pigment cell loss (Figure 12B). This observation supports the hypothesis that planarian
pigment generates ROS after light exposure and thus lead to pigment cell death. More
importantly, this finding demonstrates that light exposure induced cell ablation is specific to
pigment-containing cells. It indicates that the novel method of light-induced depigmentation
would indeed allow us to identify regulators specific to the pigment cell lineage. Also, it means
that pigment progenitor cells are unlikely to be ablated by light exposure, due to their lack of
pigment. The depletion of pigment progenitor cells is likely due to the rapid pigment cell
maturation and rate-limiting ASC differentiation, as proposed earlier (Figure 15A, B).
The decreased expression level of epimerase in depigmented animals (from RNAseq results)
suggests that epimerase expressing cell may sacrifice themselves during the potential engulfment
and gut excretion of cellular corpses. The gut expression pattern of epimerase corroborates with
its potential gut excretion function during depigmentation. It is unlikely for all types of cells
undergone gut excretion, including those induced by p53 RNAi or mex-3 RNAi, to be capable of
migration to gut for clearance. In comparison, a commonly used mechanism, such as engulfment
and transportation by macrophage-like cells, is more likely to exist. If the macrophage-like cells
themselves are lost during the process of gut excretion, then it explains the observation of a
reduced expression in depigmented animals, a state that requires intensive gut excretion and
possibly major loss of these cells. It is possible that the epimerase identified here is enriched in
such macrophage-like cells and plays a crucial role in the engulfment and gut excretion processes
(Figure 16).
Two possible functions of draper may account for its involvement in depigmentation. First,
draper may function in planarians similar to its homolog in other organisms by regulating cell
corpse removal (Zhou et al., 2001; Freeman et al., 2003). Thus, its functional perturbation leads
to reduced pigment cell removal via gut excretion (Figure 16). Second, draper may regulate the
location and the rate of proliferation of multiple cell types, including pigment cells, as suggested
by the ectopic piwi-1 and prog-2 expressions in draper RNAi (Figure 16). I was not able to
quantify the density of pigment cells under draper RNAi condition due to the altered cellular
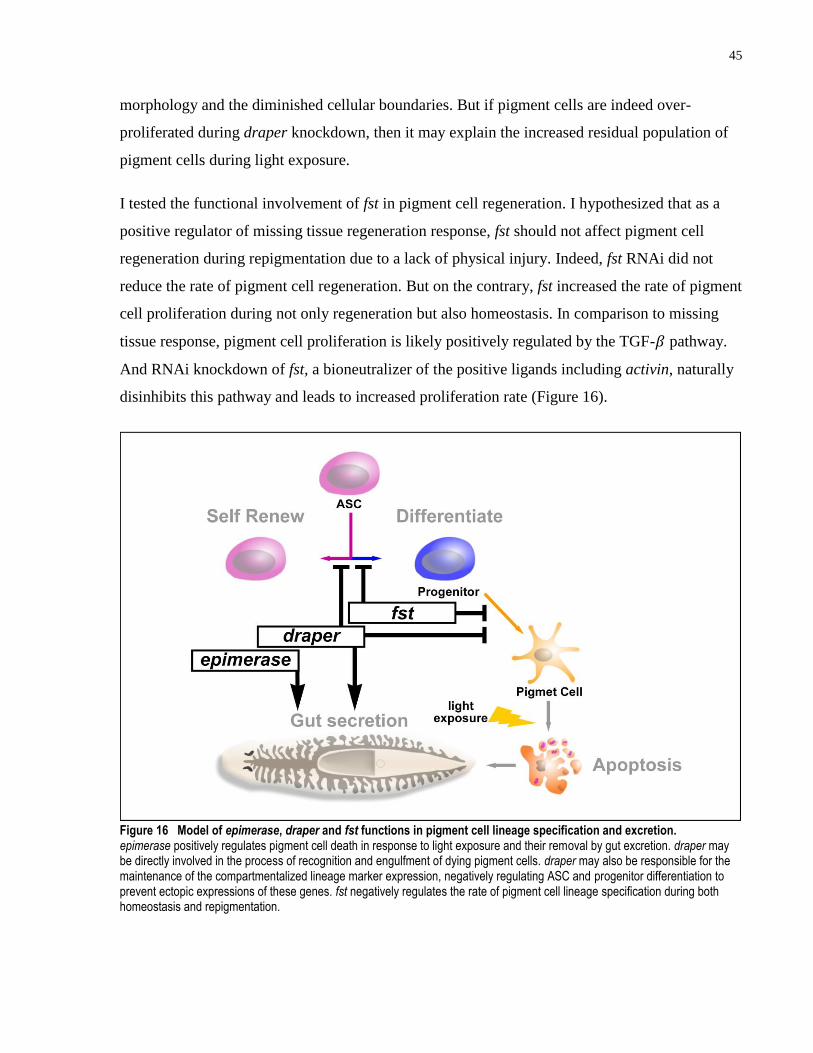
45
morphology and the diminished cellular boundaries. But if pigment cells are indeed over-
proliferated during draper knockdown, then it may explain the increased residual population of
pigment cells during light exposure.
I tested the functional involvement of fst in pigment cell regeneration. I hypothesized that as a
positive regulator of missing tissue regeneration response, fst should not affect pigment cell
regeneration during repigmentation due to a lack of physical injury. Indeed, fst RNAi did not
reduce the rate of pigment cell regeneration. But on the contrary, fst increased the rate of pigment
cell proliferation during not only regeneration but also homeostasis. In comparison to missing
tissue response, pigment cell proliferation is likely positively regulated by the TGF-𝛽 pathway.
And RNAi knockdown of fst, a bioneutralizer of the positive ligands including activin, naturally
disinhibits this pathway and leads to increased proliferation rate (Figure 16).
Figure 16 Model of epimerase, draper and fst functions in pigment cell lineage specification and excretion. epimerase positively regulates pigment cell death in response to light exposure and their removal by gut excretion. draper may be directly involved in the process of recognition and engulfment of dying pigment cells. draper may also be responsible for the maintenance of the compartmentalized lineage marker expression, negatively regulating ASC and progenitor differentiation to prevent ectopic expressions of these genes. fst negatively regulates the rate of pigment cell lineage specification during both homeostasis and repigmentation.
46
4.3 Future directions
4.3.1 Deeper analysis of pigment cell and potential progenitors
Further evidence can be gathered to support ans positive cells as pigment cell progenitors. If
punctate cells marked by ans are indeed progenitors, then a higher percentage of PIWI protein
co-expression shall be observed in punctate cells than in mature pigment cells. The piwi
transcripts are well-established markers for the ASC population in planarians (Reddien et al.,
2005). The PIWI protein, on the other hand, persists slightly longer than the piwi transcripts in
cells that have recently undergone differentiation. It is thus a good marker of early progenies. A
higher percentage of PIWI co-expression in punctate cells would indicate that punctate cells are
more upstream in the lineage specification than the mature pigment cells. Similarly, BrdU, a
thymidine analog, can be used to detect recent DNA replications (Newmark and Sánchez
Alvarado, 2000). In planarians, ASCs are the only dividing cells (Eisenhoffer et al., 2008). The
rate of BrdU signal appearance in the post-mitotic tissue is a direct indicator of their turnover
rate from ASCs. If BrdU is sooner and more abundantly detected in punctate cells than mature
pigment cells, then punctate cells are more upstream in the lineage specification.
Earlier I presented a model that pigment cell lineage specification may pause at punctate cell
stage, and these cells act as a reserve for immediate pigment cell regeneration response. To test
this model, the regeneration of pigment cells in late-repigmenting and lethally irradiated (using 𝛾
irradiation to eliminate all dividing cells) animals can be analyzed. It has been demonstrated that
at later stage of repigmentation, the population of punctate cells is much greater than that of
pigment cells (Figure 11A, B). At the same time, the regeneration of pigment cells is incomplete.
If the pigment cells can continue to regenerate after irradiation, without additional ASC
divisions, then it would strongly argue punctate cells as an intermediate stage of lineage
specification, and as progenitors of mature pigment cells.
4.3.2 Continued screening of pigment cell lineage markers and regulators
In order to overcome the low detection rate of differentially expressed transcription factors in the
current RNAseq data of depigmentation time course, a new RNAseq dataset was generated.
Whole worm samples much smaller in size were used to produce the new RNAseq dataset. One
finding in this new RNAseq dataset is that the pigment cell marker hmbs established previously
47
shows the highest level of down-regulation in the depigmented samples, with a striking 109-fold
reduction in the transcript level, comparing to that of 13-fold in the old RNAseq data. With the
smaller worm samples, changes in the small subset of pigment cell population can be more
readily detected in the whole worm RNAseq, especially for the subtly changing transcription
factors. Using a hidden Markov model, a list of potential transcription factors has also been
generated based on homology to known transcription factors in other organisms and conserved
DNA binding domains. More pigment cell lineage markers and regulators should be screened
using a combination of these new datasets.
In addition to the whole worm RNAseq datasets, I have also attempted isolation of pigment cells
for single-cell RNAseq by fluorescent activated cell sorting (FACS). No fluorescent stains were
used for labeling of pigment cells during the past attempts. It is important to continuing
optimizing the detection of absorption by pigment cells in various wavelength. Once the
absorption profile of pigment cells is established by comparing cell suspensions prepared from
pigmented and unpigmented animals, the pigment cells can then be isolated by the cell sorter
based on these parameters. It is also shown in a recently published study that single cell
transcriptomes can be generated from RNAseq of de-cross-linked cellular samples (Thomsen et
al., 2015). Robust fluorescent labeling of pigment cells by hmbs has been generated by dFISH
with a formaldehyde fixation step. Once the de-cross-link method is optimized in the planarian
system, fixed cells sorted by FACS with hmbs marker can then be used for generation of pigment
cell transcriptome. Specific transcription factors expressed and required for pigment cell identity
maintenance can then be identified in this transcriptome.
A recent report has established subclasses within the planarian stem cell compartment, with
different subclasses contributing to different lineages of tissue types (van Wolfswinkel et al.,
2014). It is crucial to test if the transcription factors that determine the epidermal/ectoderm
lineage, such as zfp-1¸ can specifically regulate the regeneration of pigment cells. The effect of
zfp-1 on pigment cell regeneration can be compared to that of hnf4 and gata4/5/6
(endoderm/intestinal lineage) to determine which lineage are pigment cells more related to (van
Wolfswinkel et al., 2014). RNAi-based functional analysis of these transcription factors during
planarian repigmentation would allow us to at least categorize pigment cells into the general
subclasses of the tissue lineages they define.
48
4.3.3 Further analysis of depigmentation regulators
The level of ROS under epimerase and draper RNAi conditions can be detected by published
methods, including localization of ROS in the planarian tissue (Tarpey et al., 2004). This is key
to determining whether these genes function to reduce the ROS level, or to excrete dying
pigment cells during light exposure. The expression patterns of epimerase and draper should
also be generated in depigmented animals, in order to determine if they have dynamic expression
patterns during depigmentation and gut excretion. These experiments will be able to associate
epimerase and draper with their potential functions. In addition, the level of apoptosis in
normally pigmented and depigmenting animals should be determined using TUNEL as
previously described (Lin and Pearson, 2014). An increased level of TUNEL stains is expected
in epimerase or draper RNAi animals if these genes indeed involved in the engulfment of dying
cells and the gut excretion. The knockdown of these genes will lead to an accumulation of dying
cells that can be detected by TUNEL.
In order to establish epimerase and draper as regulators for gut excretion, it is key to
demonstrating that they regulate other types of gut excretion as well. These include the mex-3
RNAi induced prog-2 positive cell excretion, and the p53 RNAi induced cycB positive cell
excretion (Zhu et al., 2015; Pearson and Sánchez Alvarado, 2010). mex-3 and p53 RNAi
treatments should be performed in epimerase or draper RNAi background to determine if either
gut excretion process is affected.
Further investigation is necessary to better characterize the mechanisms leading to the ectopic
expressions of piwi-1 and prog-2 observed in draper RNAi animals. Phospho-histone H3 (H3P)
is a specific marker of dividing cells during metaphase. H3P signal and BrdU incorporation
studies can be performed in draper RNAi worms to determine if the cells that are ectopically
expressing piwi are also actively dividing. This experiment will provide evidence on whether
these cells contribute to ectopic tissue differentiation and outgrowth.
4.3.4 Further analysis of pigment cell regeneration regulators
fst is the only regulator of pigment cell regeneration investigated in this thesis. For fst, and for all
future pigment cell regeneration regulators to be discovered, the specificity of its regulation in
the pigment cell lineage should be determined. The proliferation of multiple tissue types under
49
RNAi conditions of various regulators can be determined by monitoring the level of BrdU
incorporation and the extent of PIWI protein co-expression in relation to expressions of lineage
specific markers, such as gata4/5/6, chat, hmbs, and ans (van Wolfswinkel et al., 2014; Currie
and Pearson, 2013). For a specific regulator of pigment cell lineage, it is expected that the
pigment cell proliferation shows the most dramatic changes under RNAi conditions of the
regulators while the other lineages are largely unaffected. Otherwise, the regulators would be
deemed to function in a wider range of differentiation activities and are not specific to the
pigment cell lineage.
4.3.5 Comparative transcriptomics for identification of gut excretion regulators
It is likely that active regulators of planarian gut excretion will display altered expression level
during gut excretion events. Looking at only one type of gut excretion event, however, is hard to
differentiate between true regulators of gut excretion from other irrelevant genes with altered
expression levels. For instance, wound response genes, including egr-3, hadrian and smed-mapk,
are up-regulated in depigmented animals, potentially confound the identification of regulators
specific for gut excretion (Wenemoser and Reddien, 2010; Wenemoser et al., 2012). On the
other hand, comparative transcriptomics by analyzing commonly altered gene expressions
among different gut excretion events would allow identification of key shared regulators. Genes
identified with this method can then be tested in each of the gut excretion events, including light
exposure-induced, mex-3 RNAi induced, and p53 RNAi induced to verify their functions.
50
References
Aboobaker AA. (2011) Planarian stem cells: a simple paradigm for regeneration. Trends Cell
Biol. 21:304-311.
Aguinaldo AM, Turbeville JM, Linford LS, Rivera MC, Garey JR, Raff RA, Lake JA. (1997)
Evidence for a clade of nematodes, arthropods and other moulting animals. Nature. 387:489-
493.
Ando H, Kondoh H, Ichihashi M, Hearing VJ. (2007) Approaches to identify inhibitors of
melanin biosynthesis via the quality control of tyrosinase. J Invest Dermatol. 127:751-761.
Bayraktar OA, Boone JQ, Drummond ML, Doe CQ. (2010) Neural Dev. 5:26.
Benazzi M, Ballester R, Baguñà J, and Puccinelli I. (1972) The fissiparous race of the planarian
Dugesia lugubris S. L. found in Barcelona (Spain) belongs to the biotype g: comparative
analysis of the karyotypes. Caryologia 25:59-68.
Bishop DF. (1990) Two different genes encode delta-aminolevulinate synthase in humans:
nucleotide sequences of cDNAs for the housekeeping and erythroid genes. Nucleic Acids Res.
18:7187-7188.
Bossing T, Udolph G, Doe CQ, Technau GM. (1996) The embryonic central nervous system
lineages of Drosophila melanogaster. I. Neuroblast lineages derived from the ventral half of
the neuroectoderm. Dev Biol. 179:41-64.
Brockes JP. (1997) Amphibian limb regeneration: rebuilding a complex structure. Science.
276:81-87.
Brøndsted HV. (1969) Planarian regeneration. London: Pergamon Press.
Cantor JR, Stone EM, Chantranupong L, Georgiou G. (2009) The human asparaginase-like
protein 1 hASRGL1 is an Ntn hydrolase with beta-aspartyl peptidase activity. Biochemistry.
48:11026-11031.
Carranza S, Baguñà J, Riutort M. (1997) Are the Platyhelminthes a monophyletic primitive
group? An assessment using 18S rDNA sequences. Mol Biol Evol. 14:485-497.
Cebrià F. (2007) Regenerating the central nervous system: how easy for planarians! Dev Genes
Evol. 217:733-748.
Cebrià F, Kudome T, Nakazawa M, Mineta K, Ikeo K, Gojobori T, Agata K. (2002) The
expression of neural-specific genes reveals the structural and molecular complexity of the
planarian central nervous system. Mech Dev. 116:199-204.
Croucher PJ, Brewer MS, Winchell CJ, Oxford GS, Gillespie RG. (2013) De novo
characterization of the gene-rich transcriptomes of two color-polymorphic spiders, Theridion
51
grallator and T. californicum (Araneae: Theridiidae), with special reference to pigment genes.
BMC Genomics. 14:862.
Currie KW, Pearson BJ. (2013) Transcription factors lhx1/5-1 and pitx are required for the
maintenance and regeneration of serotonergic neurons in planarians. Development. 140:3577-
3588.
Daude N, Gallaher TK, Zeschnigk M, Starzinski-Powitz A, Petry KG, Haworth IS, Reichardt JK.
(1995) Molecular cloning, characterization, and mapping of a full-length cDNA encoding
human UDP-galactose 4'-epimerase. Biochem Mol Med. 56:1-7.
De Robertis EM, Sasai Y. (1996) A common plan for dorsoventral patterning in Bilateria.
Nature. 380:37-40.
Doe CQ. (1996) Asymmetric cell division and neurogenesis. Curr Opin Genet Dev. 6:562-566.
Doe CQ. (2008) Neural stem cells: balancing self-renewal with differentiation. Development.
135:1575-1587.
Doe CQ, Bowerman B. (2001) Asymmetric cell division: fly neuroblast meets worm zygote.
Curr Opin Cell Biol. 13:68-75.
Eastman C, Horvitz HR, Jin Y. (1999) Coordinated transcriptional regulation of the unc-25
glutamic acid decarboxylase and the unc-47 GABA vesicular transporter by the
Caenorhabditis elegans UNC-30 homeodomain protein. J Neurosci. 19:6225-6234.
Eisenhoffer GT, Kang H, Sánchez Alvarado A. (2008) Molecular analysis of stem cells and their
descendants during cell turnover and regeneration in the planarian Schmidtea mediterranea.
Cell Stem Cell. 3:327-339.
Elliott SA, Sánchez Alvarado A. (2013) The history and enduring contributions of planarians to
the study of animal regeneration. Wiley Interdiscip Rev Dev Biol. 2:301-326.
Forouhar F, Anderson JL, Mowat CG, Vorobiev SM, Hussain A, Abashidze M, Bruckmann C,
Thackray SJ, Seetharaman J, Tucker T, Xiao R, Ma LC, Zhao L, Acton TB, Montelione GT,
Chapman SK, Tong L. (2007) Molecular insights into substrate recognition and catalysis by
tryptophan 2,3-dioxygenase. Proc Natl Acad Sci U S A. 104:473-478.
Flames N, Hobert O. (2009) Gene regulatory logic of dopamine neuron differentiation. Nature.
458:885-889.
Forsthoefel DJ, Park AE, Newmark PA. (2011) Stem cell-based growth, regeneration, and
remodeling of the planarian intestine. Dev Biol. 356:445-59.
Freeman MR, Delrow J, Kim J, Johnson E, Doe CQ. (2003) Unwrapping glial biology: Gcm
target genes regulating glial development, diversification, and function. Neuron 38:567–580.
Gaviño MA, Wenemoser D, Wang IE, Reddien PW. (2013) Tissue absence initiates regeneration
through follistatin-mediated inhibition of activin signaling. Elife. 2:e00247.
52
Grandchamp B, De Verneuil H, Beaumont C, Chretien S, Walter O, Nordmann Y. (1987)
Tissue-specific expression of porphobilinogen deaminase. Two isoenzymes from a single
gene. Eur J Biochem. 162:105-110.
Han Q, Calvo E, Marinotti O, Fang J, Rizzi M, James AA, Li J. (2003) Analysis of the wild-type
and mutant genes encoding the enzyme kynurenine monooxygenase of the yellow fever
mosquito, Aedes aegypti. Insect Mol Biol. 12:483-490.
Hase S, Wakamatsu K, Fujimoto K, Inaba A, Kobayashi K, Matsumoto M, Hoshi M, Negishi S.
(2006) Characterization of the pigment produced by the planarian, Dugesia ryukyuensis.
Pigment Cell Res. 19:248-249.
Hayashi T, Asami M, Higuchi S, Shibata N, Agata K. (2006) Isolation of planarian X-ray-
sensitive stem cells by fluorescence-activated cell sorting. Dev Growth Differ. 48:371-380.
Hobert O. (2011) Regulation of terminal differentiation programs in the nervous system. Annu
Rev Cell Dev Biol. 27:681-696.
Huang W, Gong Z, Li J, Ding J. (2013) Crystal structure of Drosophila melanogaster tryptophan
2,3-dioxygenase reveals insights into substrate recognition and catalytic mechanism. J Struct
Biol. 181:291-299.
Iten LE, Bryant SV. (1976) Stages of tail regeneration in the adult newt, Notophthalmus
viridescens. J Exp Zool. 196:283-292.
Itoh F, Watabe T, Miyazono K. (2014) Roles of TGF-β family signals in the fate determination
of pluripotent stem cells. Semin Cell Dev Biol. 32:98-106.
Kao D, Felix D, Aboobaker A. (2013) The planarian regeneration transcriptome reveals a shared
but temporally shifted regulatory program between opposing head and tail scenarios. BMC
Genomics. 14:797.
Keppler OT, Hinderlich S, Langner J, Schwartz-Albiez R, Reutter W, Pawlita M. (1999) UDP-
GlcNAc 2-epimerase: a regulator of cell surface sialylation. Science. 284:1372-1376.
Knight PG. (1996) Roles of inhibins, activins, and follistatin in the female reproductive system.
Front Neuroendocrinol. 17:476-509.
Krichinskaya EB, Martynova MG. (1975) Distribution of neoblasts and mitoses during the
asexual reproduction of the planarian Dugesia tigrina (Girard). Sov J Dev Biol. 5:309-314.
Labbé RM, Irimia M, Currie KW, Lin A, Zhu SJ, Brown DD, Ross EJ, Voisin V, Bader GD,
Blencowe BJ, Pearson BJ. (2012) A comparative transcriptomic analysis reveals conserved
features of stem cell pluripotency in planarians and mammals. Stem Cells. 30:1734-1745.
Lange MM. (1920) On the regeneration and finer structure of the arms of the cephalopods. J Exp
Zool. 31:1-57.
53
Lauter G, Söll I, Hauptmann G. (2011) Two-color fluorescent in situ hybridization in the
embryonic zebrafish brain using differential detection systems. BMC Dev Biol. 11:43.
Lenhoff SG, Lenhoff HM. (1986) Hydra and the birth of experimental biology, 1744: Abraham
Trembley's Memoirs concerning the natural history of a type of freshwater polyp with arms
shaped like horns. Pacific Grove, California: Boxwood Press. 1986.
Lin AY, Pearson BJ. (2014) Planarian yorkie/YAP functions to integrate adult stem cell
proliferation, organ homeostasis and maintenance of axial patterning. Development.
141:1197-208
Linzen B. (1974) The tryptophan-ommochrome pathway in insects. Insect Physiol. 10:117-246.
Meng B, Wu D, Gu J, Ouyang S, Ding W, Liu ZJ. (2014) Structural and functional analyses of
human tryptophan 2,3-dioxygenase. Proteins. 82:3210-3216.
Michalopoulos GK, DeFrances MC. (1997) Liver regeneration. Science. 276:60-66.
Morgan TH. (1901) Columbia University Biological series: Regeneration, Vol. VII. New York:
The Macmillan Company.
Needham AE. (1952) Regeneration and wound-healing. New York: John Wiley & Sons, Inc.
Newmark PA, Reddien PW, Cebrià F, Sánchez Alvarado A. (2003) Ingestion of bacterially
expressed double-stranded RNA inhibits gene expression in planarians. Proc Natl Acad Sci U
S A. 100 Suppl 1:11861-11865.
Newmark PA, Sánchez Alvarado A. (2000) Bromodeoxyuridine specifically labels the
regenerative stem cells of planarians. Dev Biol. 220:142-153.
Newmark PA, Sánchez Alvarado A. (2002) Not your father's planarian: a classic model enters
the era of functional genomics. Nat Rev Genet. 3:210-219.
Newth DR. (1958) New (and better?) parts for old. New Biol 26:47-62.
Ogawa H, Gomi T, Konishi K, Date T, Nakashima H, Nose K, Matsuda Y, Peraino C, Pitot HC,
Fujioka M. (1989) Human liver serine dehydratase. cDNA cloning and sequence homology
with hydroxyamino acid dehydratases from other sources. J Biol Chem. 264:15818-15823.
Osanai-Futahashi M, Tatematsu K, Yamamoto K, Narukawa J, Uchino K, Kayukawa T, Shinoda
T, Banno Y, Tamura T, Sezutsu H. (2012) Identification of the Bombyx red egg gene reveals
involvement of a novel transporter family gene in late steps of the insect ommochrome
biosynthesis pathway. J Biol Chem. 287:17706-17714.
Palladini G, Medolago-Albani L, Margotta V, Conforti A, Carolei A. (1979a) The pigmentary
system of planaria. I. Morphology. Cell Tissue Res. 199:197-202.
Palladini G, Medolago-Albani L, Margotta V, Conforti A, Carolei A. (1979b) The pigmentary
system of planaria. II. Physiology and functional morphology. Cell Tissue Res. 199:203-211.
54
Pallas PS. (1766) Miscellanea zoologica, quibus novae imprimis atque obscurae animalium
species describuntur et observationibus iconibusque illustrantur…: Hagae Comitum, apud
Pterum van Cleef.
Pearson BJ, Eisenhoffer GT, Gurley KA, Rink JC, Miller DE, Sánchez Alvarado A. (2009)
Formaldehyde-based whole-mount in situ hybridization method for planarians. Dev Dyn.
238:443-450.
Pearson BJ, Sánchez Alvarado A. (2008) Regeneration, stem cells, and the evolution of tumor
suppression. Cold Spring Harb Symp Quant Biol. 73:565-572.
Pearson BJ, Sánchez Alvarado A. (2010) A planarian p53 homolog regulates proliferation and
self-renewal in adult stem cell lineages. Development. 137:213-221.
Pellettieri J, Fitzgerald P, Watanabe S, Mancuso J, Green DR, Sánchez Alvarado A. (2010) Cell
death and tissue remodeling in planarian regeneration. Dev Biol. 338:76-85.
Pellettieri J, Sánchez Alvarado A. (2007) Cell turnover and adult tissue homeostasis: from
humans to planarians. Annu Rev Genet. 41:83-105.
Pospíšil P, Prasad A, Rác M. (2014) Role of reactive oxygen species in ultra-weak photon
emission in biological systems. J Photochem Photobiol B. 139:11-23.
Prockop DJ. (1997) Marrow stromal cells as stem cells for nonhematopoietic tissues. Science.
276:71-74.
Rahman MS, Akhtar N, Jamil HM, Banik RS, Asaduzzaman SM. (2015) TGF-β/BMP signaling
and other molecular events: regulation of osteoblastogenesis and bone formation. Bone Res.
3:15005.
Reddien PW, Oviedo NJ, Jennings JR, Jenkin JC, Sánchez Alvarado A. (2005) SMEDWI-2 is a
PIWI-like protein that regulates planarian stem cells. Science. 310:1327-1330.
Reddien PW, Sánchez Alvarado A. (2004) Fundamentals of planarian regeneration. Annu Rev
Cell Dev Biol. 20:725-757.
Reed JC. (1999) Dysregulation of apoptosis in cancer. Journal of Clinical Oncology 17:2941–
2953.
Rink JC. (2013) Stem cell systems and regeneration in planaria. Dev Genes Evol. 223:67-84.
Rink JC, Gurley KA, Elliott SA, Sánchez Alvarado A. (2009) Planarian Hh signaling regulates
regeneration polarity and links Hh pathway evolution to cilia. Science. 326:1406-1410.
Robb SM, Gotting K, Ross E, Sánchez Alvarado A. (2015) SmedGD 2.0: The Schmidtea
mediterranea genome database. Genesis. 53:535-546.
Robb SM, Ross E, Sánchez Alvarado A. (2008) SmedGD: the Schmidtea mediterranea genome
database. Nucleic Acids Res. 36(Database issue):D599-606.
55
Roberts-Galbraith RH, Newmark PA. (2013) Follistatin antagonizes activin signaling and acts
with notum to direct planarian head regeneration. Proc Natl Acad Sci U S A. 110:1363-1368.
Rossi L, Salvetti A, Batistoni R, Deri P, Gremigni V. (2008) Planarians, a tale of stem cells. Cell
Mol Life Sci. 65:16-23.
Saló E, Abril JF, Adell T, Cebrià F, Eckelt K, Fernandez-Taboada E, Handberg-Thorsager M,
Iglesias M, Molina MD, Rodríguez-Esteban G. (2009) Planarian regeneration: achievements
and future directions after 20 years of research. Int J Dev Biol. 53:1317-1327.
Saló E, Baguñà J. (2002) Regeneration in planarians and other worms: New findings, new tools,
and new perspectives. J Exp Zool. 292:528-539.
Sánchez Alvarado A. (2000) Regeneration in the metazoans: why does it happen? Bioessays.
22:578-590.
Sánchez Alvarado A. (2003) The freshwater planarian Schmidtea mediterranea: embryogenesis,
stem cells and regeneration. Curr Opin Genet Dev. 13:438-444.
Sánchez Alvarado A. (2006) Planarian regeneration: its end is its beginning. Cell. 2006 124:241-
245.
Sánchez Alvarado A, Newmark PA. (1999) Double-stranded RNA specifically disrupts gene
expression during planarian regeneration. Proc Natl Acad Sci U S A. 96:5049-5054.
Sato T, van Es JH, Snippert HJ, Stange DE, Vries RG, van den Born M, Barker N, Shroyer NF,
van de Wetering M, Clevers H. (2011) Paneth cells constitute the niche for Lgr5 stem cells in
intestinal crypts. Nature. 469:415-418.
Scimone ML, Srivastava M, Bell GW, Reddien PW. (2011) A regulatory program for excretory
system regeneration in planarians. Development. 138:4387-4398.
Shen Y, Xie C, Gu Y, Li X, Tong J. (2015) Illumination from light-emitting diodes (LEDs)
disrupts pathological cytokines expression and activates relevant signal pathways in primary
human retinal pigment epithelial cells. Exp Eye Res. pii: S0014-4835(15)30037-3.
Sherley JL. (2002) Asymmetric cell kinetics genes: the key to expansion of adult stem cells in
culture. Stem Cells. 20:561-572.
Simons BD, Clevers H. (2011) Strategies for homeostatic stem cell self-renewal in adult tissues.
Cell. 145:851-862.
Snippert HJ, van der Flier LG, Sato T, van Es JH, van den Born M, Kroon-Veenboer C, Barker
N, Klein AM, van Rheenen J, Simons BD, Clevers H. (2010) Intestinal crypt homeostasis
results from neutral competition between symmetrically dividing Lgr5 stem cells. Cell.
143:134-144.
56
Solana J, Kao D, Mihaylova Y, Jaber-Hijazi F, Malla S, Wilson R, Aboobaker A. (2012)
Defining the molecular profile of planarian pluripotent stem cells using a combinatorial
RNAseq, RNA interference and irradiation approach. Genome Biol. 13:R19.
Spallanzani L. (1769) Prodromo di un opera da imprimersi sopra la riproduzioni animali (An
essay on animal reproduction). Maty, M. trans. London: T. Becket & de Hondt.
Tarpey MM, Wink DA, Grisham MB. (2004) Methods for detection of reactive metabolites of
oxygen and nitrogen: in vitro and in vivo considerations. Am J Physiol Regul Integr Comp
Physiol. 286:R431-44.
Tasaki J, Shibata N, Nishimura O, Itomi K, Tabata Y, Son F, Suzuki N, Araki R, Abe M, Agata
K, Umesono Y. (2011) ERK signaling controls blastema cell differentiation during planarian
regeneration. Development. 138:2417-2427.
Thomsen ER, Mich JK, Yao Z, Hodge RD, Doyle AM, Jang S, Shehata SI, Nelson AM,
Shapovalova NV, Levi BP, Ramanathan S. (2015) Fixed single-cell transcriptomic
characterization of human radial glial diversity. Nat Methods. doi: 10.1038/nmeth.3629. Epub
ahead of print.
Wagner DE, Wang IE, Reddien PW. (2011) Clonogenic neoblasts are pluripotent adult stem cells
that underlie planarian regeneration. Science. 332:811-816.
Wenemoser D, Lapan SW, Wilkinson AW, Bell GW, Reddien PW. (2012) A molecular wound
response program associated with regeneration initiation in planarians. Genes Dev. 26:988-
1002.
Wenemoser D, Reddien PW. (2010) Planarian regeneration involves distinct stem cell responses
to wounds and tissue absence. Dev Biol. 344:979-991.
Widmann JJ, Fahimi HD. (1975) The regenerative response of Kupffer cells and endothelial cells
after partial hepactomy. In: Lesch R, Reutter W. editors. Liver regeneration after experimental
injury. New York: Stratton Intercontinental Medical Book Corp. 89-98.
van Wolfswinkel JC, Wagner DE, Reddien PW. (2014) Single-cell analysis reveals functionally
distinct classes within the planarian stem cell compartment. Cell Stem Cell. 15:326-339.
Wolpert L. (1994) The evolutionary origin of development: cycles, patterning, privilege and
continuity. Dev Suppl. 79-84.
Zhou Z, Hartwieg E, Horvitz, HR. (2001) CED-1 is a transmembrane receptor that mediates cell
corpse engulfment in C. elegans. Cell. 104:43–56.
Zhu SJ, Hallows SE, Currie KW, Xu C, Pearson BJ. (2015) A mex3 homolog is required for
differentiation during planarian stem cell lineage development. Elife. 4.
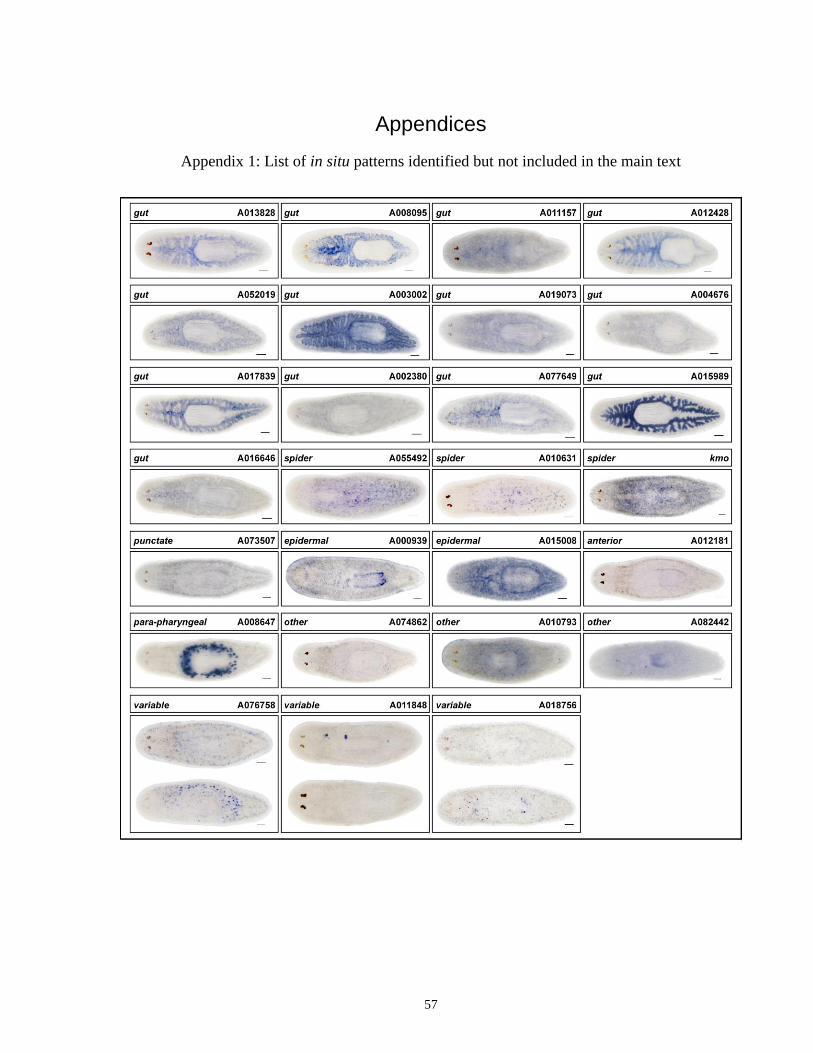
57
Appendices
Appendix 1: List of in situ patterns identified but not included in the main text
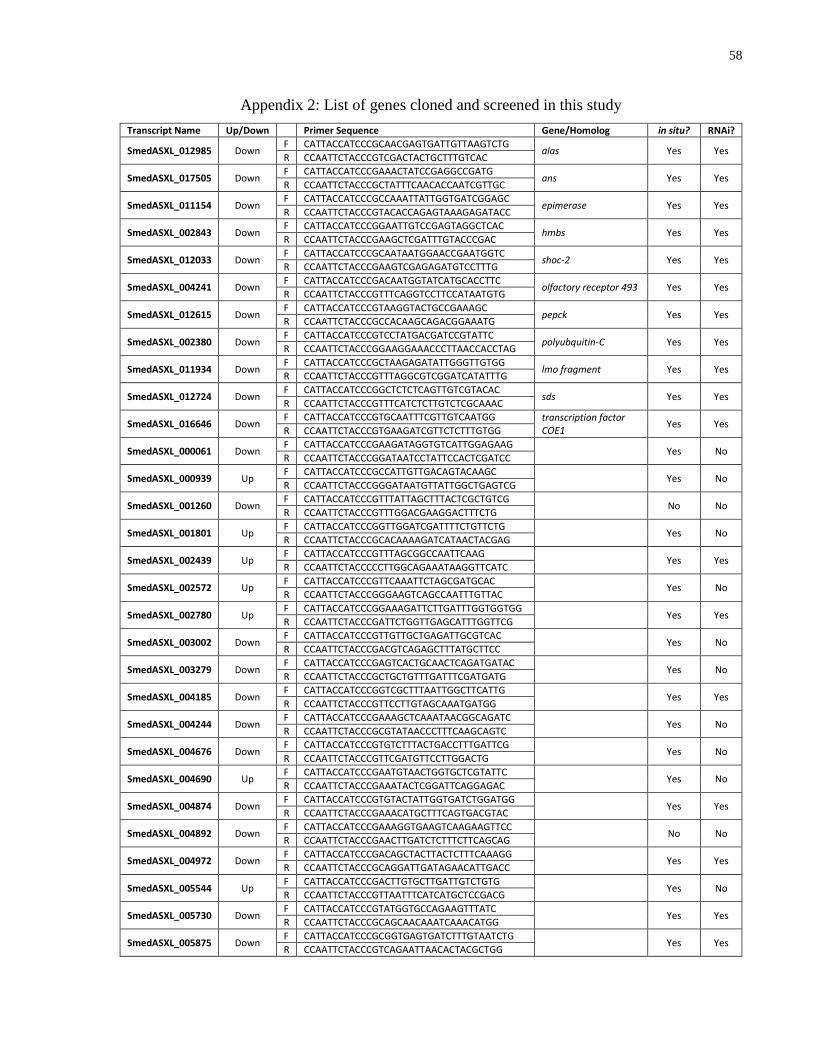
58
Appendix 2: List of genes cloned and screened in this study
Transcript Name Up/Down Primer Sequence Gene/Homolog in situ? RNAi?
SmedASXL_012985 Down F CATTACCATCCCGCAACGAGTGATTGTTAAGTCTG
alas Yes Yes R CCAATTCTACCCGTCGACTACTGCTTTGTCAC
SmedASXL_017505 Down F CATTACCATCCCGAAACTATCCGAGGCCGATG
ans Yes Yes R CCAATTCTACCCGCTATTTCAACACCAATCGTTGC
SmedASXL_011154 Down F CATTACCATCCCGCCAAATTATTGGTGATCGGAGC
epimerase Yes Yes R CCAATTCTACCCGTACACCAGAGTAAAGAGATACC
SmedASXL_002843 Down F CATTACCATCCCGGAATTGTCCGAGTAGGCTCAC
hmbs Yes Yes R CCAATTCTACCCGAAGCTCGATTTGTACCCGAC
SmedASXL_012033 Down F CATTACCATCCCGCAATAATGGAACCGAATGGTC
shoc-2 Yes Yes R CCAATTCTACCCGAAGTCGAGAGATGTCCTTTG
SmedASXL_004241 Down F CATTACCATCCCGACAATGGTATCATGCACCTTC
olfactory receptor 493 Yes Yes R CCAATTCTACCCGTTTCAGGTCCTTCCATAATGTG
SmedASXL_012615 Down F CATTACCATCCCGTAAGGTACTGCCGAAAGC
pepck Yes Yes R CCAATTCTACCCGCCACAAGCAGACGGAAATG
SmedASXL_002380 Down F CATTACCATCCCGTCCTATGACGATCCGTATTC
polyubquitin-C Yes Yes R CCAATTCTACCCGGAAGGAAACCCTTAACCACCTAG
SmedASXL_011934 Down F CATTACCATCCCGCTAAGAGATATTGGGTTGTGG
lmo fragment Yes Yes R CCAATTCTACCCGTTTAGGCGTCGGATCATATTTG
SmedASXL_012724 Down F CATTACCATCCCGGCTCTCTCAGTTGTCGTACAC
sds Yes Yes R CCAATTCTACCCGTTTCATCTCTTGTCTCGCAAAC
SmedASXL_016646 Down F CATTACCATCCCGTGCAATTTCGTTGTCAATGG transcription factor
COE1 Yes Yes
R CCAATTCTACCCGTGAAGATCGTTCTCTTTGTGG
SmedASXL_000061 Down F CATTACCATCCCGAAGATAGGTGTCATTGGAGAAG
Yes No R CCAATTCTACCCGGATAATCCTATTCCACTCGATCC
SmedASXL_000939 Up F CATTACCATCCCGCCATTGTTGACAGTACAAGC
Yes No R CCAATTCTACCCGGGATAATGTTATTGGCTGAGTCG
SmedASXL_001260 Down F CATTACCATCCCGTTTATTAGCTTTACTCGCTGTCG
No No R CCAATTCTACCCGTTTGGACGAAGGACTTTCTG
SmedASXL_001801 Up F CATTACCATCCCGGTTGGATCGATTTTCTGTTCTG
Yes No R CCAATTCTACCCGCACAAAAGATCATAACTACGAG
SmedASXL_002439 Up F CATTACCATCCCGTTTAGCGGCCAATTCAAG
Yes Yes R CCAATTCTACCCCCTTGGCAGAAATAAGGTTCATC
SmedASXL_002572 Up F CATTACCATCCCGTTCAAATTCTAGCGATGCAC
Yes No R CCAATTCTACCCGGGAAGTCAGCCAATTTGTTAC
SmedASXL_002780 Up F CATTACCATCCCGGAAAGATTCTTGATTTGGTGGTGG
Yes Yes R CCAATTCTACCCGATTCTGGTTGAGCATTTGGTTCG
SmedASXL_003002 Down F CATTACCATCCCGTTGTTGCTGAGATTGCGTCAC
Yes No R CCAATTCTACCCGACGTCAGAGCTTTATGCTTCC
SmedASXL_003279 Down F CATTACCATCCCGAGTCACTGCAACTCAGATGATAC
Yes No R CCAATTCTACCCGCTGCTGTTTGATTTCGATGATG
SmedASXL_004185 Down F CATTACCATCCCGGTCGCTTTAATTGGCTTCATTG
Yes Yes R CCAATTCTACCCGTTCCTTGTAGCAAATGATGG
SmedASXL_004244 Down F CATTACCATCCCGAAAGCTCAAATAACGGCAGATC
Yes No R CCAATTCTACCCGCGTATAACCCTTTCAAGCAGTC
SmedASXL_004676 Down F CATTACCATCCCGTGTCTTTACTGACCTTTGATTCG
Yes No R CCAATTCTACCCGTTCGATGTTCCTTGGACTG
SmedASXL_004690 Up F CATTACCATCCCGAATGTAACTGGTGCTCGTATTC
Yes No R CCAATTCTACCCGAAATACTCGGATTCAGGAGAC
SmedASXL_004874 Down F CATTACCATCCCGTGTACTATTGGTGATCTGGATGG
Yes Yes R CCAATTCTACCCGAAACATGCTTTCAGTGACGTAC
SmedASXL_004892 Down F CATTACCATCCCGAAAGGTGAAGTCAAGAAGTTCC
No No R CCAATTCTACCCGAACTTGATCTCTTTCTTCAGCAG
SmedASXL_004972 Down F CATTACCATCCCGACAGCTACTTACTCTTTCAAAGG
Yes Yes R CCAATTCTACCCGCAGGATTGATAGAACATTGACC
SmedASXL_005544 Up F CATTACCATCCCGACTTGTGCTTGATTGTCTGTG
Yes No R CCAATTCTACCCGTTAATTTCATCATGCTCCGACG
SmedASXL_005730 Down F CATTACCATCCCGTATGGTGCCAGAAGTTTATC
Yes Yes R CCAATTCTACCCGCAGCAACAAATCAAACATGG
SmedASXL_005875 Down F CATTACCATCCCGCGGTGAGTGATCTTTGTAATCTG
Yes Yes R CCAATTCTACCCGTCAGAATTAACACTACGCTGG
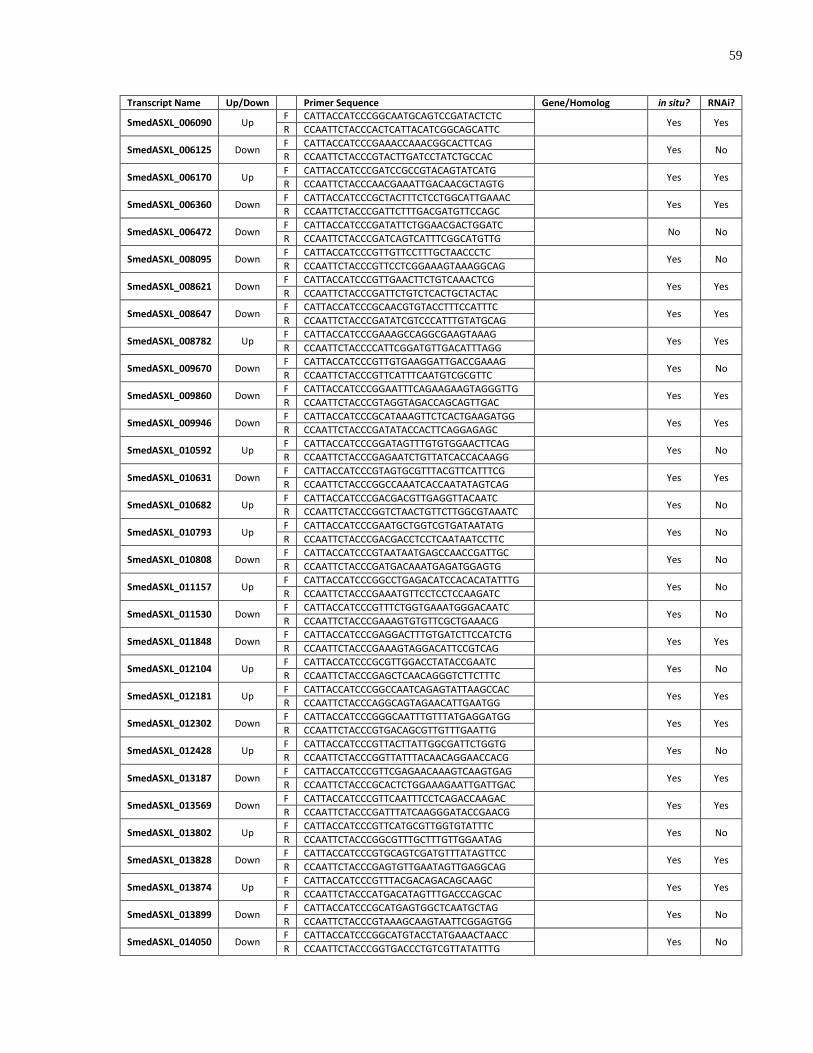
59
Transcript Name Up/Down Primer Sequence Gene/Homolog in situ? RNAi?
SmedASXL_006090 Up F CATTACCATCCCGGCAATGCAGTCCGATACTCTC
Yes Yes R CCAATTCTACCCACTCATTACATCGGCAGCATTC
SmedASXL_006125 Down F CATTACCATCCCGAAACCAAACGGCACTTCAG
Yes No R CCAATTCTACCCGTACTTGATCCTATCTGCCAC
SmedASXL_006170 Up F CATTACCATCCCGATCCGCCGTACAGTATCATG
Yes Yes R CCAATTCTACCCAACGAAATTGACAACGCTAGTG
SmedASXL_006360 Down F CATTACCATCCCGCTACTTTCTCCTGGCATTGAAAC
Yes Yes R CCAATTCTACCCGATTCTTTGACGATGTTCCAGC
SmedASXL_006472 Down F CATTACCATCCCGATATTCTGGAACGACTGGATC
No No R CCAATTCTACCCGATCAGTCATTTCGGCATGTTG
SmedASXL_008095 Down F CATTACCATCCCGTTGTTCCTTTGCTAACCCTC
Yes No R CCAATTCTACCCGTTCCTCGGAAAGTAAAGGCAG
SmedASXL_008621 Down F CATTACCATCCCGTTGAACTTCTGTCAAACTCG
Yes Yes R CCAATTCTACCCGATTCTGTCTCACTGCTACTAC
SmedASXL_008647 Down F CATTACCATCCCGCAACGTGTACCTTTCCATTTC
Yes Yes R CCAATTCTACCCGATATCGTCCCATTTGTATGCAG
SmedASXL_008782 Up F CATTACCATCCCGAAAGCCAGGCGAAGTAAAG
Yes Yes R CCAATTCTACCCCATTCGGATGTTGACATTTAGG
SmedASXL_009670 Down F CATTACCATCCCGTTGTGAAGGATTGACCGAAAG
Yes No R CCAATTCTACCCGTTCATTTCAATGTCGCGTTC
SmedASXL_009860 Down F CATTACCATCCCGGAATTTCAGAAGAAGTAGGGTTG
Yes Yes R CCAATTCTACCCGTAGGTAGACCAGCAGTTGAC
SmedASXL_009946 Down F CATTACCATCCCGCATAAAGTTCTCACTGAAGATGG
Yes Yes R CCAATTCTACCCGATATACCACTTCAGGAGAGC
SmedASXL_010592 Up F CATTACCATCCCGGATAGTTTGTGTGGAACTTCAG
Yes No R CCAATTCTACCCGAGAATCTGTTATCACCACAAGG
SmedASXL_010631 Down F CATTACCATCCCGTAGTGCGTTTACGTTCATTTCG
Yes Yes R CCAATTCTACCCGGCCAAATCACCAATATAGTCAG
SmedASXL_010682 Up F CATTACCATCCCGACGACGTTGAGGTTACAATC
Yes No R CCAATTCTACCCGGTCTAACTGTTCTTGGCGTAAATC
SmedASXL_010793 Up F CATTACCATCCCGAATGCTGGTCGTGATAATATG
Yes No R CCAATTCTACCCGACGACCTCCTCAATAATCCTTC
SmedASXL_010808 Down F CATTACCATCCCGTAATAATGAGCCAACCGATTGC
Yes No R CCAATTCTACCCGATGACAAATGAGATGGAGTG
SmedASXL_011157 Up F CATTACCATCCCGGCCTGAGACATCCACACATATTTG
Yes No R CCAATTCTACCCGAAATGTTCCTCCTCCAAGATC
SmedASXL_011530 Down F CATTACCATCCCGTTTCTGGTGAAATGGGACAATC
Yes No R CCAATTCTACCCGAAAGTGTGTTCGCTGAAACG
SmedASXL_011848 Down F CATTACCATCCCGAGGACTTTGTGATCTTCCATCTG
Yes Yes R CCAATTCTACCCGAAAGTAGGACATTCCGTCAG
SmedASXL_012104 Up F CATTACCATCCCGCGTTGGACCTATACCGAATC
Yes No R CCAATTCTACCCGAGCTCAACAGGGTCTTCTTTC
SmedASXL_012181 Up F CATTACCATCCCGGCCAATCAGAGTATTAAGCCAC
Yes Yes R CCAATTCTACCCAGGCAGTAGAACATTGAATGG
SmedASXL_012302 Down F CATTACCATCCCGGGCAATTTGTTTATGAGGATGG
Yes Yes R CCAATTCTACCCGTGACAGCGTTGTTTGAATTG
SmedASXL_012428 Up F CATTACCATCCCGTTACTTATTGGCGATTCTGGTG
Yes No R CCAATTCTACCCGGTTATTTACAACAGGAACCACG
SmedASXL_013187 Down F CATTACCATCCCGTTCGAGAACAAAGTCAAGTGAG
Yes Yes R CCAATTCTACCCGCACTCTGGAAAGAATTGATTGAC
SmedASXL_013569 Down F CATTACCATCCCGTTCAATTTCCTCAGACCAAGAC
Yes Yes R CCAATTCTACCCGATTTATCAAGGGATACCGAACG
SmedASXL_013802 Up F CATTACCATCCCGTTCATGCGTTGGTGTATTTC
Yes No R CCAATTCTACCCGGCGTTTGCTTTGTTGGAATAG
SmedASXL_013828 Down F CATTACCATCCCGTGCAGTCGATGTTTATAGTTCC
Yes Yes R CCAATTCTACCCGAGTGTTGAATAGTTGAGGCAG
SmedASXL_013874 Up F CATTACCATCCCGTTTACGACAGACAGCAAGC
Yes Yes R CCAATTCTACCCATGACATAGTTTGACCCAGCAC
SmedASXL_013899 Down F CATTACCATCCCGCATGAGTGGCTCAATGCTAG
Yes No R CCAATTCTACCCGTAAAGCAAGTAATTCGGAGTGG
SmedASXL_014050 Down F CATTACCATCCCGGCATGTACCTATGAAACTAACC
Yes No R CCAATTCTACCCGGTGACCCTGTCGTTATATTTG

60
Transcript Name Up/Down Primer Sequence Gene/Homolog in situ? RNAi?
SmedASXL_015008 Down F CATTACCATCCCGTTATCACGCAAAGTCGCAATC
Yes Yes R CCAATTCTACCCGCGGTACAAATCCAACAGTTCG
SmedASXL_015062 Up F CATTACCATCCCGCACTGCGTCAATGAGTTCAGG
Yes Yes R CCAATTCTACCCACAAACCTCACATTCAAACGGTC
SmedASXL_015156 Down F CATTACCATCCCGGTTGTTGATGTTCCTGAAGTCG
Yes Yes R CCAATTCTACCCGTTTCTTCACCTTCATCCGATTC
SmedASXL_015227 Up F CATTACCATCCCGTTATAGTCAGCTCCAAGGATTC
Yes No R CCAATTCTACCCGAAAGAGACCGAACCGCTAC
SmedASXL_015543 Down F CATTACCATCCCGTACTACTGGACGATTGGATAC
Yes No R CCAATTCTACCCGTCCTTTCAAGAGAGTCCAAC
SmedASXL_015725 Down F CATTACCATCCCGATAGAGTTGACTGGAACTAAGG
No No R CCAATTCTACCCGGGGATTCAAACTTGTCCAAGG
SmedASXL_015989 Down F CATTACCATCCCGCACAATGAGTGAATTACATGG
Yes Yes R CCAATTCTACCCGCAACAACTGTAGAGAGCAATG
SmedASXL_016116 Up F CATTACCATCCCGCTGAACCTTCAAGTCACGAAT
Yes No R CCAATTCTACCCGACACATTGGTCTCTCAAACT
SmedASXL_016117 Up F CATTACCATCCCGAGACGGTGTGCTCTTCCGATC
Yes No R CCAATTCTACCCGGCCAGATTCTCTCTCATCCTCCTC
SmedASXL_016543 Down F CATTACCATCCCGGATTCTTCAACTAAACCGGACG
Yes No R CCAATTCTACCCGTGTTCAGTAATTGCTTCCAC
SmedASXL_016637 Up F CATTACCATCCCGATCATCGCTCGGATTCCATAG
Yes Yes R CCAATTCTACCCTCATCATGTCCAATGCTAGG
SmedASXL_016647 Down F CATTACCATCCCGTTTCGTTGTCAATGGTTTCGTGC
Yes Yes R CCAATTCTACCCGTTGAAGATCGTTCTCTTTGTGG
SmedASXL_016992 Up F CATTACCATCCCGAGCTTATACCGTCCATTTCC
Yes Yes R CCAATTCTACCCGTTTCTGCTTTATCCGCTCTTTC
SmedASXL_017839 Down F CATTACCATCCCGGGCCATAGAATTACTTGCAGC
Yes No R CCAATTCTACCCGTCTCCTCCACTAACATTAAAGAC
SmedASXL_018703 Up F CATTACCATCCCGTGCAACTAATGGCGATACTC
Yes No R CCAATTCTACCCGCATCGTCTTTCTTATCATCAGG
SmedASXL_018756 Up F CATTACCATCCCGTTCATTGGCTAGAACTTTGG
Yes No F CATTACCATCCCGTTGGGTTTCCAAAGATGTTGA
SmedASXL_018815 Up F CATTACCATCCCGCCGATCTGTCAATGATTACTAC
Yes Yes R CCAATTCTACCCCCCTTTCTATCAATGTGGCTG
SmedASXL_019073 Down F CATTACCATCCCGTGTTTCAAATACTGCGCTAC
Yes No R CCAATTCTACCCGTCCATCCTTAATTGGCTATTCC
SmedASXL_019161 Down F CATTACCATCCCGTCAACACAATTTCGATCCAGG
Yes No R CCAATTCTACCCGAAGTTGACAGTTTGGCGAT
SmedASXL_023953 Down F CATTACCATCCCGACTCTTCACAGTAGCACTTG
No No R CCAATTCTACCCGGATTTCTTGTTGAGTAGCGCAG
SmedASXL_031083 Up F CATTACCATCCCGCGTTATACAAAGGCTCTCCGATTC
Yes Yes R CCAATTCTACCCTGGTTCCTCTCGACCATCTTG
SmedASXL_042310 Up F CATTACCATCCCGCTTCCGATCTCTCAGTTGTTG
Yes No R CCAATTCTACCCGCTTAAAGCATTGATCTGCCAC
SmedASXL_045004 Down F CATTACCATCCCGAAAGCAACTAAGGGCGTATG
Yes Yes R CCAATTCTACCCGCTTCCAAGCCAACATCCTG
SmedASXL_046304 Down F CATTACCATCCCGCACAAATTGGTATAGAGGAGAAC
Yes Yes R CCAATTCTACCCGTTCCTTGTAGCAAATGATGG
SmedASXL_051340 Up F CATTACCATCCCGCGATGATAGCTGTGAAAATAGAG
Yes No R CCAATTCTACCCGTTAAACTGATCCCAGAAGGAAG
SmedASXL_052019 Down F CATTACCATCCCGCTGGATGATAAGGGCTCTTAA
Yes No R CCAATTCTACCCGTCATGGTTTCTTGGTTGTTTG
SmedASXL_052064 Up F CATTACCATCCCGAACTCTTTAAGTTCCGGCTTC
Yes No R CCAATTCTACCCGAGAATAGATGAAGCCAAAGCAG
SmedASXL_055492 Down F CATTACCATCCCGTACAGCAATTTTCGACCCCC
Yes Yes R CCAATTCTACCCGAGTAGTGTCACCAACTAACG
SmedASXL_058936 Up F CATTACCATCCCGATCATCGTAAGACACACCAATC
Yes Yes R CCAATTCTACCCGTGCAATAGCTTGTGGTAGATG
SmedASXL_060807 Down F CATTACCATCCCGTCTTCCGTCGTACTAATCG
Yes No R CCAATTCTACCCGGTTTAATTGAGACGGGCGAC
SmedASXL_061552 Up F CATTACCATCCCGCTATGGTTAATAGTCTTCGGAACAG
Yes Yes R CCAATTCTACCCTTTCGATAATTCCAAGGAGACC
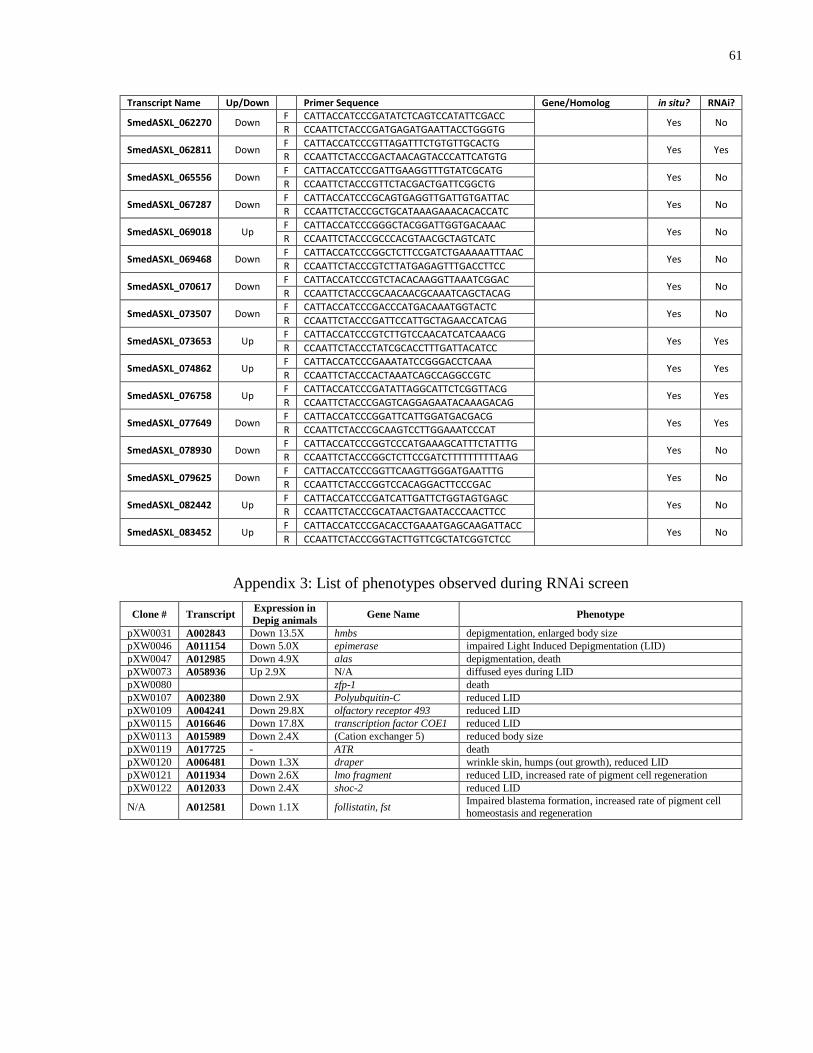
61
Transcript Name Up/Down Primer Sequence Gene/Homolog in situ? RNAi?
SmedASXL_062270 Down F CATTACCATCCCGATATCTCAGTCCATATTCGACC
Yes No R CCAATTCTACCCGATGAGATGAATTACCTGGGTG
SmedASXL_062811 Down F CATTACCATCCCGTTAGATTTCTGTGTTGCACTG
Yes Yes R CCAATTCTACCCGACTAACAGTACCCATTCATGTG
SmedASXL_065556 Down F CATTACCATCCCGATTGAAGGTTTGTATCGCATG
Yes No R CCAATTCTACCCGTTCTACGACTGATTCGGCTG
SmedASXL_067287 Down F CATTACCATCCCGCAGTGAGGTTGATTGTGATTAC
Yes No R CCAATTCTACCCGCTGCATAAAGAAACACACCATC
SmedASXL_069018 Up F CATTACCATCCCGGGCTACGGATTGGTGACAAAC
Yes No R CCAATTCTACCCGCCCACGTAACGCTAGTCATC
SmedASXL_069468 Down F CATTACCATCCCGGCTCTTCCGATCTGAAAAATTTAAC
Yes No R CCAATTCTACCCGTCTTATGAGAGTTTGACCTTCC
SmedASXL_070617 Down F CATTACCATCCCGTCTACACAAGGTTAAATCGGAC
Yes No R CCAATTCTACCCGCAACAACGCAAATCAGCTACAG
SmedASXL_073507 Down F CATTACCATCCCGACCCATGACAAATGGTACTC
Yes No R CCAATTCTACCCGATTCCATTGCTAGAACCATCAG
SmedASXL_073653 Up F CATTACCATCCCGTCTTGTCCAACATCATCAAACG
Yes Yes R CCAATTCTACCCTATCGCACCTTTGATTACATCC
SmedASXL_074862 Up F CATTACCATCCCGAAATATCCGGGACCTCAAA
Yes Yes R CCAATTCTACCCACTAAATCAGCCAGGCCGTC
SmedASXL_076758 Up F CATTACCATCCCGATATTAGGCATTCTCGGTTACG
Yes Yes R CCAATTCTACCCGAGTCAGGAGAATACAAAGACAG
SmedASXL_077649 Down F CATTACCATCCCGGATTCATTGGATGACGACG
Yes Yes R CCAATTCTACCCGCAAGTCCTTGGAAATCCCAT
SmedASXL_078930 Down F CATTACCATCCCGGTCCCATGAAAGCATTTCTATTTG
Yes No R CCAATTCTACCCGGCTCTTCCGATCTTTTTTTTTTAAG
SmedASXL_079625 Down F CATTACCATCCCGGTTCAAGTTGGGATGAATTTG
Yes No R CCAATTCTACCCGGTCCACAGGACTTCCCGAC
SmedASXL_082442 Up F CATTACCATCCCGATCATTGATTCTGGTAGTGAGC
Yes No R CCAATTCTACCCGCATAACTGAATACCCAACTTCC
SmedASXL_083452 Up F CATTACCATCCCGACACCTGAAATGAGCAAGATTACC
Yes No R CCAATTCTACCCGGTACTTGTTCGCTATCGGTCTCC
Appendix 3: List of phenotypes observed during RNAi screen
Clone # Transcript Expression in
Depig animals Gene Name Phenotype
pXW0031 A002843 Down 13.5X hmbs depigmentation, enlarged body size
pXW0046 A011154 Down 5.0X epimerase impaired Light Induced Depigmentation (LID)
pXW0047 A012985 Down 4.9X alas depigmentation, death
pXW0073 A058936 Up 2.9X N/A diffused eyes during LID
pXW0080 zfp-1 death
pXW0107 A002380 Down 2.9X Polyubquitin-C reduced LID
pXW0109 A004241 Down 29.8X olfactory receptor 493 reduced LID
pXW0115 A016646 Down 17.8X transcription factor COE1 reduced LID
pXW0113 A015989 Down 2.4X (Cation exchanger 5) reduced body size
pXW0119 A017725 - ATR death
pXW0120 A006481 Down 1.3X draper wrinkle skin, humps (out growth), reduced LID
pXW0121 A011934 Down 2.6X lmo fragment reduced LID, increased rate of pigment cell regeneration
pXW0122 A012033 Down 2.4X shoc-2 reduced LID
N/A A012581 Down 1.1X follistatin, fst Impaired blastema formation, increased rate of pigment cell
homeostasis and regeneration