Embed Size (px)
Citation preview

International Real Business Cycles
David K. Backus; Patrick J. Kehoe; Finn E. Kydland
The Journal of Political Economy, Vol. 100, No. 4. (Aug., 1992), pp. 745-775.
Stable URL:
http://links.jstor.org/sici?sici=0022-3808%28199208%29100%3A4%3C745%3AIRBC%3E2.0.CO%3B2-7
The Journal of Political Economy is currently published by The University of Chicago Press.
Your use of the JSTOR archive indicates your acceptance of JSTOR's Terms and Conditions of Use, available athttp://www.jstor.org/about/terms.html. JSTOR's Terms and Conditions of Use provides, in part, that unless you have obtainedprior permission, you may not download an entire issue of a journal or multiple copies of articles, and you may use content inthe JSTOR archive only for your personal, non-commercial use.
Please contact the publisher regarding any further use of this work. Publisher contact information may be obtained athttp://www.jstor.org/journals/ucpress.html.
Each copy of any part of a JSTOR transmission must contain the same copyright notice that appears on the screen or printedpage of such transmission.
The JSTOR Archive is a trusted digital repository providing for long-term preservation and access to leading academicjournals and scholarly literature from around the world. The Archive is supported by libraries, scholarly societies, publishers,and foundations. It is an initiative of JSTOR, a not-for-profit organization with a mission to help the scholarly community takeadvantage of advances in technology. For more information regarding JSTOR, please contact [email protected].
http://www.jstor.orgFri Feb 1 12:28:29 2008

International Real Business Cycles
David K. Backus ,Yeeur York Cnz~lersztj
Patrick J. Kehoe Unzversztj of ,Mznnesota and Federal Reserve Bank ofLblznneapolw
Finn E. Kydland Carnegzc i ~ f ~ l l o ~ z C~zzverszty
We ask whether a two-country real business cycle model can account simultaneously for domestic and international aspects of business cycles. With this question in mind, we document a number of dis- crepancies between theory and data. The most striking discrepancy concerns the correlations of consumption and output across coun- tries. In the data, outputs are generally more highly correlated across countries than consumptions. In the model we see the op- posite.
In closed-economy environments, real business cycle theory has ac- counted for many of the features of postwar U.S. business cycles. We consider an extension of this theory to open economies and ask whether it can account for both the comovements studied in closed-
We thank Andrew Atkesori. Lawrence Christiano, Beverly Lapham, and two referees for useful comments on earlier drafts; Klaus Seusser for help with data; Shawn He~vitt for timely and capable research assistance; Christian Zimmermann for pointing out a computational error; Kathy Rolfe for copyediting; and the Sational Science Founda- tion for financial support. An earlier version of this paper was circulated under the title "International Borrowing and LVorld Business C!-cles." The views expressed are those of the authors and not necessarily those of the Federal Reserve Bank of hlinneap- olis or the Federal Reser1.e S!-stem.

746 JOURNAL OF POLITICAL ECONOMY
economy macroeconomics and salient international comovements, in- cluding correlations across countries of fluctuations in macroeco-nomic aggregates and movements in the balance of trade.
Quantitative studies of closed economies suggest that a stochastic growth model with a single aggregate technology shock can account for, among other things, the magnitude of fluctuations, relative to output, in consumption and investment and the correlations of these fluctuations with output. In the analogous world economy, countries experience imperfectly correlated shocks to their technologies. The interaction between these shocks and the ability to borrow and lend internationally can in principle have a substantial influence on the magnitude and character of aggregate fluctuations. In open econo- mies, a country's consumption and investment decisions are no longer constrained by its own production. With respect to consumption, we might guess that the opportunity to share risk across countries would lead to equilibrium consumption paths that are both less variable and less closely related to domestic output than they are in closed-economy real business cycle models. With respect to investment, we might expect capital to be allocated to the country with the more favorable technology shock and thus generate greater variability in domestic investment.
The open-economy perspective also leads us to consider comove- ments with an international flavor. Perhaps the distinguishing feature of an open economy is that it can borrow and lend in international markets by running trade surpluses and deficits. The trade balance, which measures the difference between domestic production and ab- sorption, can vary systematically over the cycle. Its cyclical properties are determined by the balance of two forces: the desire and ability of agents to smooth consumption using international markets and the additional cyclical variability of investment that international capital flows permit. These phenomena are reflected in the correlation be- tween saving and investment rates as well. These rates are perfectly correlated in closed economies but may be imperfectly correlated in open economies if countries use international markets to borrow and lend. The open-economy perspective also leads us to consider correla- tions across countries. The most obvious of these is the correlation between output fluctuations in different countries. Another such cor- relation is suggested by theory: with complete markets, we expect the ability to share risk internationally to produce a large correlation between consumption fluctuations across countries. Indeed, in some theoretical economies, this correlation is one, regardless of the corre- lation between outputs.
Thus we ask whether an international version of a real business cycle model can account simultarleously for the familiar domestic comovements and several international comovements. We pay partic-

747 REAL BUSINESS CYCLES
ular attention to statistics that relate directly to the allocative role of international markets: the cross-country correlations of consumption and output, the correlation of net exports with output, and the corre- lation between saving and investment rates.
Our model is a two-country extension of Kydland and Prescott's (1982) closed economy. T o focus attention on the role of financial markets in allocating risk and determining intertemporal production decisions, we retain from their model the assumptions of a single homogeneous produced good and of complete markets for state- contingent claims. We depart from the original in two respects: coun- tries experience different technology shocks each period, and agents participate in international capital markets. We allow innovations in the shocks to be correlated across countries. We also allow diffusion of technology shocks between countries, as technological change is transmitted across borders. In our experiments, we base the parame- ters measuring diffusion and correlation, as well as the variances of the shocks, on estimates of Solow (1957) residuals for the United States and an aggregate of European countries.
In our benchmark economy, we find that openness substantially alters the nature of some of the closed-economy comovements. Con- sumption is somewhat smoother in this theoretical environment than it is in the data: the ratio of the standard deviation of consumption to that of output is .40 in the model and .49 in the U.S. data. Invest- ment, in contrast, is much more volatile in the theoretical economy (10.94 vs. the data's 3.15). The contemporaneous cross correlation between investment and output is substantially smaller in the model than in the U.S. data (.27 vs. .go). For each of these properties, the closed-economy model is closer to the data, so in this sense, opening the economy has an important influence on its behavior.
We find similar differences between theory and data in the behav- ior of international comovements. The trade balance is much more variable in our model than it is in any of the major developed econo- mies; the standard deviation of the ratio of net exports to output is 2.90 for the model versus .79 for Canada, .85 for Germany, .89 for Japan, and .42 for the United States. Although output is positively correlated across most major countries, it is not in the theoretical economy; there the correlation is - .18. Consumption, however, is much more strongly correlated in the theory (.88) than in the data (where correlations range from - .23 to .65 for various countries vs. the United States).
Of these discrepancies, the large cross-country correlation of con- sumption relative to output is the most robust; most of the others evaporate with modest changes in parameter values or economic structure. In an attempt to account for the discrepancies, we conjec- ture that they may result from the ability of agents to trade assets
748 JOURNAL OF POLITICAL ECONOMY
and ship physical capital costlessly between countries. This ability is reflected in the large cross-country consumption correlation, the small or even negative cross-country output correlation, the large variability of investment and net exports, and the cyclical movements of investment and net exports-all of which differ from the data. This leads us to ask whether a world economy with small trading frictions would produce comovements more like those in the data. T o this end we introduce into the model a small transportation cost on net trade between countries. This cost lowers substantially the variability of investment and net exports and produces strongly pro- cyclical investment. It also reduces somewhat the difference between cross-country correlations of consumption and output, but in contrast to the data, the model's consumption correlation remains substan- tially larger than the output correlation. We also consider a more extreme experiment in the same spirit in which international bor- rowing is eliminated altogether. This experiment prohibits not only physical trade in goods but also the trade in state-contingent claims that underlies international risk sharing. The quantitative properties of this experiment are very close to those with the small trading fric- tion. This suggests that the consumptionloutput discrepancy is not simply the result of international risk sharing with complete markets.
This study is related to a growing body of work studying interna- tional business cycles from the perspective of dynamic general equi- librium theory, including papers by Dellas (1986), Stockman and Svensson (1987), and Cantor and Mark (1988). What we have done is given this work quantitative content by parameterizing a version of the theory and comparing its properties with those of international time-series data.
We proceed as follows. In Section I we review the evidence on business cycles from an international perspective. In Section 11 we describe our theoretical world economy and characterize its equilib- rium. In Section I11 we derive the economy's steady state and discuss settings of the model's parameters. With the exception of the parame- ters of the process governing technology shocks, the parameter values are taken from Kydland and Prescott's (1982, 1988) closed-economy studies and are therefore set without regard for their international implications. In Section IV we report cyclical properties of the model, and in Section V we introduce barriers to international trade in goods and assets. In Section VI we summarize our findings and speculate on directions for further work.
I. Properties of International Business Cycles
We review the properties of international business cycles in developed economies for the postwar period. These properties refer to moments

749 REAL BUSINESS CYCLES
US.G r o ~
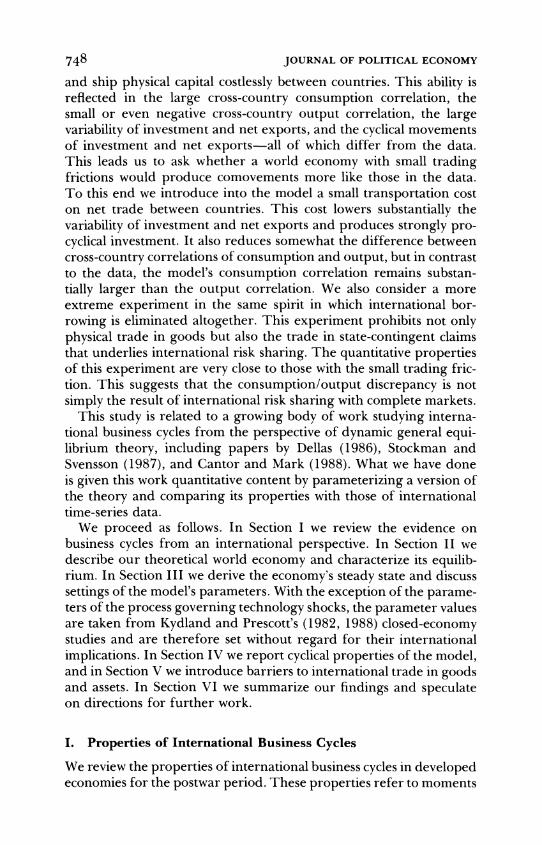
FIG. 1.-Example of a U.S. time series detrended with the Hodrick-Prescott filter. Source: Citibase.
of quarterly time series detrended with the Hodrick-Prescott filter and to cross correlations between such series. This filter emphasizes the medium- and high-frequency movements in the data, those that most people associate with business cycles. For discussions of the properties of this and other filters: see Hodrick and Prescott (1980), King and Rebelo (1989), and Kydland and Prescott (1990). The Hodrick-Prescott filter has been used in earlier work by Kydland and Prescott (1982, 1988, 1990), Hansen (1985), Prescott (1986), Chris- tiano and Eichenbaum (1988), and Backus and Kehoe (in press) to summarize fluctuations in aggregate data. Its effect is illustrated in figure 1 for the logarithm of U.S. real output. Our statistics refer to deviations of the raw data from the trend identified by the Hodrick- Prescott filter, which in figure 1 is the difference between the two lines.
Table 1 reports cyclical properties of the U.S. economy between 1954 and 1989. Note that the standard deviation of output fluctua- tions is 1.7 1 percent. We shall use this figure as a basis of comparison with the theoretical economy. Consumption of nondurables and ser- vices is about half as volatile as output, investment in fixed capital is more than three times as volatile as output, and hours worked is slightly less volatile than output. All three of these series are strongly procyclical. The final row of table 1 summarizes the cyclical behavior of the trade balance, measured here as the ratio of net exports to output. The trade balance has been countercyclical, with a contempo-

- -- - - - - -
- -- -- -- - --
- -- - -- -- - -
-- - - - -
7 ABLE. 1
(,YCLI( AI I'ROPERTIL~OF THL U S ECONOMY(Uased on Quarterly Data, 1954 1-1989 4) p p -
STANDARI) DLVIATION - -- C ~ o s sCORRELATION OUTPUT =WITH AT LAGk, WHEREk
Relative - - --- - - - -
VARIABIL l'ercentage to Output -5 -4 3 -2 - 1 0 1 2 3 4 5
Output 171 1 00 - 03 15 38 b3 85 100 85 b3 38 15 - 03 Consumption
(nondurables and serv~ces) 84 49 20 38 55 67 77 76 65 46 27 06 - 1 2
F~xedinvestment 5 38 3 15 09 25 44 64 83 90 81 60 35 08 - 1 4 Hours 1 47 86 - 10 05 23 44 69 8 6 86 75 59 38 18 (,ap~tal stock* 63 37 - 60 - 60 - 54 - 43 - 24 0 1 24 46 62 71 72 Inventory stock 1 65 96 - 37 - 33 - 23 - 05 19 50 72 83 81 71 53 Net exports/output 45 - 5 1 - 5 1 - 4 8 - 4 3 - 3 7 - 2 8 - 1 7 00 17 30 38
SOURLE-Cltlhdse kor details see the Appendix NOTF-Stdll5t1~1 d ~ e bdsed 01, I lodrlck Prcscott (1980) hltered datd Except for net cxports/output all 5crlrs are III logdrlthms* B a x d on 1954 1-1985 3
REAL BUSINESS CYCLES 75l
raneous correlation with output of - .28. Many of these properties are documented for other developed countries in Danthine and Don- aldson (in press).
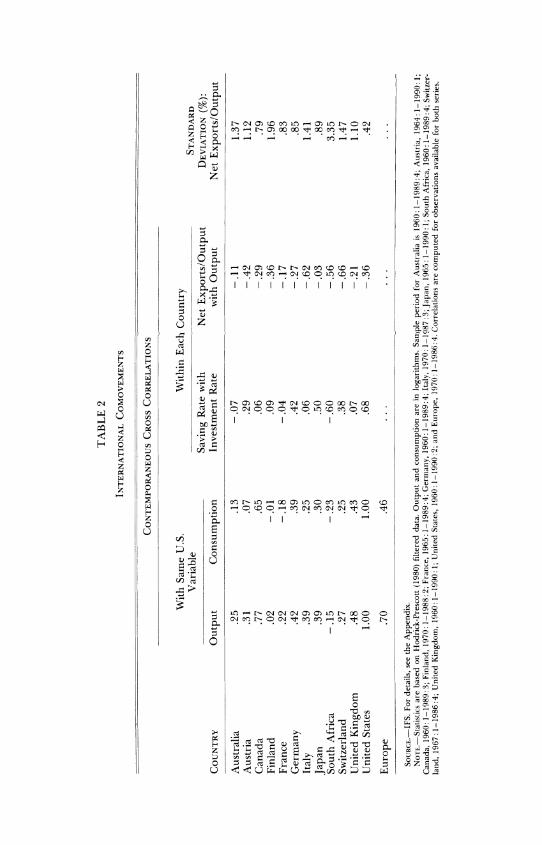
Table 2 reports some international statistics for 12 developed coun- tries (the universe of usable quarterly data from International Financial Statistics) and a European aggregate described in the Appendix. The table first lists the contemporaneous correlation of output fluctuations between each country and the United States. These vary in size but, except for one, are positive. The exception is South Africa. The cor- relations for Japan and the major European countries lie between .22 and .48. The table next lists analogous cross-country correlations for consumption. These, too, vary across countries but are all smaller than the output correlations. The largest correlation is .65 for Can- ada. The consumption correlation between the United States and the European aggregate is .46, which is substantially smaller than the output correlation of .70. The difference between the European ag- gregate correlations and the correlations for the individual countries is to some extent an artifact of the shorter sample period used in the calculations for the aggregate: there is greater correlation across countries in the 1970s than in the 1960s or 1980s. However, the relation between the output and consumption correlations is the same for the aggregate and the individual countries: the correlation is stronger between outputs than between consumptions.
Our interest in the consumption correlation stems from a well- known property of complete markets: in economies with one good and stationary, additively separable preferences, consumption by ev- ery agent is deterministically and positively related to consumption by every other agent. If preferences are identical and homothetic, the relation is linear: the consumption paths of any two agents are perfectly correlated, regardless of the correlation of their incomes. Scheinkman (1984) suggests that the correlation of consumption across countries is a direct measure of how well such models mimic the international economy.
The third column of table 2 reports the correlations between saving and investment rates within countries. Feldstein and Horioka (1980) have shown, using regressions with cross-section data at low frequen- cies, that saving and investment are very highly correlated. They in- terpret this fact as challenging the assumption that world capital mar- kets are perfectly integrated. Their intuition is that Fisher separation implies that, in open economies, saving and investment decisions need not match if capital is internationally mobile, yet the correlation in the data is large. Many studies, including those of Obstfeld (1986), Dooley, Frankel, and Mathieson (1987), and Tesar (1991), have shown the empirical relation to be extremely robust at low frequen-
753 REAL BUSINESS CYCLES
cies. Obstfeld (1986) and Tesar (1991) have found less regularity in the high-frequency movements on which we focus.
One problem we face in relating the savinglinvestment correlation to a theoretical model is that the definition of saving, unlike the other variables we have looked at, is sensitive to the market structure used to decentralize equilibrium allocations. From a theoretical point of view, saving depends not only on equilibrium prices and quantities but also on the asset structure used to decentralize the equilibrium allocations. Another problem is empirical. Perhaps the most obvious definition of a country's saving is the change in the market value of its wealth. These market values depend on the asset structure and are notoriously hard to measure. Most definitions of saving, including that of the national income and product accounts of the United States and many other countries, are based on more easily implemented concepts. The standard definition, for example, is household receipts minus expenditures; it does not include capital gains or losses on assets. A related difficulty led us earlier to study net exports, rather than the current account, as our measure of international flows. The current account contains, in addition to exports and imports, interest payments and changes in the market values of internationally traded assets that are almost impossible to measure accurately. (See, e.g., Taylor's [1989] comments on the worldwide current-account imbal- ance.) Imports and exports, on the other hand, are relatively easy to measure in both the data and the theory. We take a similar approach to saving. Rather than attempt to replicate in our model a theoreti- cally ambiguous variable, we define a new variable and compare its behavior in the model and the data. Our saving is output minus consumption and government purchases, all of which are measured easily in both the data and our theoretical economy. This definition captures the separation between saving and investment in open econ- omies that motivated the Feldstein-Horioka (1980) study, so it retains the appeal of conventional measures. In table 2 we find, as Obstfeld (1986) and Tesar (1991) do with a similar definition, that the correla- tion between saving and investment rates varies widely across coun- tries but is large and positive for Germany, Japan, and the United States.
The last two columns of table 2 pertain to net exports. We measure trade, again, as the ratio of net exports to output and its variability as the standard deviation of this ratio. These measures vary over time and across countries. For each of the countries in table 2, the ratio of net exports to output is countercyclical, in the sense that its contem- poraneous correlation with output is negative. The countercyclical movement of the balance of trade has been documented in annual data by Backus and Kehoe (in press) for the periods prior to World
7 5 4 JOURNAL OF POLITICAL ECONOMY
War I and between the wars for Australia, Canada, Norway, Sweden, the United Kingdom, and the United States. Dellas (1986)has found the same pattern in postwar data using spectral methods. It is also implicit in empirical work in the Keynesian tradition, like that by Krugman and Baldwin (1987) ,in the strong income term in import- demand equations.
We summarize briefly. Business cycles exhibit a great deal of regu- larity across countries. Investment is much more volatile than output, consumption is less volatile than output, and hours worked is about as volatile as output; all three variables are procyclical. In the 12 countries we have investigated, net exports is consistently counter- cyclical. Output fluctuations are more highly correlated across coun- tries than consumption fluctuations. The correlations between saving and investment rates show no clear pattern.
11. A World Economy
Our theoretical world economy consists of two countries, each repre- sented by a large number of identical consumers and a production technology. The countries produce the same good, and their prefer- ences and technologies have the same structure and parameter val- ues. Although the technologies have the same form, they differ in two important respects: in each country, the labor input consists only of domestic labor, and production is subjected to country-specific technology shocks.
The preferences and technology in each country are, with one ex- ception, those of the single country in Kydland and Prescott's (1982) closed-economy model. In the home (h ) and foreign ( f ) countries, the stand-in consumer maximizes the expected utility function
E U ,1 , for i = h , f ,
where U(c , I ) = ( cp l l -p )Y ly .Here 0 < p. < 1, y < 1, cj is consumption of the produced good, and 1; is a distributed lag on leisure. Leisure is interpreted as the amount of time, net of sleep and personal care, allocated to nonmarket activities. The case y = 0 corresponds to logarithmic utility. With the time endowment normalized at one, the distributed lag on leisure is defined by
and

755 REAL BUSINESS CYCLES
where n is time allocated to work, 0 < q r 1 , and 0 < a 5 1. The variable a, = XT=,(l - q)l-ln,-, summarizes the influence of past leisure choices on current utility. When a = 1 , I , = 1 - n,and current utility depends only on current leisure; when a < 1 , current utility depends, in part, on previous non~narket time, with weights deter- mined by q.
Production of the single good takes place in each country with inputs of capital k , labor n , and stocks of inventories z. It is affected by a technology shock A > 0. Output in country z is y: = F ( h f , kt, n j , z ; ) , where
0 < 0 < 1 , v > - 1 , and a > 0. Our nesting of capital and labor is slightly different from that in Kydland and Prescott ( 1 9 8 2 ) and fol- lows instead their 1 9 8 8 paper. Here the technology shock affects the productivity of the capitalllabor aggregate. World output from the two processes, F(A:, k:, n:, z:) + ~ ( h f , to con- k f , n f , z f ) , is allocated sumption, fixed investment, and inventory accumulation:
Net exports is nxj = 3;; - (c; + xl + z;,, - z ; ) . The technology incorporates the time-to-build structure empha-
sized by Kydland and Prescott ( 1 9 8 2 ) . Additions to the stock of fixed capital require inputs of the produced good for J periods, or
and
where 6 is the rate of depreciation and s;, is the number of investment projects in country i at date t that are j periods from completion. We denote by +], for j = 1 , . . . ,J , the fraction of total value added to an investment project in thejth period before completion. We set = l l J , so that an investment project leading to an addition of one unit to the capital stock at date t + 1 requires the sequence of equal expenditures {sj,,, ,-j,. . . , s ; ,~ -,,s i t } = { l l J , 1 IJ, . . . , l lJ) . Fixed in- vestment at date t is
the sum of investment expenditures on all existing projects.
756 JOURNAL OF POLITICAL ECONOMY
We depart from Kydland and Prescott in specifying the technology shock process for the two countries as a bivariate autoregression:
where A, = (A:, A[), A is a matrix of coefficients, and E, = (E:, E{). The innovations E,are serially independent, multivariate, normal random variables with contemporaneous covariance matrix V, which allows contemporaneous correlation between the home and foreign innova- tions. Thus the shocks are stochastically related through the off- diagonal elements of A and V. We refer to the off-diagonal elements of A as spillovers since they indicate the extent to which shocks to one country's technology spill over in later periods to the other coun- try. We assume that the vector At is known by agents when they make their date t decisions. We have eliminated from the original Kydland and Prescott (1982) formulation the temporary technology shock and the indicator shock. These features have little influence on the inter- national properties of the economy.
We characterize an equilibrium in this world economy by exploiting the equivalence between competitive equilibria and Pareto optima. Since the utility functions are concave, any optimum can be computed as the solution to a planning problem of the following form: max- imize
subject to the constraints (1)-(7), for some choice of 0 < 4 < 1. As in Negishi (1960) and Mantel (1971), we associate a competitive equilibrium with the solution to this problem for each choice of 4. We compute the competitive equilibrium associated with $ = '12.
Operationally, we approximate the planning problem in the neigh- borhood of the steady state. First we eliminate the single nonlinear constraint, equation (3), by substituting it into the objective function (8). After constructing a quadratic approximation of the resulting function, we maximize it subject to the remaining constraints.
111. Steady State and Parameter Values
We are interested in the properties of our theoretical world economy when both countries have the same structure and parameter values as the single economy of Kydland and Prescott (1982, 1988). Except for the parameters describing the stochastic relationship between home and foreign technology shocks, summarized by the matrix A of coefficients and the covariance matrix V. we use the values that
757 REAL BUSINESS CYCLES
Kydland and Prescott used in their closed-economy real business cycle studies. Here, the parameters of the technology shock process are estimates from international data, so none of the parameter values is chosen to help the model match international business cycle expe- rience.
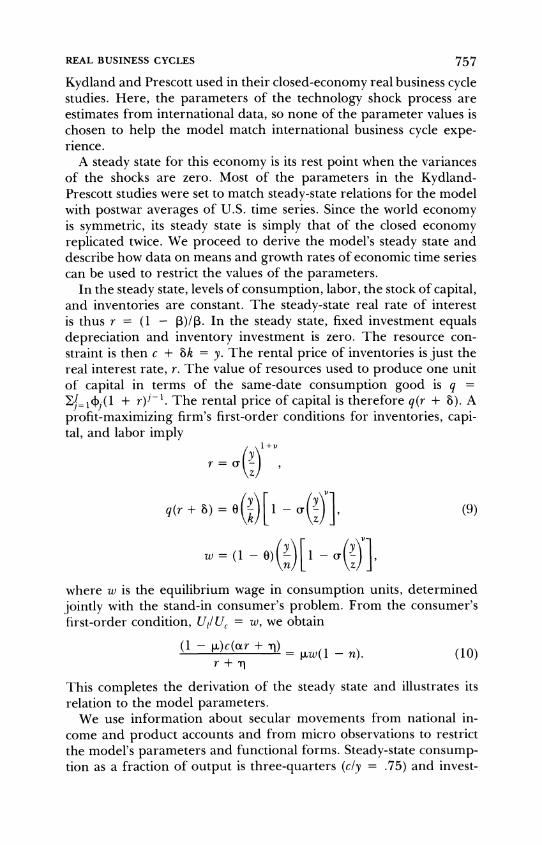
A steady state for this economy is its rest point when the variances of the shocks are zero. Most of the parameters in the Kydland- Prescott studies were set to match steady-state relations for the model with postwar averages of U.S. time series. Since the world economy is symmetric, its steady state is simply that of the closed economy replicated twice. We proceed to derive the model's steady state and describe how data on means and growth rates of economic time series can be used to restrict the values of the parameters.
In the steady state, levels of consumption, labor, the stock of capital, and inventories are constant. The steady-state real rate of interest is thus r = ( 1 - P)IP In the steady state, fixed investment equals depreciation and inventory investment is zero. The resource con- straint is then c + 6k = y. The rental price of inventories is just the real interest rate, r. The value of resources used to produce one unit of capital in terms of the same-date consumption good is q =
q = l + l ( l + r ) l - l . The rental price of capital is therefore q(r + 6). A profit-maximizing firm's first-order conditions for inventories, capi- tal, and labor imply
, , l + u
where w is the equilibrium wage in consumption units, determined jointly with the stand-in consumer's problem. From the consumer's first-order condition, UIIU, = w, we obtain
This completes the derivation of the steady state and illustrates its relation to the model parameters.
We use information about secular movements from national in- come and product accounts and from micro observations to restrict the model's parameters and functional forms. Steady-state consump- tion as a fraction of output is three-quarters (cly = .75) and invest-

758 JOURNAL OF POLITICAL ECONOMY
ment is one-quarter (xly = .25). The mean of the inventoryloutput ratio is one (zly = 1) with output measured at a quarterly rate. The steady-state real interest rate, r, is set equal to 1 percent per quarter, which is close to the average rate of return on capital over the past century. This implies P = l l (1 + r) .99.
The technology parameters are based on the following consider- ations. The Cobb-Douglas form of capitalllabor substitution is chosen to match the relative constancy of the share of output going to labor despite large secular increases in the real wage. The shares going to capital and labor in the model are then approximately 0 and 1 - 0, respectively. In postwar U.S. data, the share going to labor is about .64, so we set 1 - 0 = .64. Aggregate data indicate a depreciation rate, 6, of .025, which implies a capitalloutput ratio of 10. The values of the real interest rate and the inventoryloutput ratio imply, by equation (9), that a = .01. With this value the share of output going to inventories is about 1 percent. The technology parameter v, which determines the elasticity of substitution between inventories and the capitalllabor aggregate, cannot be determined from steady states alone. Kydland and Prescott (1988, p. 351) set v = 3 and cite observa- tions at the firm level. This feature has little effect on the interna- tional aspects of the model. That leaves us with the length of time to build. We follow Kydland and Prescott (1982) in setting J = 4.
Now consider preferences. The Cobb-Douglas specification be- tween consumption and leisure is selected because, despite an enor- mous increase in the real wage, the fraction of time per household allocated to market activities has changed very little over the postwar period. The share parameter, p., is chosen to be consistent with an average hours allocation of 30 percent of the endowment of non- sleeping time to market activities. The value implied by equation (10) when a = 1 is .34. The curvature parameter, y , determines the household's coefficient of relative risk aversion and intertemporal elasticity of substitution. Statistical evidence from U.S. time series, as in Eichenbaum, Hansen, and Singleton (1988), suggests that a value between -2 and .5 is appropriate. We use y = - 1. The absence of additive separability implied by nonzero values of y is potentially important in allowing the economy to account for one of the regulari- ties of international data: the imperfect correlation between con-sumption fluctuations across countries. With logarithmic utility, which corresponds here to y = 0, the period utility function is addi- tively separable and the correlation is one; with other values the cor- relation is smaller. In all but one of our experiments, we eliminate the distributed lag on leisure by setting a = 1. This feature of the economy has, as we show, little effect on the international dimensions of the economy. The evidence of Hotz, Kydland, and Sedlacek

759 REAL BUSINESS CYCLES
(1988), however, suggests that a = .6 and q = .1 mav be more appropriate, and one of our experiments uses these values.
The extra ingredient in the two-country economy is the interaction between foreign and domestic technology shocks. We estimated the parameters of the bivariate shock process using estimates of Solow (1957) residuals for the United States and for an aggregate of major European countries (Austria, Finland, Germany, Italy, Switzerland, and the United Kingdom). The logarithms of the Solow residuals are estimated as log A = log y - (1 - 0)log n from aggregate data on output y and employment n and are normalized so that the mean of A is one. Details are given in the Appendix. The absence of capital stock data for this calculation is probably not a serious problem. Expe- rience indicates that the short-run variability of the capital stock is small and orthogonal to the cycle (table 1). We would prefer to have measures of hours worked, as well as employment, but most countries do not construct comprehensive hours series. Many countries report hours data for manual workers in manufacturing, but we know from U.S. data that manufacturing hours are a small part of the total and are significantly more volatile.
Given these values for A , then, we estimate by least squares the parameters of equation (7) for the United States and our European aggregate, with the United States as the home country. The sample period is 1970 : 1- 1986 :4, which is all the available data. Our esti- mates are
where the numbers in parentheses are standard errors. The standard deviations for innovations to U.S. and European productivity are .00906 and .00797, respectively, and the correlation between the in- novations is .258. The estimated matrix A has eigenvalues of .994 and .818. We estimate the same structure with Solow residuals for the United States and Canada over the same period. In this case the estimates are
with standard deviations .00874 and .01023 and a correlation be- tween innovations of ,434. The eigenvalues are .989 and .796, which are similar to those we found for the United States and Europe. Note that in both systems, estimates of the spillover effect, the off-diagonal elements of A, are generally positive: shocks to productivity in one
760 JOURNAL OF POLITICAL ECONOMY
country produce gradual movements in the same direction in the other country.
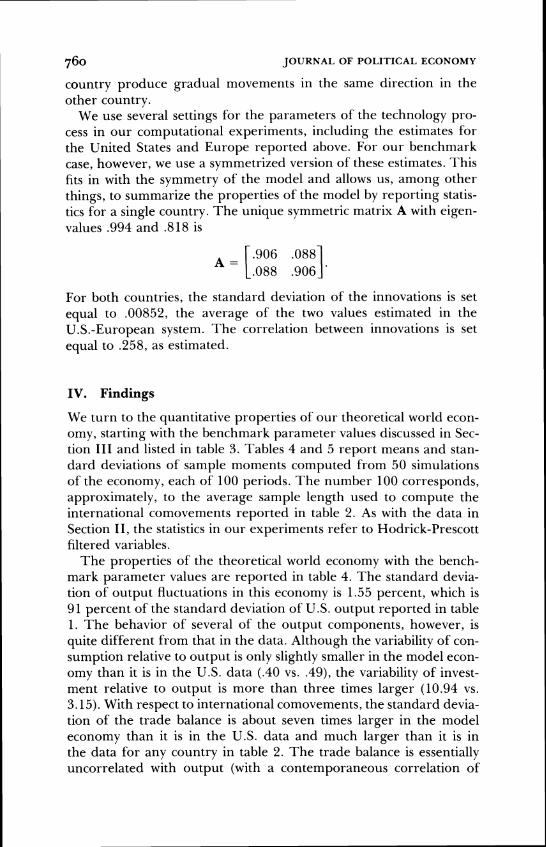
We use several settings for the parameters of the technology pro- cess in our computational experiments, including the estimates for the United States and Europe reported above. For our benchmark case, however, we use a symmetrized version of these estimates. This fits in with the symmetry of the model and allows us, among other things, to summarize the properties of the model by reporting statis- tics for a single country. The unique symmetric matrix A with eigen- values .994 and .818 is
For both countries, the standard deviation of the innovations is set equal to .00852, the average of the two values estimated in the U.S.-European system. The correlation between innovations is set equal to .258, as estimated.
IV. Findings
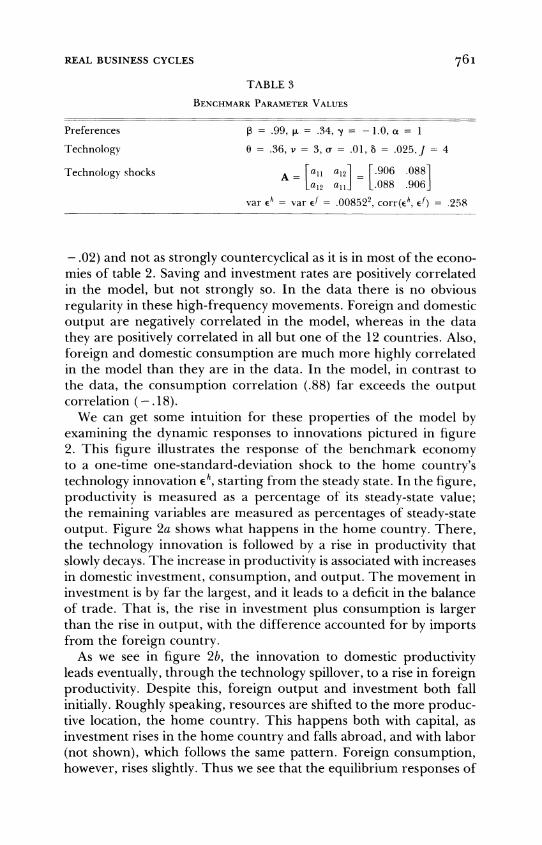
We turn to the quantitative properties of our theoretical world econ- omy, starting with the benchmark parameter values discussed in Sec- tion 111 and listed in table 3. Tables 4 and 5 report means and stan- dard deviations of sample moments computed from 50 simulations of the economy, each of 100 periods. The number 100 corresponds, approximately, to the average sample length used to compute the international comovements reported in table 2. As with the data in Section 11, the statistics in our experiments refer to Hodrick-Prescott filtered variables.
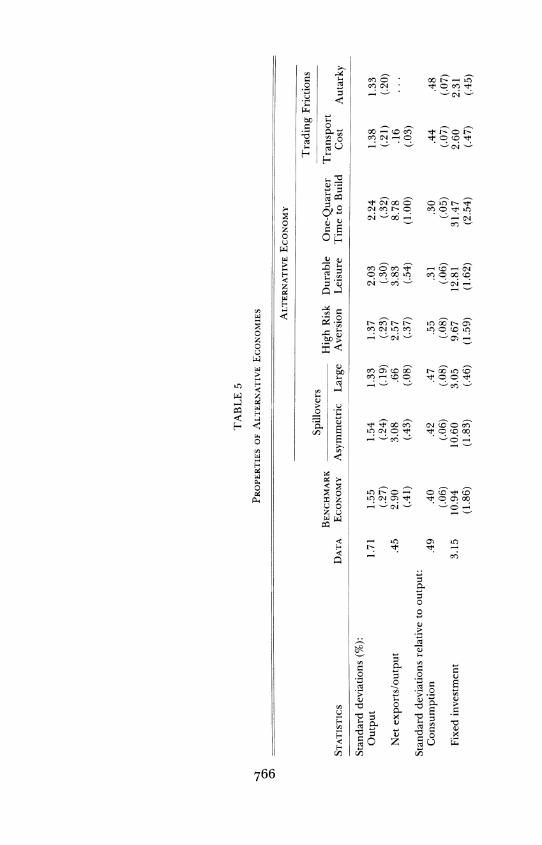
The properties of the theoretical world economy with the bench- mark parameter values are reported in table 4. The standard devia- tion of output fluctuations in this economy is 1.55 percent, which is 91 percent of the standard deviation of U.S. output reported in table 1. The behavior of several of the output components, however, is quite different from that in the data. Although the variability of con- sumption relative to output is only slightly smaller in the model econ- omy than it is in the U.S. data (.40 vs. .49), the variability of invest- ment relative to output is more than three times larger (10.94 vs. 3.15). With respect to international comovements, the standard devia- tion of the trade balance is about seven times larger in the model economy than it is in the U.S. data and much larger than it is in the data for any country in table 2. The trade balance is essentially uncorrelated with output (with a contemporaneous correlation of
761 REAL BUSINESS CYCLES
TABLE 3
Technology !hocks
- .02) and not as strongly countercyclical as it is in most of the econo- mies of table 2. Saving and investment rates are positively correlated in the model, but not strongly so. In the data there is no obvious regularity in these high-frequency movements. Foreign and domestic output are negatively correlated in the model, whereas in the data they are positively correlated in all but one of the 12 countries. Also, foreign and domestic consumption are much more highly correlated in the model than they are in the data. In the model, in contrast to the data, the consumption correlation ( .88) far exceeds the output correlation ( - .18).
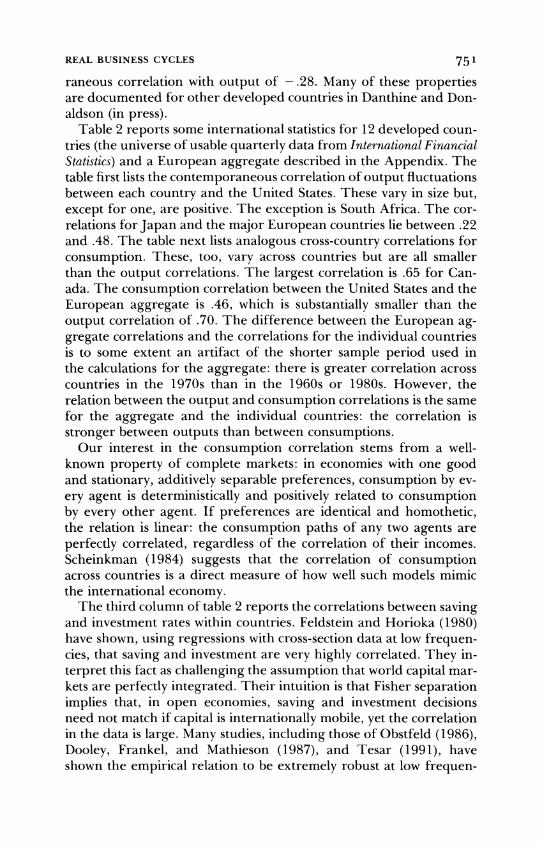
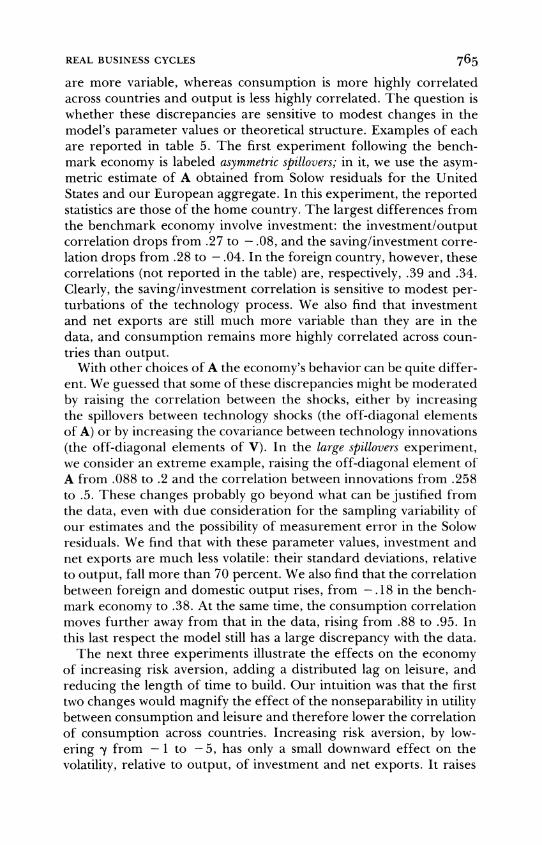
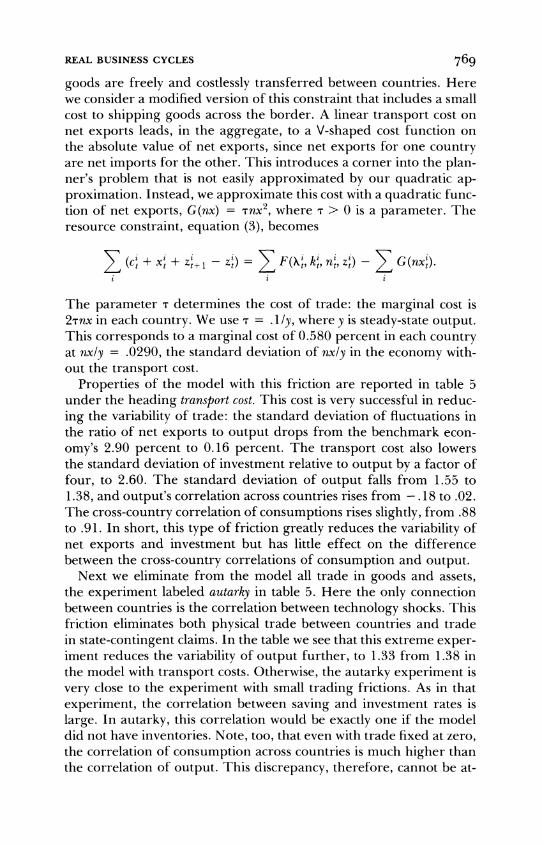
We can get some intuition for these properties of the model by examining the dynamic responses to innovations pictured in figure 2. This figure illustrates the response of the benchmark economy to a one-time one-standard-deviation shock to the home country's technology innovation eh, starting from the steady state. In the figure, productivity is measured as a percentage of its steady-state value; the remaining variables are measured as percentages of steady-state output. Figure 2a shows what happens in the home country. There, the technology innovation is followed by a rise in productivity that slowly decays. The increase in productivity is associated with increases in domestic investment, consumption, and output. The movement in investment is by far the largest, and it leads to a deficit in the balance of trade. That is, the rise in investment plus consumption is larger than the rise in output, with the difference accounted for by imports from the foreign country.
As we see in figure 2b, the innovation to domestic productivity leads eventually, through the technology spillover, to a rise in foreign productivity. Despite this, foreign output and investment both fall initially. Roughly speaking, resources are shifted to the more produc- tive location, the home country. This happens both with capital, as investment rises in the home country and falls abroad, and with labor (not shown), which follows the same pattern. Foreign consumption, however, rises slightly. Thus we see that the equilibrium responses of

Consumption
Fixed investment
Hours
PROPERTIES ECONOMYOF THE BENCHMARK
A. SUMMARYSTATISTICS
Relative to
Percentage Output -
1 .OO (.00) .40
(.06) 10.94 (1.86)
.49 ~ 0 7 )

LC GI. s L C = - - c - w - . . . . . . I - - 1 -
2 zoo Goo f-h ."3C9"9
1 - - -

764 JOURNAL OF POLITICAL ECONOMY
0 I 2 3 4 1 6 7 8 9 10 11 I2 13 14 11 16 17 18 19 a0
Number of quarters
FIG. 2.-Dynamic responses to a one-standard-deviation innovation in the home country's technology shock in the benchmark (free-trade) economy. Productivity is measured as a percentage of its steady-state value. All other variables are measured as a percentage of steady-state output. a , Home country. b, Foreign country.
foreign and domestic consumption have the same sign, but those of foreign and domestic output do not. 'This helps to explain the nega- tive correlation between foreign and domestic output that we saw in table 4.
The benchmark economy, then, differs from postwar international data in several respects. In the model, investment and net exports
765 REAL BUSINESS CYCLES
are more variable, whereas consumption is more highly correlated across countries and output is less highly correlated. The question is whether these discrepancies are sensitive to modest changes in the model's parameter values or theoretical structure. Examples of each are reported in table 5 . The first experiment following the bench- mark economy is labeled asymmetric spillovers; in it, we use the asym- metric estimate of A obtained from Solow residuals for the United States and our European aggregate. In this experiment, the reported statistics are those of the home country. The largest differences from the benchmark economy involve investment: the investmentloutput correlation drops from .27 to - .08, and the savinglinvestment corre- lation drops from .28 to - .04. In the foreign country, however, these correlations (not reported in the table) are, respectively, .39 and .34. Clearly, the savinglinvestment correlation is sensitive to modest per- turbations of the technology process. We also find that investment and net exports are still much more variable than they are in the data, and consumption remains more highly correlated across coun- tries than output.
With other choices of A the economy's behavior can be quite differ- ent. We guessed that some of these discrepancies might be moderated by raising the correlation between the shocks, either by increasing the spillovers between technology shocks (the off-diagonal elements of A) or by increasing the covariance between technology innovations (the off-diagonal elements of V). In the large spillovers experiment, we consider an extreme example, raising the off-diagonal element of A from ,088 to .2 and the correlation between innovations from .258 to . 5 . These changes probably go beyond what can be justified from the data, even with due consideration for the sampling variability of our estimates and the possibility of measurement error in the Solow residuals. We find that with these parameter values, investment and net exports are much less volatile: their standard deviations, relative to output, fall more than 70 percent. We also find that the correlation between foreign and domestic output rises, from - .18 in the bench- mark economy to .38. At the same time, the consumption correlation moves further away from that in the data, rising from .88 to .93. In this last respect the model still has a large discrepancy with the data.
The next three experiments illustrate the effects on the economy of increasing risk aversion, adding a distributed lag on leisure, and reducing the length of time to build. Our intuition was that the first two changes would magnify the effect of the nonseparability in utility between consumption and leisure and therefore lower the correlation of consumption across countries. Increasing risk aversion, by low- ering y from - 1 to -3, has only a small downward effect on the volatility, relative to output, of investment and net exports. It raises

- -- - - - -- - - - - - - - -- -- - -- -
Coriternporar~eous cross correlations with output:
Cor~sumption .76 .79 .76 .89 .88 .7 1 .76 .82 .$11
Fixed investment .90 (.lo) .27
(.14) - .08
( 0 ) .73
(.06) .33
(.12) - .O1
(.lo) - .O1
(.07) .88
(.03) .90
Net exportsloutput -.28 (.09)
-.02 (.13) .30
(.07) -.07
(.09) -.I1
(.08) .23
(.05) . l l
(.03) - .02
(.03) . . .
(.15) (.11) (.05) (.16) International corltempordneous cross
correlations: Foreign arid domestic output .70 - .18 - .26 .38 - . I1 - .46 - .58 .02 . I 1
(.19) (. 16) (.15) (.19) (.16) (. 13) (.17) (.17) Foreign arid domestic rorisumption .46 .88 .85 .95 .74 .84 .69 .91 .73
(.04) (.11) (.02) (.09) (.Oh) (.lo) (.03) (.lo) Saving and investment rates .6Y .28 - .04 .74 .36 - .02 - .01 .90 .90
~ 0 7 ) (13) (.06) (.07) (.06) (.04) (.03) (.03) p~ ~p
~ ~
Nor~.-St.uistic\ are ba\cd on Ilodrlck-Prescott (1980) filtered d.~ta. T h r data column rrfrr \ to the Unitrd States. rxcept the correlation\ hrtwrcn forclgn .ind domesnc output .incl ~ o n \ t ~ l n ~ t i ~ , ~ , which rrfer to thr Unltrd St.uc5 and Europe. Alternativr economy: entries arc aberagrs o \ c r 50 simulations of 100 periods each, numbers in parenthesrs are st.indard de\~atic,ns Pariimeters arc .a in table 9 witlr the following rh.ingrs: For asylnnlrtri~ spillover\, a l l = .904, a,? = ,052, = ,149. as = .908. var ch = .0090fi2, and v.ir cf = ,00797'; I;irgr \pi lh~\rrs , ,rll = up, = .79, usl= a I P= .20, and corr(ch, r J ) = .5; high risk aversion, y = -5, durdble Icisurr, n = y = . I ; one-quartrr tlmc to huild, / = I ; and transport co\t, 7 = . I . Propertlr\ oroutput , .(i, and invr~stmrnt prrtain to Iogaritt~mr of variables, rxcrpt for thc one-qudrtrr tlnlr to build .ind the rlurable-le~surc eronomlr*, where thest. \ariablc\ ;ire ratlo\ to t hn r steady-rtatr values

768 JOURNAL OF POLITICAL ECONOMY
the cross-country output correlation from - .18 to - . l l and lowers the consumption correlation from .88 to .74, but the consumption correlation still far exceeds the output correlation. The distributed lag on leisure, which makes leisure durable, increases the variability of output and investment. It raises the intertemporal substitutability of leisure and leads, as it does in Kydland and Prescott's (1982) closed-economy study, to more volatile hours in equilibrium: the stan- dard deviation of hours relative to output rises from the benchmark's .49 to .67 (not reported in the table). This leads to greater variation in the marginal product of capital at a given level of the capital stock, thus raising the variability of investment relative to output from 10.94 to 12.8 1. The distributed lag, however, has little effect on the differ- ence between cross-country output and consumption correlations.
Time to build has a strong influence on the model's properties. With J = 1 instead of 4, so that investment made in one quarter raises the capital stock the next quarter instead of a year later, the standard deviation of output rises 45 percent to 2.24. The standard deviation of investment relative to output, which in the benchmark economy is three times larger than in the data, is now 10 times larger. In the closed economy, the variability of investment is not very sensi- tive to the choice of J: the standard deviation is about the same with J = 1 as with J = 4. As a result, Hansen (1985), Christian0 and Eichenbaum (1988), and others use the simpler one-quarter construc- tion period in closed-economy studies. In this respect, the length of time to build is more critical in the open economy.
V. Trading Frictions
We continue our sensitivity analysis by considering modifications to the theoretical structure. Our intuition is that the largest discrepan- cies we have found between theory and data reflect the ability of agents in the model to shift resources across countries and to trade in markets for state-contingent claims. The ability to shift resources allows agents to shift capital and production effort to the country with the higher current technology shock; that movement shows up in the model as excessive variability of investment and negative corre- lation of output across countries. Consumers' ability to insure them- selves against adverse movements in their own technology shocks suggests that the shifting of production will not be reflected in con- sumption plans.
We therefore investigate frictions in the physical trading process and, in one extreme experiment, the market structure. ilie start by adding a trading friction, which we interpret as a transport cost. In its original form, the resource constraint, equation (3), implies that
769 REAL BUSINESS CYCLES
goods are freely and costlessly transferred between countries. Here we consider a modified version of this constraint that includes a small cost to shipping goods across the border. A linear transport cost on net exports leads, in the aggregate, to a V-shaped cost function on the absolute value of net exports, since net exports for one country are net imports for the other. This introduces a corner into the plan- ner's problem that is not easily approximated by our quadratic ap- proximation. Instead, we approximate this cost with a quadratic func- tion of net exports, G(nx) = 7nx2 ,where T > 0 is a parameter. The resource constraint, equation (3), becomes
1(c: + x; + ziiI - z ; ) = 1F ( A ; ,kj, nj, 2 ; ) -1G ( ~ x ; ) . 1 I 1
The parameter T determines the cost of trade: the marginal cost is 2 ~ n xin each country. M7e use T = . 1 / j ,where j is steady-state output. This corresponds to a marginal cost of 0.380 percent in each country at nxl j = .0290, the standard deviation of nxly in the economy with- out the transport cost.
Properties of the model with this friction are reported in table 3 under the heading transport cost. This cost is very successful in reduc- ing the variability of trade: the standard deviation of fluctuations in the ratio of net exports to output drops from the benchmark econ- omy's 2.90 percent to 0.16 percent. The transport cost also lowers the standard deviation of investment relative to output by a factor of four, to 2.60. The standard deviation of output falls from 1.35 to 1.38, and output's correlation across countries rises from - . 18 to .02. The cross-country correlation of consumptions rises slightly, from .88 to .91. In short, this type of friction greatly reduces the variability of net exports and investment but has little effect on the difference between the cross-country correlations of consumption and output.
Next we eliminate from the model all trade in goods and assets, the experiment labeled autarkj in table 3. Here the only connection between countries is the correlation between technology shocks. This friction eliminates both physical trade between countries and trade in state-contingent claims. In the table we see that this extreme exper- iment reduces the variability of output further, to 1.33 from 1.38 in the model with transport costs. Otherwise, the autarky experiment is very close to the experiment with small trading frictions. As in that experiment, the correlation between saving and investment rates is large. In autarky, this correlation would be exactly one if the model did not have inventories. Note, too, that even with trade fixed at zero, the correlation of consumption across countries is much higher than the correlation of output. This discrepancy, therefore, cannot be at-

-------------------- --------
JOURNAL OF POLITICAL ECONOMY
% 1.2
>
Investment
4 . 2 . . . . . . . . . . . . . . 0 1 2 3 4 5 6 7 8 9 1 0 1 1 1 2 1 3 L i { 5 L b L j ~ ] ~ ~
Number ofquarters
% b 1.2
1-
as-
0.6- Roductivity
0.4 -
4 . 2 . . . . . . . . . . . . . . 0 1 2 3 4 5 6 7 8 9 1 0 1 1 1 2 1 3 1 i 1 j 1 k I j ~ ~ ~ ~ ~
Numberof quarters
FIG. 3.-Dynamic responses to a one-standard-deviation innovation in the foreign country's technology shock in the autarky economy. Productivity is measured as a percentage of its steady-state value. All other variables are measured as a percentage of steady-state output. a , Home country. b, Foreign country.
tributed to imperfect capital markets alone, since no assets are traded in this world.
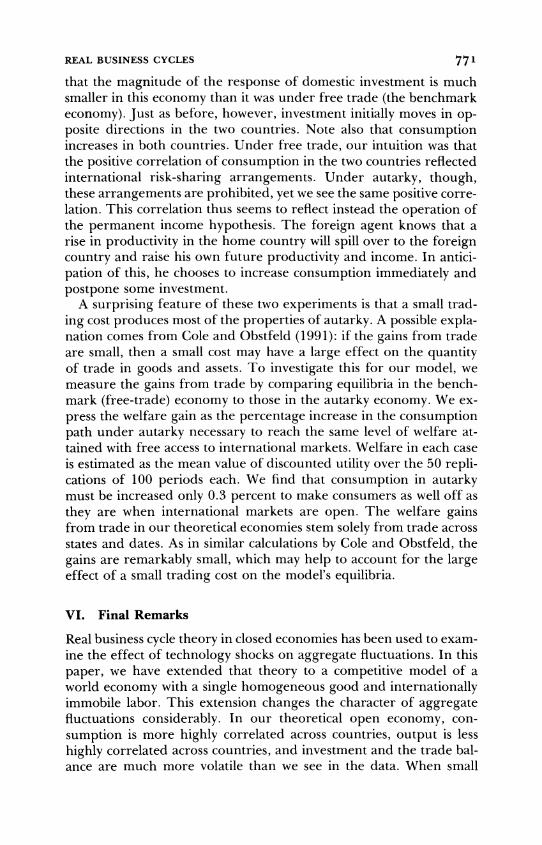
Figure 3 illustrates the dynamic responses in the autarky economy to a one-standard-deviation shock to domestic technology-the same experiment we examined in figure 2. The responses of the technology shocks, k h and if,are the same as those we saw earlier, but other responses are restricted by the complete absence of trade. Note, first,
REAL BUSINESS CYCLES 77'
that the magnitude of the response of domestic investment is much smaller in this economy than it was under free trade (the benchmark economy). Just as before, however, investment initially moves in op- posite directions in the two countries. Note also that consumption increases in both countries. Under free trade, our intuition was that the positive correlation of consumption in the two countries reflected international risk-sharing arrangements. Under autarky, though, these arrangements are prohibited, yet we see the same positive corre- lation. This correlation thus seems to reflect instead the operation of the permanent income hypothesis. The foreign agent knows that a rise in productivity in the home country will spill over to the foreign country and raise his own future productivity and income. In antici- pation of this, he chooses to increase consumption immediately and postpone some investment.
A surprising feature of these two experiments is that a small trad- ing cost produces most of the properties of autarky. A possible expla- nation comes from Cole and Obstfeld (1991): if the gains from trade are small, then a small cost may have a large effect on the quantity of trade in goods and assets. To investigate this for our model, we measure the gains from trade by comparing equilibria in the bench- mark (free-trade) economy to those in the autarky economy. We ex- press the welfare gain as the percentage increase in the consumption path under autarky necessary to reach the same level of welfare at- tained with free access to international markets. Welfare in each case is estimated as the mean value of discounted utility over the 50 repli-cations of 100 periods each. We find that consumption in autarky must be increased only 0.3 percent to make consumers as well off as they are when international markets are open. The welfare gains from trade in our theoretical economies stem solely from trade across states and dates. As in similar calculations by Cole and Obstfeld, the gains are remarkably small, which may help to account for the large effect of a small trading cost on the model's equilibria.
VI. Final Remarks
Real business cycle theory in closed economies has been used to exam- ine the effect of technology shocks on aggregate fluctuations. In this paper, we have extended that theory to a competitive model of a world economy with a single homogeneous good and internationally immobile labor. This extension changes the character of aggregate fluctuations considerably. In our theoretical open economy, con- sumption is more highly correlated across countries, output is less highly correlated across countries, and investment and the trade bal- ance are much more volatile than we see in the data. When small

772 JOURNAL OF POLITICAL ECONOMY
trading frictions are introduced, the volatilities of investment and net exports fall sharply. The consumptionioutput discrepancy, however, is much more robust. In all of our experiments-including those with trading frictions, small or prohibitive, and those with several alternative parameter settings-the cross-country correlation of con- sumption remains substantially larger than the output correlation. In the data the output correlation is generally larger. Since this feature is robust to a number of reasonable changes in the economy, we label it an anomaly.
The consumptionloutput anomaly suggests that for most questions calling for an international version of the neoclassical business cycle framework, further theoretical development is needed. An example of such a question is whether the possibility of international trade alters our assessment of the importance of technology shocks for aggregate fluctuations. In open economies, additional sources of shocks may be more important than they have been in closed econo- mies. Other questions for international business cycle theory concern the behavior of relative prices of international goods, comovements between relative prices and the balance of trade, and the international comovements of consumption and output. Clearly these questions require modification or extension of the theoretical structure studied in this paper. Recent examples include asymmetries of country size in Baxter and Crucini (1991), additional sources of shocks in Cardia (1991), alternative preference relations in Mendoza (1991) and Dev- ereux, Gregory, and Smith (in press), and multiple produced and traded goods in Ravn (1990) and Stockman and Tesar (1990). It remains to be seen whether these features can provide a persuasive resolution of the consumptionioutput anomaly.
All these papers focus on the behavior of stochastic growth models at business cycle frequencies. A complementary issue is the ability of these models to account for comovements at low frequencies. We observe, for example, that poor but quickly growing countries borrow less from richer, more slowly growing countries than theory suggests. This and other low-frequency discrepancies between theory and data provide additional topics for further work.
Appendix
Data Sources
The business cycle properties documented in tables 1 and 2 are based on data from two sources: table 1 on Citibank's Citibase and table 2 on the International Monetary Fund's In te~nat ional Financial Statislics (IFS). The Solow residuals examined in Section 111 also used labor data published by the

773 REAL BUSINESS CYCLES
Organization for Economic Cooperation and Development (OECD). Details follow.
Table 1.-The series (description, Citibase mnemonic) are output (gross national product, GNP82), consumption (personal consumption expendi- tures on nondurables and services, CN82 +CS82), fixed investment (gross private domestic fixed investment, GIF82), hours (person-hours of the em- ployed labor force from the household survey, LHOURS), capital stock (net capital stock for nonresidential fixed investment, KN72 from an older Citi- base tape), inventory stock (stock of nonfarm inventories, GLN82), and net export~loutput (ratio of current-dollar net exports of goods and services to current-dollar GNP, GNETIGNP). With the exception of the ratio of net exports to output, which is based on current prices, and the capital stock, which is in 1972 prices, all series are in 1982 prices.
Table 2.-The series (description, IFS line number) are consumption (pri- vate consumption, 96f, divided by the output deflator), savings rate (ratio of nominal output minus private and government consumption, 99x - 96f -91f , to nominal output), investment rate (ratio of gross fixed capital forma- tion, 93e, to nominal output), and net exportsloutput (ratio of exports minus imports of goods and services, 90c - 98c, to nominal output). On the IFS tape, all series but real output are nominal. We deflated them, as stated, with the output deflator, computed as the ratio of nominal to real output. The nominal output series are 99x, with x = a or b as described below. The real output series are real GNP or GDP, labeled 99x.y, for x = a or b and y = p or r. The suffixes denote the output concept (GNP or GDP) and seasonal adjustment: x = a indicates GNP, x = b indicates GDP, y = r indicates seasonally adjusted, y = p indicates not seasonally adjusted. The output series are GNP for Canada, Germany, Japan, and the United States and GDP for the rest. With the exception of Australia, Austria, and Finland, the data are seasonally adjusted. We seasonally adjusted the data for these countries by the X-1 1 method.
The European aggregates for output and consumption are sums of real quantities for the European countries: Austria, Finland, France, Germany, Italy, Switzerland, and the United Kingdom. We use Summers and Heston's (1988) data on real output and consumption in international prices for 1985 to translate real output and consumption into comparable units. The idea is to multiply each series by a constant chosen to match the average value of the series in 1985 to the Summers-Heston number. The Summers-Heston number for real output in 1985 is the product of per capita GDP and popula- tion (variables 2 and 1 in their table 3). The number for real consumption is the product of per capita GDP, population, and the consumption share (vari- ables 2, 1, and 3 of the same table). European output and consumption are the sums of the individual country series after translation.
Solow residuals.-We constructed Solow residuals for the United States, Canada, and a European aggregate from real output and labor input by the formula
log h, = logy, - (1 - O)logn,,
with 0 = .36. The output series is real output from the IFS tape, as described above. The labor input variable is civilian employment, from Data Resources Incorporated's OECD Main Economic Indicators data base. The European aggregate includes Austria, Finland, Germany, Italy, Switzerland, and the United Kingdom. We excluded France because it did not collect labor data

774 JOURNAL OF POLITICAL ECONOMY
according to International Labor Office standards in the 1960s and 1970s and because the OECD does not report civilian employment in France until 198 1. The European labor aggregate is the sum of the values for the individ- ual countries, measured in thousands of workers. The European output ag- gregate is analogous to the one used in table 2, with France omitted. Before estimating the technology process, we scaled each estimate of A to give it a sample mean of one.
References
Backus, David K., and Kehoe, Patrick J. "International Evidence on the His- torical Properties of Business Cycles." A.E.R. (in press).
Baxter, Marianne, and Crucini, Mario. "Explaining SavingiInvestment Cor- relations." Manuscript. Rochester, N.Y.: Univ. Rochester, May 1991.
Cantor, Richard, and Mark, Nelson C. "The International Transmission of Real Business Cycles." Internat. Econ. Rev. 29 (August 1988): 493-507.
Cardia, Emanuela. "The Dynamics of a Small Open Economy in Response to Monetary, Fiscal, and Productivity Shocks." J.Monetary Econ. 28 (December 1991): 411-34.
Christiano, Lawrence J., and Eichenbaum, Martin. "Current Real Business Cycle Theories and Aggregate Labor Market Fluctuations." Manuscript. Cambridge, Mass.: NBER, October 1988.
Cole, Harold, and Obstfeld, Maurice. "Commodity Trade and International Risk Sharing: How Much Do Financial Markets Matter?" J. Monetary Econ. 28 (August 1991): 3-24.
Danthine, Jean-Pierre, and Donaldson, John. "Methodological and Empirical Issues in Real Business Cycle Theory." European Econ. Rev. (in press).
Dellas, Harris. "A Real Model of the World Business Cycle." J.Internat. Money and Finance 5 (September 1986): 381-94.
Devereux, Michael; Gregory, Allan; and Smith, Gregor. "Realistic Cross- Country Consumption Correlations in a Two-Country, Equilibrium, Busi- ness Cycle Model." J. Internat. Money and Finance (in press).
Dooley, Michael P.; Frankel, Jeffrey A.; and Mathieson, Donald J. "Interna- tional Capital Mobility: What Do Saving-Investment Correlations Tell Us?" Internat. Monetary Fund Staff Papers 34 (September 1987): 503-30.
Eichenbaum, Martin S.; Hansen, Lars Peter; and Singleton, Kenneth J. "A Time Series Analysis of Representative Agent Models of Consumption and Leisure Choice under Uncertainty." Q1J.E. 103 (February 1988): 51-78.
Feldstein, Martin S., and Horioka, Charles. "Domestic Saving and Interna- tional Capital Flows." Econ. J. 90 (June 1980): 314-29.
Hansen, Gary D. "Indivisible Labor and the Business Cycle." J.Monetary Econ. 16 (November 1985): 309-27.
Hodrick, Robert J . , and Prescott, Edward C. "Post-War C.S. Business Cycles: An Empirical Investigation." Manuscript. Pittsburgh: Carnegie Mellon Cniv., November 1980.
Hotz, V. Joseph; Kydland, Finn E.; and Sedlacek, Guilherme L. "Intertempo- ral Preferences and Labor Supply." Econornetrica 56 (March 1988): 335-60.
King, Robert G., and Rebelo, Sergio. "Low Frequency Filtering and Real Business Cycles." Manuscript. Rochester, N.Y.: Univ. Rochester, October 1989.
Krugman, Paul R., and Baldwin, Richard E. "The Persistence of the C.S. Trade Deficit." Brookings Papers Econ. Activity, no. 1 (1987), pp. 1-43.
775 REAL BUSINESS CYCLES
Kydland, Finn E., and Prescott, Edward C. "Time to Build and Aggregate Fluctuations." Econometrica 50 (November 1982): 1345-70.
. "The Workweek of Capital and Its Cyclical Implications." J.Monetaq Econ. 21 (MarchiMay 1988): 343-60.
. "Business Cycles: Real Facts and a Monetary Myth." Fed. Reserve Bank Minneapolis Q. Rev. 14 (Spring 1990): 3-18.
Mantel, Rolf R. "The Welfare Adjustment Process: Its Stability Properties." Internat. Econ. Rev. 12 (October 1971): 415-30.
Mendoza, Enrique G. "Real Business Cycles in a Small Open Economy." A.E.R. 81 (September 1991): 797-818.
Negishi, Takashi. "Welfare Economics and Existence of an Equilibrium for a Competitive Economy." Metroeconomica 12 (August-December 1960): 92-97.
Obstfeld, Maurice. "Capital Mobility in the World Economy: Theory and Measurement." Carnegze-Rochester Conf. Ser. Public Policy 24 (Spring 1986): 55-103.
Prescott, Edward C. "Theory Ahead of Business-Cycle Measurement." Carnegie-Rochester Conf. Ser. Public Policy 25 (Autumn 1986): 11-44. Re-printed in Fed. Reserve Bank Minneapolis 4. Rev. 10 (Fall 1986): 9-22.
Ravn, Morten 0. "The Balance of Trade in Real Business Cycles." Manu- script. Southampton: Univ. Southampton, 1990.
Scheinkman, Jose A. "General Equilibrium Models of Economic Fluctuations: A Survey of Theory." Manuscript. Chicago: Univ. Chicago, June 1984.
Solow, Robert M. "Technical Change and the Aggregate Production Func- tion." Rev. Econ. and Statis. 39 (August 1957): 312-20.
Stockman, Alan C., and Svensson, Lars E. 0 . "Capital Flows, Investment, and Exchange Rates." J. Monetaq Econ. 19 (March 1987): 17 1-201.
Stockman, Alan C., and Tesar, Linda L. "Tastes and Technology in a Two- Country Model of the Business Cycle." Manuscript. Rochester, N.Y.: Cniv. Rochester, November 1990.
Summers, Robert, and Heston, Alan. "A New Set of International Compari- sons of Real Product and Price Levels: Estimates for 130 Countries, 1950- 1985." Rev. Income and Wealth 34 (March 1988): 1-25.
Taylor, Stephen. "World Payments Imbalances and U.S. Statistics." In The Measurement of Saving, Investment, and Wealth, edited by Robert E. Lipsey and Helen Stone Tice. Studies in Income and Wealth, vol. 52. Chicago: Univ. Chicago Press (for NBER), 1989.
Tesar, Linda L. "Savings, Investment, and International Capital Flows." J. Internat. Econ. 31 (August 1991): 55-78.

You have printed the following article:
International Real Business CyclesDavid K. Backus; Patrick J. Kehoe; Finn E. KydlandThe Journal of Political Economy, Vol. 100, No. 4. (Aug., 1992), pp. 745-775.Stable URL:
http://links.jstor.org/sici?sici=0022-3808%28199208%29100%3A4%3C745%3AIRBC%3E2.0.CO%3B2-7
This article references the following linked citations. If you are trying to access articles from anoff-campus location, you may be required to first logon via your library web site to access JSTOR. Pleasevisit your library's website or contact a librarian to learn about options for remote access to JSTOR.
References
Domestic Saving and International Capital FlowsMartin Feldstein; Charles HoriokaThe Economic Journal, Vol. 90, No. 358. (Jun., 1980), pp. 314-329.Stable URL:
http://links.jstor.org/sici?sici=0013-0133%28198006%2990%3A358%3C314%3ADSAICF%3E2.0.CO%3B2-4
Intertemporal Preferences and Labor SupplyV. Joseph Hotz; Finn E. Kydland; Guilherme L. SedlacekEconometrica, Vol. 56, No. 2. (Mar., 1988), pp. 335-360.Stable URL:
http://links.jstor.org/sici?sici=0012-9682%28198803%2956%3A2%3C335%3AIPALS%3E2.0.CO%3B2-W
Time to Build and Aggregate FluctuationsFinn E. Kydland; Edward C. PrescottEconometrica, Vol. 50, No. 6. (Nov., 1982), pp. 1345-1370.Stable URL:
http://links.jstor.org/sici?sici=0012-9682%28198211%2950%3A6%3C1345%3ATTBAAF%3E2.0.CO%3B2-E
http://www.jstor.org
LINKED CITATIONS- Page 1 of 1 -