Embed Size (px)
Citation preview
INFANT MORTALITY RESEARCH PARTNERSHIP
Reducing Infant Mortality in Ohio: Individuals, Communities,
Systems, and Interventions
June 2019
Infant Mortality Research Partnership 2
TABLE OF CONTENTS
Infant Mortality Research Partnership ....................................................................... 1
Executive Summary .......................................................................................................... 4
Section 1: Introduction and background ......................................................................... 5
1.0 Background and Rationale ........................................................................................................................................ 5
1.1 Data Used for the IMRP ............................................................................................................................................ 6
1.2 Overview of the Methodology ........................................................................................................................ 7
1.2.1 Researchers’ Roles and Deliverables .................................................................................................................. 8
1.3 References .................................................................................................................................................................... 9
Section 2: Spatiotemporal analysis of infant mortality and preterm birth in Ohio . 11
2.1 Introduction and Objectives .................................................................................................................................. 11
2.2 Methods ...................................................................................................................................................................... 11
2.3 Key Findings ............................................................................................................................................................... 12
2.4 Implications/Conclusions ......................................................................................................................................... 19
2.5 References .................................................................................................................................................................. 20
Section 3: Predictive Modeling: Individual predictive modeling of preterm birth and
infant mortality ................................................................................................................ 22
3.1 Introduction and Objectives .................................................................................................................................. 22
3.2 Methods ...................................................................................................................................................................... 22
3.3 Key Findings ............................................................................................................................................................... 23
3.4 References .................................................................................................................................................................. 31
Section 4: Discussion ....................................................................................................... 32
4.1 Putting Results into Context .................................................................................................................................. 32
4.1.1 Individual-Level ....................................................................................................................................................... 32
4.1.2 Organizational-Level ............................................................................................................................................. 33
Infant Mortality Research Partnership 3
4.1.3 Community-Level .................................................................................................................................................. 33
4.1.4 Policy-Level ............................................................................................................................................................. 34
4.2 Implementing the IMRP models ............................................................................................................................. 35
4.3 Putting It All Together: The Infant Mortality Reduction Analytics Dashboard .......................................... 35
4.4 Strengths of the Partnership .................................................................................................................................. 36
4.5 Limitations of the Work ......................................................................................................................................... 36
4.6 Recommended Next Steps ..................................................................................................................................... 37
4.7 References .................................................................................................................................................................. 39
ACKNOWLEDGEMENTS .............................................................................................. 40
Infant Mortality Research Partnership Members ..................................................................................................... 41
Infant Mortality Research Partnership 4
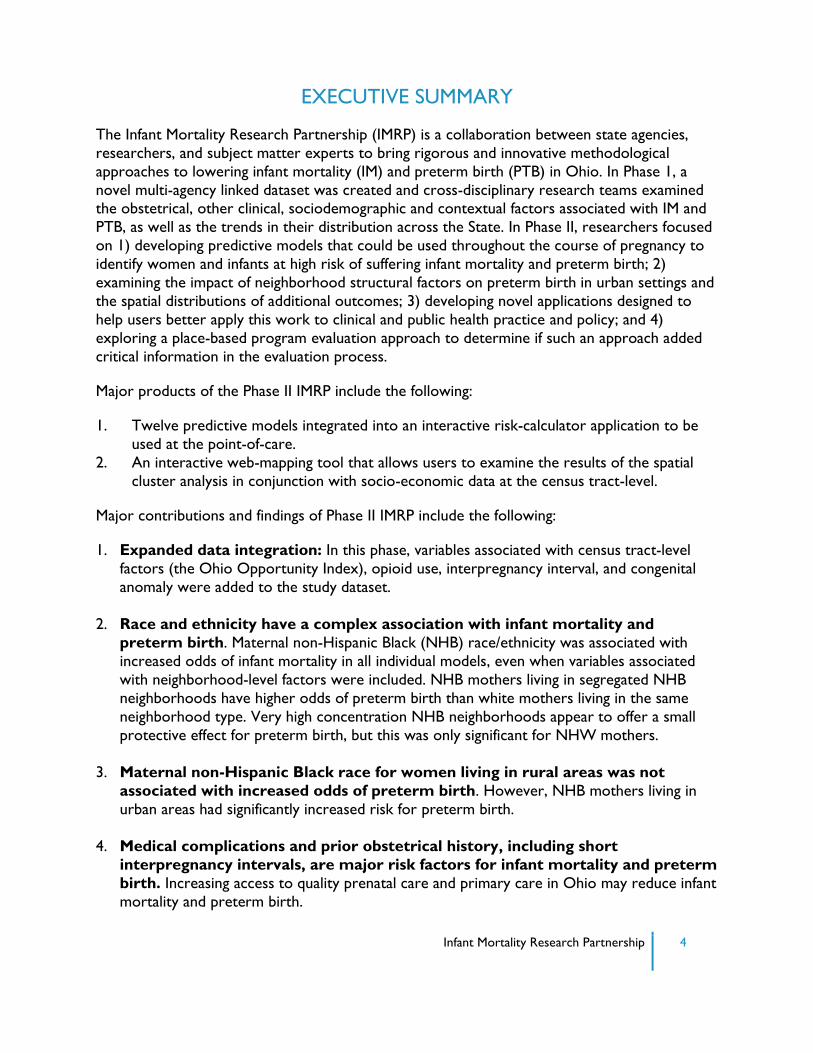
EXECUTIVE SUMMARY
The Infant Mortality Research Partnership (IMRP) is a collaboration between state agencies,
researchers, and subject matter experts to bring rigorous and innovative methodological
approaches to lowering infant mortality (IM) and preterm birth (PTB) in Ohio. In Phase 1, a
novel multi-agency linked dataset was created and cross-disciplinary research teams examined the obstetrical, other clinical, sociodemographic and contextual factors associated with IM and
PTB, as well as the trends in their distribution across the State. In Phase II, researchers focused
on 1) developing predictive models that could be used throughout the course of pregnancy to
identify women and infants at high risk of suffering infant mortality and preterm birth; 2)
examining the impact of neighborhood structural factors on preterm birth in urban settings and
the spatial distributions of additional outcomes; 3) developing novel applications designed to
help users better apply this work to clinical and public health practice and policy; and 4)
exploring a place-based program evaluation approach to determine if such an approach added
critical information in the evaluation process.
Major products of the Phase II IMRP include the following:
1. Twelve predictive models integrated into an interactive risk-calculator application to be
used at the point-of-care.
2. An interactive web-mapping tool that allows users to examine the results of the spatial
cluster analysis in conjunction with socio-economic data at the census tract-level.
Major contributions and findings of Phase II IMRP include the following:
1. Expanded data integration: In this phase, variables associated with census tract-level
factors (the Ohio Opportunity Index), opioid use, interpregnancy interval, and congenital
anomaly were added to the study dataset.
2. Race and ethnicity have a complex association with infant mortality and
preterm birth. Maternal non-Hispanic Black (NHB) race/ethnicity was associated with
increased odds of infant mortality in all individual models, even when variables associated
with neighborhood-level factors were included. NHB mothers living in segregated NHB
neighborhoods have higher odds of preterm birth than white mothers living in the same
neighborhood type. Very high concentration NHB neighborhoods appear to offer a small
protective effect for preterm birth, but this was only significant for NHW mothers.
3. Maternal non-Hispanic Black race for women living in rural areas was not
associated with increased odds of preterm birth. However, NHB mothers living in
urban areas had significantly increased risk for preterm birth.
4. Medical complications and prior obstetrical history, including short
interpregnancy intervals, are major risk factors for infant mortality and preterm
birth. Increasing access to quality prenatal care and primary care in Ohio may reduce infant
mortality and preterm birth.
Infant Mortality Research Partnership 5
5. Severe mental illness in the prenatal period is associated with infant
mortality. Interventions could be focused on improving the integration of mental health
services with prenatal care.
6. Living in an area with a high violent crime rate increases the risks of infant
mortality and preterm birth. Interventions to make neighborhoods safer could have an
impact on the health of women and infants in Ohio.
7. Place-based evaluation approaches, using vital statistics and Medicaid data, can
provide critical information for program design and evaluation at the local level.
SECTION 1: INTRODUCTION AND BACKGROUND
1.0 Background and Rationale
The infant mortality rate (IMR), defined as the number of deaths in the first year of life per
1,000 live births, reflects not only maternal and infant health but also the overall health of a community, state, or nation (1). In the United States, the IMR has progressively declined in
recent years to reach 5.8/1,000 in 2017, a rate below the Healthy People 2020 goal (2).
However, the IMR for non-Hispanic Black (NHB) infants in many U.S. states and cities is more
than twice as high as for non-Hispanic White (NHW) infants.
In 2017, Ohio had one of the higher reported IMRs in the United States (3). A variety of
strategies, including national, statewide, and community-based initiatives, have been undertaken
to reduce both the overall IMR in Ohio and narrow its racial disparity. In 2017, Ohio’s rate had
improved to 7.2/1,000 from 7.4/1000 in 2016; however, the NHB IMR increased to 15.6/1000
while the NHW IMR dropped to 5.3/1000, widening an existing disparity (4). Previous work has
suggested that up to one third of this disparity may reflect Ohio’s reporting of pre-viable live
births as liveborn, a disproportionate number of which are NHB infants (5).
To reduce this disparity, The Ohio Department of Health (ODH) joined the national Institute
for Equity in Birth Outcomes initiative and designated the nine counties and communities in
which the majority of Ohio’s NHB babies are born as Ohio Equity Institute (OEI)
communities. Building on the Ohio Department of Health Infant Mortality Reduction plan and
the Ohio Commission on Infant Mortality report, legislators enacted S.B. 332. Also known as
the Infant Mortality Reduction Bill, it contains provisions that address factors known to affect
infant mortality. For example, it supports strategies to reduce premature births by increasing
availability and use of progesterone therapy, and to reduce unintended pregnancies via long-
acting reversible contraceptives (LARC). The State Health Improvement Plan for 2017-2019
includes a strong focus on maternal and infant health to achieve health equity and reduce infant
mortality. To examine the specific risk factors for different populations as well as individual
risks, a more coordinated effort, grounded in Ohio-specific data, was needed.
Infant Mortality Research Partnership 6
Infant mortality is a complex problem with varied contributing factors that are themselves often
interacting, and as such effective solutions require a multi-pronged, multi-sector approach (6).
Poor birth outcomes such as preterm birth (PTB, defined as birth prior to 37 weeks gestation),
very preterm birth (<32 weeks), low birth weight (LBW, defined as weight <2500 grams), very
low birth weight (<1500 grams) and infant mortality have long been understood as the result of
medical risk factors (high blood pressure, diabetes, short cervix, etc.), and factors related to
social and behavioral health (e.g., socioeconomic status, racism, neighborhood characteristics,
access to prenatal care, smoking, alcohol or drug abuse). Researchers and policymakers alike
increasingly recognize the role of structural and institutional factors (i.e., social determinants of
health) that directly and indirectly impact maternal and child health, as well as their relationship
to medical, psychosocial, and demographic risk factors (7, 8). By identifying these complex,
contributing factors of infant mortality and the interactions among them, a more effective set of
interventions responsive to the various populations and geographic regions across the state of
Ohio, can be developed and implemented (9, 10).
The need for a statewide research collaboration to address this public health issue was
identified by the Ohio Legislature, the Governor’s Office of Health Transformation (OHT), and the Ohio Departments of Medicaid (ODM), Health (ODH), and Higher Education (ODHE). The
Infant Mortality Research Partnership was launched in this spirit. The IMRP project design
incorporated multiple methodologies to span multiple domains and levels. The design was
intended to explicitly model nuance in infant mortality risk factors (i.e. move beyond poverty as
the primary risk factor), as well as capture a cohesive and more comprehensive portrait of the
complexity of infant mortality.
The Ohio Colleges of Medicine Government Resource Center (GRC) was charged with
administering the IMRP. Phase 1 of the IMRP consisted of three teams who approached the
problem of infant mortality from the diverse perspectives of geospatial distribution, systems
dynamic modeling, and predictive modeling. These teams made significant strides to understand
the complex factors associated with risk of infant mortality. Phase II of IMRP continued with
two teams with expertise in geospatial modeling and point-of-care predictive models with a
greater focus on creating actionable and usable tools. These two teams worked together to
share resources and tools to better integrate their work. This report focuses on the findings of
Phase II of the IMRP.
1.1 Data Used for the IMRP
This initiative employed an innovative approach to identify the causes of infant mortality and to
determine the best mix of interventions to reduce the IMR. Driving this multi-method,
interdisciplinary approach was the construction of a multidimensional dataset. Thanks to a
multi-agency effort, facilitated by data preparation, linkage and management by GRC, infant
mortality researchers had access to comprehensive, linked datasets that included physical and
mental health variables, indicators of numerous social determinants of health, and data on the
utilization of some community and government programs. (See Table 1 for the full list of
available datasets.) This application of big data to the pervasive, complex problem of infant
mortality enabled researchers to develop more accurate models of the factors impacting risk,
Infant Mortality Research Partnership 7
and the interventions that can improve maternal and child health outcomes across the state of
Ohio.
1.2 Overview of the Methodology
The IMRP Phase II comprised two complementary research teams, each conducting data
analyses toward answering one of the partnership’s key questions.
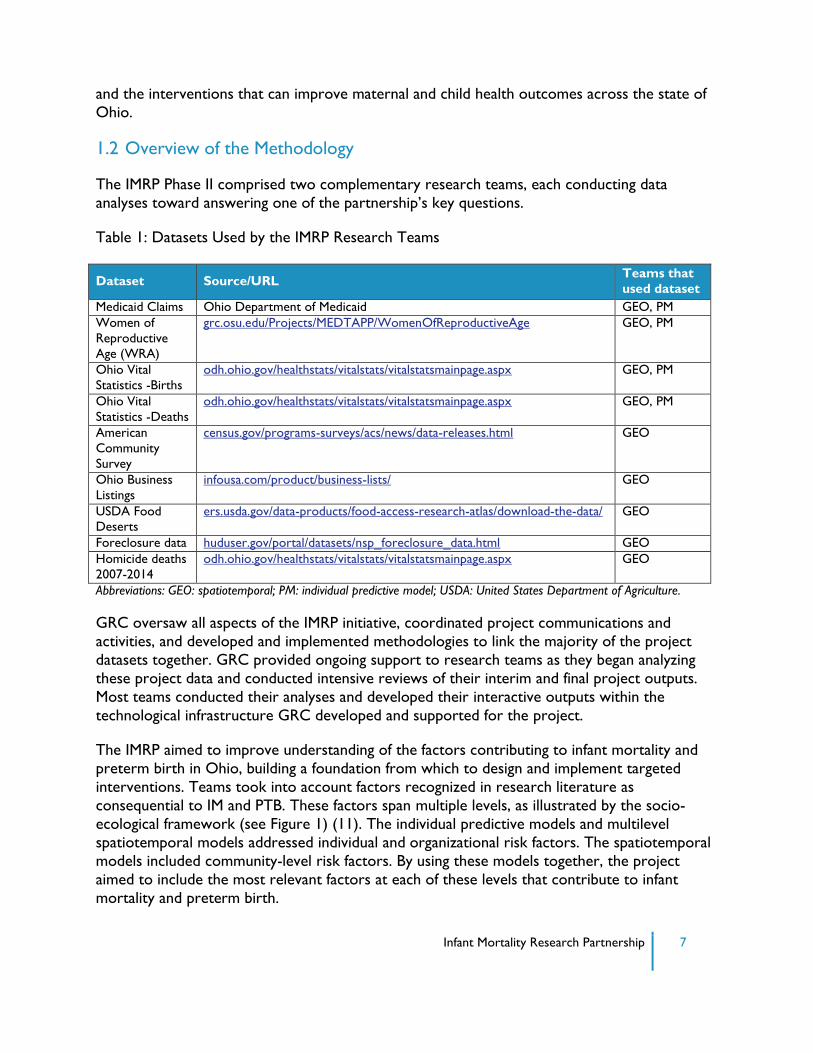
Table 1: Datasets Used by the IMRP Research Teams
Dataset Source/URL Teams that
used dataset
Medicaid Claims Ohio Department of Medicaid GEO, PM
Women of
Reproductive
Age (WRA)
grc.osu.edu/Projects/MEDTAPP/WomenOfReproductiveAge GEO, PM
Ohio Vital
Statistics -Births
odh.ohio.gov/healthstats/vitalstats/vitalstatsmainpage.aspx GEO, PM
Ohio Vital
Statistics -Deaths
odh.ohio.gov/healthstats/vitalstats/vitalstatsmainpage.aspx GEO, PM
American
Community
Survey
census.gov/programs-surveys/acs/news/data-releases.html GEO
Ohio Business
Listings
infousa.com/product/business-lists/ GEO
USDA Food
Deserts
ers.usda.gov/data-products/food-access-research-atlas/download-the-data/ GEO
Foreclosure data huduser.gov/portal/datasets/nsp_foreclosure_data.html GEO
Homicide deaths
2007-2014
odh.ohio.gov/healthstats/vitalstats/vitalstatsmainpage.aspx GEO
Abbreviations: GEO: spatiotemporal; PM: individual predictive model; USDA: United States Department of Agriculture.
GRC oversaw all aspects of the IMRP initiative, coordinated project communications and
activities, and developed and implemented methodologies to link the majority of the project
datasets together. GRC provided ongoing support to research teams as they began analyzing
these project data and conducted intensive reviews of their interim and final project outputs.
Most teams conducted their analyses and developed their interactive outputs within the
technological infrastructure GRC developed and supported for the project.
The IMRP aimed to improve understanding of the factors contributing to infant mortality and
preterm birth in Ohio, building a foundation from which to design and implement targeted
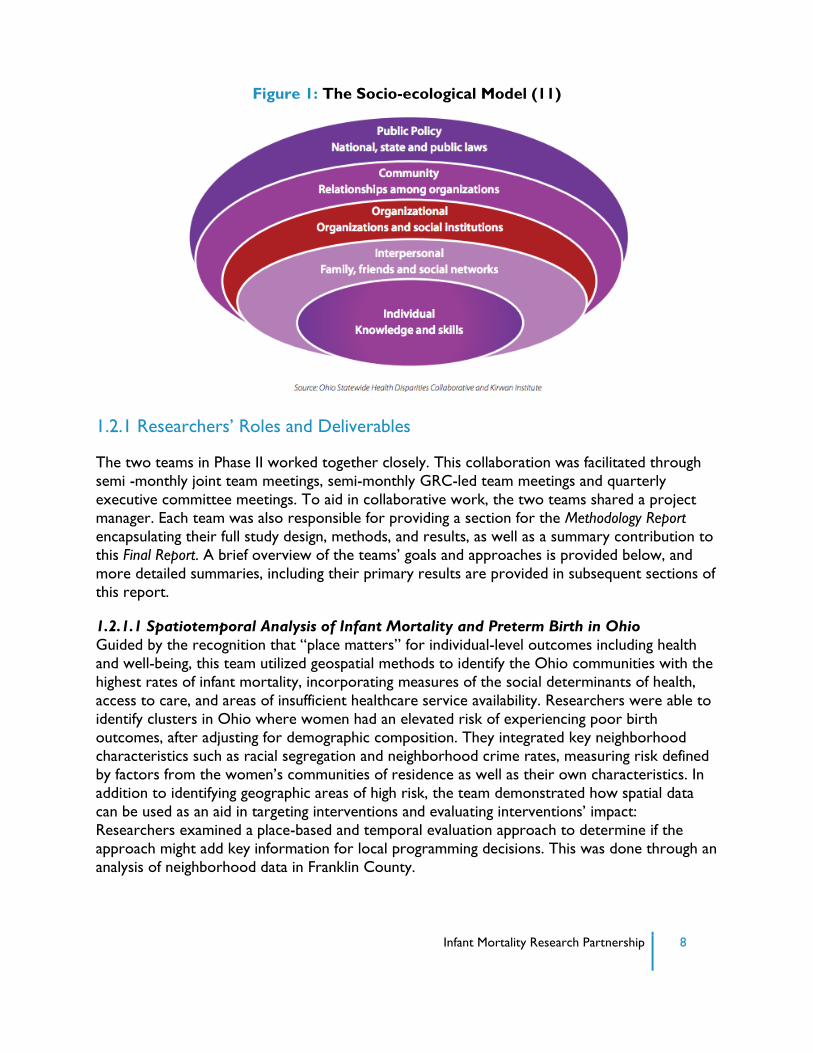
interventions. Teams took into account factors recognized in research literature as
consequential to IM and PTB. These factors span multiple levels, as illustrated by the socio-
ecological framework (see Figure 1) (11). The individual predictive models and multilevel
spatiotemporal models addressed individual and organizational risk factors. The spatiotemporal
models included community-level risk factors. By using these models together, the project
aimed to include the most relevant factors at each of these levels that contribute to infant
mortality and preterm birth.
Infant Mortality Research Partnership 8
Figure 1: The Socio-ecological Model (11)
1.2.1 Researchers’ Roles and Deliverables
The two teams in Phase II worked together closely. This collaboration was facilitated through
semi -monthly joint team meetings, semi-monthly GRC-led team meetings and quarterly
executive committee meetings. To aid in collaborative work, the two teams shared a project
manager. Each team was also responsible for providing a section for the Methodology Report
encapsulating their full study design, methods, and results, as well as a summary contribution to
this Final Report. A brief overview of the teams’ goals and approaches is provided below, and
more detailed summaries, including their primary results are provided in subsequent sections of
this report.
1.2.1.1 Spatiotemporal Analysis of Infant Mortality and Preterm Birth in Ohio
Guided by the recognition that “place matters” for individual-level outcomes including health
and well-being, this team utilized geospatial methods to identify the Ohio communities with the
highest rates of infant mortality, incorporating measures of the social determinants of health,
access to care, and areas of insufficient healthcare service availability. Researchers were able to
identify clusters in Ohio where women had an elevated risk of experiencing poor birth
outcomes, after adjusting for demographic composition. They integrated key neighborhood
characteristics such as racial segregation and neighborhood crime rates, measuring risk defined
by factors from the women’s communities of residence as well as their own characteristics. In
addition to identifying geographic areas of high risk, the team demonstrated how spatial data
can be used as an aid in targeting interventions and evaluating interventions’ impact:
Researchers examined a place-based and temporal evaluation approach to determine if the
approach might add key information for local programming decisions. This was done through an
analysis of neighborhood data in Franklin County.
Infant Mortality Research Partnership 9
1.2.1.3 Individual Predictive Modeling of Preterm Birth and Infant Mortality
This IMRP team’s primary research activity was developing predictive models that could be
used at the point of care by healthcare providers, toward identifying patients at high risk of
infant mortality or preterm birth. The team worked to bring together patient and area level risk
factors into one model, by incorporating the Ohio Opportunity Index into the models. The
main product developed by this group is a risk calculator application that integrates these
models into an interactive and usable application. This application is designed to be used at the
point of care and to help policymakers identify possible impacts of targeted interventions on the
Medicaid population. In order to respond to the needs of these different groups, the application
underwent and iterative design process and multiple usability tests with potential stakeholders.
1.3 References
1. Reidpath DD, Allotey P. Infant mortality rate as an indicator of population health. Journal of
Epidemiology and Community Health 2003;57(5):344.
2. Infant Mortality Maternal and Infant Health Reproductive Health CDC. (2019, March 27).
Available from: //www.cdc.gov/reproductivehealth/maternalinfanthealth/infantmortality.htm
3. National Center for Health Statistics. (2019, January 15). Available from:
https://www.cdc.gov/nchs/pressroom/sosmap/infant_mortality_rates/infant_mortality.htm
4. 2015 Ohio Infant Mortality Data: General Findings. [Cited 21 June 2017]. Available from:
odh.ohio.gov/-/media/ODH/ASSETS/Files/cfhs/OEI/2015-Ohio-Infant-Mortality-Report-
FINAL.pdf?la=en
5. DeFranco EA, Hall ES, Muglia LJ. Racial disparity in previable birth. Am J Obstet Gynecol.
2016; 214:394. e1-7.
6. Metlay D, Sarewitz D. Decision strategies for addressing complex,‘messy’problems. The
Bridge 2012;42(3):6-16.
7. Kim D, Saada A. The social determinants of infant mortality and birth outcomes in Western developed nations: a cross-country systematic review. Int J Environ Res Public Health
2013;10(6):2296-335.
8. Alio AP, Richman AR, Clayton HB, Jeffers DF, Wathington DJ, Salihu HM. An ecological
approach to understanding black-white disparities in perinatal mortality. Matern Child
Health J 2010;14(4):557-66.
9. Rowley DL, Hogan V. Disparities in infant mortality and effective, equitable care: are infants
suffering from benign neglect? Annu Rev Public Health 2012;33:75-87.
10. Byrd DR, Katcher ML, Peppard P, Durkin M, Remington PL. Infant mortality: explaining
black/white disparities in Wisconsin. Matern Child Health J 2007;11(4):319-26.

Infant Mortality Research Partnership 10
11. The Ohio Collaborative to Prevent Infant Mortality. [Cited 5 June 2017]. Available from:
odh.ohio.gov/-/media/ODH/ASSETS/Files/cfhs/Infant-Mortality/collaborative/2015/Infant-
Mortality-Reduction-Plan-2015-20.pdf
12. Ohio Department of Medicaid: Medicaid Forms Listing. [Cited 31 May 2017]. Available
from: medicaid.ohio.gov/RESOURCES/Publications/MedicaidForms.aspx
Infant Mortality Research Partnership 11
SECTION 2: SPATIOTEMPORAL ANALYSIS OF INFANT
MORTALITY AND PRETERM BIRTH IN OHIO
2.1 Introduction and Objectives
Geography plays a major role in the dynamics of health. People, and the factors that lead to
both positive and adverse health outcomes, are dispersed -- often unevenly -- across communities and regions (1). This dispersion leads to distinct spatial patterns of many health
outcomes, including low birth weight and preterm birth, infant mortality, and a variety of birth
defects. The availability of geographic data provides policymakers and public health officials with
the capability to perform two unique types of analysis: 1) finding areas of high or low incidence
worthy of further investigation, and 2) examining the spatial relationship between health
outcomes on the one hand, and population and contextual factors on the other (2,3).
This study used mapping and spatial analysis to identify high-risk communities in Ohio that can
be targeted for intervention and resource allocation, and to provide a deeper understanding of
why these communities are high risk. These efforts addressed three major objectives:
1) Examine individual-level and area-level risk factors associated with infant mortality and
preterm birth in Ohio.
2) Focus on preterm birth to mothers living in urban areas to examine the area-level
factors associated with this outcome.
3) Examine spatial patterns and clusters of infant mortality, preterm birth, Neonatal
Abstinence Syndrome (NAS) and maternal opiate use in Ohio.
4) Demonstrate how spatial analytic techniques can be used for program planning and
evaluation using the CelebrateOne neighborhoods in Franklin County as an example.
2.2 Methods
This study used a combination of Geographic Information Systems (GIS), geovisualization and
mapping, and statistical modeling to examine the spatial patterns of infant mortality and preterm
birth in Ohio. In order to conduct a spatial analysis, all Ohio birth and infant death records
were geocoded so data could be displayed on a map. Once records were geocoded, each
record was assigned a census tract in the GIS and merged with a variety of area-level data (e.g.,
median household income or OB/GYNs per capita). Then, using multilevel models (MLMs) and
spatial cluster analysis, two primary outcomes were examined: infant mortality and preterm
birth. This report presents results for the Medicaid Women of Reproductive Age (WRA)
cohort; the Methodology Report includes analyses of the full Ohio birth cohort.
Multilevel models are used when observations in a data set are nested or grouped (4,5). For
example, observations such as residents of the same census tract tend to be more alike than
data from individuals selected at random across tracts. These within-group similarities require
statistical models that account for this phenomenon. This study used multilevel models to
estimate the probability of infant mortality or preterm birth event as a function of both
individual-level (e.g., age, education, hypertension, etc.) and area-level (e.g., racial concentration,
residential stability, poor housing, etc.) factors.
Infant Mortality Research Partnership 12
The spatial scan statistic is one of the main epidemiological tools to detect the presence and
locations of geographic clusters of health events (6). This method tests whether there is an
elevated risk (e.g., more cases than would be expected) within a specific geographic area as
compared to outside that area. In this case, using the observed number of infant deaths or
preterm birth cases, an expected number was calculated based on: 1) population density or 2)
population density by maternal age, race/ethnicity and education. Adjusting for population
density assured that the reported clusters were not merely due to a large number of births in
an area. Additional adjustment for maternal characteristics also ensured that clusters were not
simply reflecting uneven distributions of populations with known risk factors, such as a large
concentration of NHB mothers. Results of the scan statistic were mapped using the GIS.
Relative risk is reported for all clusters with a p-value < 0.05.
This work includes a case study to demonstrate how spatially and temporally referenced data
can be used to support program evaluation or planning activities. A formal program evaluation,
that establishes causal links between programs and changes in birth outcomes, was not
conducted. Rather, the case study shows, for limited geographic areas, how to use vital record
and Medicaid data to examine whether key maternal characteristics and infant outcomes changed over time.
2.3 Key Findings
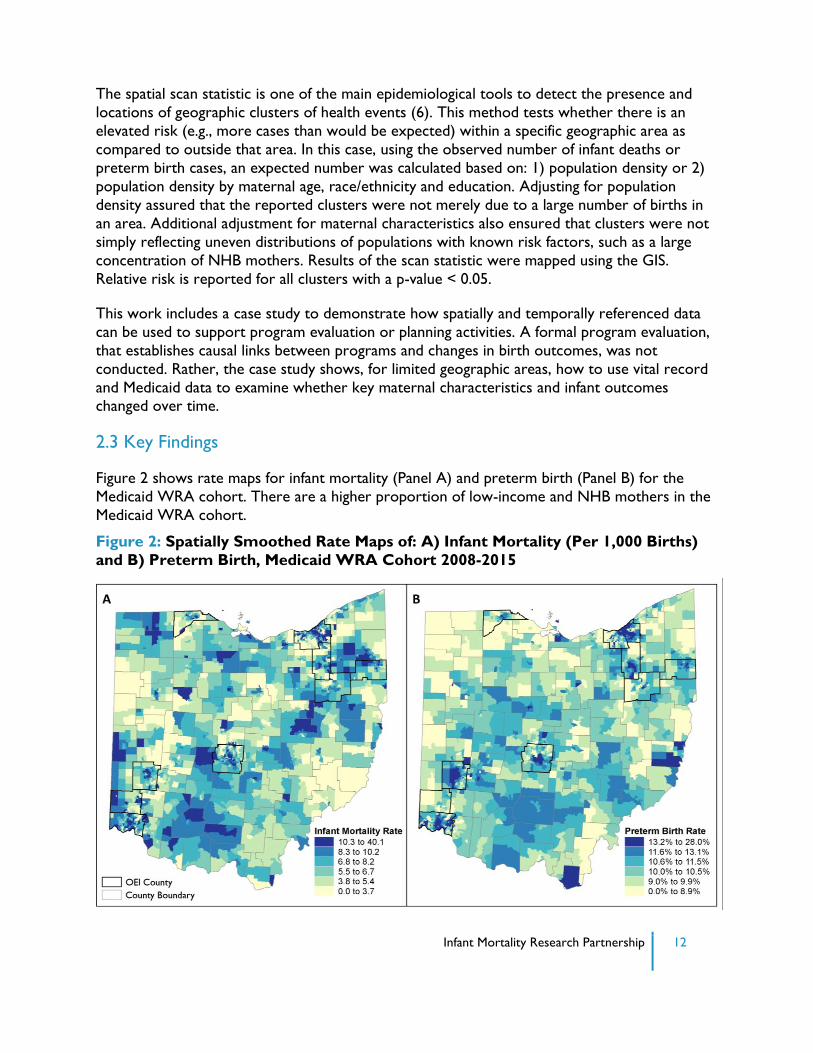
Figure 2 shows rate maps for infant mortality (Panel A) and preterm birth (Panel B) for the
Medicaid WRA cohort. There are a higher proportion of low-income and NHB mothers in the
Medicaid WRA cohort.
Figure 2: Spatially Smoothed Rate Maps of: A) Infant Mortality (Per 1,000 Births)
and B) Preterm Birth, Medicaid WRA Cohort 2008-2015
Infant Mortality Research Partnership 13
The patterns look similar between the two maps; all major cities have concentrations of high
infant mortality and preterm birth, and there is a distinct dark band of higher rates (especially
for preterm birth) in the Appalachian counties and the rural area north of Columbus. At the
same time, there are some areas where IM and PTB rates don’t match (e.g., relatively high IM
but low PTB), such as Portage County between Akron and Youngstown. Some of these
differences are related to small numbers in rural areas, such that even a few IM events leads to
a very high rate when mapped. Alternatively, these could be areas where IM is not related to
preterm birth or preterm babies are effectively cared for, so an early birth does not lead to
mortality.
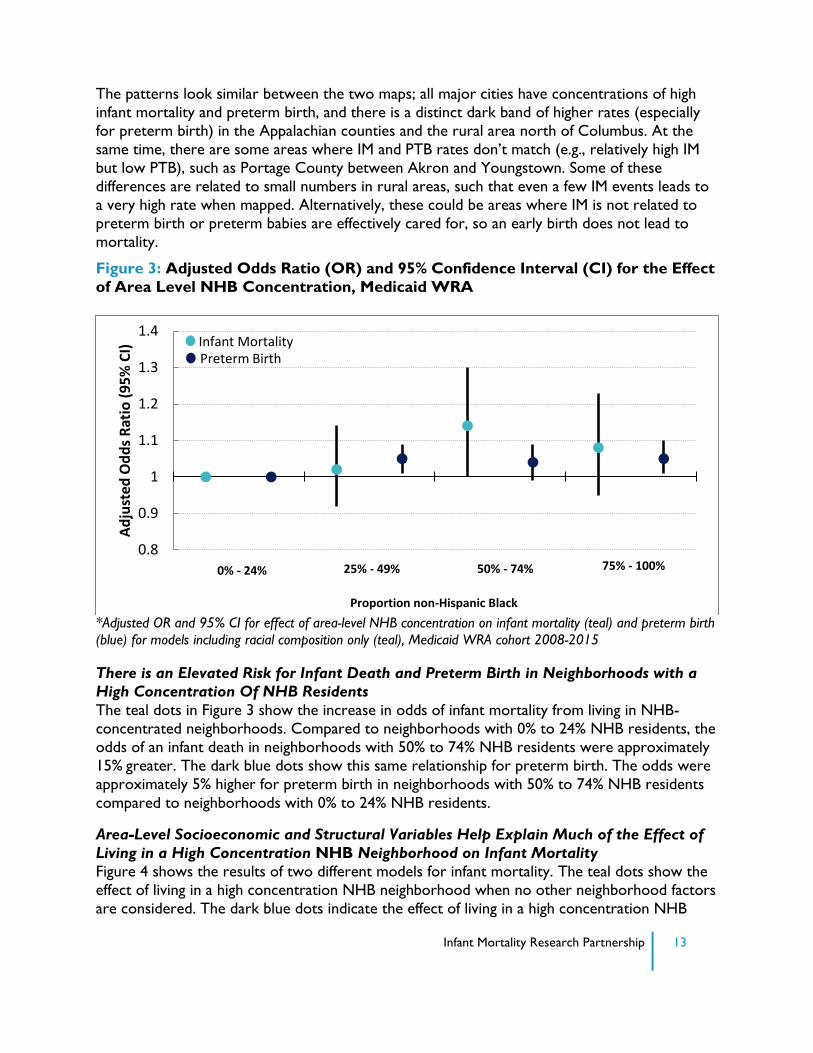
Figure 3: Adjusted Odds Ratio (OR) and 95% Confidence Interval (CI) for the Effect
of Area Level NHB Concentration, Medicaid WRA
*Adjusted OR and 95% CI for effect of area-level NHB concentration on infant mortality (teal) and preterm birth
(blue) for models including racial composition only (teal), Medicaid WRA cohort 2008-2015
There is an Elevated Risk for Infant Death and Preterm Birth in Neighborhoods with a
High Concentration Of NHB Residents
The teal dots in Figure 3 show the increase in odds of infant mortality from living in NHB-
concentrated neighborhoods. Compared to neighborhoods with 0% to 24% NHB residents, the
odds of an infant death in neighborhoods with 50% to 74% NHB residents were approximately
15% greater. The dark blue dots show this same relationship for preterm birth. The odds were
approximately 5% higher for preterm birth in neighborhoods with 50% to 74% NHB residents
compared to neighborhoods with 0% to 24% NHB residents.
Area-Level Socioeconomic and Structural Variables Help Explain Much of the Effect of
Living in a High Concentration NHB Neighborhood on Infant Mortality
Figure 4 shows the results of two different models for infant mortality. The teal dots show the
effect of living in a high concentration NHB neighborhood when no other neighborhood factors
are considered. The dark blue dots indicate the effect of living in a high concentration NHB
0.8
0.9
1
1.1
1.2
1.3
1.4
Ad
just
ed O
dd
s R
atio
(9
5%
CI)
Infant Mortality Preterm Birth
0% - 24% 25% - 49% 50% - 74%
Proportion non-Hispanic Black
75% - 100%
Infant Mortality Research Partnership 14
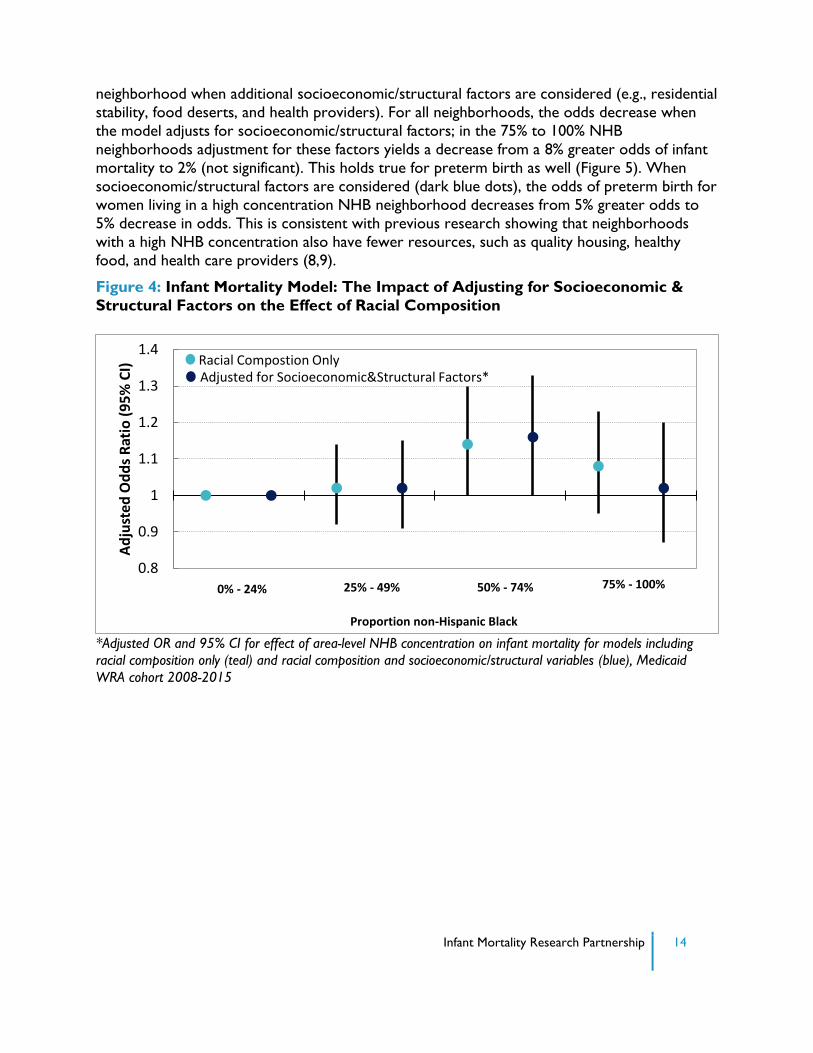
neighborhood when additional socioeconomic/structural factors are considered (e.g., residential
stability, food deserts, and health providers). For all neighborhoods, the odds decrease when
the model adjusts for socioeconomic/structural factors; in the 75% to 100% NHB
neighborhoods adjustment for these factors yields a decrease from a 8% greater odds of infant
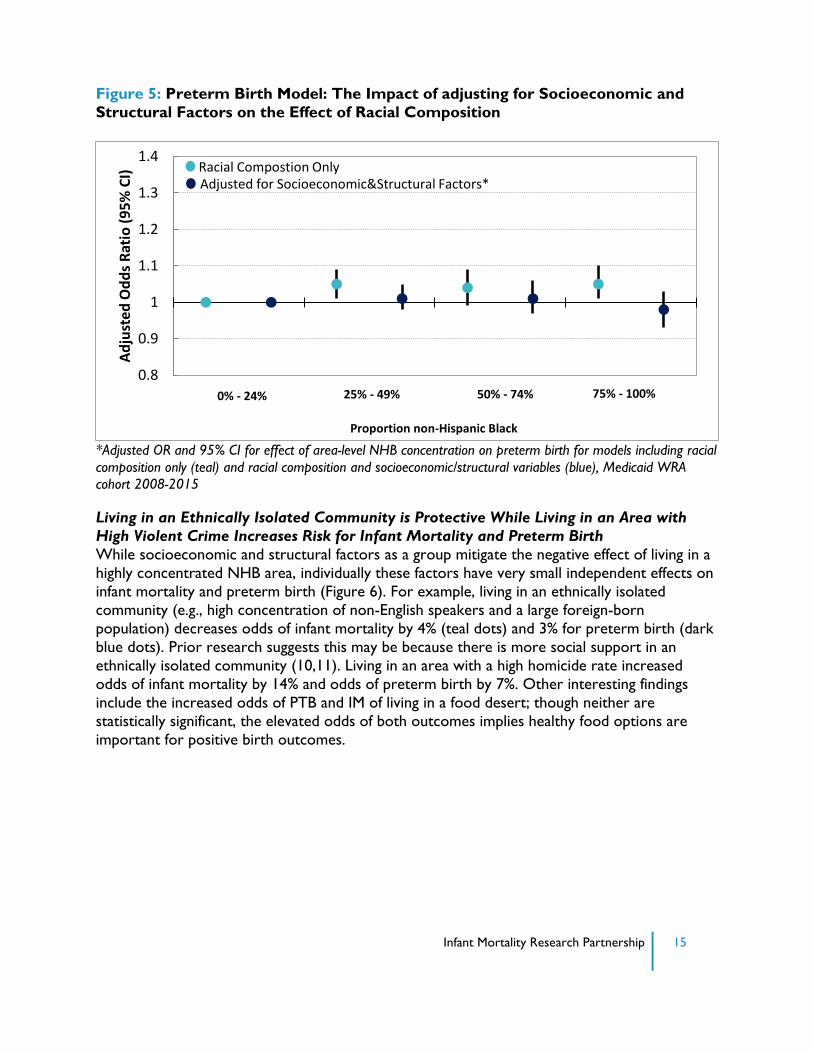
mortality to 2% (not significant). This holds true for preterm birth as well (Figure 5). When
socioeconomic/structural factors are considered (dark blue dots), the odds of preterm birth for
women living in a high concentration NHB neighborhood decreases from 5% greater odds to
5% decrease in odds. This is consistent with previous research showing that neighborhoods
with a high NHB concentration also have fewer resources, such as quality housing, healthy
food, and health care providers (8,9).
Figure 4: Infant Mortality Model: The Impact of Adjusting for Socioeconomic &
Structural Factors on the Effect of Racial Composition
*Adjusted OR and 95% CI for effect of area-level NHB concentration on infant mortality for models including
racial composition only (teal) and racial composition and socioeconomic/structural variables (blue), Medicaid
WRA cohort 2008-2015
0.8
0.9
1
1.1
1.2
1.3
1.4
Ad
just
ed O
dd
s R
atio
(9
5%
CI)
Racial Compostion Only Adjusted for Socioeconomic&Structural Factors*
0% - 24% 25% - 49% 50% - 74%
Proportion non-Hispanic Black
75% - 100%
Infant Mortality Research Partnership 15
Figure 5: Preterm Birth Model: The Impact of adjusting for Socioeconomic and
Structural Factors on the Effect of Racial Composition
*Adjusted OR and 95% CI for effect of area-level NHB concentration on preterm birth for models including racial
composition only (teal) and racial composition and socioeconomic/structural variables (blue), Medicaid WRA
cohort 2008-2015
Living in an Ethnically Isolated Community is Protective While Living in an Area with
High Violent Crime Increases Risk for Infant Mortality and Preterm Birth
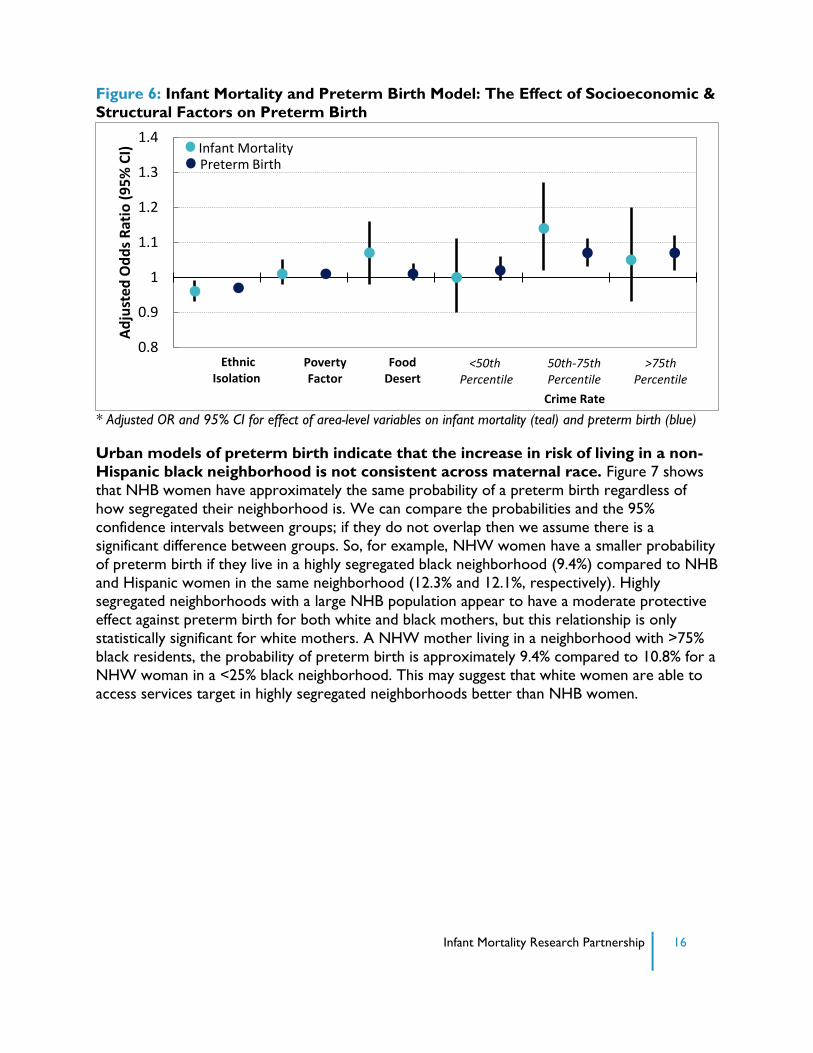
While socioeconomic and structural factors as a group mitigate the negative effect of living in a
highly concentrated NHB area, individually these factors have very small independent effects on
infant mortality and preterm birth (Figure 6). For example, living in an ethnically isolated
community (e.g., high concentration of non-English speakers and a large foreign-born
population) decreases odds of infant mortality by 4% (teal dots) and 3% for preterm birth (dark
blue dots). Prior research suggests this may be because there is more social support in an
ethnically isolated community (10,11). Living in an area with a high homicide rate increased
odds of infant mortality by 14% and odds of preterm birth by 7%. Other interesting findings
include the increased odds of PTB and IM of living in a food desert; though neither are
statistically significant, the elevated odds of both outcomes implies healthy food options are
important for positive birth outcomes.
0.8
0.9
1
1.1
1.2
1.3
1.4
Ad
just
ed O
dd
s R
atio
(9
5%
CI)
Racial Compostion Only Adjusted for Socioeconomic&Structural Factors*
0% - 24% 25% - 49% 50% - 74%
Proportion non-Hispanic Black
75% - 100%
Infant Mortality Research Partnership 16
Figure 6: Infant Mortality and Preterm Birth Model: The Effect of Socioeconomic &
Structural Factors on Preterm Birth
* Adjusted OR and 95% CI for effect of area-level variables on infant mortality (teal) and preterm birth (blue)
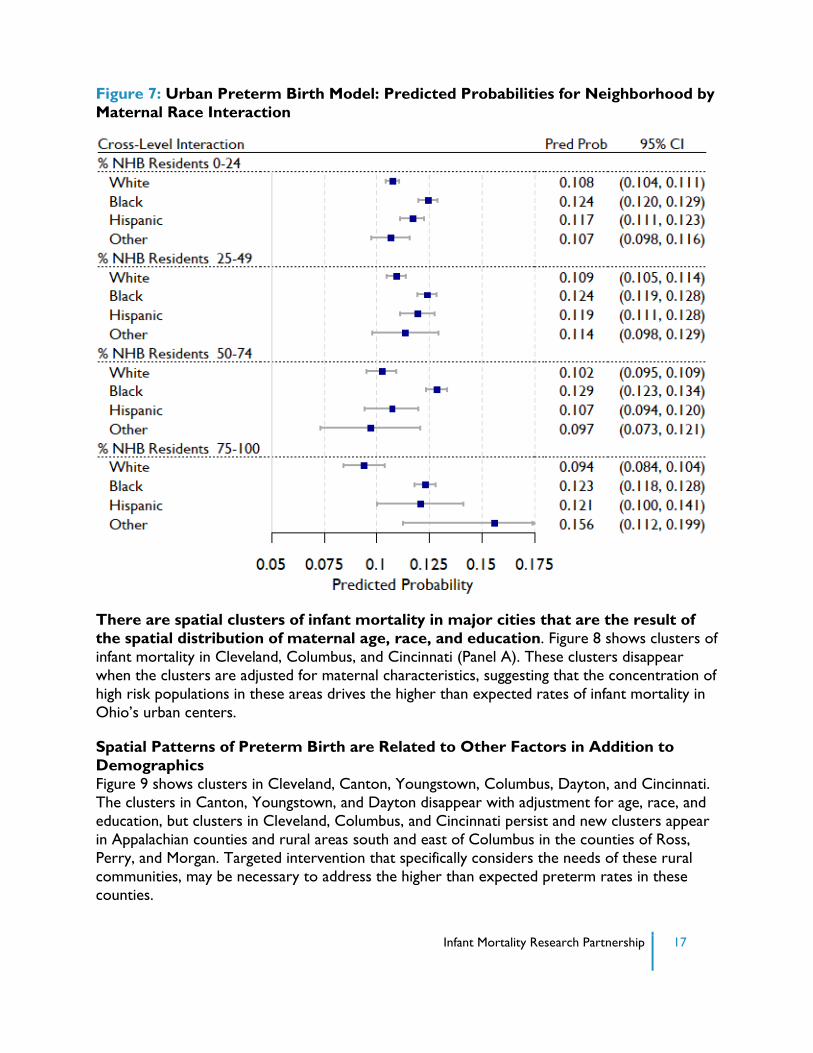
Urban models of preterm birth indicate that the increase in risk of living in a non-
Hispanic black neighborhood is not consistent across maternal race. Figure 7 shows
that NHB women have approximately the same probability of a preterm birth regardless of
how segregated their neighborhood is. We can compare the probabilities and the 95%
confidence intervals between groups; if they do not overlap then we assume there is a
significant difference between groups. So, for example, NHW women have a smaller probability
of preterm birth if they live in a highly segregated black neighborhood (9.4%) compared to NHB
and Hispanic women in the same neighborhood (12.3% and 12.1%, respectively). Highly segregated neighborhoods with a large NHB population appear to have a moderate protective
effect against preterm birth for both white and black mothers, but this relationship is only
statistically significant for white mothers. A NHW mother living in a neighborhood with >75%
black residents, the probability of preterm birth is approximately 9.4% compared to 10.8% for a
NHW woman in a <25% black neighborhood. This may suggest that white women are able to
access services target in highly segregated neighborhoods better than NHB women.
0.8
0.9
1
1.1
1.2
1.3
1.4A
dju
sted
Od
ds
Rat
io (
95
% C
I) Infant Mortality
Preterm Birth
Ethnic Isolation
Poverty Factor
Food Desert
<50th Percentile
50th-75th Percentile
>75th Percentile
Crime Rate
Infant Mortality Research Partnership 17
Figure 7: Urban Preterm Birth Model: Predicted Probabilities for Neighborhood by
Maternal Race Interaction
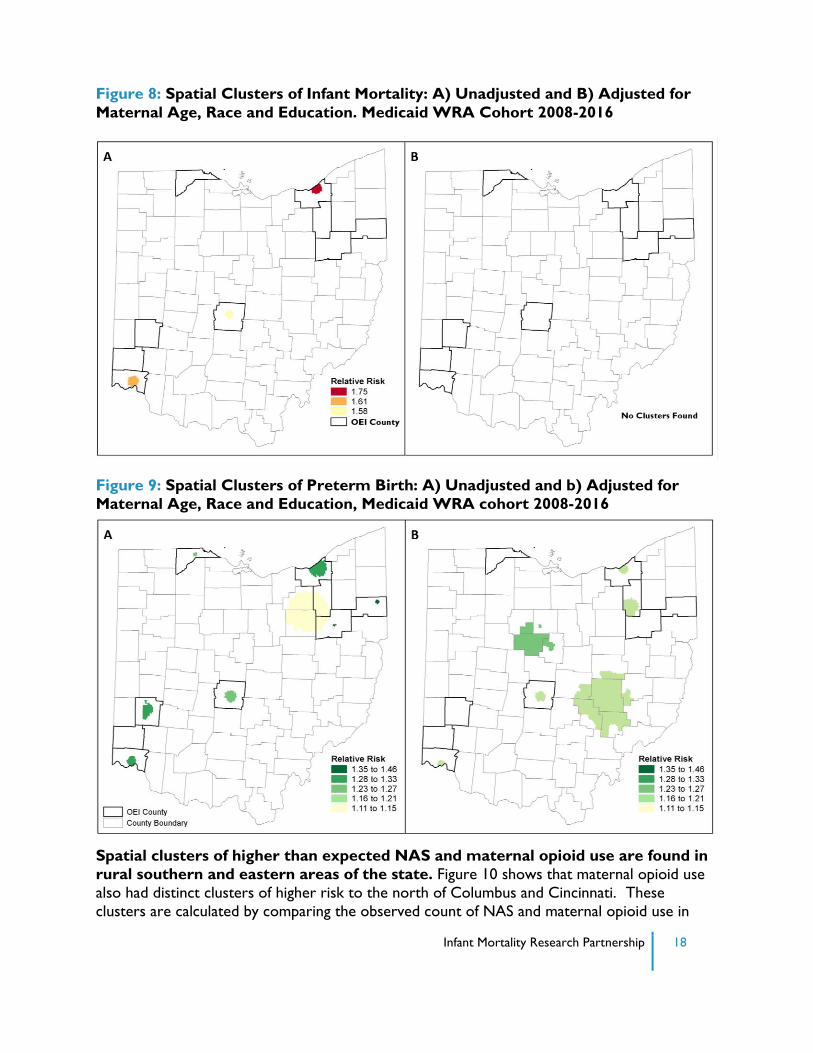
There are spatial clusters of infant mortality in major cities that are the result of
the spatial distribution of maternal age, race, and education. Figure 8 shows clusters of
infant mortality in Cleveland, Columbus, and Cincinnati (Panel A). These clusters disappear
when the clusters are adjusted for maternal characteristics, suggesting that the concentration of
high risk populations in these areas drives the higher than expected rates of infant mortality in
Ohio’s urban centers.
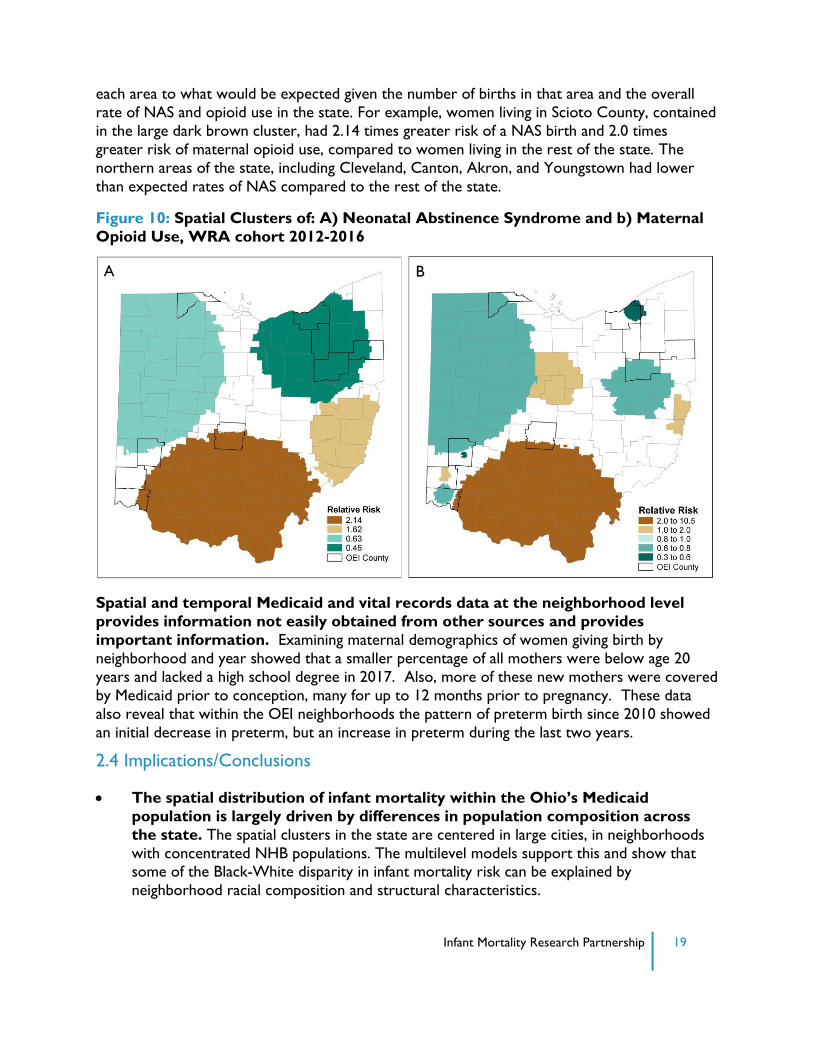
Spatial Patterns of Preterm Birth are Related to Other Factors in Addition to
Demographics
Figure 9 shows clusters in Cleveland, Canton, Youngstown, Columbus, Dayton, and Cincinnati.
The clusters in Canton, Youngstown, and Dayton disappear with adjustment for age, race, and
education, but clusters in Cleveland, Columbus, and Cincinnati persist and new clusters appear
in Appalachian counties and rural areas south and east of Columbus in the counties of Ross,
Perry, and Morgan. Targeted intervention that specifically considers the needs of these rural
communities, may be necessary to address the higher than expected preterm rates in these
counties.
Infant Mortality Research Partnership 18
Figure 8: Spatial Clusters of Infant Mortality: A) Unadjusted and B) Adjusted for
Maternal Age, Race and Education. Medicaid WRA Cohort 2008-2016
Figure 9: Spatial Clusters of Preterm Birth: A) Unadjusted and b) Adjusted for
Maternal Age, Race and Education, Medicaid WRA cohort 2008-2016
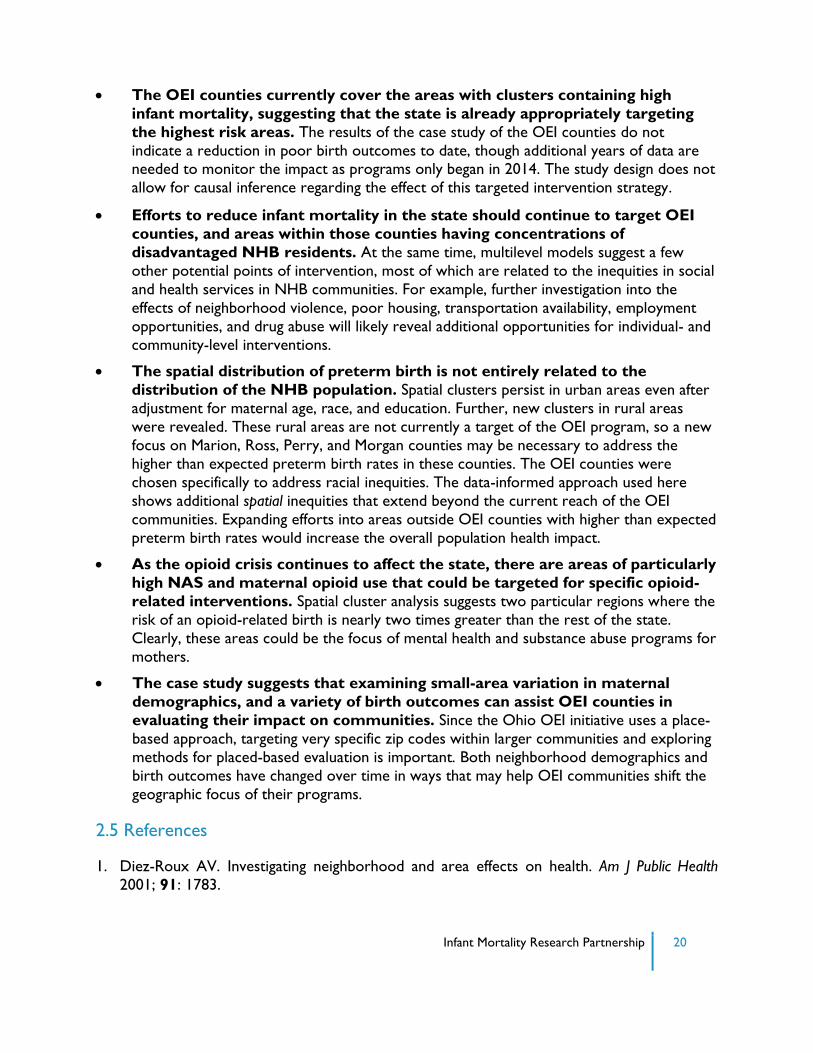
Spatial clusters of higher than expected NAS and maternal opioid use are found in
rural southern and eastern areas of the state. Figure 10 shows that maternal opioid use
also had distinct clusters of higher risk to the north of Columbus and Cincinnati. These
clusters are calculated by comparing the observed count of NAS and maternal opioid use in
Infant Mortality Research Partnership 19
each area to what would be expected given the number of births in that area and the overall
rate of NAS and opioid use in the state. For example, women living in Scioto County, contained
in the large dark brown cluster, had 2.14 times greater risk of a NAS birth and 2.0 times
greater risk of maternal opioid use, compared to women living in the rest of the state. The
northern areas of the state, including Cleveland, Canton, Akron, and Youngstown had lower
than expected rates of NAS compared to the rest of the state.
Figure 10: Spatial Clusters of: A) Neonatal Abstinence Syndrome and b) Maternal
Opioid Use, WRA cohort 2012-2016
Spatial and temporal Medicaid and vital records data at the neighborhood level
provides information not easily obtained from other sources and provides
important information. Examining maternal demographics of women giving birth by
neighborhood and year showed that a smaller percentage of all mothers were below age 20
years and lacked a high school degree in 2017. Also, more of these new mothers were covered
by Medicaid prior to conception, many for up to 12 months prior to pregnancy. These data
also reveal that within the OEI neighborhoods the pattern of preterm birth since 2010 showed
an initial decrease in preterm, but an increase in preterm during the last two years.
2.4 Implications/Conclusions
The spatial distribution of infant mortality within the Ohio’s Medicaid
population is largely driven by differences in population composition across
the state. The spatial clusters in the state are centered in large cities, in neighborhoods
with concentrated NHB populations. The multilevel models support this and show that some of the Black-White disparity in infant mortality risk can be explained by
neighborhood racial composition and structural characteristics.
A B
Infant Mortality Research Partnership 20
The OEI counties currently cover the areas with clusters containing high
infant mortality, suggesting that the state is already appropriately targeting
the highest risk areas. The results of the case study of the OEI counties do not
indicate a reduction in poor birth outcomes to date, though additional years of data are needed to monitor the impact as programs only began in 2014. The study design does not
allow for causal inference regarding the effect of this targeted intervention strategy.
Efforts to reduce infant mortality in the state should continue to target OEI
counties, and areas within those counties having concentrations of
disadvantaged NHB residents. At the same time, multilevel models suggest a few
other potential points of intervention, most of which are related to the inequities in social
and health services in NHB communities. For example, further investigation into the
effects of neighborhood violence, poor housing, transportation availability, employment
opportunities, and drug abuse will likely reveal additional opportunities for individual- and
community-level interventions.
The spatial distribution of preterm birth is not entirely related to the
distribution of the NHB population. Spatial clusters persist in urban areas even after
adjustment for maternal age, race, and education. Further, new clusters in rural areas
were revealed. These rural areas are not currently a target of the OEI program, so a new
focus on Marion, Ross, Perry, and Morgan counties may be necessary to address the
higher than expected preterm birth rates in these counties. The OEI counties were
chosen specifically to address racial inequities. The data-informed approach used here
shows additional spatial inequities that extend beyond the current reach of the OEI
communities. Expanding efforts into areas outside OEI counties with higher than expected
preterm birth rates would increase the overall population health impact.
As the opioid crisis continues to affect the state, there are areas of particularly
high NAS and maternal opioid use that could be targeted for specific opioid-
related interventions. Spatial cluster analysis suggests two particular regions where the
risk of an opioid-related birth is nearly two times greater than the rest of the state.
Clearly, these areas could be the focus of mental health and substance abuse programs for
mothers.
The case study suggests that examining small-area variation in maternal
demographics, and a variety of birth outcomes can assist OEI counties in
evaluating their impact on communities. Since the Ohio OEI initiative uses a place-
based approach, targeting very specific zip codes within larger communities and exploring
methods for placed-based evaluation is important. Both neighborhood demographics and
birth outcomes have changed over time in ways that may help OEI communities shift the
geographic focus of their programs.
2.5 References
1. Diez-Roux AV. Investigating neighborhood and area effects on health. Am J Public Health
2001; 91: 1783.
Infant Mortality Research Partnership 21
2. Rushton G. Public health, GIS, and spatial analytic tools. Annu Rev Public Health 2003; 24: 43-
56.
3. McLafferty SL. GIS and health care. Annu Rev Public Health 2003; 24: 25-42.
4. Diez-Roux AV. Multilevel analysis in public health research. Annu Rev Public Health 2000; 21:
171-92.
5. Gelman A, Hill J. Data analysis using regression and multilevel/hierarchical models. Cambridge;
New York: Cambridge University Press; 2007.
6. Kulldorff M. A spatial scan statistic. Communications in Statistics: Theory and Methods 1997; 26:
1481.
7. Ohio Department of health. Ohio Institute for Equity in Birth Outcomes Standards. 2014
[cited 17 May 2017]. Available from: odh.ohio.gov/-/media/ODH/ASSETS/Files/cfhs/child-
and-family-health-services/2014/standards/oei/Ohio-Institute-for-Equity-in-Birth-
Outcomes.pdf
8. Williams DR, Collins C. Racial residential segregation: a fundamental cause of racial
disparities in health. Public Health Reports 2001; 116: 404-416.
9. LaVeist T, Pollack K, Thorpe R, Fesahazion R, Gaskin D. Place, not race: disparities dissipate in southwest Baltimore when blacks and whites live under similar conditions. Health Affairs
2011; 30: 1880-1887.
10. Mason SM, Kaufman JS, Daniels JL, Emch ME, Hogan VK, Savitz DA. Neighborhood ethnic
density and preterm birth across seven ethnic groups in New York City. Health & place.
2011; 17: 280-8.
11. Cagney KA, Browning CR, Wallace DM. The Latino paradox in neighborhood context: the
case of asthma and other respiratory conditions. American Journal of Public Health. 2007;
97: 919-25.
Infant Mortality Research Partnership 22
SECTION 3: PREDICTIVE MODELING: INDIVIDUAL PREDICTIVE
MODELING OF PRETERM BIRTH AND INFANT MORTALITY
3.1 Introduction and Objectives
The goal of this section of the IMRP was the development of predictive models to allow for
personalized risk prediction and improved communication between pregnant women and their healthcare providers. The principal study objective was reducing the IMR for Ohio’s Medicaid
and at-risk populations by developing accurate, point-of-care predictive models that identify
women and infants at high risk of suffering an infant death or premature birth. The models
incorporate data from key time points to allow estimation of risk prior to pregnancy, at the end
of the first trimester, in mid-pregnancy, and at birth. The models were then implemented in an
interactive risk calculator for use at the point of care and by policy makers to better investigate
the impact of factors on the risk of infant mortality and preterm birth.
3.2 Methods
To create the databases, death certificate information was merged with data from the birth
certificates. The result was merged with the WRA study cohort, along with Managed Care Plans for mothers and babies at delivery.
Twelve logistic regression models were created. The models considered information available
at six different timeframes: pre-pregnancy, end of first trimester (13 weeks), mid-pregnancy (20
weeks), end of second trimester (28 weeks), birth, and 6 weeks postpartum. Using appropriate
timeframes, the models examined five different outcomes: preterm birth, very preterm birth,
one-day mortality, infant mortality, and post-neonatal infant mortality. The same general
modeling strategy was employed for all 12 models(1). This report focuses on the Infant
Mortality Model (model 11), that estimated the probability of an infant death using all factors
known at birth and presents summary findings from models 1-5 that modeled factors from pre-
pregnancy and the end of the first trimester (Table 3). The development, validation, and
detailed discussion of models 1-12, along with a list of all variables used and their prevalence in
the population, can be found in the Methodology Report. All models are available for use in the
Infant Mortality Risk Calculator developed as part of the IMRP project.
The Infant Mortality Model (model 11) estimates the probability of infant mortality for an
individual woman given characteristics included in the model. In addition, this study calculates
the standardized mortality ratios (SMR) and associated confidence intervals for each county in
Ohio (2). The SMR is defined as:
SMR=Observed#deaths
Expected#deaths
Infant Mortality Research Partnership 23
3.3 Key Findings
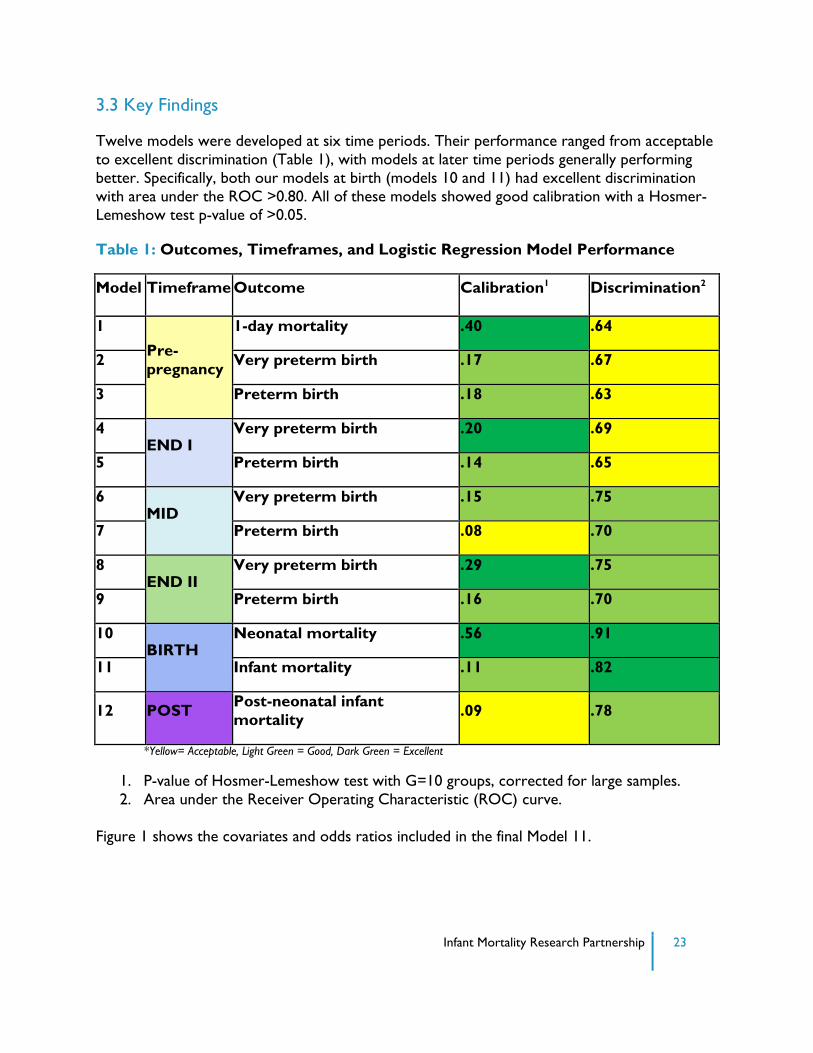
Twelve models were developed at six time periods. Their performance ranged from acceptable
to excellent discrimination (Table 1), with models at later time periods generally performing
better. Specifically, both our models at birth (models 10 and 11) had excellent discrimination
with area under the ROC >0.80. All of these models showed good calibration with a Hosmer-
Lemeshow test p-value of >0.05.
Table 1: Outcomes, Timeframes, and Logistic Regression Model Performance
Model Timeframe Outcome Calibration1 Discrimination2
1
Pre-
pregnancy
1-day mortality .40 .64
2 Very preterm birth .17 .67
3 Preterm birth .18 .63
4 END I
Very preterm birth .20 .69
5 Preterm birth .14 .65
6 MID
Very preterm birth .15 .75
7 Preterm birth .08 .70
8 END II
Very preterm birth .29 .75
9 Preterm birth .16 .70
10 BIRTH
Neonatal mortality .56 .91
11 Infant mortality .11 .82
12 POST Post-neonatal infant
mortality .09 .78
*Yellow= Acceptable, Light Green = Good, Dark Green = Excellent
1. P-value of Hosmer-Lemeshow test with G=10 groups, corrected for large samples.
2. Area under the Receiver Operating Characteristic (ROC) curve.
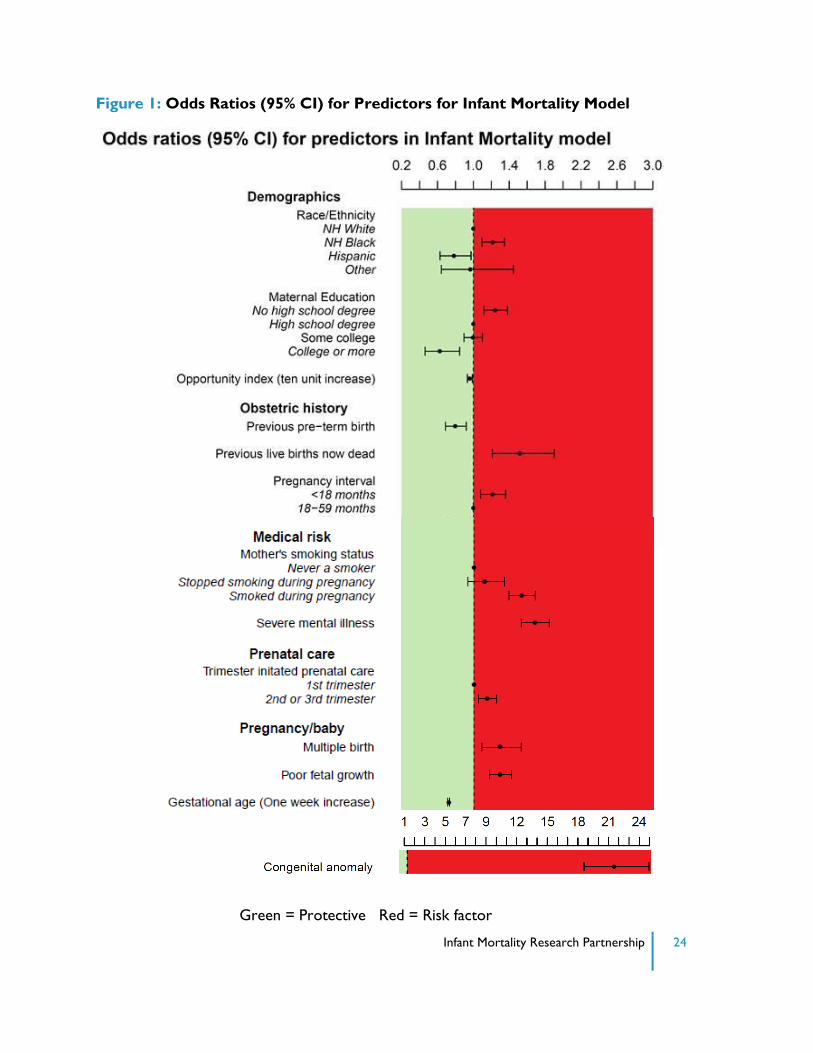
Figure 1 shows the covariates and odds ratios included in the final Model 11.
Infant Mortality Research Partnership 24
Figure 1: Odds Ratios (95% CI) for Predictors for Infant Mortality Model
Green = Protective Red = Risk factor
Infant Mortality Research Partnership 25
The variables included in this model, when considered together, are a useful tool for estimating
the probability of infant mortality for an individual woman. This does not imply that variables in
the model are primary or even secondary causes of infant mortality; rather, they may be proxies
for causative factors. For example, having a previous preterm birth by itself is unlikely to be
protective of infant mortality; rather, this variable is likely a proxy for the receipt of more
intensive prenatal care and clinical oversight. This model is not intended to investigate the effect
of individual risk factors on the outcome, and should not be used alone to determine which
interventions would be helpful.
The major risk factors highlighted in model 11 include:
Maternal demographics:
NHB race/ethnicity and not having completed high school are each associated with increased odds of infant mortality
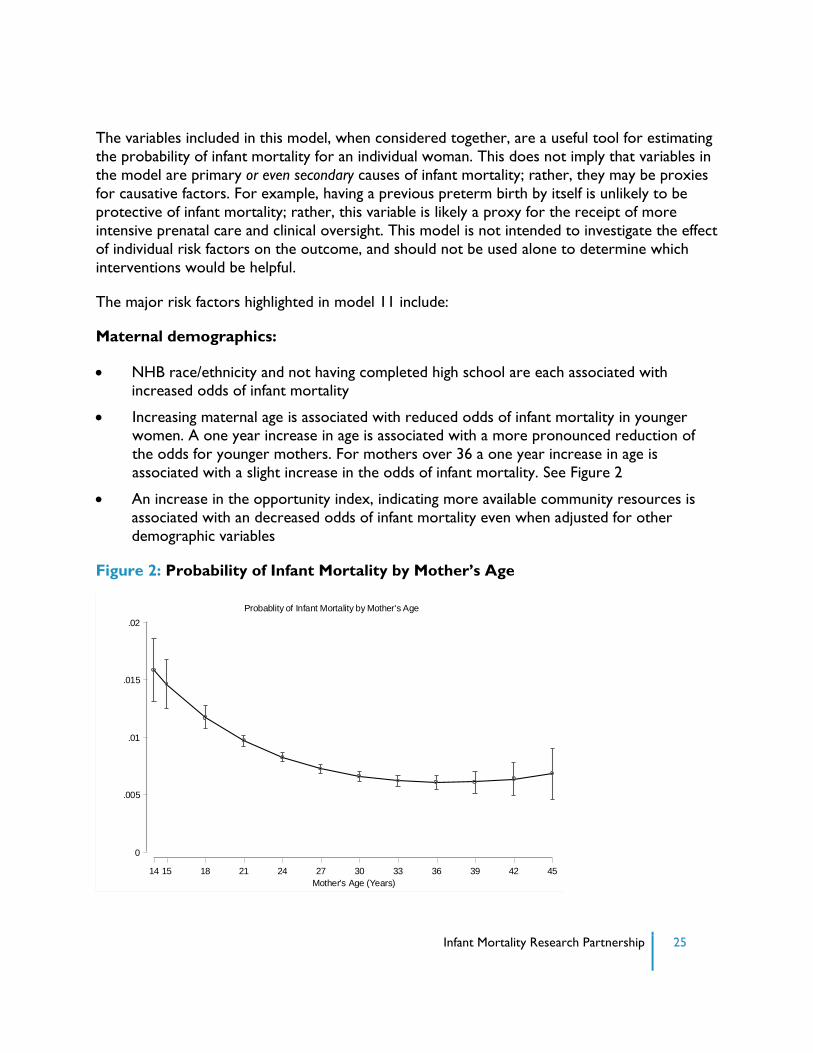
Increasing maternal age is associated with reduced odds of infant mortality in younger women. A one year increase in age is associated with a more pronounced reduction of
the odds for younger mothers. For mothers over 36 a one year increase in age is
associated with a slight increase in the odds of infant mortality. See Figure 2
An increase in the opportunity index, indicating more available community resources is
associated with an decreased odds of infant mortality even when adjusted for other
demographic variables
Figure 2: Probability of Infant Mortality by Mother’s Age
0
.005
.01
.015
.02
Pro
ba
bili
ty o
f In
fant M
ort
alit
y
14 15 18 21 24 27 30 33 36 39 42 45
Mother's Age (Years)
Probablity of Infant Mortality by Mother's Age
Infant Mortality Research Partnership 26
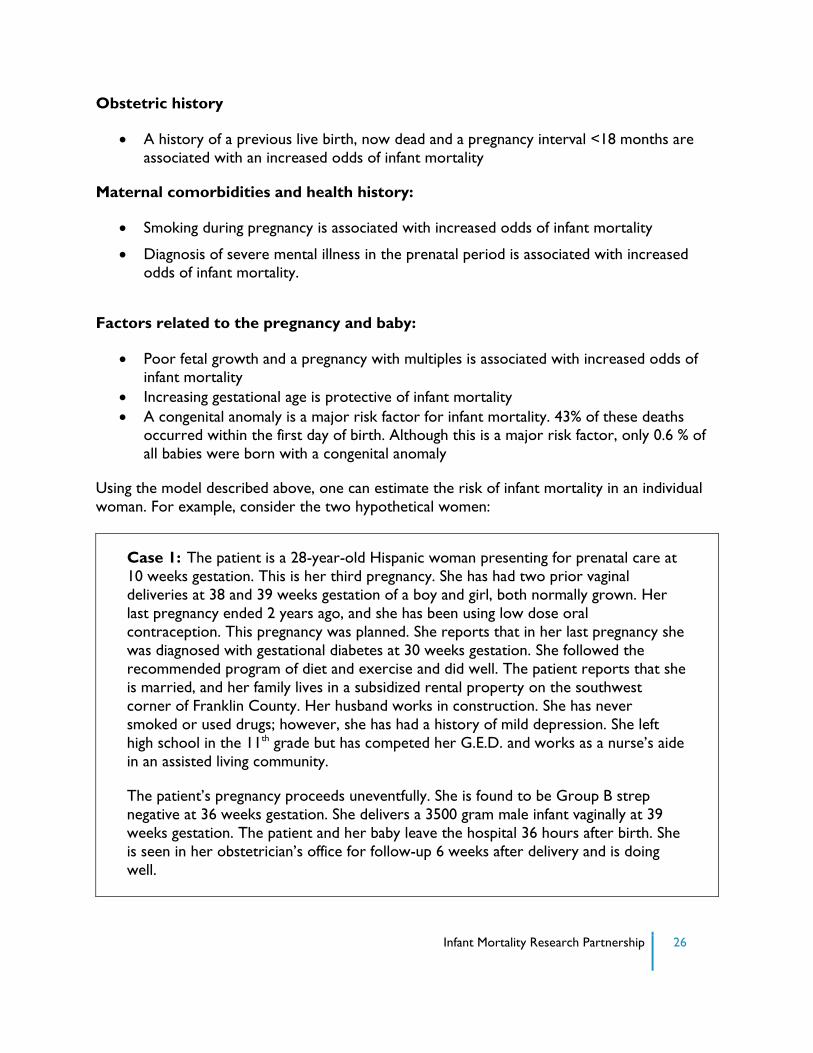
Obstetric history
A history of a previous live birth, now dead and a pregnancy interval <18 months are
associated with an increased odds of infant mortality
Maternal comorbidities and health history:
Smoking during pregnancy is associated with increased odds of infant mortality
Diagnosis of severe mental illness in the prenatal period is associated with increased odds of infant mortality.
Factors related to the pregnancy and baby:
Poor fetal growth and a pregnancy with multiples is associated with increased odds of infant mortality
Increasing gestational age is protective of infant mortality
A congenital anomaly is a major risk factor for infant mortality. 43% of these deaths occurred within the first day of birth. Although this is a major risk factor, only 0.6 % of
all babies were born with a congenital anomaly
Using the model described above, one can estimate the risk of infant mortality in an individual
woman. For example, consider the two hypothetical women:
Case 1: The patient is a 28-year-old Hispanic woman presenting for prenatal care at
10 weeks gestation. This is her third pregnancy. She has had two prior vaginal
deliveries at 38 and 39 weeks gestation of a boy and girl, both normally grown. Her
last pregnancy ended 2 years ago, and she has been using low dose oral
contraception. This pregnancy was planned. She reports that in her last pregnancy she
was diagnosed with gestational diabetes at 30 weeks gestation. She followed the
recommended program of diet and exercise and did well. The patient reports that she
is married, and her family lives in a subsidized rental property on the southwest
corner of Franklin County. Her husband works in construction. She has never
smoked or used drugs; however, she has had a history of mild depression. She left
high school in the 11th grade but has competed her G.E.D. and works as a nurse’s aide
in an assisted living community.
The patient’s pregnancy proceeds uneventfully. She is found to be Group B strep
negative at 36 weeks gestation. She delivers a 3500 gram male infant vaginally at 39
weeks gestation. The patient and her baby leave the hospital 36 hours after birth. She
is seen in her obstetrician’s office for follow-up 6 weeks after delivery and is doing
well.
Infant Mortality Research Partnership 27
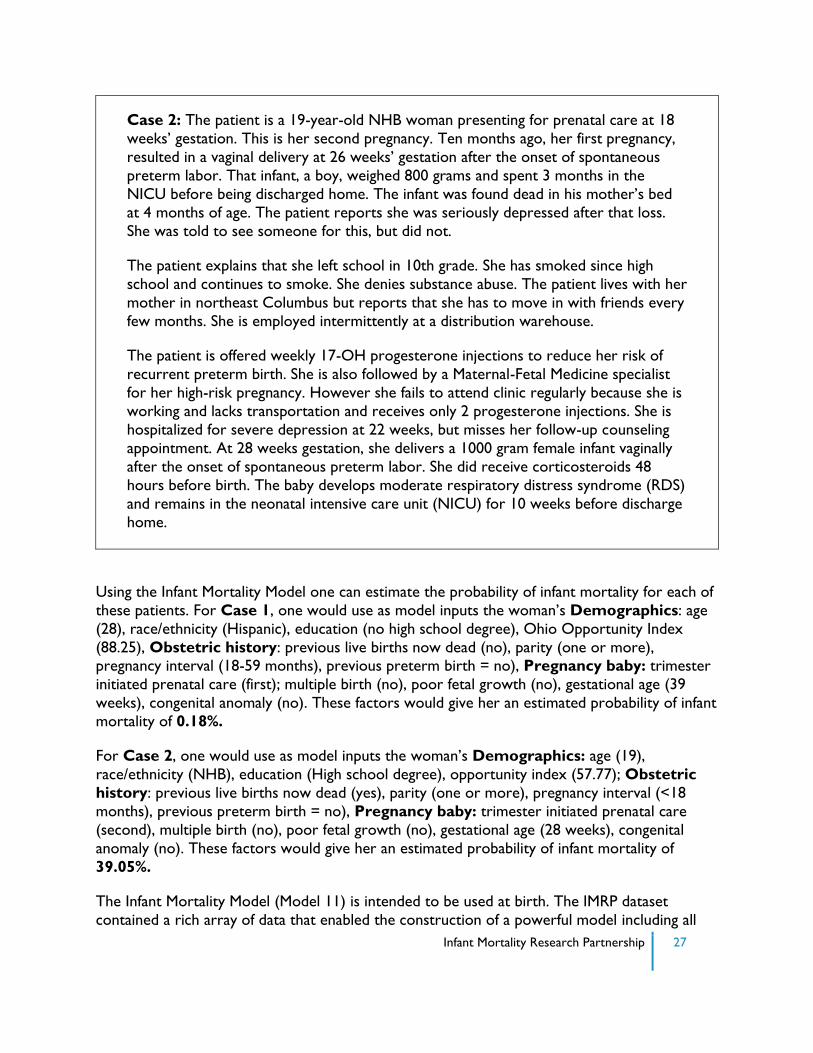
Case 2: The patient is a 19-year-old NHB woman presenting for prenatal care at 18
weeks’ gestation. This is her second pregnancy. Ten months ago, her first pregnancy,
resulted in a vaginal delivery at 26 weeks’ gestation after the onset of spontaneous
preterm labor. That infant, a boy, weighed 800 grams and spent 3 months in the
NICU before being discharged home. The infant was found dead in his mother’s bed
at 4 months of age. The patient reports she was seriously depressed after that loss.
She was told to see someone for this, but did not.
The patient explains that she left school in 10th grade. She has smoked since high
school and continues to smoke. She denies substance abuse. The patient lives with her
mother in northeast Columbus but reports that she has to move in with friends every
few months. She is employed intermittently at a distribution warehouse.
The patient is offered weekly 17-OH progesterone injections to reduce her risk of
recurrent preterm birth. She is also followed by a Maternal-Fetal Medicine specialist
for her high-risk pregnancy. However she fails to attend clinic regularly because she is
working and lacks transportation and receives only 2 progesterone injections. She is
hospitalized for severe depression at 22 weeks, but misses her follow-up counseling
appointment. At 28 weeks gestation, she delivers a 1000 gram female infant vaginally
after the onset of spontaneous preterm labor. She did receive corticosteroids 48
hours before birth. The baby develops moderate respiratory distress syndrome (RDS)
and remains in the neonatal intensive care unit (NICU) for 10 weeks before discharge
home.
Using the Infant Mortality Model one can estimate the probability of infant mortality for each of
these patients. For Case 1, one would use as model inputs the woman’s Demographics: age
(28), race/ethnicity (Hispanic), education (no high school degree), Ohio Opportunity Index
(88.25), Obstetric history: previous live births now dead (no), parity (one or more), pregnancy interval (18-59 months), previous preterm birth = no), Pregnancy baby: trimester
initiated prenatal care (first); multiple birth (no), poor fetal growth (no), gestational age (39
weeks), congenital anomaly (no). These factors would give her an estimated probability of infant
mortality of 0.18%.
For Case 2, one would use as model inputs the woman’s Demographics: age (19),
race/ethnicity (NHB), education (High school degree), opportunity index (57.77); Obstetric
history: previous live births now dead (yes), parity (one or more), pregnancy interval (<18
months), previous preterm birth = no), Pregnancy baby: trimester initiated prenatal care
(second), multiple birth (no), poor fetal growth (no), gestational age (28 weeks), congenital
anomaly (no). These factors would give her an estimated probability of infant mortality of
39.05%.
The Infant Mortality Model (Model 11) is intended to be used at birth. The IMRP dataset
contained a rich array of data that enabled the construction of a powerful model including all
Infant Mortality Research Partnership 28
factors prior to birth. However, other models developed in this study are designed to be used
earlier in the course of pregnancy. These models can help to identify women at higher and
lower levels of risk at a point where interventions may help to prevent preterm birth, itself a
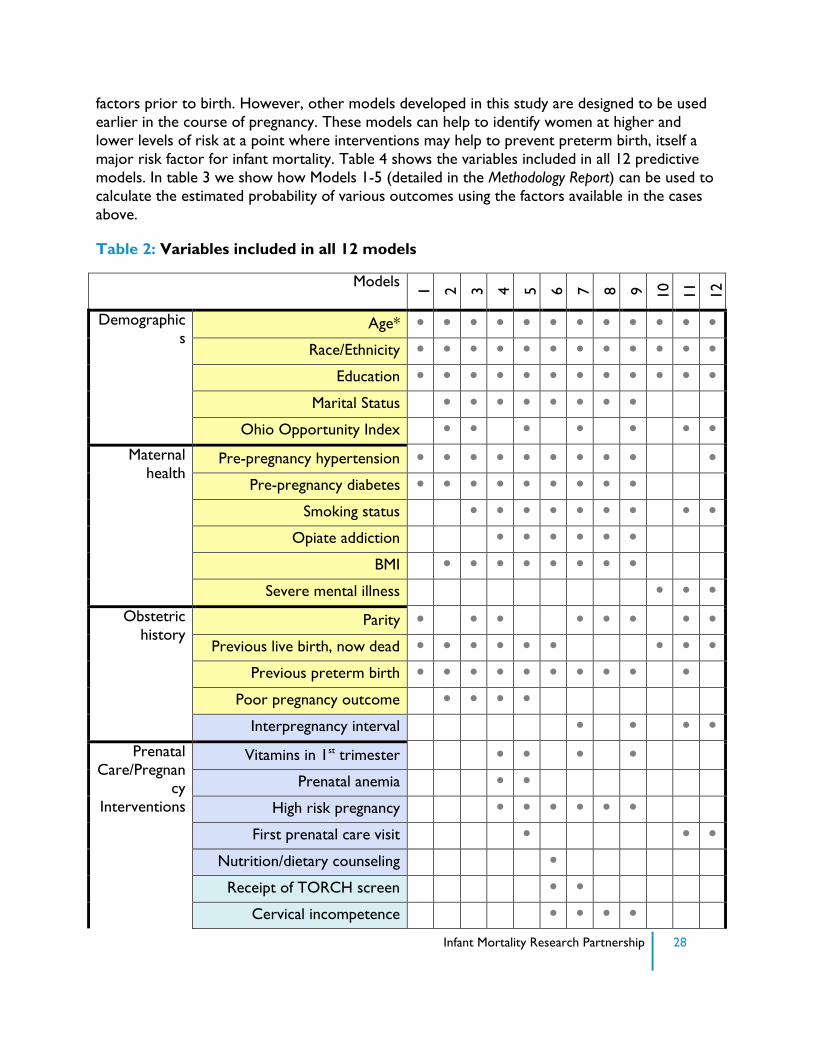
major risk factor for infant mortality. Table 4 shows the variables included in all 12 predictive
models. In table 3 we show how Models 1-5 (detailed in the Methodology Report) can be used to
calculate the estimated probability of various outcomes using the factors available in the cases
above.
Table 2: Variables included in all 12 models
Models
1
2
3
4
5
6
7
8
9
10
11
12
Demographic
s Age* • • • • • • • • • • • •
Race/Ethnicity • • • • • • • • • • • •
Education • • • • • • • • • • • •
Marital Status • • • • • • • •
Ohio Opportunity Index • • • • • • • Maternal
health Pre-pregnancy hypertension • • • • • • • • • •
Pre-pregnancy diabetes • • • • • • • • •
Smoking status • • • • • • • • •
Opiate addiction • • • • • •
BMI • • • • • • • •
Severe mental illness • • • Obstetric
history Parity • • • • • • • •
Previous live birth, now dead • • • • • • • • •
Previous preterm birth • • • • • • • • • •
Poor pregnancy outcome • • • •
Interpregnancy interval • • • • Prenatal
Care/Pregnancy
Interventions
Vitamins in 1st trimester • • • •
Prenatal anemia • •
High risk pregnancy • • • • • •
First prenatal care visit • • •
Nutrition/dietary counseling •
Receipt of TORCH screen • •
Cervical incompetence • • • •
Infant Mortality Research Partnership 29
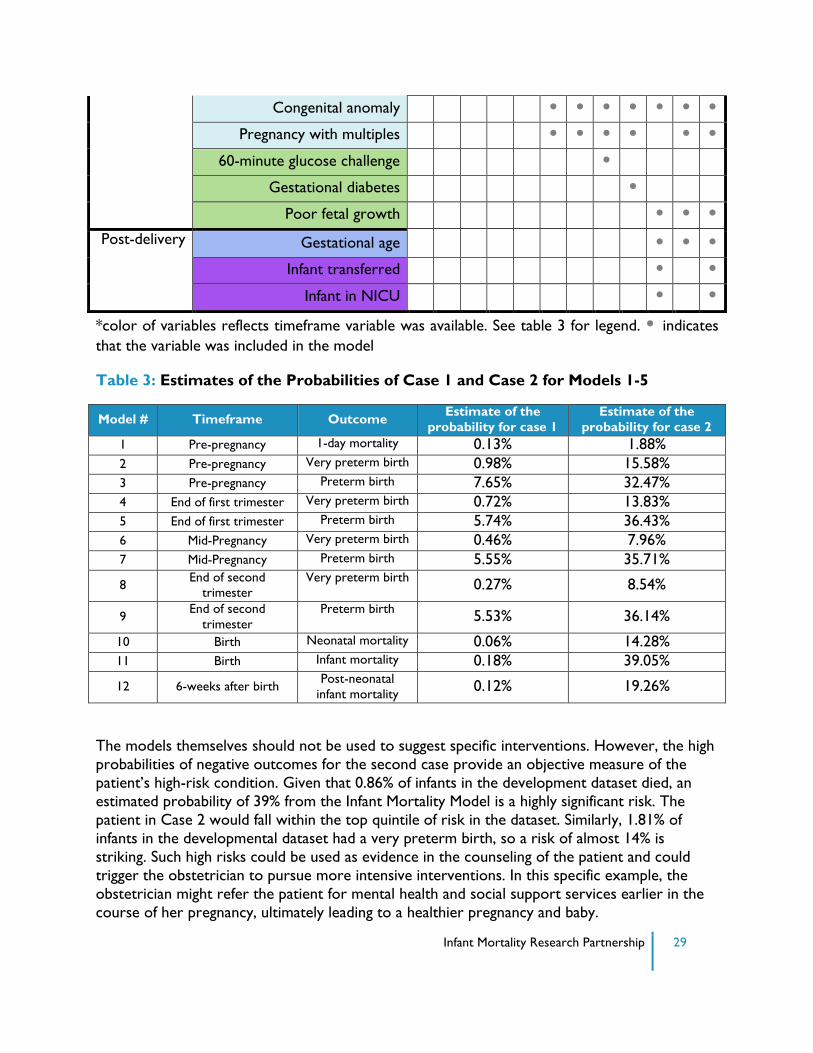
Congenital anomaly • • • • • • •
Pregnancy with multiples • • • • • •
60-minute glucose challenge •
Gestational diabetes •
Poor fetal growth • • • Post-delivery Gestational age • • •
Infant transferred • •
Infant in NICU • •
*color of variables reflects timeframe variable was available. See table 3 for legend. • indicates
that the variable was included in the model
Table 3: Estimates of the Probabilities of Case 1 and Case 2 for Models 1-5
Model # Timeframe Outcome Estimate of the
probability for case 1
Estimate of the
probability for case 2
1 Pre-pregnancy 1-day mortality 0.13% 1.88%
2 Pre-pregnancy Very preterm birth 0.98% 15.58%
3 Pre-pregnancy Preterm birth 7.65% 32.47%
4 End of first trimester Very preterm birth 0.72% 13.83%
5 End of first trimester Preterm birth 5.74% 36.43%
6 Mid-Pregnancy Very preterm birth 0.46% 7.96%
7 Mid-Pregnancy Preterm birth 5.55% 35.71%
8 End of second
trimester
Very preterm birth 0.27% 8.54%
9 End of second
trimester
Preterm birth 5.53% 36.14%
10 Birth Neonatal mortality 0.06% 14.28%
11 Birth Infant mortality 0.18% 39.05%
12 6-weeks after birth Post-neonatal
infant mortality 0.12% 19.26%
The models themselves should not be used to suggest specific interventions. However, the high
probabilities of negative outcomes for the second case provide an objective measure of the
patient’s high-risk condition. Given that 0.86% of infants in the development dataset died, an
estimated probability of 39% from the Infant Mortality Model is a highly significant risk. The
patient in Case 2 would fall within the top quintile of risk in the dataset. Similarly, 1.81% of
infants in the developmental dataset had a very preterm birth, so a risk of almost 14% is
striking. Such high risks could be used as evidence in the counseling of the patient and could
trigger the obstetrician to pursue more intensive interventions. In this specific example, the
obstetrician might refer the patient for mental health and social support services earlier in the
course of her pregnancy, ultimately leading to a healthier pregnancy and baby.
Infant Mortality Research Partnership 30
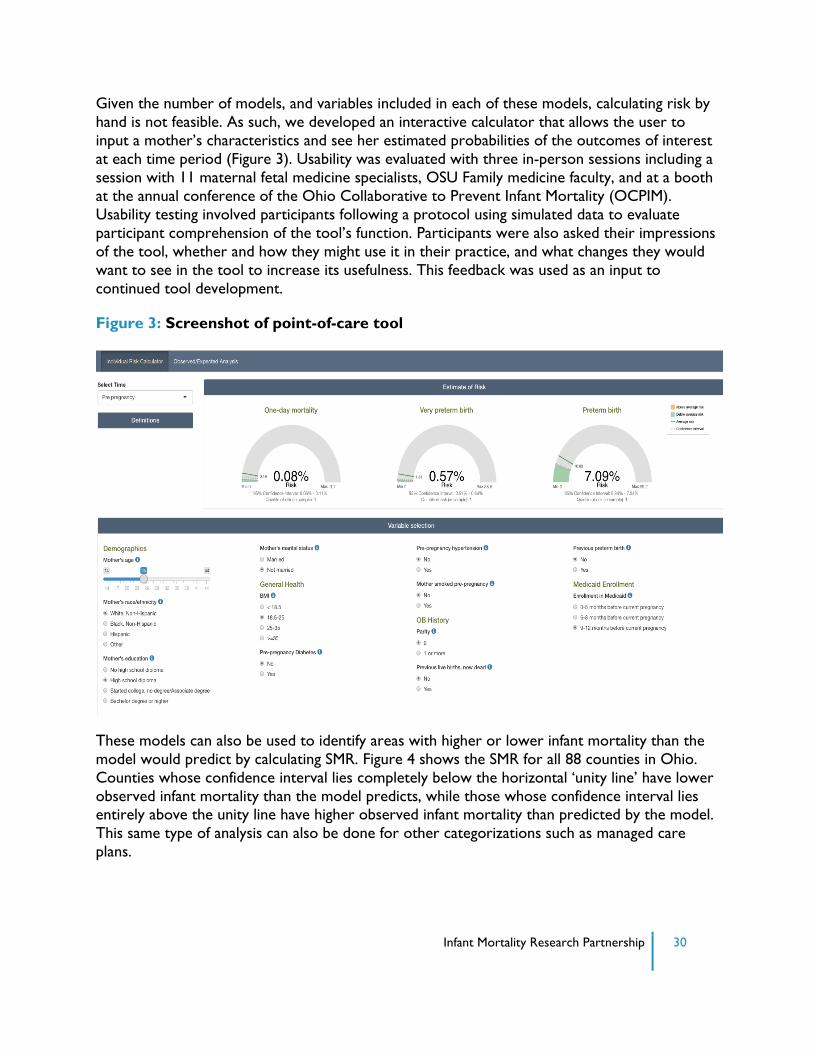
Given the number of models, and variables included in each of these models, calculating risk by
hand is not feasible. As such, we developed an interactive calculator that allows the user to
input a mother’s characteristics and see her estimated probabilities of the outcomes of interest
at each time period (Figure 3). Usability was evaluated with three in-person sessions including a
session with 11 maternal fetal medicine specialists, OSU Family medicine faculty, and at a booth
at the annual conference of the Ohio Collaborative to Prevent Infant Mortality (OCPIM).
Usability testing involved participants following a protocol using simulated data to evaluate
participant comprehension of the tool’s function. Participants were also asked their impressions
of the tool, whether and how they might use it in their practice, and what changes they would
want to see in the tool to increase its usefulness. This feedback was used as an input to
continued tool development.
Figure 3: Screenshot of point-of-care tool
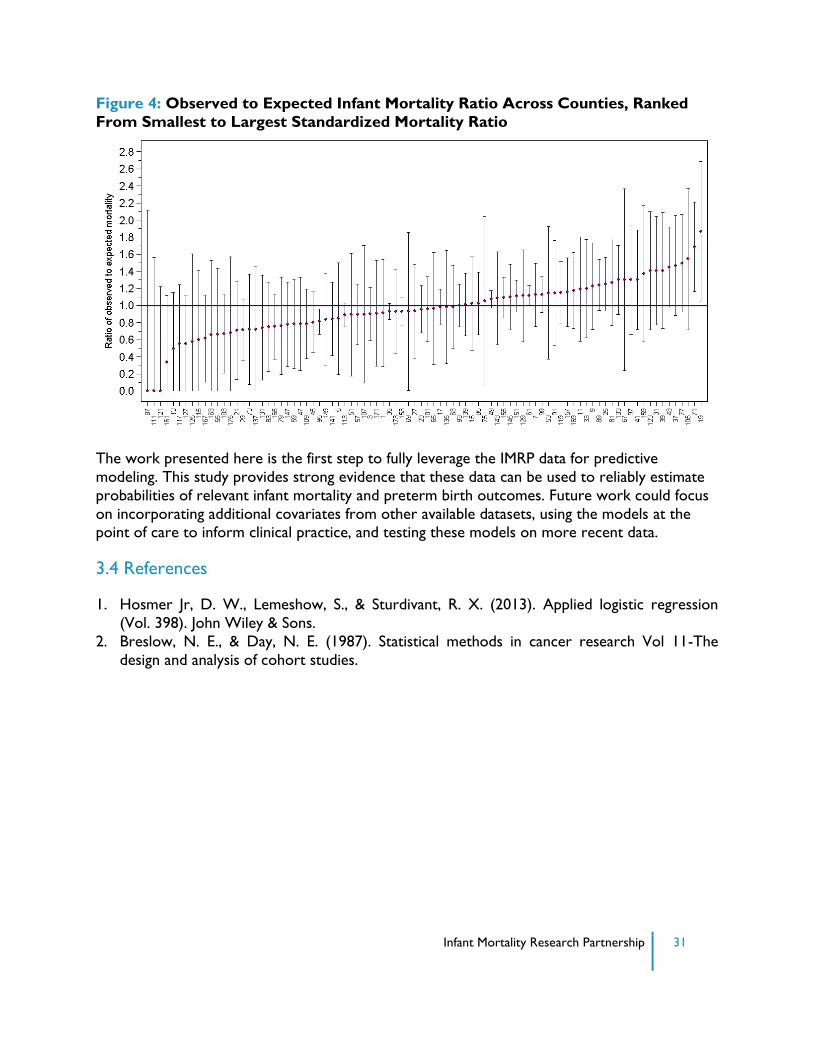
These models can also be used to identify areas with higher or lower infant mortality than the
model would predict by calculating SMR. Figure 4 shows the SMR for all 88 counties in Ohio.
Counties whose confidence interval lies completely below the horizontal ‘unity line’ have lower
observed infant mortality than the model predicts, while those whose confidence interval lies entirely above the unity line have higher observed infant mortality than predicted by the model.
This same type of analysis can also be done for other categorizations such as managed care
plans.
Infant Mortality Research Partnership 31
Figure 4: Observed to Expected Infant Mortality Ratio Across Counties, Ranked
From Smallest to Largest Standardized Mortality Ratio
The work presented here is the first step to fully leverage the IMRP data for predictive
modeling. This study provides strong evidence that these data can be used to reliably estimate
probabilities of relevant infant mortality and preterm birth outcomes. Future work could focus
on incorporating additional covariates from other available datasets, using the models at the point of care to inform clinical practice, and testing these models on more recent data.
3.4 References
1. Hosmer Jr, D. W., Lemeshow, S., & Sturdivant, R. X. (2013). Applied logistic regression
(Vol. 398). John Wiley & Sons.
2. Breslow, N. E., & Day, N. E. (1987). Statistical methods in cancer research Vol 11-The
design and analysis of cohort studies.

Infant Mortality Research Partnership 32
SECTION 4: DISCUSSION
4.1 Putting Results into Context
The first phase of IMRP brought together three very different methodological approaches to
large-scale data analysis toward addressing the problem of infant mortality in Ohio. In Phase II
the two teams have worked collaboratively to develop usable tools for policy makers and
clinicians.
A principal value of this project lies in the tools that have been created for policymakers and
healthcare professionals. These tools can help stakeholders investigate the causes of infant
mortality and develop strategies to address these issues. This innovative approach gives
policymakers powerful analytical tools to make a difference in the lives of Ohio mothers and
their babies.
There are several important themes to highlight in this report, presented here in terms of the
level in which they fall within the socio-ecological model.
4.1.1 Individual-Level
Maternal Demographics, Infant Mortality, and Preterm Birth
Each year in Ohio, nearly 1,000 infants die before reaching their first birthday, and a
disproportionately large number of them, nearly 40%, are NHB infants. This disparity is evident
in the findings of the IMRP; however, the results of the IMRP’s work also show that this is a
complex issue that deserves a more nuanced approach.
NHB race/ethnicity was associated with increased odds of infant mortality in the individual
predictive model (Figure 1) even when adjusted for age, maternal comorbidities and obstetrical
history. In fact, race was a significant factor in all 12 predictive models. Education was also
associated with infant mortality in all of the models. In the Infant Mortality Model, detailed
above (section 4.3), those without a high-school diploma had the highest odds of infant
mortality, when adjusted for all other factors in the model.
Similarly, the spatiotemporal model showed that spatial clusters are concentrated in urban
neighborhoods with high concentrations of NHB residents. Compared to neighborhoods with
<25% NHB residents, the odds of an infant death in neighborhoods with >75% were
approximately 20% greater. The odds were increased for preterm birth as well. The multi-level
models (see Table 2.8, Methodology Report) showed NHB race and not completing high school
to be significantly associated with infant mortality.
Interestingly, spatial clusters of infant mortality in major cities disappear when adjusted for
maternal age, race and education, suggesting a much more complex role of race in infant
mortality. In contrast, premature birth clusters do not disappear in most large urban areas when
models adjust for maternal age, race, and education.
Infant Mortality Research Partnership 33
Prior Obstetrical History, Medical Complications, Infant Mortality and Preterm Birth
In addition to demographics and community-level factors, an individual woman’s obstetrical and
medical history was also found to be associated with infant mortality.
Obstetrical History and Pregnancy characteristics: The individual-prediction Infant Mortality
Model (Figure 1, Section 3) showed that diagnosis of poor fetal growth and congenital anomaly
were associated with increased odds of infant mortality. Parity was included in the 8 of the 12
models and interpregnancy interval was included in 4 of the models. In the majority of the 12
models, previous preterm birth and previous live birth, now dead, were associated with the
outcomes of interest. In the models intended for use after birth, gestational age, infant
transferred and an infant in the NICU were strong predictors of the outcome.
Medical history: Medical and mental health history was found to be associated with infant
mortality in the individual predictive models. Smoking during pregnancy was associated with
increased odds of infant mortality (Figure 1). Smoking status, pre-pregnancy diabetes,
hypertension and BMI were included in a majority of the very preterm and preterm birth
models. Diagnosis of severe mental illness in the prenatal period was associated with increased odds of infant mortality but was not included in the preterm birth models.
Opiate addiction was included in half of the models as a predictor of preterm and very preterm
birth. Maps of material opiate use and NAS clearly indicate areas of the state where a
significantly higher proportion of mothers struggle with opiate addiction.
4.1.2 Organizational-Level
Access to Prenatal Care, Appropriate Postnatal Care, Infant Mortality and Preterm Birth
Prenatal Care Initiation: The individual predictive models also showed the impact of pre- and postnatal care. The week of initiation of the first prenatal care visit was associated with the
outcome of infant mortality (Figure 1) with a later initiation being associated with increased
odds of infant mortality.
4.1.3 Community-Level
The Association Between Social Determinants, Infant Mortality and Preterm Birth
Results showed that social factors such as housing and exposure to high crime areas are
extremely important in influencing infant mortality. The spatiotemporal models showed that
once area-level socioeconomic and structural variables are taken into account, much of the
effect of living in a high concentration NHB area dissipates. These models also suggested that
living in an area with a high crime rate increases the risk of infant mortality and preterm birth. This is a novel finding with significant implications for statewide interventions and policy.
Furthermore, models of preterm birth that focused on urban populations demonstrate that NH
white mothers and NH black mothers experience neighborhoods quite differently. The
interaction of maternal race and neighborhood segregation indicates that NH black mothers
Infant Mortality Research Partnership 34
have a higher risk of preterm birth than NH white mothers living in the same (highly segregated
black) neighborhood. This suggests that NH black mothers may struggle with issues such as
institutional racism, weaker social networks, or higher levels of stress than white mothers.
In Phase II of IMRP, the researchers combined efforts to include a census-tract level variable in
the individual predictive models. The Ohio Opportunity Index measures a series of community
level resources such as transportation, education, employment, housing, health, access and
crime. A higher score implies more access to these resources. The specific census-tract score
for each woman was associated with the outcome in seven of the twelve models, even when
adjusted for other demographic variables. This suggests that community level resources are
important factors in the health of pregnant women and their infants.
4.1.4 Policy-Level
The Impact of Ohio’s Current Interventions on Infant Mortality and Preterm Birth
The case study examined how Ohio’s vital records and Medicaid data can be used to assist
place-based interventions such as the OEI initiatives examine the changing demographics of
their target populations and whether population-level changes in key birth outcomes have
occurred over time. In the case of Franklin County, the demographic composition of their
target zip codes are changing, suggesting they need to consider focusing on new zip codes to
reach the population most in need of their services. Analysis of trends in birth outcomes
suggest that while poor birth outcomes initially declined, there has been an uptick over the past
few years. This type of analysis suggests that access to small-area data from Medicaid and vital
records is a valuable tool as place-based interventions around the state attempt to understand
their impact on the communities they serve.
The Role of Gestational Age
A large fraction of infant deaths occurred at pre-viable gestational ages. Specifically, analyses
found that 11.60% (549/4,733) of infant deaths occurred before or on their 20th week of gestation. Infants born at such an early gestational age would not be expected to survive given
limits to currently available medical interventions.
Ohio had the 7th highest proportion of infant deaths <20 weeks gestation (7.7%) according to
CDC Wonder data from 2010-2014. When infant deaths less than 20 weeks are excluded,
Ohio’s IMR drops to 6.9 per 1,000 live births, compared to the reported 7.5 per 1,000. This
issue has been discussed previously. A study of Ohio live births at 16-22 weeks gestation from
2006-2012 found that these births accounted for 0.25% of all live births, but 28% of all infant
mortality for NHW newborns and 45% for NHB newborns.(1) In addition to the contribution
to the overall IMR, the racial disparity in pre-viable live births may explain much of the IMR
disparity between NHW and NHB infants.
On the policy level, these findings suggest that interventions aimed at decreasing preterm labor,
(e.g. improving pre-pregnancy maternal health, early prenatal care, increasing inter-pregnancy
interval) especially in communities at highest risk, will likely have a significant impact on both
Ohio’s IMR and in its racial infant mortality disparity.
Infant Mortality Research Partnership 35
4.2 Implementing the IMRP models
The work done by the IMRP is innovative. Instead of reporting static findings, the teams created
dynamic and interactive models that can be used by policymakers and healthcare professionals
to continue to investigate factors associated with infant mortality. The following are some (but
not all) of the ways these models could be used to impact policy and care for individual Ohio
women.
Identify high-risk areas in Ohio
The spatiotemporal clustering allows policymakers to visualize areas at highest risk, as well as identify areas at high risk after adjusting for known risk factors. Once known risk
factors are taken into account, rural counties in Appalachia are shown to be at increased
risk. Many of these counties are not specific targets of OEI initiatives and may be areas for
expansion.
Cluster analysis also indicates several regions of the state with higher than expected risk for maternal opiate use and NAS. Such information could be used to begin place-based,
targeted interventions around maternal opioid use.
Implement point-of-care individual models
Calculate individual risk: The final logistic regression models can be used in a calculator that can estimate the probability of an outcome (e.g., infant mortality) based on a woman’s
individual factors (see section 3.3). This could be used by a healthcare provider to help
counsel an individual woman or by policymakers for hypothesis generation to consider
which risk factors might be important to address.
Estimate impact of interventions
Estimate risk with changes in the prevalence of covariates: The predictive models (section
3) can be used to estimate the change in the probability of an outcome corresponding to
changes in the level of a covariate. For example, if the prevalence of smoking pre-
pregnancy was reduced, how might this change the expected number of infant deaths?
Assess performance
Use Standardized Mortality Ratios to compare counties and managed care plans: By
calculating the SMR for counties and Medicaid managed care plans in Ohio, policymakers
can more accurately identify counties that have lower or higher infant mortality than
predicted.
4.3 Putting It All Together: The Infant Mortality Reduction Analytics Dashboard
The models discussed in this report have been incorporated into the Infant Mortality Reduction
Analytics Dashboard to create a set of dynamic tools that can help users at ODH and ODM
better understand and evaluate factors related to infant mortality in the state of Ohio. These
tools were built in a web-based application so that they could be disseminated among the state
sponsors to help inform policy decisions. In the future, certain functions of the dashboard could
also be used by healthcare providers to assess risk in their patients at the point of care.
Infant Mortality Research Partnership 36
The geographic models allow users to visualize spatial clusters and relevant geographic layers of
infant mortality on a map of Ohio, track the impact of interventions over time to decrease
infant mortality, and identify high and low performing counties. The individual predictive models
enable users to estimate the risk of relevant outcomes for individual women and infants over
the course of pregnancy, and display standardized infant mortality rates for each managed care
plan. For more information, please visit grc.osu.edu/projects/IMRP.
4.4 Strengths of the Partnership
This partnership was an innovative approach to large-scale data analytics to address a significant
public health issue. The strengths of this approach included:
Robust methods: Results and common themes can be compared across multiple,
established methods to further assess the robustness of the findings.
Ongoing communication and feedback: Regular in-person meetings, conference calls, and webinars enabled the research teams as well as ODM, ODH, ODHE and GRC
to provide continued constructive criticism and feedback.
Iterative improvements: The research teams have been able to continuously
improve and update their models with current and expanded data from Phase 1 to
Phase 2 of the study.
Transdisciplinary collaboration: The researchers on this project include obstetricians, pediatricians, geographers, informaticians, public health practitioners, and
experts in statistical modeling. Their shared expertise along the research continuum
helps us to translate our findings to policy makers and the bedside.
4.5 Limitations of the Work
The nature of this type of research posed challenges during the course of the partnership:
4.5.1 Data Limitations
The IMRP leveraged data collected for operational and public health uses throughout the state
of Ohio. As with any project that uses data collected for other purposes, there were expected
and unexpected challenges related to data accuracy and completeness.
4.5.1.1 Missing and Inaccurate Data
There were discrepancies between similar variables among datasets used by IMRP researchers.
For example, birth weight was available from multiple data sources, sometimes with different
values for the same birth. There were also discrepancies between the date of death across
some of the datasets. These are common challenges when using data collected for other
purposes; however, they complicated the process of linking the data to additional files. This
issue was exacerbated by the lack of a unique, cross-dataset woman and baby identifier (e.g.
Social Security Numbers are not available within all study datasets). In addition, some of the
Infant Mortality Research Partnership 37
variables within data sources were not reliably collected, including those about important topics
such as smoking cessation and breastfeeding support, and thus could not be used in the
analyses.
One of the IMRP’s ancillary contributions was exploring some of these data issues to facilitate
future work in this area.
4.5.1.2 Completeness of the Datasets
Despite a wealth of data available to project researchers, there are some risk factors across all
levels of the socio-ecological model that are not easy to capture. For example, at the individual
level, data were not available for measures of women’s stress levels, their trust in the
healthcare system, or their perceptions and experiences of racism. At the interpersonal level,
data were not available for what kind of family or peer support women receive. At the
organizational level, data were not available about women’s interactions with mental health care
providers or social service agencies (e.g. how hard it is to obtain help from organizations).
From the community level, data about clean air and water and ‘walkability’ of women’s
community were not available in this phase of the project. Finally, at the public policy level
there were insufficient data or results from prior studies on the impacts of housing policies, safety net policies, institutionalized racism, and changes in the healthcare system on infant
mortality, PTB, or their antecedents.
In addition, available datasets were limited to live births. This limited the study’s ability to model
poor pregnancy outcomes in the state of Ohio.
4.5.2 Dynamic Risk Factors
The factors influencing infant mortality are dynamic, and some are changing rapidly and without
high quality data that allow integrating them in models. Phenomena such as Medicaid expansion
and the opioid epidemic in Ohio pose challenges to constructing and validating models such as
those presented in this report. To address this challenge, ongoing modeling and engagement
between researchers and policymakers will be essential.
4.6 Recommended Next Steps
The IMRP aimed to use Ohio’s data to better understand infant mortality in Ohio and to
develop tools to inform policy and practice. There are many ways that the results mentioned in
this document as well as in future IMRP work may inform policy and interventions. A few of
these include:
While common challenges face all Ohio counties and neighborhoods, each is also unique
and will require locally-informed interventions.
The research teams collectively demonstrated the importance of addressing the social determinants of health in resource-scarce communities if infant mortality is to be reduced.
These include, but are not limited to: segregation and structural racism, violent crime,

Infant Mortality Research Partnership 38
food security, housing stability, education, safe sleep programs and access to health care
for women and children before, during and after pregnancy.
Expanding and integrating mental health care services with perinatal medical care to
address the strong association between serious mental health conditions and infant deaths.
Explicit investigation of the impact of maternal opioid use on preterm birth and low
birthweight that might ultimately impact the infant mortality rate in the state.
While these results have clear implications for policymakers and community leaders from
many disciplines (e.g. housing, business, justice department), the findings from the IMRP
could also be disseminated to practitioners to improve their practice at the individual
level. Health and social service professionals could benefit from translational science in this regard, in order to ensure they are equipped with a robust understanding of the
multiple, intersecting factors contributing to infant mortality. This could ensure they are
able to appropriately and effectively identify and address some of the factors impacting
infant mortality, or mobilize the necessary community resources if needed.
Expanded data collection: The IMRP researchers identified several risk factors that were
not well represented in the dataset. This may have been because the data are not
currently collected or that they just were not available in the datasets for the project.
Some examples include:
o Data on exact location of Section 8 / federal housing.
o Air and water quality data. These are available but are time intensive to process
for modeling.
o Noise and urban greenness data.
o Records reflecting fetal death or pregnancy loss that would give a broader
picture of infant mortality and maternal health in Ohio.
o A single unique identifier across all datasets for mothers and babies to avoid the
challenges of probabilistic linking.
o All residential addresses not just annual addresses.
o Qualitative information from the Fetal Infant Mortality Review.
o Walkability scores of Ohio streets and traffic counts. o Immigration status in history (important to address disparities among refugee,
recent and long-term immigrants).
o Opioid overdose rates at the census tract level.
The addition of these variables in future IMRP work would likely give a more accurate
representation of the environment in which women in Ohio live.
Multiple initiatives have been implemented to improve birth outcomes in the state.
However, there is not a robust inventory of these interventions. This inventory should
include the geographic reach, a description of the intervention, adjustments made that
Infant Mortality Research Partnership 39
tailor the intervention to specific populations, and information on the fidelity of
implementation.
While the infant mortality rate in Ohio has recently been reduced, it remains a significant public
health problem. The findings in this report and other IMRP outputs provide insights and
direction to focus and enhance efforts aimed at reducing the number of infants in Ohio dying
before their first birthday.
4.7 References
1. DeFranco EA, Hall ES, Muglia LJ. Racial disparity in previable birth. Am J Obstet
Gynecol. 2016; 214:394. e1-7.
Infant Mortality Research Partnership 40
ACKNOWLEDGEMENTS
The IMRP thanks Mary Applegate, MD, Medicaid Medical Director on behalf of ODM Director
Maureen Corcoran; Charles See, Vice Chancellor of the Ohio Department of Higher Education;
and the Ohio Department of Health for their participation in IMRP meetings and activities.
The Infant Mortality Research Partnership is funded by the Ohio Department of Higher Education and the Ohio Department of Medicaid thru the Medicaid Technical Assistance and Policy Program
(MEDTAPP), in collaboration with the Ohio Department of Health and the Governor’s Office of Health
Transformation. The views expressed in this report are solely those of the authors and do not represent
the views of the project’s funding or collaborating agencies.
Cover Photo “DSC_0955” by Niko Knigge is licensed under CC BY 2.0.
Infant Mortality Research Partnership 41
Infant Mortality Research Partnership Members
Christopher Browning, PhD OSU (G) Timothy Sahr, MPH, MA GRC
Jason Benedict, MS OSU(I) Pamela Salsberry, PhD, RN OSU(G)
Nicole Canfield GRC Chi Song, PhD OSU(G)
Jessica Diallo, MA (PM) GRC Doug Spence, PhD GRC
Steve Gabbe, MD (PI) OSU(I) Christine Swoboda, PhD OSU(I)
Pat Gabbe, MD, MPH OSU(I) John Thompson (C) OSU(I)
Courtney Hebert, MD, MS OSU(I) Rohith Vanam OSU(I)
Timothy Huerta, PhD, MS OSU(I) Benjamin Yake GRC
Yoshie Kim, MS GRC Yun Ye, MPH OSU(I)
Kaiting Lang, MPH OSU(G)
Stanley Lemeshow, PhD (C) OSU(I)
Jinhyung Lee, MA OSU (G)
Zihan Lin OSU(I)
Luyu Lu OSU (G)
Harvey Miller, PhD OSU(G)
Giovanni Nattino, PhD, MSc OSU(I)
Colin Odden GRC
Adam Porr, MS OSU(G)
Lorin Ranbom (PI) GRC
Endia Reid, MHA, MS (PM) OSU (I)
Elisabeth Root, PhD(PI) OSU(G) ,
Abbreviations: GRC: Ohio Colleges Of Medicine Government Resource Center; OSU: The Ohio State University; PI: Principal Investigator;
PM: Project Manager; C: Coordinating; G: Geospatial; I: Individual Predictive Modeling;