Embed Size (px)
Citation preview
1 2014 Ohio Infant Mortality Data: General Findings
Department of Health
2014 Ohio Infant Mortality Data: General Findings
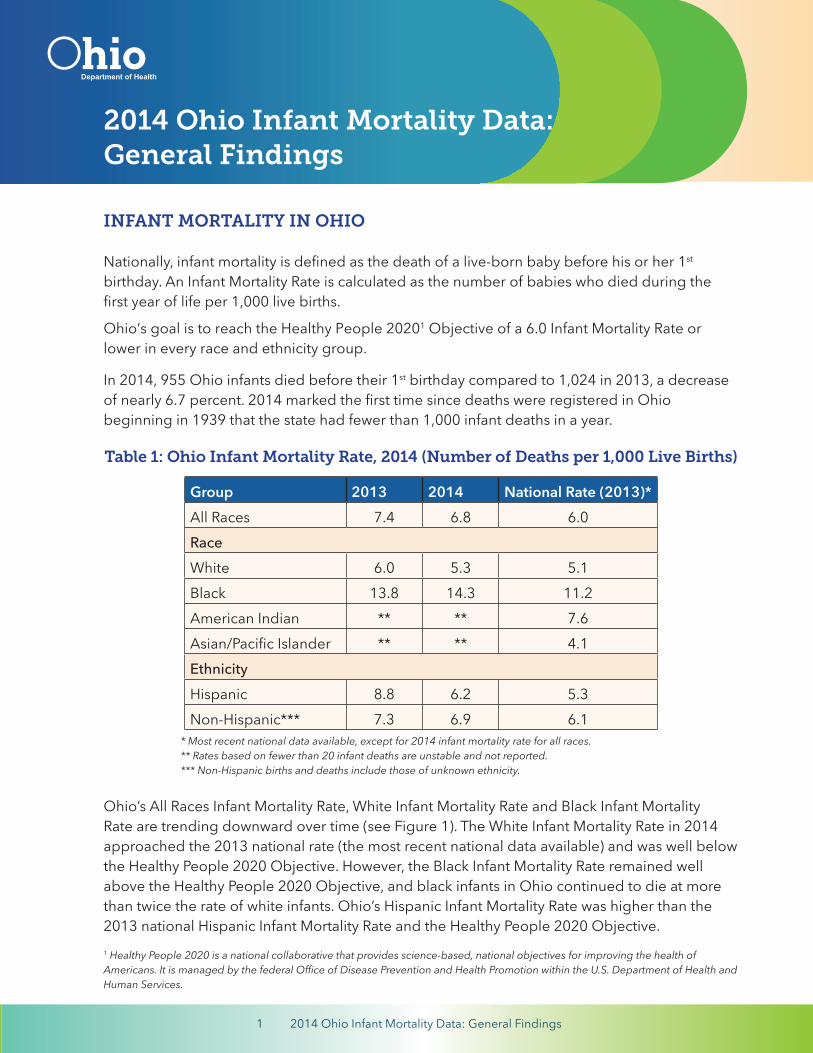
INFANT MORTALITY IN OHIO
Nationally, infant mortality is defined as the death of a live-born baby before his or her 1st birthday. An Infant Mortality Rate is calculated as the number of babies who died during the first year of life per 1,000 live births.
Ohio’s goal is to reach the Healthy People 20201 Objective of a 6.0 Infant Mortality Rate or lower in every race and ethnicity group.
In 2014, 955 Ohio infants died before their 1st birthday compared to 1,024 in 2013, a decrease of nearly 6.7 percent. 2014 marked the first time since deaths were registered in Ohio beginning in 1939 that the state had fewer than 1,000 infant deaths in a year.
Table 1: Ohio Infant Mortality Rate, 2014 (Number of Deaths per 1,000 Live Births)
Group 2013 2014 National Rate (2013)*All Races 7.4 6.8 6.0RaceWhite 6.0 5.3 5.1Black 13.8 14.3 11.2American Indian ** ** 7.6Asian/Pacific Islander ** ** 4.1EthnicityHispanic 8.8 6.2 5.3Non-Hispanic*** 7.3 6.9 6.1
* Most recent national data available, except for 2014 infant mortality rate for all races.** Rates based on fewer than 20 infant deaths are unstable and not reported.*** Non-Hispanic births and deaths include those of unknown ethnicity.
Ohio’s All Races Infant Mortality Rate, White Infant Mortality Rate and Black Infant Mortality Rate are trending downward over time (see Figure 1). The White Infant Mortality Rate in 2014 approached the 2013 national rate (the most recent national data available) and was well below the Healthy People 2020 Objective. However, the Black Infant Mortality Rate remained well above the Healthy People 2020 Objective, and black infants in Ohio continued to die at more than twice the rate of white infants. Ohio’s Hispanic Infant Mortality Rate was higher than the 2013 national Hispanic Infant Mortality Rate and the Healthy People 2020 Objective. 1 Healthy People 2020 is a national collaborative that provides science-based, national objectives for improving the health of Americans. It is managed by the federal Office of Disease Prevention and Health Promotion within the U.S. Department of Health and Human Services.
2 2014 Ohio Infant Mortality Data: General Findings
DRAFT
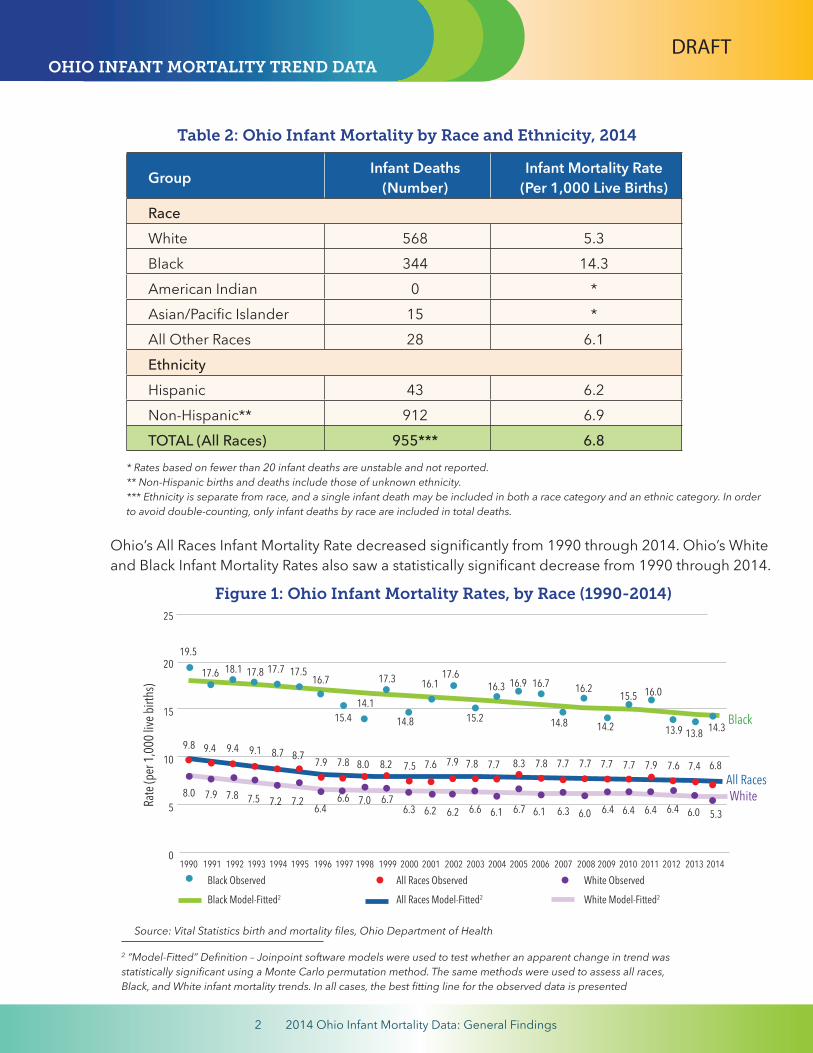
2 “Model-Fitted” Definition – Joinpoint software models were used to test whether an apparent change in trend was statistically significant using a Monte Carlo permutation method. The same methods were used to assess all races, Black, and White infant mortality trends. In all cases, the best fitting line for the observed data is presented
Source: Vital Statistics birth and mortality files, Ohio Department of Health
Ohio’s All Races Infant Mortality Rate decreased significantly from 1990 through 2014. Ohio’s White and Black Infant Mortality Rates also saw a statistically significant decrease from 1990 through 2014.
Figure 1: Ohio Infant Mortality Rates, by Race (1990-2014)
OHIO INFANT MORTALITY TREND DATA
Group Infant Deaths(Number)
Infant Mortality Rate(Per 1,000 Live Births)
RaceWhite 568 5.3Black 344 14.3American Indian 0 *Asian/Pacific Islander 15 *All Other Races 28 6.1EthnicityHispanic 43 6.2Non-Hispanic** 912 6.9TOTAL (All Races) 955*** 6.8
* Rates based on fewer than 20 infant deaths are unstable and not reported.** Non-Hispanic births and deaths include those of unknown ethnicity. *** Ethnicity is separate from race, and a single infant death may be included in both a race category and an ethnic category. In order to avoid double-counting, only infant deaths by race are included in total deaths.
Table 2: Ohio Infant Mortality by Race and Ethnicity, 2014
1990 1991 1992 1993 1994 1995 1996 1997 1998 1999 2000 2001 2002 2003 2004 2005 2006 2007 2008 2009 2010 2011 2012 2013 2014
25
20
15
10
5
0
Black
All RacesWhiteRa
te (p
er 1,0
00 liv
e birt
hs)
Black Observed All Races Observed White Observed
Black Model-Fitted2 All Races Model-Fitted2 White Model-Fitted2
19.5
17.6 17.616.1
6.16.76.16.6
7.77.77.88.37.7
14.2
16.2
14.8
16.916.317.3
7.87.97.6 7.77.7
6.06.46.46.46.46.06.38.0
6.26.7
14.1
16.7
6.3 6.2
9.8 9.4 9.1
6.46.6
7.87.98.78.78.2
7.8 7.5 7.2 7.27.9
8.0 7.5
7.0
17.7 17.5
15.4
17.8
15.214.8
15.516.7
18.1
7.47.67.9
16.0
9.413.9 13.8 14.3
5.3
6.8
3 2014 Ohio Infant Mortality Data: General Findings
CountyNumberNeonatal Deaths**
NeonatalIM Rate
NumberPostneonatal
Deaths***
PostneonatalIM Rate
TotalNumber Infant
Deaths
OverallIM Rate
NumberBirths
Ohio 692 5.0 263 1.9 955 6.8 139,518
Adams 4 * 0 * 4 * 322
Allen 10 * 1 * 11 * 1,280
Ashland 1 * 1 * 2 * 608
Ashtabula 7 * 4 * 11 * 1,060
Athens 3 * 2 * 5 * 557
Auglaize 1 * 0 * 1 * 542
Belmont 2 * 0 * 2 * 705
Brown 4 * 2 * 6 * 476
Butler 32 7.2 7 * 39 8.8 4,457
Carroll 1 * 1 * 2 * 264
Champaign 1 * 0 * 1 * 375
Clark 10 * 3 * 13 * 1,594
Clermont 13 * 3 * 16 * 2,311
Clinton 1 * 0 * 1 * 525
Columbiana 3 * 2 * 5 * 1,057
Coshocton 0 * 2 * 2 * 466
Crawford 0 * 2 * 2 * 500
Cuyahoga 94 6.2 28 1.9 122 8.1 15,080
Darke 2 * 1 * 3 * 667
Defiance 1 * 2 * 3 * 436
Delaware 6 * 3 * 9 * 2,213
Erie 8 * 4 * 12 * 787
Fairfield 8 * 4 * 12 * 1,598
Fayette 1 * 0 * 1 * 326
Franklin 118 6.3 40 2.1 158 8.4 18,880
Fulton 0 * 0 * 0 * 525
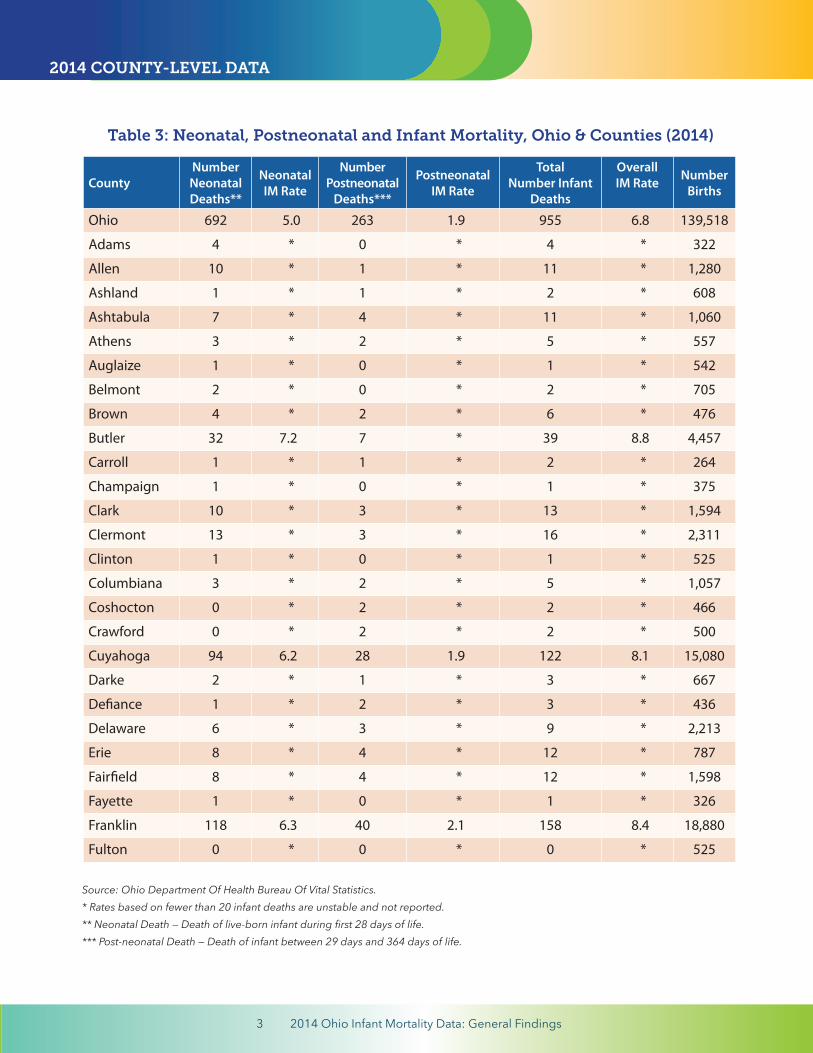
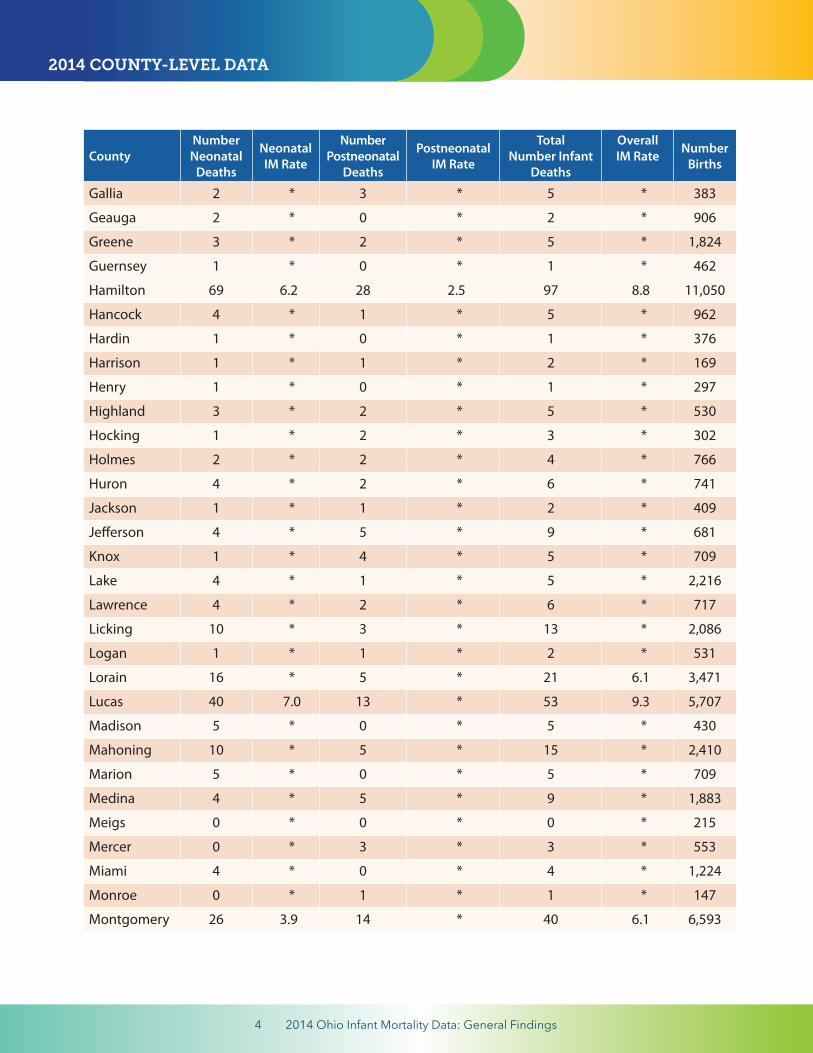
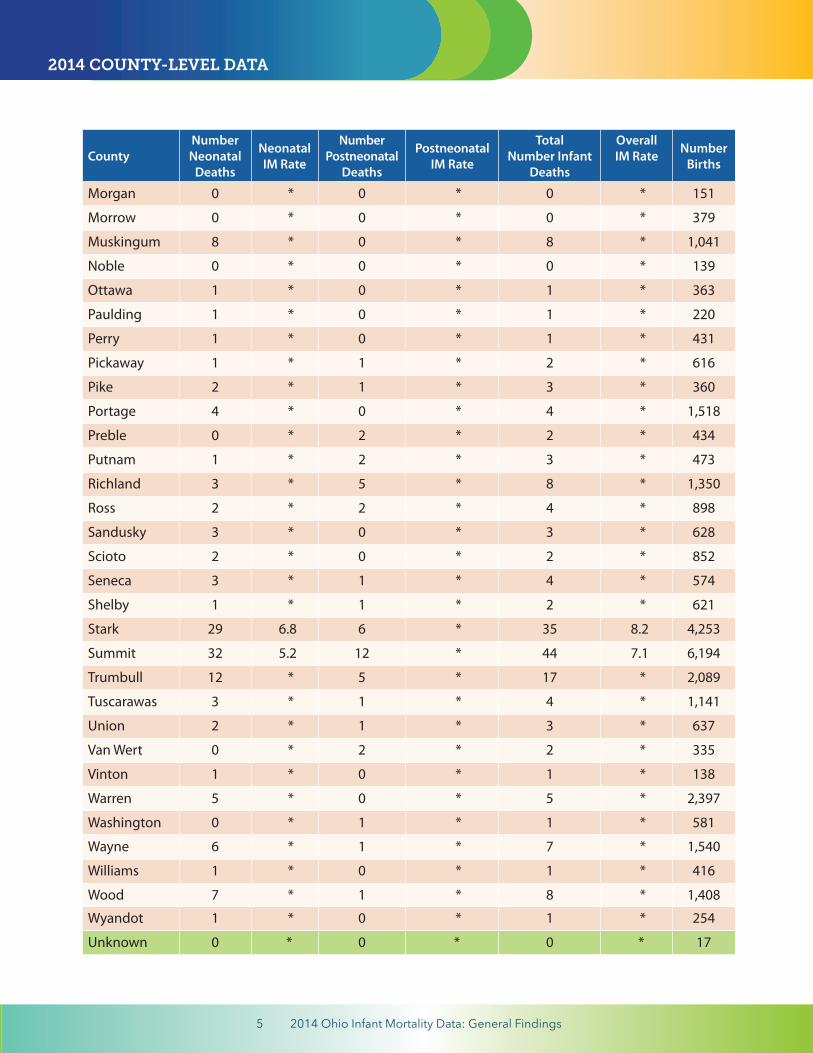
Table 3: Neonatal, Postneonatal and Infant Mortality, Ohio & Counties (2014)
Source: Ohio Department Of Health Bureau Of Vital Statistics.* Rates based on fewer than 20 infant deaths are unstable and not reported.** Neonatal Death — Death of live-born infant during first 28 days of life.*** Post-neonatal Death — Death of infant between 29 days and 364 days of life.
2014 COUNTY-LEVEL DATA
4 2014 Ohio Infant Mortality Data: General Findings
CountyNumberNeonatal
Deaths
NeonatalIM Rate
NumberPostneonatal
Deaths
PostneonatalIM Rate
TotalNumber Infant
Deaths
OverallIM Rate
NumberBirths
Gallia 2 * 3 * 5 * 383
Geauga 2 * 0 * 2 * 906
Greene 3 * 2 * 5 * 1,824
Guernsey 1 * 0 * 1 * 462
Hamilton 69 6.2 28 2.5 97 8.8 11,050
Hancock 4 * 1 * 5 * 962
Hardin 1 * 0 * 1 * 376
Harrison 1 * 1 * 2 * 169
Henry 1 * 0 * 1 * 297
Highland 3 * 2 * 5 * 530
Hocking 1 * 2 * 3 * 302
Holmes 2 * 2 * 4 * 766
Huron 4 * 2 * 6 * 741
Jackson 1 * 1 * 2 * 409
Jefferson 4 * 5 * 9 * 681
Knox 1 * 4 * 5 * 709
Lake 4 * 1 * 5 * 2,216
Lawrence 4 * 2 * 6 * 717
Licking 10 * 3 * 13 * 2,086
Logan 1 * 1 * 2 * 531
Lorain 16 * 5 * 21 6.1 3,471
Lucas 40 7.0 13 * 53 9.3 5,707
Madison 5 * 0 * 5 * 430
Mahoning 10 * 5 * 15 * 2,410
Marion 5 * 0 * 5 * 709
Medina 4 * 5 * 9 * 1,883
Meigs 0 * 0 * 0 * 215
Mercer 0 * 3 * 3 * 553
Miami 4 * 0 * 4 * 1,224
Monroe 0 * 1 * 1 * 147
Montgomery 26 3.9 14 * 40 6.1 6,593
2014 COUNTY-LEVEL DATA
5 2014 Ohio Infant Mortality Data: General Findings
CountyNumberNeonatal
Deaths
NeonatalIM Rate
NumberPostneonatal
Deaths
PostneonatalIM Rate
TotalNumber Infant
Deaths
OverallIM Rate
NumberBirths
Morgan 0 * 0 * 0 * 151
Morrow 0 * 0 * 0 * 379
Muskingum 8 * 0 * 8 * 1,041
Noble 0 * 0 * 0 * 139
Ottawa 1 * 0 * 1 * 363
Paulding 1 * 0 * 1 * 220
Perry 1 * 0 * 1 * 431
Pickaway 1 * 1 * 2 * 616
Pike 2 * 1 * 3 * 360
Portage 4 * 0 * 4 * 1,518
Preble 0 * 2 * 2 * 434
Putnam 1 * 2 * 3 * 473
Richland 3 * 5 * 8 * 1,350
Ross 2 * 2 * 4 * 898
Sandusky 3 * 0 * 3 * 628
Scioto 2 * 0 * 2 * 852
Seneca 3 * 1 * 4 * 574
Shelby 1 * 1 * 2 * 621
Stark 29 6.8 6 * 35 8.2 4,253
Summit 32 5.2 12 * 44 7.1 6,194
Trumbull 12 * 5 * 17 * 2,089
Tuscarawas 3 * 1 * 4 * 1,141
Union 2 * 1 * 3 * 637
Van Wert 0 * 2 * 2 * 335
Vinton 1 * 0 * 1 * 138
Warren 5 * 0 * 5 * 2,397
Washington 0 * 1 * 1 * 581
Wayne 6 * 1 * 7 * 1,540
Williams 1 * 0 * 1 * 416
Wood 7 * 1 * 8 * 1,408
Wyandot 1 * 0 * 1 * 254
Unknown 0 * 0 * 0 * 17
2014 COUNTY-LEVEL DATA
6 2014 Ohio Infant Mortality Data: General Findings
OHIO INFANT MORTALITY TREND DATA
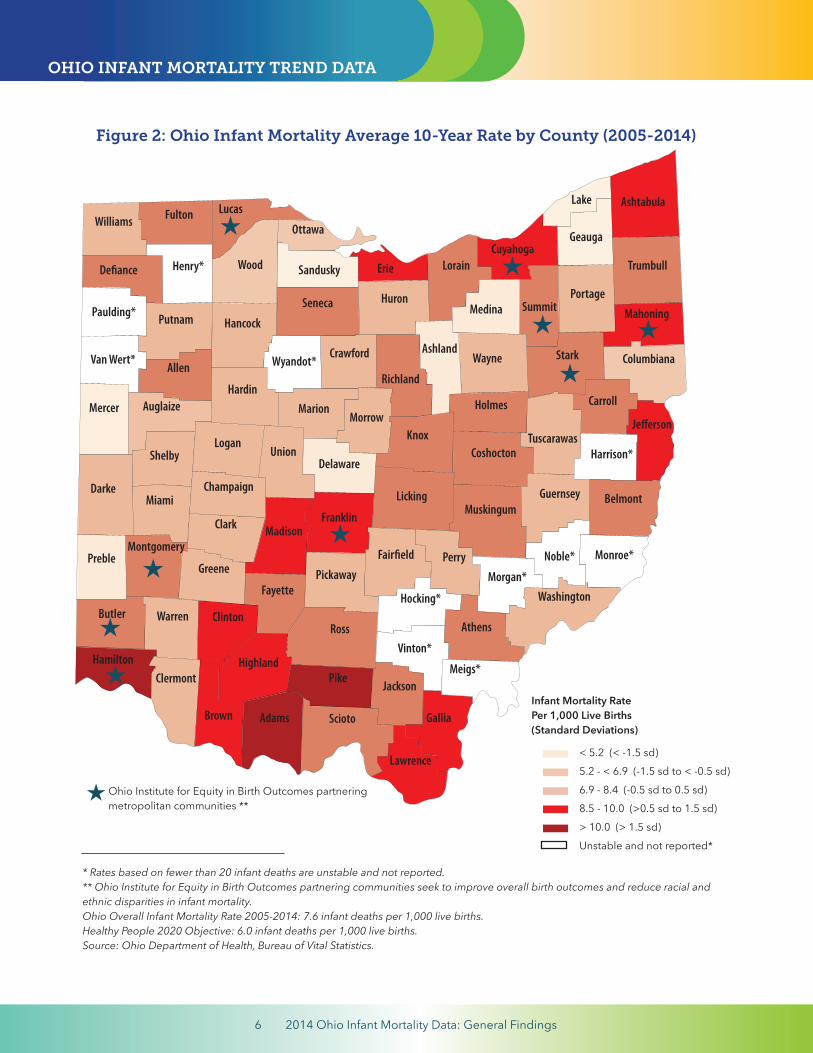
Figure 2: Ohio Infant Mortality Average 10-Year Rate by County (2005-2014)
* Rates based on fewer than 20 infant deaths are unstable and not reported.** Ohio Institute for Equity in Birth Outcomes partnering communities seek to improve overall birth outcomes and reduce racial and ethnic disparities in infant mortality. Ohio Overall Infant Mortality Rate 2005-2014: 7.6 infant deaths per 1,000 live births.Healthy People 2020 Objective: 6.0 infant deaths per 1,000 live births.Source: Ohio Department of Health, Bureau of Vital Statistics.
Ohio Institute for Equity in Birth Outcomes partnering metropolitan communities **
Butler
Darke
Preble
Hamilton
Champaign
Clermont
SciotoBrown Adams
Montgomery
Miami
ClintonWarren
Shelby
Clark
AuglaizeMercer
Logan
Greene
Vinton*
Hocking*
Fairfield
Franklin
Pickaway
Madison
Highland
Ross
JacksonPike
Fayette
Paulding*
Van Wert* Allen
Putnam
UnionDelaware
Marion
Defiance
Morrow
Williams
Wood
Hancock
Hardin
Knox
Licking
PerryMorgan*
Henry*
Washington
Fulton Lucas
Ottawa
Sandusky
Seneca
Wyandot*
Athens
Meigs*
Gallia
Lawrence
Huron
Noble*
Muskingum
Columbiana
Mahoning
Monroe*
Belmont
Harrison*Tuscarawas
Stark
Erie LorainCuyahoga
Geauga
Portage
Ashland
Richland
Holmes
Wayne
Medina
Crawford
Ashtabula
Carroll
Coshocton
Summit
Lake
Trumbull
Guernsey
Jefferson
Infant Mortality RatePer 1,000 Live Births(Standard Deviations)
< 5.2 (< -1.5 sd)5.2 - < 6.9 (-1.5 sd to < -0.5 sd)6.9 - 8.4 (-0.5 sd to 0.5 sd)8.5 - 10.0 (>0.5 sd to 1.5 sd)> 10.0 (> 1.5 sd)Unstable and not reported*
7 2014 Ohio Infant Mortality Data: General Findings
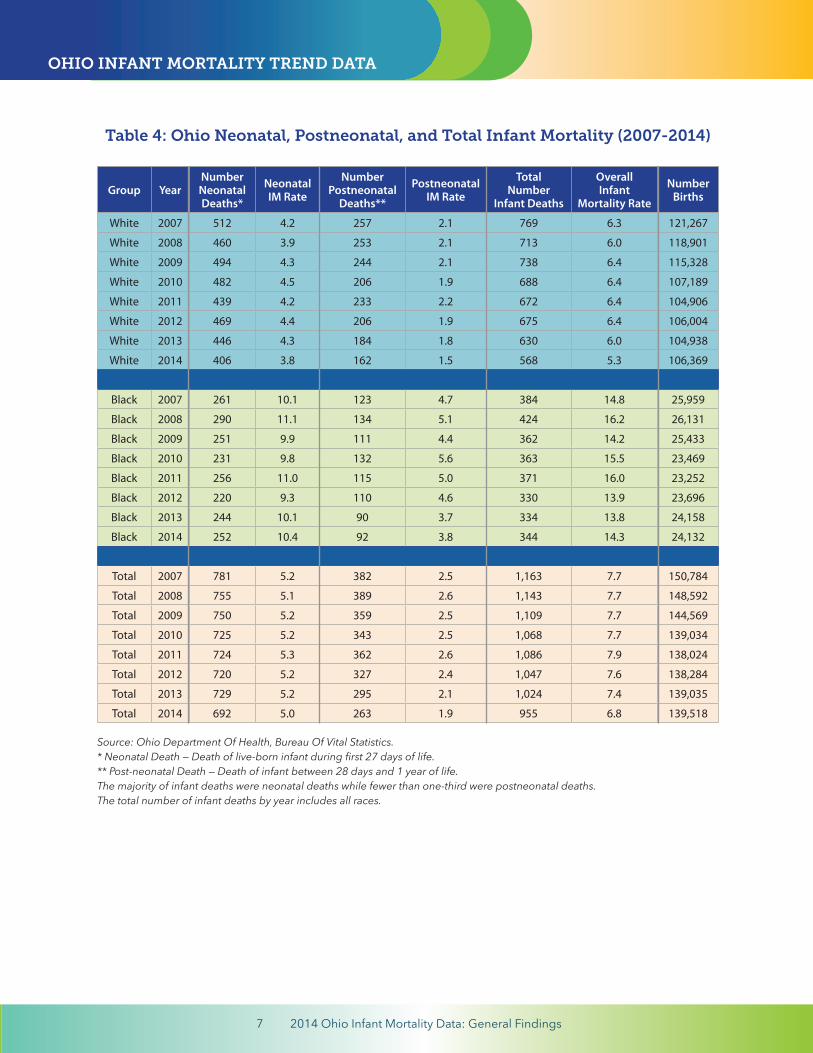
Table 4: Ohio Neonatal, Postneonatal, and Total Infant Mortality (2007-2014)
Group YearNumberNeonatalDeaths*
NeonatalIM Rate
NumberPostneonatal
Deaths**
PostneonatalIM Rate
TotalNumber
Infant Deaths
OverallInfant
Mortality Rate
NumberBirths
White 2007 512 4.2 257 2.1 769 6.3 121,267
White 2008 460 3.9 253 2.1 713 6.0 118,901
White 2009 494 4.3 244 2.1 738 6.4 115,328
White 2010 482 4.5 206 1.9 688 6.4 107,189
White 2011 439 4.2 233 2.2 672 6.4 104,906
White 2012 469 4.4 206 1.9 675 6.4 106,004
White 2013 446 4.3 184 1.8 630 6.0 104,938
White 2014 406 3.8 162 1.5 568 5.3 106,369
Black 2007 261 10.1 123 4.7 384 14.8 25,959
Black 2008 290 11.1 134 5.1 424 16.2 26,131
Black 2009 251 9.9 111 4.4 362 14.2 25,433
Black 2010 231 9.8 132 5.6 363 15.5 23,469
Black 2011 256 11.0 115 5.0 371 16.0 23,252
Black 2012 220 9.3 110 4.6 330 13.9 23,696
Black 2013 244 10.1 90 3.7 334 13.8 24,158
Black 2014 252 10.4 92 3.8 344 14.3 24,132
Total 2007 781 5.2 382 2.5 1,163 7.7 150,784
Total 2008 755 5.1 389 2.6 1,143 7.7 148,592
Total 2009 750 5.2 359 2.5 1,109 7.7 144,569
Total 2010 725 5.2 343 2.5 1,068 7.7 139,034
Total 2011 724 5.3 362 2.6 1,086 7.9 138,024
Total 2012 720 5.2 327 2.4 1,047 7.6 138,284
Total 2013 729 5.2 295 2.1 1,024 7.4 139,035
Total 2014 692 5.0 263 1.9 955 6.8 139,518
Source: Ohio Department Of Health, Bureau Of Vital Statistics.* Neonatal Death — Death of live-born infant during first 27 days of life.** Post-neonatal Death — Death of infant between 28 days and 1 year of life.The majority of infant deaths were neonatal deaths while fewer than one-third were postneonatal deaths.The total number of infant deaths by year includes all races.
OHIO INFANT MORTALITY TREND DATA
8 2014 Ohio Infant Mortality Data: General Findings
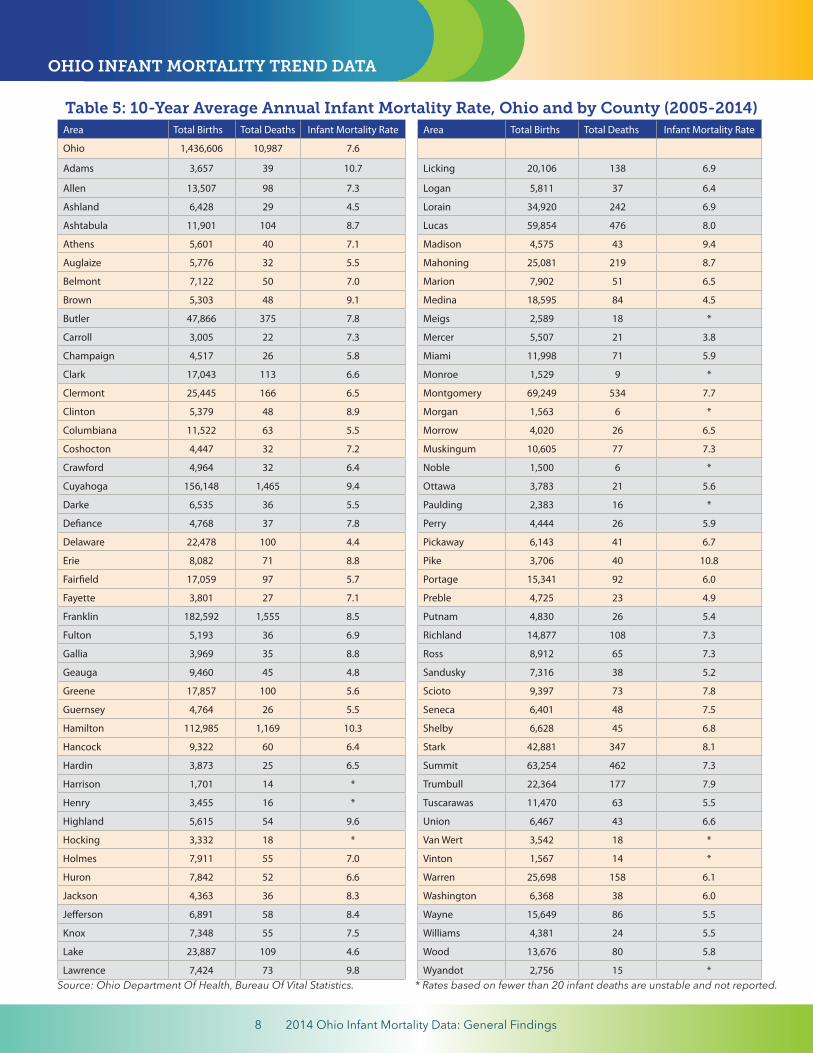
Table 5: 10-Year Average Annual Infant Mortality Rate, Ohio and by County (2005-2014)Area Total Births Total Deaths Infant Mortality Rate Area Total Births Total Deaths Infant Mortality Rate
Ohio 1,436,606 10,987 7.6
Adams 3,657 39 10.7 Licking 20,106 138 6.9
Allen 13,507 98 7.3 Logan 5,811 37 6.4
Ashland 6,428 29 4.5 Lorain 34,920 242 6.9
Ashtabula 11,901 104 8.7 Lucas 59,854 476 8.0
Athens 5,601 40 7.1 Madison 4,575 43 9.4
Auglaize 5,776 32 5.5 Mahoning 25,081 219 8.7
Belmont 7,122 50 7.0 Marion 7,902 51 6.5
Brown 5,303 48 9.1 Medina 18,595 84 4.5
Butler 47,866 375 7.8 Meigs 2,589 18 *
Carroll 3,005 22 7.3 Mercer 5,507 21 3.8
Champaign 4,517 26 5.8 Miami 11,998 71 5.9
Clark 17,043 113 6.6 Monroe 1,529 9 *
Clermont 25,445 166 6.5 Montgomery 69,249 534 7.7
Clinton 5,379 48 8.9 Morgan 1,563 6 *
Columbiana 11,522 63 5.5 Morrow 4,020 26 6.5
Coshocton 4,447 32 7.2 Muskingum 10,605 77 7.3
Crawford 4,964 32 6.4 Noble 1,500 6 *
Cuyahoga 156,148 1,465 9.4 Ottawa 3,783 21 5.6
Darke 6,535 36 5.5 Paulding 2,383 16 *
Defiance 4,768 37 7.8 Perry 4,444 26 5.9
Delaware 22,478 100 4.4 Pickaway 6,143 41 6.7
Erie 8,082 71 8.8 Pike 3,706 40 10.8
Fairfield 17,059 97 5.7 Portage 15,341 92 6.0
Fayette 3,801 27 7.1 Preble 4,725 23 4.9
Franklin 182,592 1,555 8.5 Putnam 4,830 26 5.4
Fulton 5,193 36 6.9 Richland 14,877 108 7.3
Gallia 3,969 35 8.8 Ross 8,912 65 7.3
Geauga 9,460 45 4.8 Sandusky 7,316 38 5.2
Greene 17,857 100 5.6 Scioto 9,397 73 7.8
Guernsey 4,764 26 5.5 Seneca 6,401 48 7.5
Hamilton 112,985 1,169 10.3 Shelby 6,628 45 6.8
Hancock 9,322 60 6.4 Stark 42,881 347 8.1
Hardin 3,873 25 6.5 Summit 63,254 462 7.3
Harrison 1,701 14 * Trumbull 22,364 177 7.9
Henry 3,455 16 * Tuscarawas 11,470 63 5.5
Highland 5,615 54 9.6 Union 6,467 43 6.6
Hocking 3,332 18 * Van Wert 3,542 18 *
Holmes 7,911 55 7.0 Vinton 1,567 14 *
Huron 7,842 52 6.6 Warren 25,698 158 6.1
Jackson 4,363 36 8.3 Washington 6,368 38 6.0
Jefferson 6,891 58 8.4 Wayne 15,649 86 5.5
Knox 7,348 55 7.5 Williams 4,381 24 5.5
Lake 23,887 109 4.6 Wood 13,676 80 5.8
Lawrence 7,424 73 9.8 Wyandot 2,756 15 *Source: Ohio Department Of Health, Bureau Of Vital Statistics. * Rates based on fewer than 20 infant deaths are unstable and not reported.
OHIO INFANT MORTALITY TREND DATA
9 2014 Ohio Infant Mortality Data: General Findings
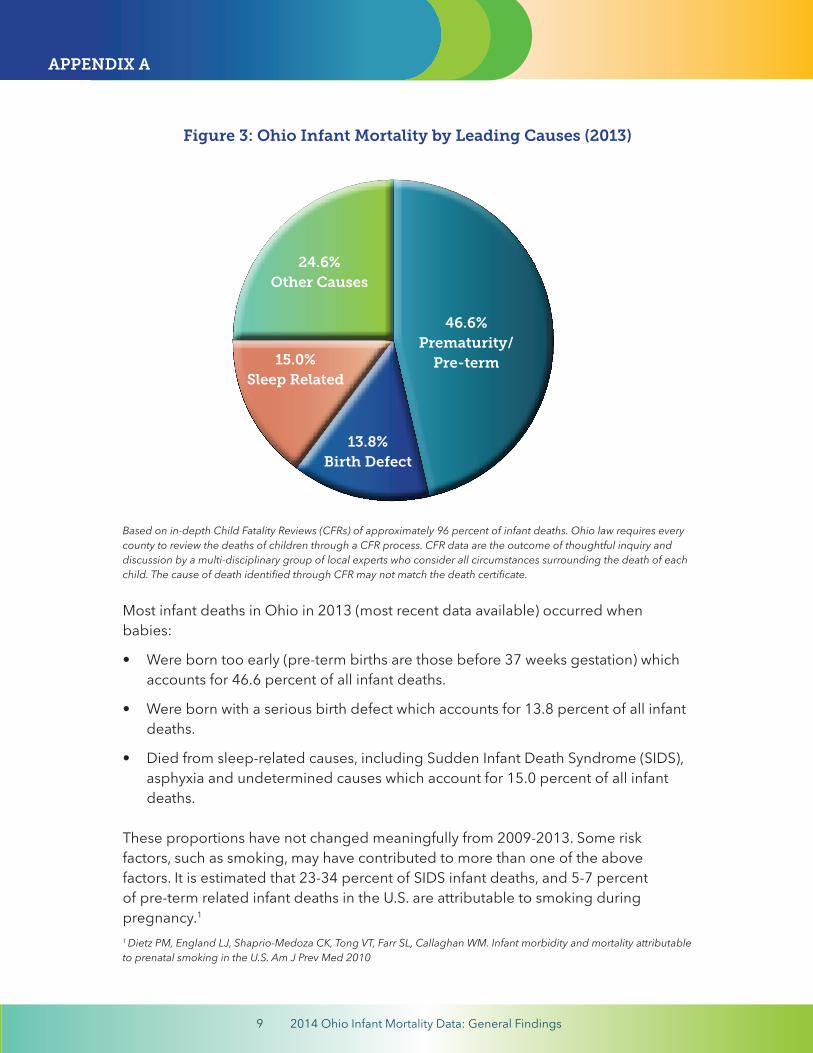
Based on in-depth Child Fatality Reviews (CFRs) of approximately 96 percent of infant deaths. Ohio law requires every county to review the deaths of children through a CFR process. CFR data are the outcome of thoughtful inquiry and discussion by a multi-disciplinary group of local experts who consider all circumstances surrounding the death of each child. The cause of death identified through CFR may not match the death certificate.
Most infant deaths in Ohio in 2013 (most recent data available) occurred when babies: • Were born too early (pre-term births are those before 37 weeks gestation) which
accounts for 46.6 percent of all infant deaths.
• Were born with a serious birth defect which accounts for 13.8 percent of all infantdeaths.
• Died from sleep-related causes, including Sudden Infant Death Syndrome (SIDS),asphyxia and undetermined causes which account for 15.0 percent of all infantdeaths.
These proportions have not changed meaningfully from 2009-2013. Some risk factors, such as smoking, may have contributed to more than one of the above factors. It is estimated that 23-34 percent of SIDS infant deaths, and 5-7 percent of pre-term related infant deaths in the U.S. are attributable to smoking during pregnancy.1
1 Dietz PM, England LJ, Shaprio-Medoza CK, Tong VT, Farr SL, Callaghan WM. Infant morbidity and mortality attributable to prenatal smoking in the U.S. Am J Prev Med 2010
Figure 3: Ohio Infant Mortality by Leading Causes (2013)
46.6%Prematurity/
Pre-term
13.8%Birth Defect
15.0%Sleep Related
24.6%Other Causes
APPENDIX A
10 2014 Ohio Infant Mortality Data: General Findings
In March 2011, Governor John R. Kasich addressed infant mortality in Ohio in his first State of the State Address, making reducing low birth-weight babies a priority. In follow up, the Governor’s Office of Health Transformation, working with Ohio Departments of Medicaid, Health, Mental Health & Addiction Services, and other human services agencies initiated a comprehensive package of reforms to save babies’ lives by:
• Improving overall health system performance.
• Focusing resources where the need is greatest, suchas in high-risk communities and populations.
• Preventing premature births, including reducingmedically unnecessary scheduled deliveries prior to 39 weeks gestation.
• Focusing evidence-based strategies to reduce maternal smoking.
• Preventing sleep-related deaths, including by promoting infant safe sleep practices.
In December 2014, Governor Kasich spoke at the 2014 Ohio Infant Mortality Summit and said that the current infant mortality rate is “clearly unacceptable.” He announced that the Ohio Departments of Medicaid and Health would work together to surge resources into the neighborhoods with the highest incidence of pre-term birth and low birth-weight babies. His proposed executive budget and the final state budget approved by the Ohio General Assembly for the 2016-17 biennium contained initiatives to help reduce infant mortality through:
• Enhanced care management for women in high-risk neighborhoods.
• Engaging leaders in high-risk neighborhoods to connect women to healthcare services.
• Expanding evidence-based strategies to reduce maternal smoking.
• Expanding access to peer support programs for expecting mothers through “CenteringPregnancy” model of care.
• Expanding state’s capacity to analyze and respond to infant mortality data.
For more information about all of these initiatives, read the Governor’s Office of Health Transformation white paper titled “Reduce Infant Mortality” here or on its website at healthtransformation.ohio.gov. The following is an abbreviated chronology highlighting select initiatives to address infant mortality in Ohio over the past five-plus years.
APPENDIX B: ADDRESSING INFANT MORTALITY IN OHIO
Commitmentto Prevent Infant
Mortality
’s
11 2014 Ohio Infant Mortality Data: General Findings
2009: ODH convenes an Infant Mortality Task Force which recommends the establishment of a statewide collaborative to reduce infant mortality in Ohio. In response, ODH and its partners launch the Ohio Collaborative to Prevent Infant Mortality.
2010: Ohio establishes the Pregnancy Associated Mortality Review (PAMR) system to ensure that all maternal deaths are identified and preventive actions are developed. This includes the death of a woman from any cause while she is pregnant or within one year of pregnancy.
2011: Governor Kasich addresses infant mortality in Ohio in his first State of the State Address and makes reducing low birth-weight babies a priority.
2011: The Governor’s Office of Health Transformation, working with Ohio Departments of Medicaid, Health, Mental Health & Addiction Services, and other human services agencies initiate a comprehensive package of reforms to improve overall health system performance for pregnant women and infants.
2012: ODH, as a member of the Ohio Collaborative to Prevent Infant Mortality, publicly releases for the first time Ohio’s infant mortality data with the goal of raising public awareness.
2012: ODH and the Ohio Collaborative to Prevent Infant Mortality host the first biannual statewide Infant Mortality Summit with more than 900 attendees who are encouraged to host Summits in their own communities to initiate local conversations about how to reduce infant mortality.
2013: ODH hires a coordinator for the statewide Fetal Infant Mortality Review (FIMR) initiative. FIMR is a multi-disciplinary, multi-agency, community-based process that identifies local infant mortality issues through the review of fetal and infant deaths and develops recommendations and initiatives to reduce them.
Making Infant Mortality a Statewide Priority and Raising Awareness
12 2014 Ohio Infant Mortality Data: General Findings
2014: ODH and the Ohio Collaborative to Prevent Infant Mortality host the second biannual statewide Infant Mortality Summit with more than 1,700 attendees. Governor Kasich tells audience that Ohio’s Infant Mortality Rate is “simply unacceptable” and announces new initiatives to focus support and resources to mothers and babies most at-risk.
2014: Ohio launches “Text4Baby”, an initiative of ODH and the National Healthy Mothers, Healthy Babies Coalition to customize text messages to expectant mothers in Ohio. An educational service, Text4Baby provides women with health information for them and their baby during pregnancy and through the baby’s first year.
2014: Governor Kasich signs into law House Bill 394 which creates a Commission on Infant Mortality.
2015: ODH launches a public education campaign to raise awareness about infant mortality in the nine high-risk metropolitan communities targeted by the Ohio Institute for Equity in Birth Outcomes.
2015: The Ohio Collaborative to Reduce Infant Mortality releases a 2015-2020 infant mortality reduction plan, addressing issues such as preventing premature births; preventing birth defects; reducing maternal smoking before, during and after pregnancy; improving health equity, addressing social determinants of health and eliminating racism; promoting optimal women’s health before, during and after pregnancy, promoting infant health; and promoting fatherhood involvement in maternal and child health.
13 2014 Ohio Infant Mortality Data: General Findings
Initiatives to Address Black Infant Mortality
2011-15: The ODH Ohio Infant Mortality Reduction Initiative (OIMRI) home visiting program continues to address barriers (e.g., financial, geographic, cultural, infrastructural) that African-American women and children experience, and improves their access to and utilization of healthcare and social services. OIMRI programs provide community-based outreach and care coordination services in targeted communities with high-risk, low-income, African-American pregnant women and their infants.
2013: ODH partners with CityMatCH, a national organization that supports urban maternal and child health initiatives at the local level, to launch the Ohio Institute for Equity in Birth Outcomes. The partnership includes nine Ohio metropolitan communities to improve overall birth outcomes and reduce disparities in infant mortality. These metropolitan communities include Butler County, Canton-Stark County, Cincinnati, Columbus, Cleveland-Cuyahoga County, Youngstown-Mahoning County, Dayton-Montgomery County, Summit County, Toledo-Lucas County.
2014: Eight Ohio Institute for Equity in Birth Outcomes teams are trained to conduct Fetal Infant Mortality Reviews, a multi-disciplinary, multi-agency, community-based process that identifies local infant mortality issues through the review of fetal and infant deaths and develops recommendations and initiatives to reduce them.
2014: Ohio Institute for Equity in Birth Outcomes teams review local data with their communities and use it to select evidence-based interventions to address highest risk populations in targeted areas.
2015: The Ohio Commission on Minority Health releases a white paper, Achieving Equity and Eliminating Infant Mortality Disparities within Racial and Ethnic Populations: From Data to Action.
2015: Ohio Institute for Equity in Birth Outcomes teams launch evidence-based interventions to address highest risk populations in targeted areas, and collect data for evaluation. Interventions include Centering Pregnancy programs, family planning initiatives, promoting reproductive life plans, safe sleep initiatives, progesterone initiatives, and a smoking cessation initiative.
APPENDIX B: ADDRESSING INFANT MORTALITY IN OHIO
14 2014 Ohio Infant Mortality Data: General Findings
2015: ODH partners with The Paul J. Aicher Foundation and its Everyday Democracy Program to support the Ohio Institute for Equity in Birth Outcomes and its nine urban teams. Everyday Democracy assists in enhancing community engagement that raises awareness about the connections between social determinants of health and infant mortality; increases public knowledge and awareness around populations most impacted by high infant mortality; and engages conversations about racism and its effects on infant mortality rates. Everyday Democracy has 25 years of experience in partnering with diverse community coalitions to help create and sustain broad based community engagement on a range of public issues, and in helping communities incorporate an understanding of racial equity throughout their engagement efforts.
APPENDIX B: ADDRESSING INFANT MORTALITY IN OHIO
15 2014 Ohio Infant Mortality Data: General Findings
APPENDIX B: ADDRESSING INFANT MORTALITY IN OHIO
Reducing the Incidence of Prematurity/Pre-Term Birth 2013: Prematurity/pre-term birth is the leading cause of newborn illness and mortality. A hormone supplement of progesterone in the second and third trimesters of pregnancy for women with specific risk factors can reduce the incidence of pre-term birth. The 2014-15 state budget includes funding to develop protocols for incorporating progesterone treatment into clinical practice.
2013: The Progesterone Quality Improvement Project launches to improve birth outcomes for Medicaid recipients by encouraging wider use of progesterone treatment. This project increases funding so that prenatal care providers can better identify, screen and track outcomes for women who can benefit from progesterone treatment.
2013: Smoking during pregnancy remains one of the most common preventable risk factors for infant mortality. It increases the risk of miscarriage, premature birth, low birth weight and stillbirth. The 2014-15 state budget includes funding to expand women’s access to providers with tools and training to assist them to quit smoking.
2013: The Ohio Perinatal Quality Collaborative launches an initiative to ensure that all pregnant women at risk of delivering a baby between 24 and 34 weeks gestation receive antenatal corticosteroids, an evidence-based therapy shown to reduce mortality and morbidity among pre-term infants. This therapy is designed to promote lung development in newborn infants, and thus reduce the incidence of respiratory distress, a common reason for infant stays in neonatal intensive care.
2013: The Ohio Perinatal Quality Collaborative launches an initiative to increase early feeding of mother’s milk to newborns since its protective properties are linked to a reduced risk of some infections and illnesses in newborns.
2013: In response to rising prescription drug abuse, including by pregnant women, the state launches the Maternal Opiate Medical Support Project (MOMS) to link such pregnant women with treatment which is associated with improved neurocognitive outcomes in infants of opiate-addicted mothers.

16 2014 Ohio Infant Mortality Data: General Findings
2013: As prescription drug abuse by pregnant women rises in Ohio, so does the number of babies born addicted to narcotics — known as Neonatal Narcotic Abstinence Syndromes (NAS). NAS produces jitteriness, fever, diarrhea, and poor feeding and if not treated may lead to seizures and even death. Ohio’s six children’s hospitals work together supported by a state grant to study NAS and best treatment strategies.
2014: Ohio’s birth certificate begins tracking important indicators of evidence-based care including provision of progesterone therapy and breastmilk feeding during the hospital stay.
2015: ODH and the Ohio Hospital Association launch “Ohio First Steps for Healthy Babies” to encourage hospitals to promote and support breastfeeding by new mothers. ODH is training obstetrical healthcare staff in Ohio’s birthing hospitals in one of the evidence-based steps to support breastfeeding.
17 2014 Ohio Infant Mortality Data: General Findings
APPENDIX B: ADDRESSING INFANT MORTALITY IN OHIO
Increasing Public Awareness About Safe Sleep Practices
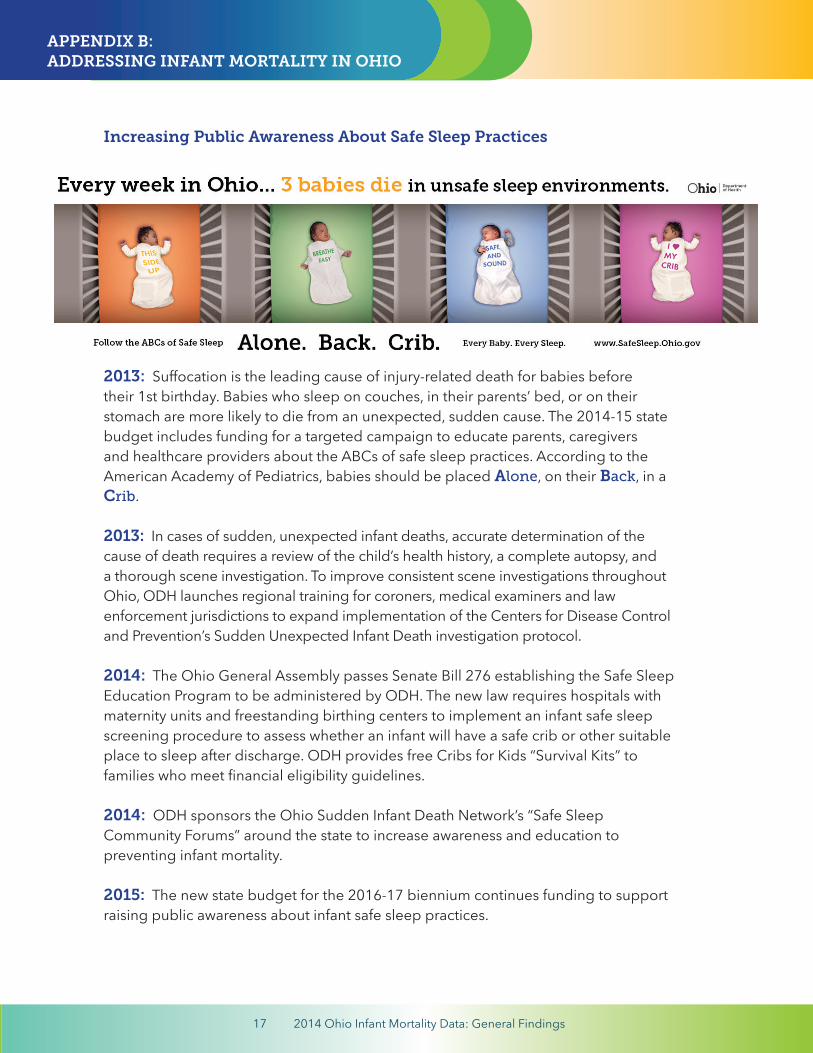
2013: Suffocation is the leading cause of injury-related death for babies before their 1st birthday. Babies who sleep on couches, in their parents’ bed, or on their stomach are more likely to die from an unexpected, sudden cause. The 2014-15 state budget includes funding for a targeted campaign to educate parents, caregivers and healthcare providers about the ABCs of safe sleep practices. According to the American Academy of Pediatrics, babies should be placed Alone, on their Back, in a Crib.
2013: In cases of sudden, unexpected infant deaths, accurate determination of the cause of death requires a review of the child’s health history, a complete autopsy, and a thorough scene investigation. To improve consistent scene investigations throughout Ohio, ODH launches regional training for coroners, medical examiners and law enforcement jurisdictions to expand implementation of the Centers for Disease Control and Prevention’s Sudden Unexpected Infant Death investigation protocol.
2014: The Ohio General Assembly passes Senate Bill 276 establishing the Safe Sleep Education Program to be administered by ODH. The new law requires hospitals with maternity units and freestanding birthing centers to implement an infant safe sleep screening procedure to assess whether an infant will have a safe crib or other suitable place to sleep after discharge. ODH provides free Cribs for Kids “Survival Kits” to families who meet financial eligibility guidelines.
2014: ODH sponsors the Ohio Sudden Infant Death Network’s “Safe Sleep Community Forums” around the state to increase awareness and education to preventing infant mortality.
2015: The new state budget for the 2016-17 biennium continues funding to support raising public awareness about infant safe sleep practices.
18 2014 Ohio Infant Mortality Data: General Findings
APPENDIX B: ADDRESSING INFANT MORTALITY IN OHIO
Prevention and Early Identification of Birth Defects
2013: Folic acid is crucial to prevent neural tube defects, which occur in 1 per 1,000 pregnancies. In addition, women who take folic acid supplements before and during early pregnancy are about 40 percent less likely to have a baby later diagnosed with autism. Ohio Connections for Children with Special Needs birth defects surveillance system staff collaborate with Michigan and Minnesota to develop two online trainings for health professionals – “Folic Acid in the Prevention of Neural Tube Defects and How to have a Healthy Pregnancy: Focus on 5.”
2013: Critical Congenital Heart Disease (CCHD), a group of heart defects requiring surgery or other clinical interventions, accounts for five percent of all infant deaths in Ohio. While the majority of Ohio maternity hospitals already screen newborns for this disease, Governor Kasich signs Senate Bill 4 into law requiring hospitals and freestanding birthing centers to screen all newborns for CCHD for early diagnosis and treatment.
2013: ODH launches an initiative to work with healthcare providers to increase postpartum screening rates for women with a history of gestational diabetes.Women who enter pregnancy with undiagnosed and uncontrolled diabetes are at greater risk of fetal death or having a child with a birth defect.
2014: In accordance with Senate Bill 4, ODH promulgates administrative rules for the equipment, methodology and reporting of results for newborn screening for Critical Congenital Heart Disease (CCHD). On October 1, all hospitals begin screening and reporting.
2015: ODH launches a redeveloped birth defects information system, a web-based application used by hospitals to report cases of birth defects in Ohio. The new system links to the ODH Bureau of Vital Statistics electronic birth records and sends potential referrals for children to the Help Me Grow program in their county. Data will be used to target prevention strategies to reduce birth defects and infant mortality.
19 2014 Ohio Infant Mortality Data: General Findings
APPENDIX B: ADDRESSING INFANT MORTALITY IN OHIO
Improving Overall Health System Performance
2012: About half of all pregnancies in Ohio are unintended, with higher rates among women at risk of having a poor birth outcome, such as lower income women, African-American women and teens. Ohio Medicaid adopts a Medicaid Family Planning State Plan Amendment to expand eligibility for family planning services for women and men up to 200 percent of the federal poverty level.
2013: The 2012-13 state budget provides temporary Medicaid coverage enabling pregnant women to receive medical care while their Medicaid application is processed, accelerating quicker access to care for better birth outcomes.
2013: Ohio Medicaid negotiates new contracts with Medicaid managed care plans to include enhanced maternal care and inter-conception care requirements for women at highest risk for poor pregnancy outcomes.
2013: Ohio Medicaid managed care plans and hospital neonatal intensive care units (NICUs) forge partnerships focusing on transitioning infants from NICUs to the home setting, including opportunities for the managed care plans to bridge gaps in care during the transition.
2013: Ohio Medicaid promotes better birth outcomes and encourages appropriate postpartum visits as well as family planning services by holding managed care plans accountable for minimum performance standards on related measures.
2014: Medicaid benefits are extended to additional women of reproductive age to increase access and improve birth outcomes.
2014: Ohio’s Pregnancy Associated Mortality Review Program becomes one of six programs nationally to participate in the Every Mother Initiative (EMI), an Action Learning Collaborative funded by Merck for Mothers and operated by the Association of Maternal and Child Health Programs. EMI helps Ohio strengthen its maternal mortality surveillance system and provides funding for translational (data-to-action) projects.
20 2014 Ohio Infant Mortality Data: General Findings
2015: ODH selects four community health centers across the state to pilot anevidence-based healthcare delivery model for pregnant women called “CenteringPregnancy” which integrates maternal care, education and support to improve birthand infant health outcomes in high-risk communities in Ohio.
2015: ODH contracts with the Clinical Skills Education and Assessment Center at The Ohio State University Wexner Medical Center to provide obstetric emergency simulation training for birthing center labor and delivery, and postpartum unit staff. The training focuses on three clinical simulations — postpartum hemorrhage, cardiomyopathy, and preeclampsia — developed based on Pregnancy Associated Mortality Review Program cases.