Embed Size (px)
Citation preview
ECOLOGICAL CONTEXT OF INFANT MORTALITY IN HIGH FOCUS STATES
OF INDIA
Author’s Details:
1) Laishram Ladusingh1 (Corresponding Author)
Professor and Head, Department of Mathematical Demography & Statistics,
IIPS, Mumbai (India).
E-mail: [email protected]
Mobile No- (+91) 022-42372411
ORCID ID : orcid.org/0000-0003-2720-2203
2) Ashish Kumar Gupta (Corresponding Author)
Program Officer
Population Council
Zone 5A,Ground Floor,
India Habitat Centre,Lodi Road
New Delhi- 110003, India.
Email: [email protected]
Mobile: +91-7045030608
Mobile No- (+91) 9967106908
ORCID ID : orcid.org/0000-0001-9697-2784
3) Awdhesh Yadav
Research Fellow
Public Health Foundation of India (PHFI)
Gurgaon, Haryana, India
Email id- [email protected]
Mobile No- (+91) 9987138470
ORCID ID: orcid.org/0000-0002-4306-2629
1 The authors had no source of funding to carry out this research

Ecological Context of Infant Mortality
1
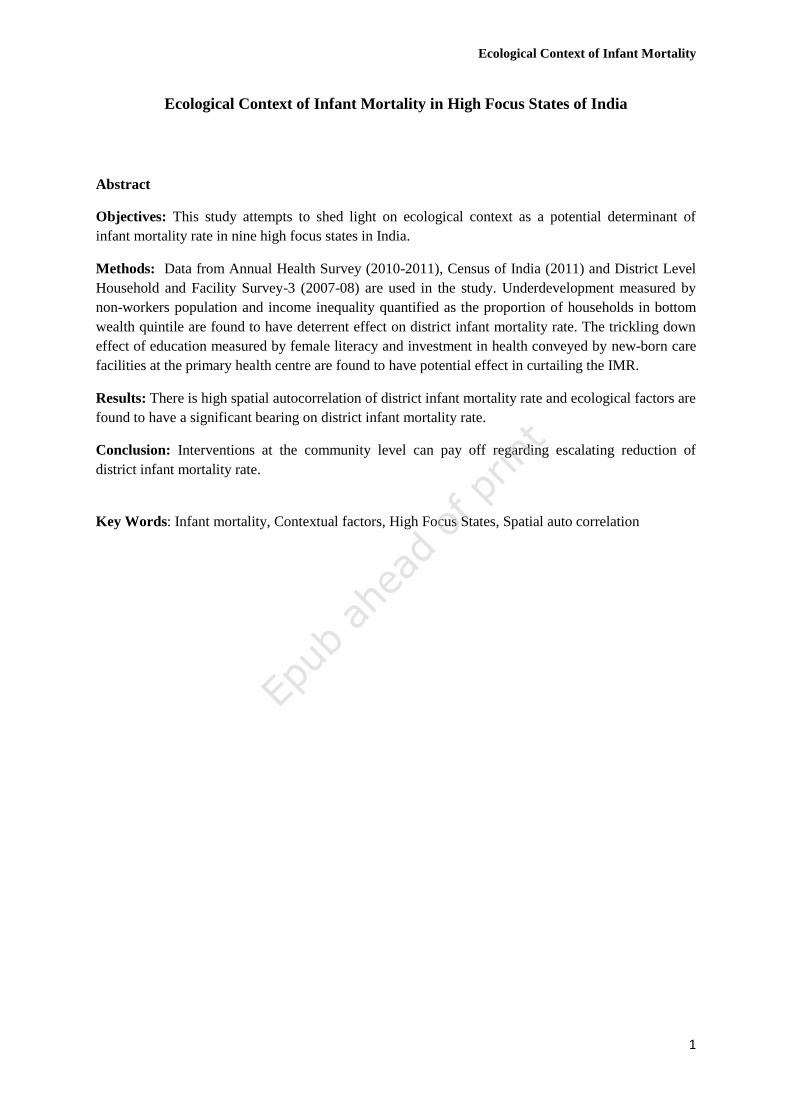
Ecological Context of Infant Mortality in High Focus States of India
Abstract
Objectives: This study attempts to shed light on ecological context as a potential determinant of
infant mortality rate in nine high focus states in India.
Methods: Data from Annual Health Survey (2010-2011), Census of India (2011) and District Level
Household and Facility Survey-3 (2007-08) are used in the study. Underdevelopment measured by
non-workers population and income inequality quantified as the proportion of households in bottom
wealth quintile are found to have deterrent effect on district infant mortality rate. The trickling down
effect of education measured by female literacy and investment in health conveyed by new-born care
facilities at the primary health centre are found to have potential effect in curtailing the IMR.
Results: There is high spatial autocorrelation of district infant mortality rate and ecological factors are
found to have a significant bearing on district infant mortality rate.
Conclusion: Interventions at the community level can pay off regarding escalating reduction of
district infant mortality rate.
Key Words: Infant mortality, Contextual factors, High Focus States, Spatial auto correlation
Ecological Context of Infant Mortality
2
1. Introduction
India has missed the MDG-4(Millennium Development Goal-IV) target of reducing infant
mortality rate (IMR) to 28 per 1000 live births by the end of 2015 [1] because of the
unevenness across the states in the progress in reducing infant mortality. IMR is still
alarmingly above the national average in the high focus states of Uttar Pradesh, Uttarakhand,
Bihar, Jharkhand, Chhattisgarh, Odisha, Madhya Pradesh, Rajasthan and Assam. The 284
districts in these States accounts for 48.5 percent of India’s population [2]. According to SRS
(2013) [1] Madhya Pradesh (MP), Assam (AS), Uttar Pradesh (UP) and Odisha (OD) have
IMR above 50 the highest in the country. The number of districts in these states which have
IMR above the respective state averages is 28 out of 45 in MP, 9 out of 23 in Assam, 34 out
of 70 in UP and 12 out of 30 in Odisha, besides in few districts IMR is above100.It has drawn
the attention of policy makers and researchers equally and has led to the launching of the
ambitious National Rural Health Mission (NRHM) in 2005. But the demographic nightmare
is that even after ten years of NRHM the pace of decline in IMR in the aforesaid high focus
states is staggering. At the same time, it also raises questions such as: Whether proximate
determinants are enough to explain the regional disparity in IMR? Whether regional
ecological context would be more appropriate for programmatic intervention? Whether
intensification of accessibility to new-born care can further pay-off? The objective of this
paper is to address some of these questions re-investigating determinants of IMR in the high
focus states of India.
Literature indicates the importance of socio-economic status such as poor living condition [3],
maternal factors including age, birth interval, and the experience of child death, birth order
and nutrition [4-6]. Epidemiologists have acknowledged place as an important determinant of
health outcome disparities [7-10], while some have highlighted the importance of geographic
factors and underdevelopment in explaining IMR in Indian context [11]. Kumar et al. [12]
Ecological Context of Infant Mortality
3
have shown the importance of health programme initiatives in curtailing under five mortality
in the aforesaid states. However none of them considered ecological context in determining
IMR and is the missing link in public health.
This paper seeks to fill this research gap considering ecological context as a potential
determinant of IMR and it makes sense as a public health interventions target community, not
to individuals. This approach is inconsistent with the recent trend in public health field
concerned with improving health conditions and life expectancy of regions with excessively
high rates of mortality [13 14].Keeping in view that public health intervention has to target
few main direct and indirect ecological factors determining infant mortality at the aggregate
level, accessibility to new-born care facilities is considered in the analysis. Findings of
Kumar et al. [12] have also emphasised the close association between accessibility to the
health system and infant survival, as elsewhere by Farmer et al. [15] and Politzer et al [16].
Keeping this in view an attempt is made to capture accessibility to new-born care facility by
the community the proportion of Public Health Centres (PHC) in the district with new-born
care facilities integrated into the analysis. In the assessment of ecological or macro-level
determinants of infant mortality at the aggregate level it has been many scholars have hinted
that underdevelopment has the deterrent effect on health and other social outcomes [17
18].Testing Wilkinson’s relative income hypothesis [19], Kawachi and Kennedy [20] have
argued that the greater the income gap between the rich and poor; the poorer is the health
outcome. Following their findings, the proportion of households in the bottom wealth quintile
at the district level is considered to reflect material inequality in place of district level income
of households. The literacy level of the female has trickling down effect on saving new-born
because of its catalytic influence on healthcare utilization and female literacy rate at the
district level is included in the analysis. A further proportion of non-workers at the district
level included as a control for underdevelopment. The objective of the paper is alerting public
Ecological Context of Infant Mortality
4
health and policy planners the importance of ecological determinants of IMR at the district
level. Such an objective cannot be served by analysing maternal factors.
2 Data, Methods and procedure
2.1 Data
This study uses data from three main sources of demographic and health indicators at the
district level, namely, District Level Household and Facility Surveys (DLHS; 2007-08) [21],
Annual Health Survey (AHS; 2010-2011) [22] and Census of India (2011) [2]. AHS is the
only survey specifically designed to provide mortality and fertility indicators at the district
level for the nine high focus states. AHS was conducted during 2010-11 and details of survey
design and instruments used in AHS are available in RGI (2012). DLHS-3 (IIPS 2012)
covered all districts in India as of 2007 and collects data on maternal and child health and
provisions of public health facility at the district level. The district level health facility
information used in the study is from DLHS-3. AHS adopted similar method and instruments
of data collection. Census of India (2011) provides data on population, working and non-
working population by age, sex, place of residence at the district level [2].
2.3 Outcome measures
Outcome variable considered for this study is the district level infant mortality rate (IMR)
which is the number of infant deaths in a year per 1000 live births born in the same year. The
source of IMR for 284 districts of the nine high focus states is the AHS conducted during
2010-11 [22].
2.4 Explanatory variables
The importance of income and wealth in explaining health outcome particularly, infant
mortality is acknowledged in the seminal work of Preston [23], Filmer and Pritchett [24].To
validate this proposition, the proportion of households in the districts in the lowest wealth
Ecological Context of Infant Mortality
5
quintile is considered as a potential explanatory variable, and it is available in the report of
AHS [22]. Wealth quintile is based on possession of assets and durables in the households.
Identification of districts with large concentration of households in the lowest wealth quintile
shall facilitate intensive mass media and awareness camp for best practices under the
prevailing conditions. The proportion of unemployed among 15-59 years population in the
districts is considered to assess the effect of the intervention such as Mahatma Gandhi
National Rural Employment Guarantee Act (MGNAREGA) [25]. It is estimated using data
Census of India [2]. Poverty no doubt has a detrimental effect on child survival particularly
the first year of life. The lower is the incidence of poverty the better is the supporting
capacity. Thus, the significance of proportion unemployed among 15-59 years shall provide
empirical evidence of the benefit of employment generation policies in reducing IMR. The
benefit of community educational attainment, particularly among females, is the changes
brought about in household behaviour and practice in maternal and child health care [10].
Ladusingh and Singh [10] in the context of northeast India have highlighted the effectiveness
of educational attainment of household heads in averting infant mortality. On the similar line,
female literacy rate at the district level is one of the explanatory variables included in this
study. The demand for healthcare of children is equally important as the supply side, and the
level of community education plays an important role in enhancing the uptake of child
immunization and adopt best healthcare practices. Strengthening adult literacy through the
centrally sponsored scheme Saakshar Bharat Programme (BSP) can be a cost-effective
intervention for saving infant deaths in the under-developed high focus states. Few study
considered health facility adequacy as the potential determinant of infant mortality [12]. In
this analysis accessibility to community health facility is treated as an important mediating
factor for maternal and child health utilization. Considering the importance of accessibility to
new-born care in saving the infant from premature death in health facilities the proportion of
Ecological Context of Infant Mortality
6
Public Health Centres (PHC) in the districts providing new-born care is considered as an
explanatory factor. Upgrading PHC as per Indian Public Health Standard (IPHS) is underway
to meet the healthcare needs of the people.
The aforesaid explanatory variables to a large extend are also the factors responsible for the
spatial autocorrelation of incidence of infant mortality in the nine high focus states in India as
these states share common features regarding healthcare beliefs and practices and
accessibility to health facilities, unemployment situations, and literacy levels.
1.5 Statistical Analysis
Descriptive statistics and diagrammatic representation are used to describe outcome and
explanatory variables. For assessment of the significant relationship between district level
IMR and ecological covariates the multiple linear regression analysis is adopted.
The nine high focus states considered in this paper have similar socio-demographic and
healthcare utilization and are contiguous. Moran’s spatial autocorrelation denoted by I is
used to assess the similarity in the incidence of infant mortality in neighbouring states. The
elements wij of W the weight matrix denotes binary connectivity and its value is 1 if the
district j is adjacent to district i and 0, otherwise. Moran’s I statistic is computed as
2
0
( )( )
( )
ij i j
i j
i
i
w x x x xn
IS x x
,
where x is the mean of the x variable, ijw are the elements of the weight matrix, and 0S is
the sum of the elements of the weight matrix: 0 ij
i j
S w .
The value of I varies from -1 to +1. The Positive values of Moran’s I statistics suggest spatial
clustering of similar values. Negative values suggest that the high values found in vicinity of
low values. It is very helpful in identifying areas where values of the variable are both
Ecological Context of Infant Mortality
7
extreme and geographically homogeneous. A zero values indicate a random spatial pattern
[27].
The Moran scatter plot provides a tool for measure the extent of the autocorrelation among
the neighbourhood sections of the society. Anselin et al. [26] describes this as spatial lag of
the variable on the vertical axis and the original variable on the horizontal axis. Spatial lag
refers to the values of locations neighbours.
2. Results
Descriptive statistics of infant mortality rate (IMR), percent of non-workers among 15-59
years, female literacy rate, percent of households in bottom wealth quintile and percent of
PHC having new-born care facility for all the nine high focus states combined are shown in
Table 1. The high coefficient of variation of 23.1 percent reflects high inter and intra states
variation in IMR. These high focus states have disadvantage in terms of access to livelihood
with 60.5 percent of population in the prime age group 15-59 years are not working, enabling
factor, that is, female literacy only 61.9 percent, widespread poverty with 21.3 percent of
households in the bottom wealth quintile and 77.6 percent of the PHC have new-born care
provision. It is evident that to reduce IMR in the nine high focus states should aim to increase
livelihood, enhance female literacy and increase accessibility to new-born care.
[Table 1 is about here]
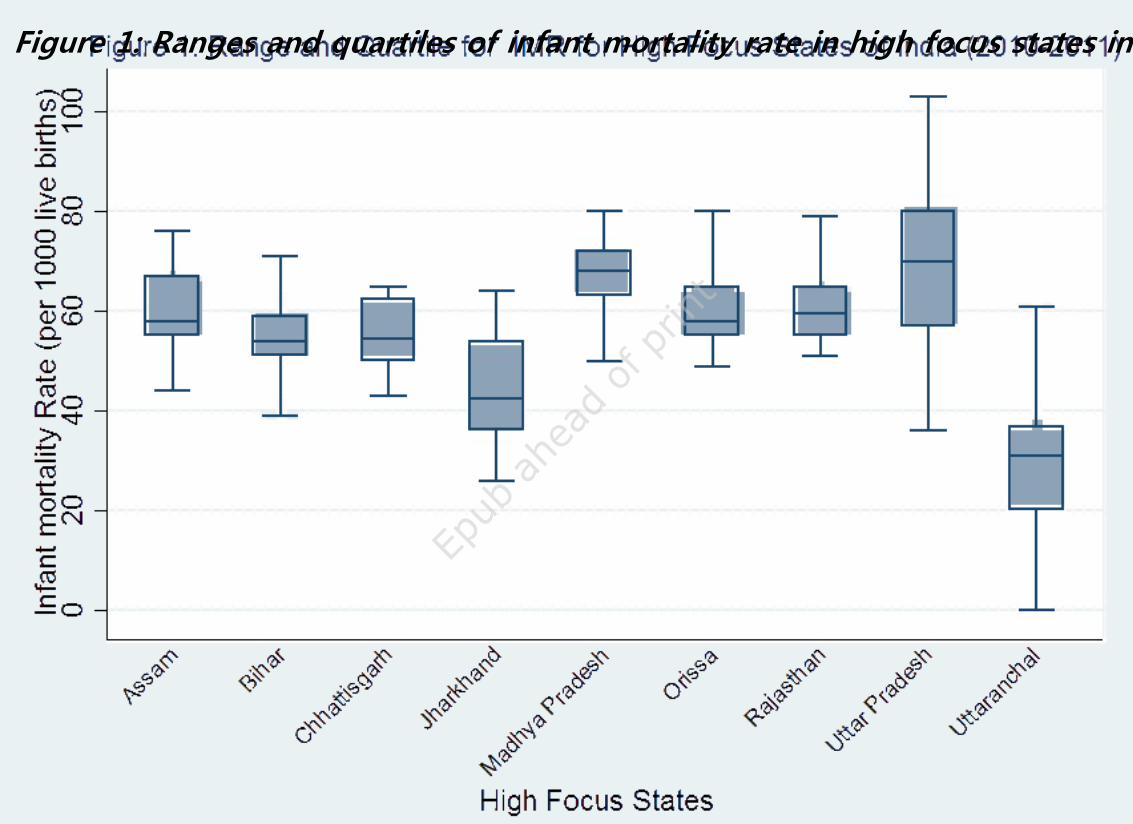
Figure 1 is the box plots of IMR of the nine the states. Median IMR for Uttar Pradesh (UP) is
70 this means, IMR of 35 districts is above 70, and moreover there is wide intrastate ranging
from 36 to 103 per 1000 live births. Median IMR of Madhya Pradesh (MP) having 45
districts is 68 per 1000 live births, but the intrastate variation is narrow from 45 to 80 much
lesser than that of UP. The levels of IMR for Assam, Odisha and Rajasthan with 23, 30 and
32 districts respectively are very close, and the respective median are 58, 58 and 60 per 1000
Ecological Context of Infant Mortality
8
live births respectively. The median IMR for Bihar and Chhattisgarh is similar at 55 while the
intrastate variation is higher in Bihar than in Chhattisgarh. Median IMR for Jharkhand is 42 is
the second lowest among the nine states after the median IMR of 37 for Uttarakhand. The
intrastate variation of IMR is high in Jharkhand than in Uttarakhand. The wide inter and
intra-state variation of IMR in the nine high focus states in India further validate the urgency
of the intervention targeting ecological factors having the bearing on aggregate district level
infant mortality.
[Figure 1 is about here]
3.1 Moran’s I Plot
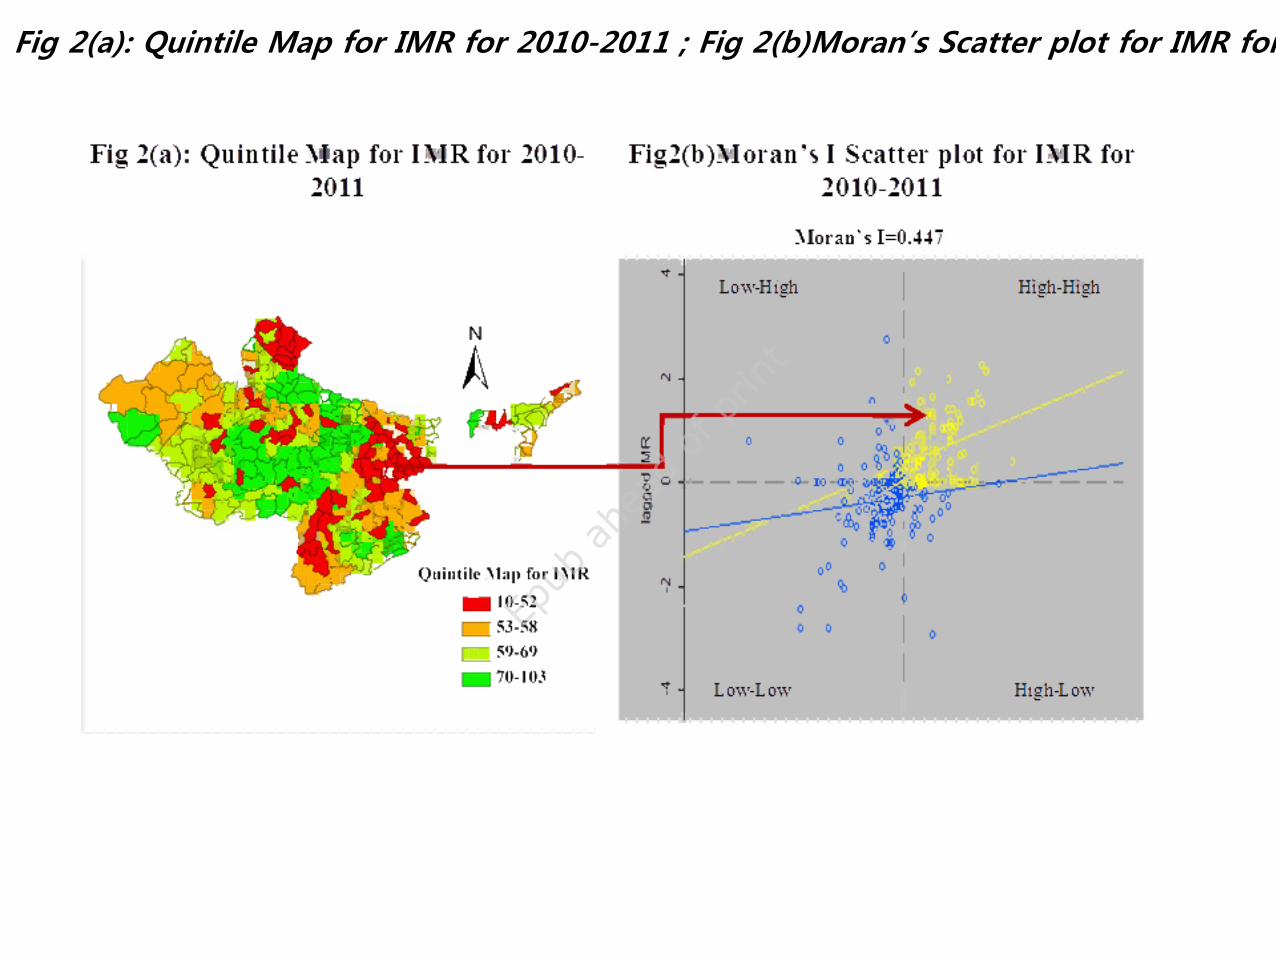
Scatter plot (Fig 2(b)) shows the value of original variable (IMR) on the horizontal axis and
spatial lag2 of the variable on the vertical axis. Both variables are standardized, and the graph
is divided into four quadrants; high-high (upper right) and low-low (lower left) indicating
positive spatial autocorrelation being surrounded by similar valued locations. Upper right
quadrant shows the association between high values while the lower left quadrant between
low values. On the other hand, high–low (lower right) and low-high (upper left) corresponds
to negative spatial autocorrelation as surrounded by high values (upper left) Moran’s I.
Quintile plot(Fig 2(a)) depicts the location of the high- high and low-low infant mortality.
The high-high (hot-spots) of IMR are in districts of Central region (Madhya Pradesh, Uttar
Pradesh, and Rajasthan).
It is observed that Global Moran’s I Statistic of spatial autocorrelation in IMR between
neighbourhood section is 0.4447(999 permutations; p<0.001). It clearly suggests the presence
of significant spatial correlation across the 284 district of high focus states.
[Figure 2(a) &2(b) is about here]
Ecological Context of Infant Mortality
9
Unadjusted and adjusted coefficients and standard errors of ecological factors of IMR are
shown in Table 2. Percent of non-workers among 15-59 persons have positive significant
effect in explaining variation in IMR and the effect is significant at P<0.05.
Both the unadjusted and adjusted effect of female literacy rates at the district level on IMR
are significant at P<0.01, the higher the female literacy, the lower the IMR. Poverty and
income inequality across districts is also considered the key factor of not only high level of
IMR but also of wide inter and intra-state variation of IMR. This is confirmed by the positive
effect of the percent of households in bottom wealth quintile at the district level when the
other ecological factors are adjusted. The adjusted effect of aggregate bottom wealth quintile
on IMR is significant at P<0.01. It is found that adjusting for other ecological factors, the
more is the new-born care facilities in PHC at districts the lesser is the district IMR, and it is
significant at P<0.01. This confirms the need for strengthening PHC, the maternal and child
health care provider of the community. The significance of intercept term at P<0.01 indicates
that in the nine high focus states there exists considerable variation in infant mortality even
after controlling for these ecological factors as these factors account for 25.8 percent of the
variation in IMR. Interventions at individual and community levels are important for speedy
reduction of IMR.
[Table 2 is about here]
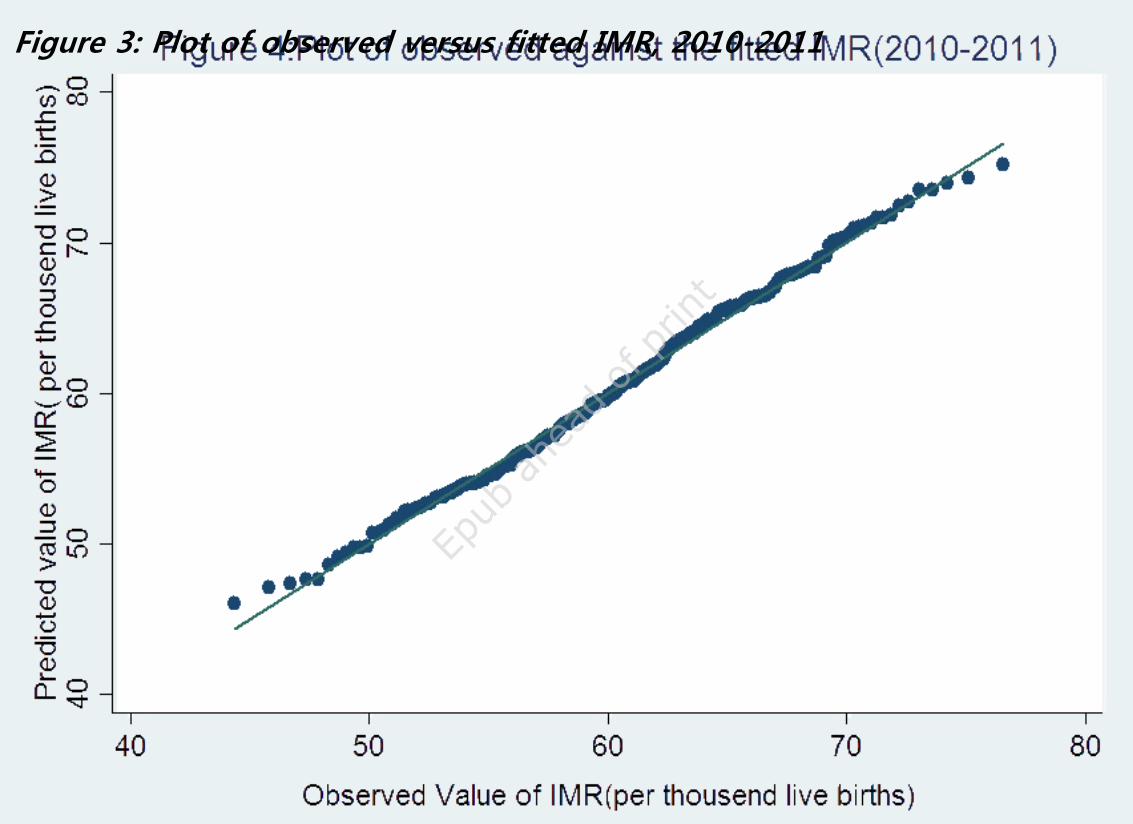
The plot of observed against the fitted IMR shown in figure 3 confirmed conformity with the
normality assumption.
[See Appendix 1]
3. Discussion and Conclusions
Ecological analyses are important for policy intervention at regional level as it explains
regional variation more appropriately than by individual, maternal or household level factors.
Ecological Context of Infant Mortality
10
This paper assesses the significance of ecological factors in explaining regional variation in
IMR. These factors are amendable to favourable change through public health and
community intervention. The paper provide convincing explanation for the reason behind
high IMR and wide inter and intrastate variation in the nine high focus states in India.
Under development is a factor responsible for high IMR in the high focus states in India.
This is reflected in the significant positive effect of the proportion of non-working population
among 15-59 years which is considered as a proxy measure of underdevelopment and is in
agreement with that of Preston postulating a strong positive correlation between life
expectancy and national income per head [23]. The positive significant effect of a non-
workers population at aggregate level signals that high profile MGNAREGA is yet to net a
sizeable proportion of working age population. One of the prime importance of female
literacy is healthier children because of its empowerment and emancipating factors [28].
Female literacy is crucial as the catalyst for trickling down of good practice in child care
including healthcare utilization. The significant inverse association between aggregate female
literacy rate and district IMR reiterates the importance of improving female literacy through
the adult literacy programmes. The significance of district level female literacy in reducing
infant mortality at the aggregate level is also a reflection of socio-cultural practices of women
in Indian society, and this fact has been ignored by demographers, social statistician and
population geographers [10]. Income inequality has the deterrent effect on health outcome
and it has been overlooked in analysing regional variation in IMR in India [20]. Wealth
quintiles constructed by assets owned by households is close approximation to income [24].
Use of proportion of households in bottom wealth quintile on district IMR allows testing of
Wilkinson’s hypothesis. The finding that the higher the proportion of households in bottom
wealth quintile the higher is the IMR is a confirmation of this hypothesis and agrees with that
of similar results of Wilkinson [29 30], and Filmer and Pritchett [24]. Intervention to increase
Ecological Context of Infant Mortality
11
access to livelihood can pave the way for reducing income inequality and reduce IMR. The
first step in reducing IMR and meeting the goal of MDG-4 is to avert neonatal mortality rate,
and availability of new-born care facilities at PHC is crucial. The result from the inverse
association between the proportion of PHC in districts having new-born care facilities and
district IMR the lessoning message is strengthening and increasing accessibility to PHC
facilities for new-born care.
In conclusion, it is to mention that achieving MDG-4 goal by the nine high focus states in
India would be a realistic target when concerted interventions are made to minimize barriers
at the district level. The findings of the study help in theorizing the link between district IMR
and its ecological determinants.
4. Limitations and Strengths
The major limitation of the study is that factor pertaining to socio-cultural barriers from
husband and mother-in-law could not be integrated. This can be strengthened by
complementing with the qualitative study. The major limitation of the study is that factor
pertaining to socio-cultural barriers from husband and mother-in-law could not be integrated.
This can be strengthened by complementing with the qualitative study. The main strength of
the study is figuring out the feasibility of cost-effective community level intervention
including adult literacy campaign and upgrading health facilities. The main strength of the
study is figuring out the feasibility of cost-effective community level intervention including
adult literacy campaign and upgrading health facilities.
Ethics Statement The study is based on aggregate data available in public domain; therefore
no ethical issue is involved.
Ecological Context of Infant Mortality
12
References
[1] Registrar General of India. (2013). SRS Bulletin. Volume 49 No 1. Vital Statistics Division. New
Delhi: Office of the Registrar General of India.
[2] Registrar General of India and Census Commissioner. (2011). Census of India –2011: Provisional
Population Totals Series 1. New Delhi: Ministry of Home Affairs, Government of India.
[3] Manda S. Birth intervals, breastfeeding and determinants of childhood mortality in Malawi.Social
Science & Medicine 1999; 48(3):301-312.
[4] Mosley WH, Chen LC.An analytic framework for the study of child survival in developing
countries. Population and Development Review 1984; 10: 25-45.
[5] Cleland J, van Ginneken JK.Maternal education and child survival in developing countries: the
search for pathways of influence. Social Science & Medicine 1989; 27: 1357-1368.
[6] Das Gupta M.Death clustering, mother’s education and determinants of child mortality in rural
Punjab, India. Population Studies 1990; 44: 489-505.
[7] Kishor S. May god gives sons to all, gender and child mortality in India. American Sociological
Review 1993; 58: 247-265.
[8] Krävdal O.Child mortality in India: The community-level effect of education. Population Studies
2004; 58(2); 177-192.
[9] Balk D, Pullum T, Storeygard A, Greenwell F, Neuman M. A spatial analysis of child mortality in
West Africa. Population Space and Place 2004: 10: 175-216.
[10] Ladusingh L, Singh CH. Place, community education, gender and child mortality in
northeast India. Population, Space and Place 2006; 12: 65-76.
[11] Singh A, Pathak PK, Chauhan RK, Pan W. Infant and child mortality in India in the last two
decades: A geospatial analysis. PLoS One 2011; 6(11): e26856.
[12] Kumar C, Singh PK, RaiRJ. Under-five mortality in high focus states in India: A district level
geospatial analysis. PloS One 2012; 7(5): e37515. doi:10.1371/journal.pone.0037515.
[13] Feinstein JS. The relationship between socioeconomic status and health. The Milbank
Quarterly 1993; 72(2): 279-322.
[14] James WL, Cossman JS. Does regional variation affect ecological research? An examination
of mortality, income inequality and health infrastructure in the Mississippi Delta. Population
Research and Policy Review 2006; 25(2): 175- 195.
[15] Farmer FL, Stokes CS, Fiser RH, Papini DP. Poverty, primary care and age-specific
mortality. The Journal of Rural Health 1991; 7(2): 153-169.
[16] Politzer RM, Harris DL, Gaston MH, Mullan F. Primary care physician supply and the
medically underserved: A status report and recommendation. Journal of the American Medical
Association 1991; 266(1): 104-109.
Ecological Context of Infant Mortality
13
[17] Deaton A. (2003) Health, Inequality, and Economic Development. Journal of Economic
Literature 2003; 41(1): 112-158.
[18] Dreze J,Sen A.India: Economic Development and Social Opportunity. Delhi: Oxford
University Press; 1995.
[19] Wilkinson RG.Health inequalities: relative or absolute material standards. British Medical
Journal 1997; 314(22): 591-595.
[20] Kawachi I,Kennedy BP. Income inequality and health: Pathways and mechanisms. Health
Services Research 1999; 34(1): 215– 27.
[21] International Institute for Population Sciences. District Level Household and Facility Survey-
3, 2007–08. IIPS: Mumbai; 2010.
[22] Registrar General of India. Annual Health Survey 2010-2011. Ministry of Home Affairs,
Government of India, New Delhi; 2012.http://www.censusindia.gov.in/Common/AHSurvey.html
(accessed on October 2, 2014).
[23] Preston S. The changing relation between mortality and level of economic development.
Population Studies 1975; 29(2): 231–48.
[24] Filmer D, Pritchett L. The impact of public spending on health: does money matter. Social
Science & Medicine 1999: 49(10): 1309–1323.
[25] Government of India. The Mahatma Gandhi National Rural Employment Guarantee Act. New
Delhi: Ministry of Rural Development; 2005.
[26] Anselin L, Syabri I, Kho Y. GeoDa: An introduction to spatial data analysis. Geographical
Analysis 2006; 38: 5–22.
[27] Moran PAP. (1950). Notes on continuous stochastic phenomena. Biometrika 1950; 37(1/2):
17-23.
[28] Shetty A, Shetty S.Impact of female literacy on infant mortality rate in Indian states. Current
Pediatric Research 2014; 18(1): 49-53.
[29] Wilkinson RG.Income distribution and life expectancy. British Medical Journal 1992;
304(18): 165-168.
[30] Wilkinson RG.Two pathways, but how much do they diverge? British Medical Journal 1999;
319(22): 956-957.

Ecological Context of Infant Mortality
14
Appendix 1
Figure 3
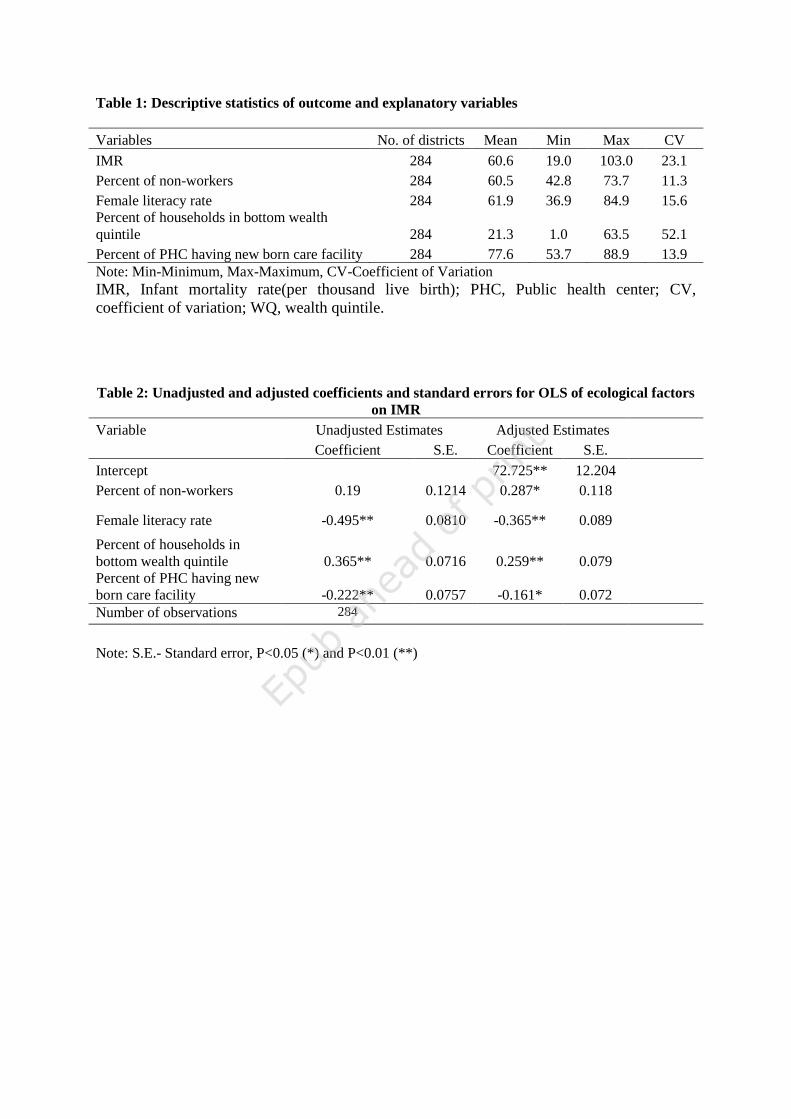
Table 1: Descriptive statistics of outcome and explanatory variables
Variables No. of districts Mean Min Max CV
IMR 284 60.6 19.0 103.0 23.1
Percent of non-workers 284 60.5 42.8 73.7 11.3
Female literacy rate 284 61.9 36.9 84.9 15.6
Percent of households in bottom wealth
quintile 284 21.3 1.0 63.5 52.1
Percent of PHC having new born care facility 284 77.6 53.7 88.9 13.9
Note: Min-Minimum, Max-Maximum, CV-Coefficient of Variation
IMR, Infant mortality rate(per thousand live birth); PHC, Public health center; CV,
coefficient of variation; WQ, wealth quintile.
Table 2: Unadjusted and adjusted coefficients and standard errors for OLS of ecological factors
on IMR
Variable Unadjusted Estimates Adjusted Estimates
Coefficient S.E. Coefficient S.E.
Intercept
72.725** 12.204
Percent of non-workers 0.19 0.1214 0.287* 0.118
Female literacy rate -0.495** 0.0810 -0.365** 0.089
Percent of households in
bottom wealth quintile 0.365** 0.0716 0.259** 0.079
Percent of PHC having new
born care facility -0.222** 0.0757 -0.161* 0.072
Number of observations 284
Note: S.E.- Standard error, P<0.05 (*) and P<0.01 (**)