Embed Size (px)
Citation preview
Hands on Experiments Hands on Experiments with Lightwith Light
Elena Elena [email protected]@gmail.com
National Vocational College “National Vocational College “NicolaeNicolae TitulescuTitulescu”, ”, SlatinaSlatina, Romania, Romania
1. Introduction1. Introduction““Hands on Science Romania” network and Center for Hands on Science Romania” network and Center for Science Education and Training CSET, coordinated by Mr. Science Education and Training CSET, coordinated by Mr. dr. Dan dr. Dan SporeaSporea, INFLPR Bucharest, received recently some , INFLPR Bucharest, received recently some OSA (Optical Society of America) kits OSA (Optical Society of America) kits -- Optics Discovery Optics Discovery Kit, in the frame of Photonics project, in partnership with Kit, in the frame of Photonics project, in partnership with New England Board of Higher Education (NEBHE), USA. New England Board of Higher Education (NEBHE), USA. Project Principal Investigator is Project Principal Investigator is FennaFenna Hanes (NEBHE). CoHanes (NEBHE). Co--principal Investigators are Professor Judy Donnelly (Three principal Investigators are Professor Judy Donnelly (Three Rivers Community College), Dean Nicholas Rivers Community College), Dean Nicholas MassaMassa (CCSU), (CCSU), and and MarijkeMarijke KehrhahnKehrhahn (University of Connecticut). Also, (University of Connecticut). Also, VernierVernier Software & Technology, USA donated sensors for Software & Technology, USA donated sensors for physics lab.physics lab.
What is Photonics?What is Photonics?Photonics is the practical application of light and optics. It iPhotonics is the practical application of light and optics. It is s an enabling technology that integrates lasers, optics and an enabling technology that integrates lasers, optics and electronics to develop applications in industries such as electronics to develop applications in industries such as telecommunications, information technology, entertainment telecommunications, information technology, entertainment and displays, lighting, consumer products, precision and displays, lighting, consumer products, precision manufacturing, biology and medicine, environmental manufacturing, biology and medicine, environmental sensing, homeland security and defense, astronomy and sensing, homeland security and defense, astronomy and aerospace, and research. In this twelveaerospace, and research. In this twelve--week online course week online course educators learn about the science and technology of educators learn about the science and technology of photonics through reading, problem solving, handsphotonics through reading, problem solving, hands--on on activities and discussion with peers. The overarching theme activities and discussion with peers. The overarching theme of the course is “How can I teach optics/photonics to my of the course is “How can I teach optics/photonics to my own students with the resources I have at hand?” The own students with the resources I have at hand?” The course have 6 optics/photonics units plus a “get course have 6 optics/photonics units plus a “get acquainted” week and a summary week. Instructors: acquainted” week and a summary week. Instructors: Professor Judy Donnelly (Three Rivers Community College, Professor Judy Donnelly (Three Rivers Community College, Norwich, CT, USA) and Donna Norwich, CT, USA) and Donna GoyetteGoyette (H.H. Ellis Technical (H.H. Ellis Technical High School in Danielson, CT, USA ).High School in Danielson, CT, USA ).
National Vocational College “National Vocational College “NicolaeNicolae TitulescuTitulescu”, ”, SlatinaSlatina, , OltOlt, Romania is an associated member of the “Hands on , Romania is an associated member of the “Hands on Science” network from 2004. A diversity of activities were Science” network from 2004. A diversity of activities were developed: the promotion of physics experiments, as well developed: the promotion of physics experiments, as well as the setas the set--up of a web site with our results, a secondary up of a web site with our results, a secondary school contest “The web site of my class”, an art exhibition school contest “The web site of my class”, an art exhibition organized by the best students of art classes, our organized by the best students of art classes, our participation on “Hands on Science” network’s exhibition to participation on “Hands on Science” network’s exhibition to the European Commission, activities of the biology club and the European Commission, activities of the biology club and of the chemistry club.of the chemistry club.As a reward of our participation in HSCI, we received two As a reward of our participation in HSCI, we received two training kits for mechanics, an OSA kit and training kits for mechanics, an OSA kit and VernierVernier sensors sensors of motion, force and temperature. Unfortunately, our of motion, force and temperature. Unfortunately, our Physics laboratory’s endowment is very old and inadequate. Physics laboratory’s endowment is very old and inadequate. Therefore, these training kits were welcomed. Therefore, these training kits were welcomed. I will present you some handI will present you some hand--on experiments with this on experiments with this equipment, in the Photonics project. equipment, in the Photonics project.
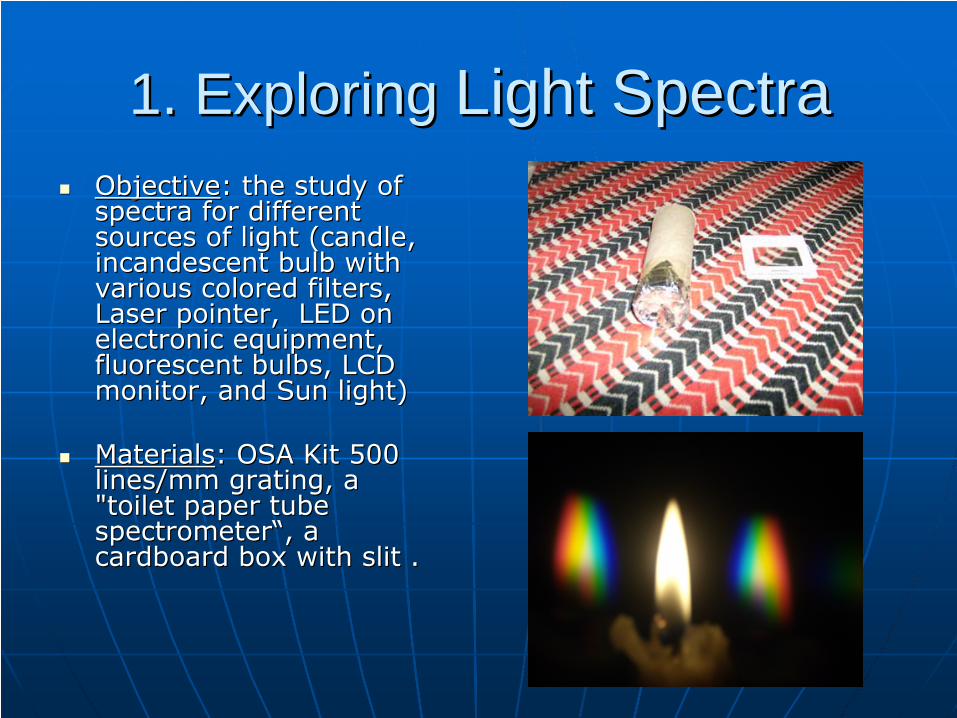
1. Exploring 1. Exploring Light Spectra Light Spectra ObjectiveObjective: the study of : the study of spectra for different spectra for different sources of light (candle, sources of light (candle, incandescent bulb with incandescent bulb with various colored filters, various colored filters, Laser pointer, LED on Laser pointer, LED on electronic equipment, electronic equipment, fluorescent bulbs, LCD fluorescent bulbs, LCD monitor, and Sun light)monitor, and Sun light)
MaterialsMaterials: OSA Kit 500 : OSA Kit 500 lines/mm grating, a lines/mm grating, a "toilet paper tube "toilet paper tube spectrometer“, a spectrometer“, a cardboard box with slit . cardboard box with slit .

a candle flame spectrum
incandescent clear bulb Sun light spectrum
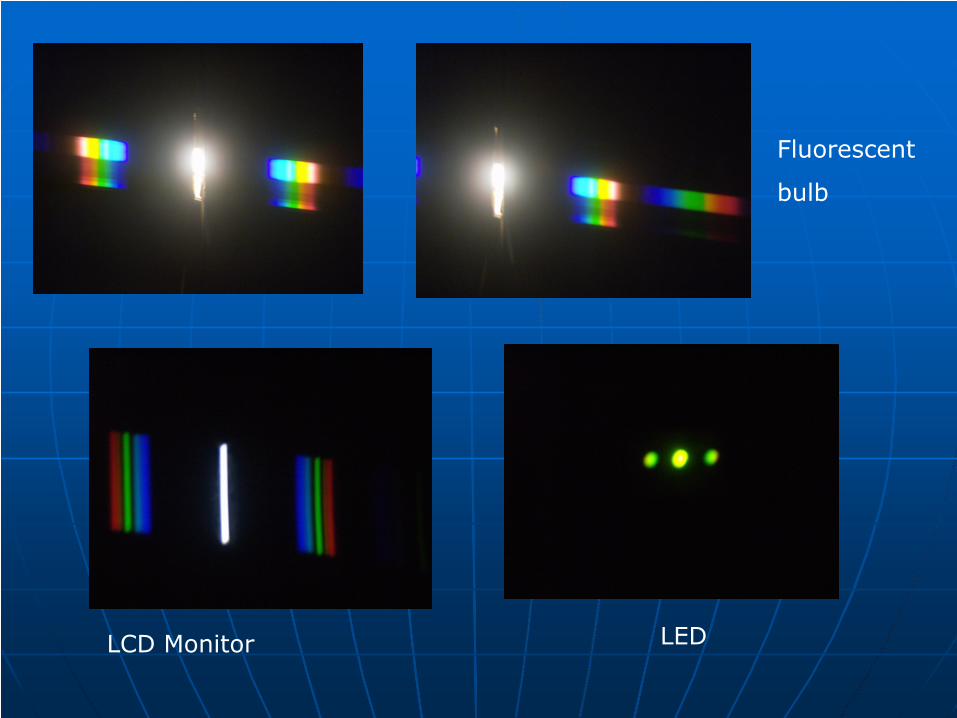
Fluorescent
bulb
LCD Monitor LED
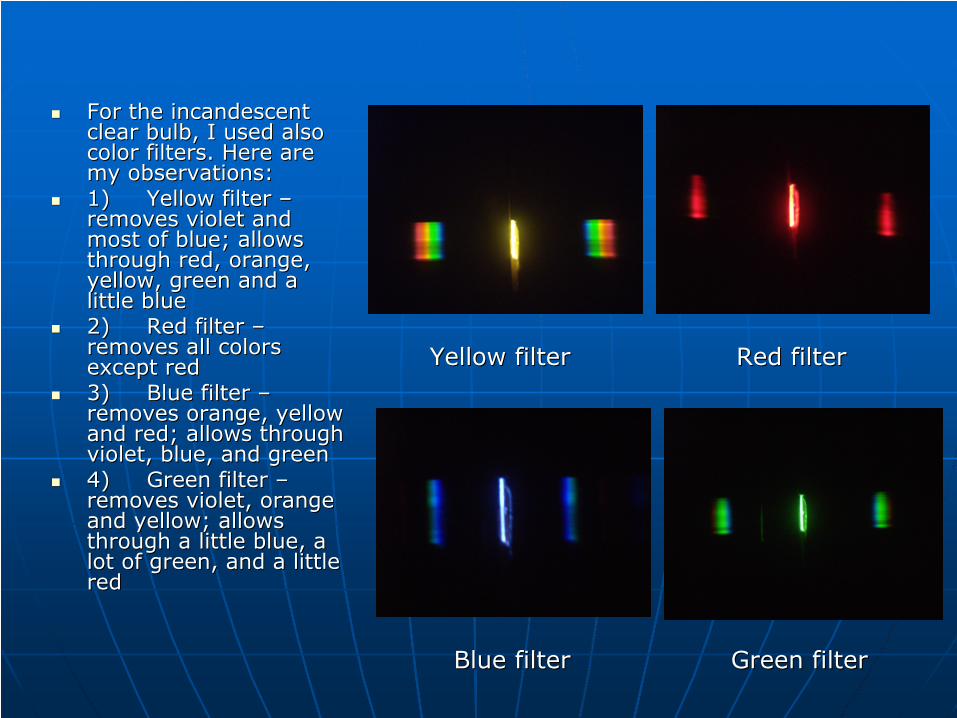
For the incandescent For the incandescent clear bulb, I used also clear bulb, I used also color filters. Here are color filters. Here are my observations:my observations:1)1) Yellow filter Yellow filter ––removes violet and removes violet and most of blue; allows most of blue; allows through red, orange, through red, orange, yellow, green and a yellow, green and a little bluelittle blue2)2) Red filter Red filter ––removes all colors removes all colors except redexcept red3)3) Blue filter Blue filter ––removes orange, yellow removes orange, yellow and red; allows through and red; allows through violet, blue, and greenviolet, blue, and green4)4) Green filter Green filter ––removes violet, orange removes violet, orange and yellow; allows and yellow; allows through a little blue, a through a little blue, a lot of green, and a little lot of green, and a little redred
Yellow filterYellow filter Red filterRed filter
Blue filterBlue filter Green filterGreen filter
Conclusions:Conclusions:After this lab, I can’t tell what colors are in a After this lab, I can’t tell what colors are in a
light source by looking at it with my unaided eye. light source by looking at it with my unaided eye. LCD monitor surprised me. I am sure now that all LCD monitor surprised me. I am sure now that all white lights have the same colors spectrum, white lights have the same colors spectrum, depending on the substance of the source. This depending on the substance of the source. This experiment was used for the study of continuous experiment was used for the study of continuous emission spectra, but can be improved for the emission spectra, but can be improved for the band and lines emission spectra and absorption band and lines emission spectra and absorption spectra.spectra.
2. The Color Spectrum 2. The Color Spectrum ((http://http://school.discovery.com/lessonplans/programs/colorschool.discovery.com/lessonplans/programs/color
spectrumspectrum// ))
ObjectiveObjective: to create a model of the infrared, visible, and : to create a model of the infrared, visible, and ultraviolet portions of the electromagnetic spectrumultraviolet portions of the electromagnetic spectrumMaterialsMaterials: Meter stick or metric ruler (marked in millimeters), : Meter stick or metric ruler (marked in millimeters), scissors, scotch tape, several pieces of paper in the following scissors, scotch tape, several pieces of paper in the following colors: red, orange, yellow, green, blue, violet, white, and blacolors: red, orange, yellow, green, blue, violet, white, and black ck (paper will be cut into 1(paper will be cut into 1--inchinch--wide strips), black marker, prism, wide strips), black marker, prism, flashlight (optional), a copy of The Color Spectrum: How Does Itflashlight (optional), a copy of The Color Spectrum: How Does ItWork? Data Sheet for each studentWork? Data Sheet for each studentProcedureProcedure: The scale that will be used to build their model of the : The scale that will be used to build their model of the spectrum is 1 nanometer equals 1 millimeter. So if a wavelength spectrum is 1 nanometer equals 1 millimeter. So if a wavelength is is X X nanometers, the model for that wavelength should measure nanometers, the model for that wavelength should measure X X millimeters. Students will need to show the work they've done onmillimeters. Students will need to show the work they've done ontheir calculations in the space provided on the data sheet. The their calculations in the space provided on the data sheet. The class is divided into small groups of two or four. Work togetherclass is divided into small groups of two or four. Work together as as a class on the metric conversion calculation for red light. Red a class on the metric conversion calculation for red light. Red paper will be used for the wavelength of red light, orange paperpaper will be used for the wavelength of red light, orange paperfor orange light, and so on. White paper will represent infraredfor orange light, and so on. White paper will represent infrared, , and black paper will represent ultraviolet. After groups have and black paper will represent ultraviolet. After groups have completed their model spectrum, they will shine white light completed their model spectrum, they will shine white light through a prism in order to see the visible spectrum they have through a prism in order to see the visible spectrum they have just modeled. just modeled.
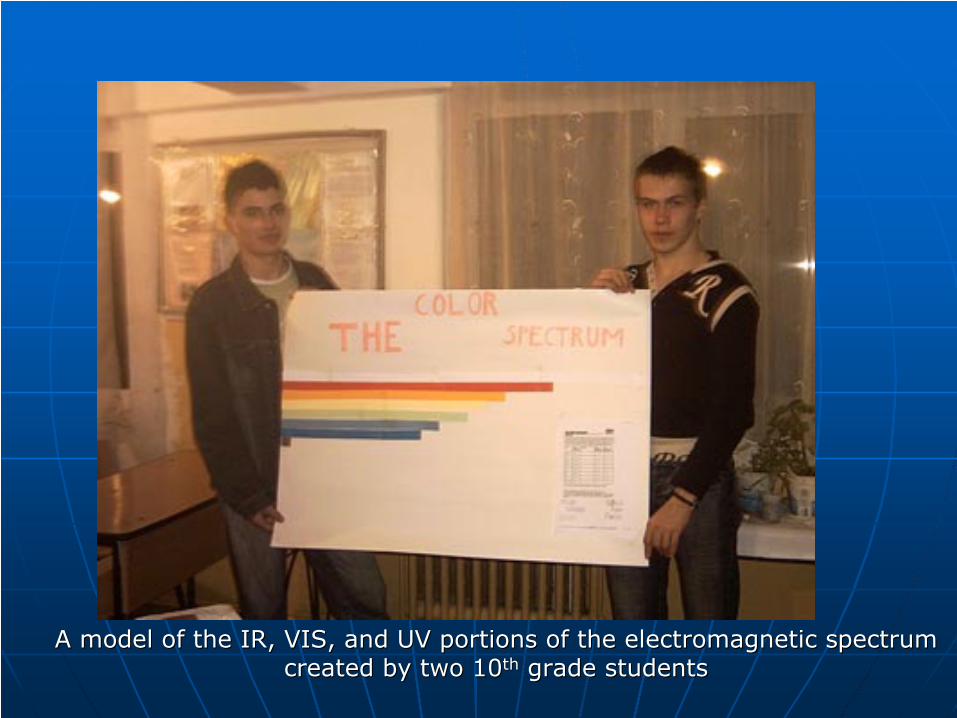
A model of the IR, VIS, and UV portions of the electromagnetic sA model of the IR, VIS, and UV portions of the electromagnetic spectrumpectrumcreated by two 10created by two 10thth
grade studentsgrade students
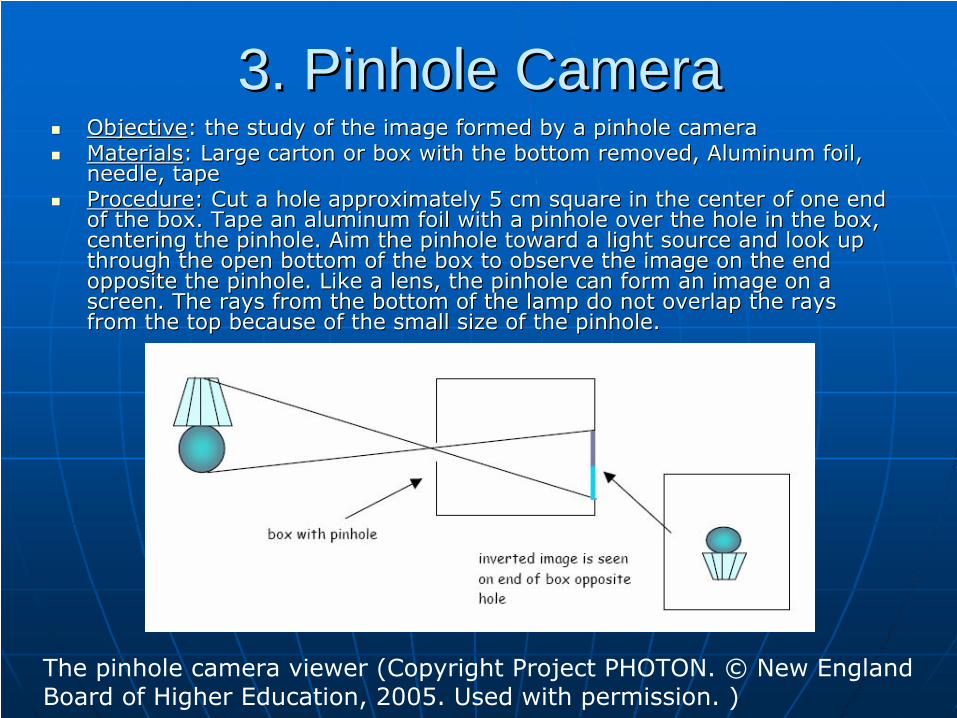
3. Pinhole Camera3. Pinhole CameraObjectiveObjective: the study of the image formed by a pinhole camera: the study of the image formed by a pinhole cameraMaterialsMaterials: Large carton or box with the bottom removed, Aluminum foil, : Large carton or box with the bottom removed, Aluminum foil, needle, tapeneedle, tapeProcedureProcedure: Cut a hole approximately 5 cm square in the center of one end : Cut a hole approximately 5 cm square in the center of one end of the box. Tape an aluminum foil with a pinhole over the hole iof the box. Tape an aluminum foil with a pinhole over the hole in the box, n the box, centering the pinhole. Aim the pinhole toward a light source andcentering the pinhole. Aim the pinhole toward a light source and look up look up through the open bottom of the box to observe the image on the ethrough the open bottom of the box to observe the image on the end nd opposite the pinhole. Like a lens, the pinhole can form an imageopposite the pinhole. Like a lens, the pinhole can form an image on a on a screen. The rays from the bottom of the lamp do not overlap the screen. The rays from the bottom of the lamp do not overlap the rays rays from the top because of the small size of the pinhole.from the top because of the small size of the pinhole.
The pinhole camera viewer (Copyright Project PHOTON. © New England Board of Higher Education, 2005. Used with permission. )
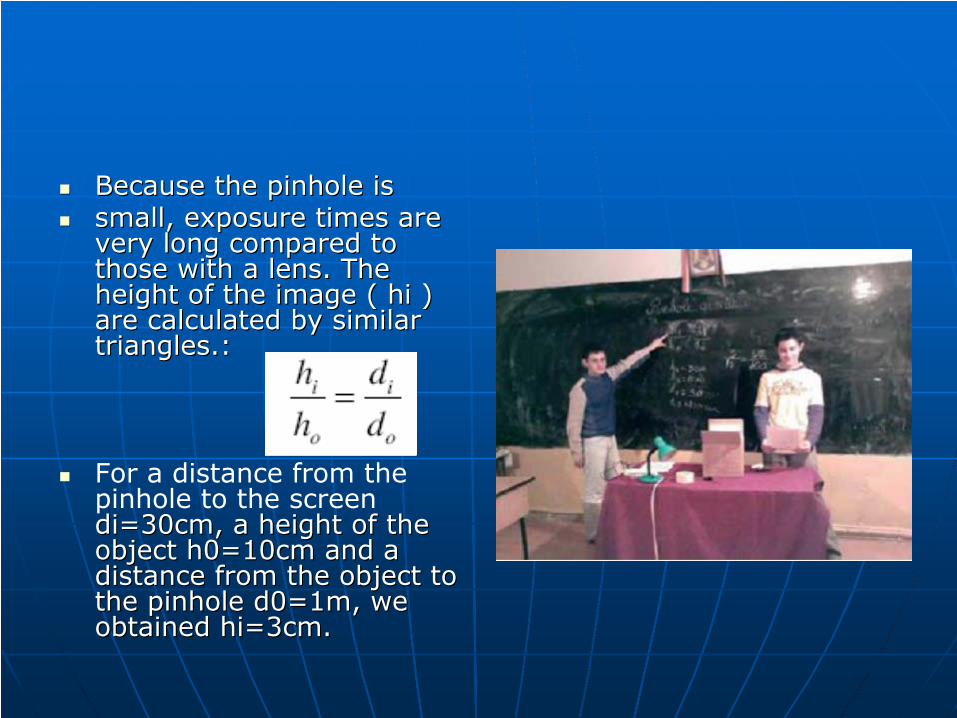
Because the pinhole isBecause the pinhole issmall, exposure times are small, exposure times are very long compared to very long compared to those with a lens. The those with a lens. The height of the image ( hi ) height of the image ( hi ) are calculated by similar are calculated by similar triangles.: triangles.:
For a distance from the pinhole to the screen didi=30cm, a height of the =30cm, a height of the object h0=10cm and a object h0=10cm and a distance from the object to distance from the object to the pinhole d0=1m, we the pinhole d0=1m, we obtained hi=3cm.obtained hi=3cm.
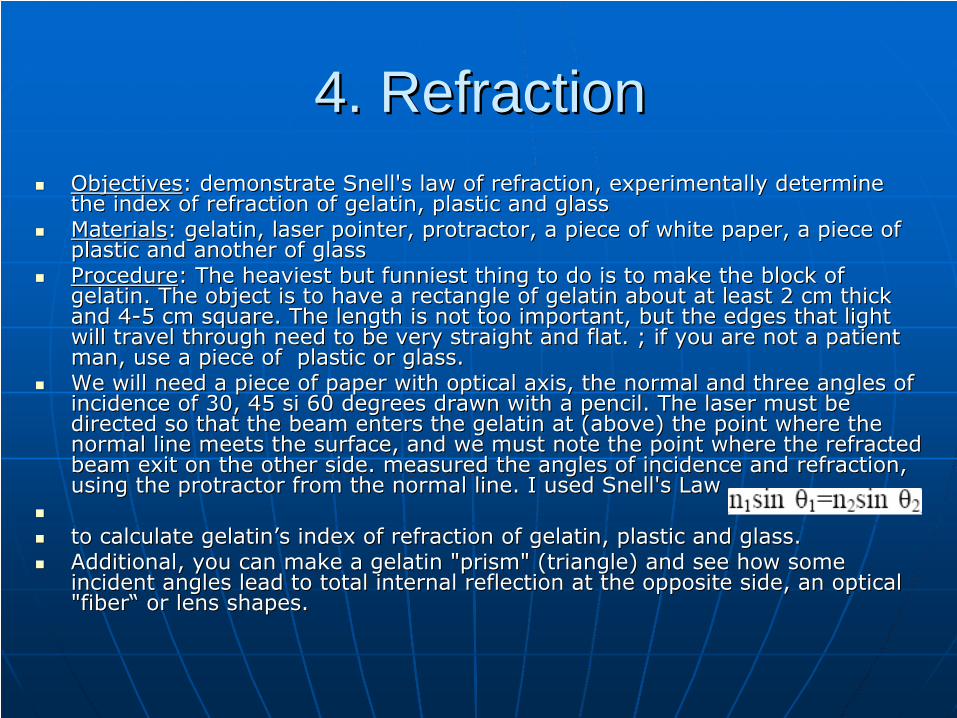
4. Refraction4. RefractionObjectivesObjectives: demonstrate Snell's law of refraction, experimentally determin: demonstrate Snell's law of refraction, experimentally determine e the index of refraction of gelatin, plastic and glass the index of refraction of gelatin, plastic and glass MaterialsMaterials: gelatin, laser pointer, protractor, a piece of white paper, a : gelatin, laser pointer, protractor, a piece of white paper, a piece of piece of plastic and another of glass plastic and another of glass ProcedureProcedure: The heaviest but funniest thing to do is to make the block of : The heaviest but funniest thing to do is to make the block of gelatin. The object is to have a rectangle of gelatin about at lgelatin. The object is to have a rectangle of gelatin about at least 2 cm thick east 2 cm thick and 4and 4--5 cm square. The length is not too important, but the edges that5 cm square. The length is not too important, but the edges that light light will travel through need to be very straight and flat. ; if you will travel through need to be very straight and flat. ; if you are not a patient are not a patient man, use a piece of plastic or glass.man, use a piece of plastic or glass.We will need a piece of paper with optical axis, the normal and We will need a piece of paper with optical axis, the normal and three angles of three angles of incidence of 30, 45 incidence of 30, 45 sisi 60 degrees drawn with a pencil. The laser must be 60 degrees drawn with a pencil. The laser must be directed so that the beam enters the gelatin at (above) the poindirected so that the beam enters the gelatin at (above) the point where the t where the normal line meets the surface, and we must note the point where normal line meets the surface, and we must note the point where the refracted the refracted beam exit on the other side. measured the angles of incidence anbeam exit on the other side. measured the angles of incidence and refraction, d refraction, using the protractor from the normal line. I used Snell's Law using the protractor from the normal line. I used Snell's Law
to calculate gelatin’s index of refraction of gelatin, plastic ato calculate gelatin’s index of refraction of gelatin, plastic and glass. nd glass. Additional, you can make a gelatin "prism" (triangle) and see hoAdditional, you can make a gelatin "prism" (triangle) and see how some w some incident angles lead to total internal reflection at the oppositincident angles lead to total internal reflection at the opposite side, an optical e side, an optical "fiber“ or lens shapes."fiber“ or lens shapes.
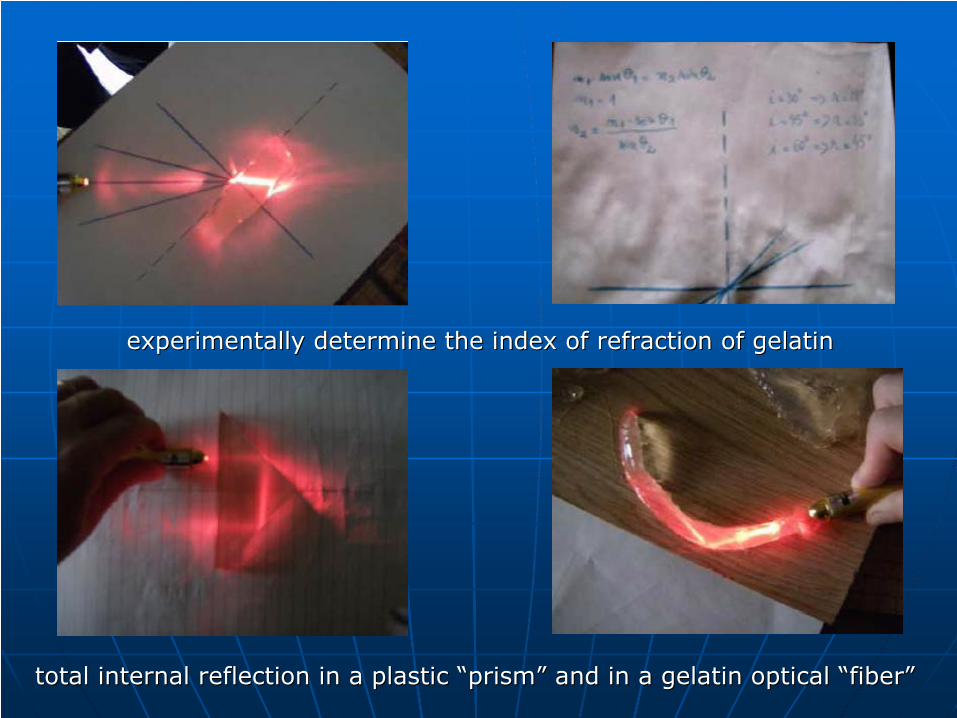
experimentally determine the index of refraction of gelatinexperimentally determine the index of refraction of gelatin
total internal reflection in a plastic “prism” and in a gelatin total internal reflection in a plastic “prism” and in a gelatin optical “fiber”optical “fiber”
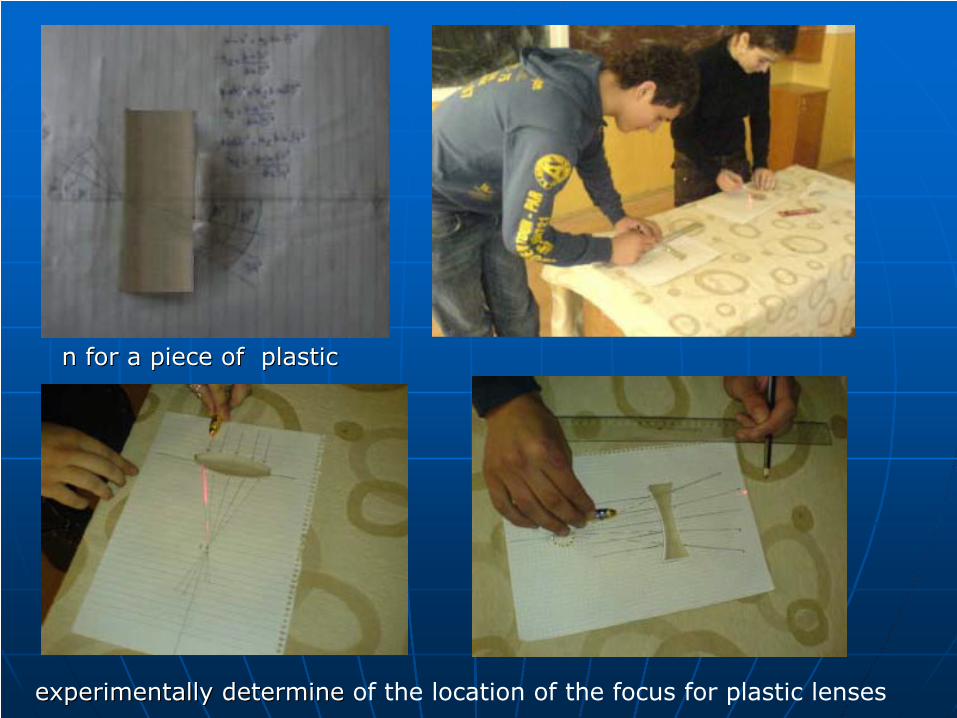
n for a piece of plasticn for a piece of plastic
experimentally determineexperimentally determine
of the location of the focus for plastic lenses
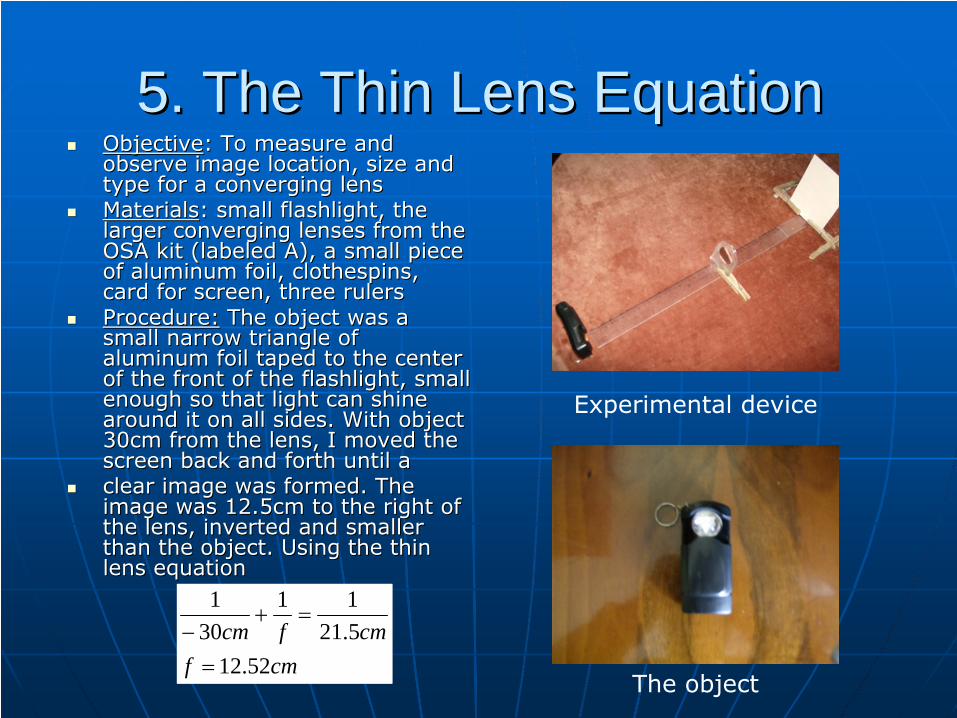
5. The Thin Lens Equation5. The Thin Lens EquationObjectiveObjective: To measure and : To measure and observe image location, size and observe image location, size and type for a converging lenstype for a converging lensMaterialsMaterials: small flashlight, the : small flashlight, the larger converging lenses from the larger converging lenses from the OSA kit (labeled A), a small piece OSA kit (labeled A), a small piece of aluminum foil, clothespins, of aluminum foil, clothespins, card for screen, three rulerscard for screen, three rulersProcedure:Procedure: The object was a The object was a small narrow triangle of small narrow triangle of aluminum foil taped to the center aluminum foil taped to the center of the front of the flashlight, small of the front of the flashlight, small enough so that light can shine enough so that light can shine around it on all sides. With object around it on all sides. With object 30cm from the lens, I moved the 30cm from the lens, I moved the screen back and forth until ascreen back and forth until aclear image was formed. The clear image was formed. The image was 12.5cm to the right of image was 12.5cm to the right of the lens, inverted and smaller the lens, inverted and smaller than the object. Using the thin than the object. Using the thin lens equationlens equation
Experimental device
cmfcmfcm
52.125.2111
301
=
=+−
The object
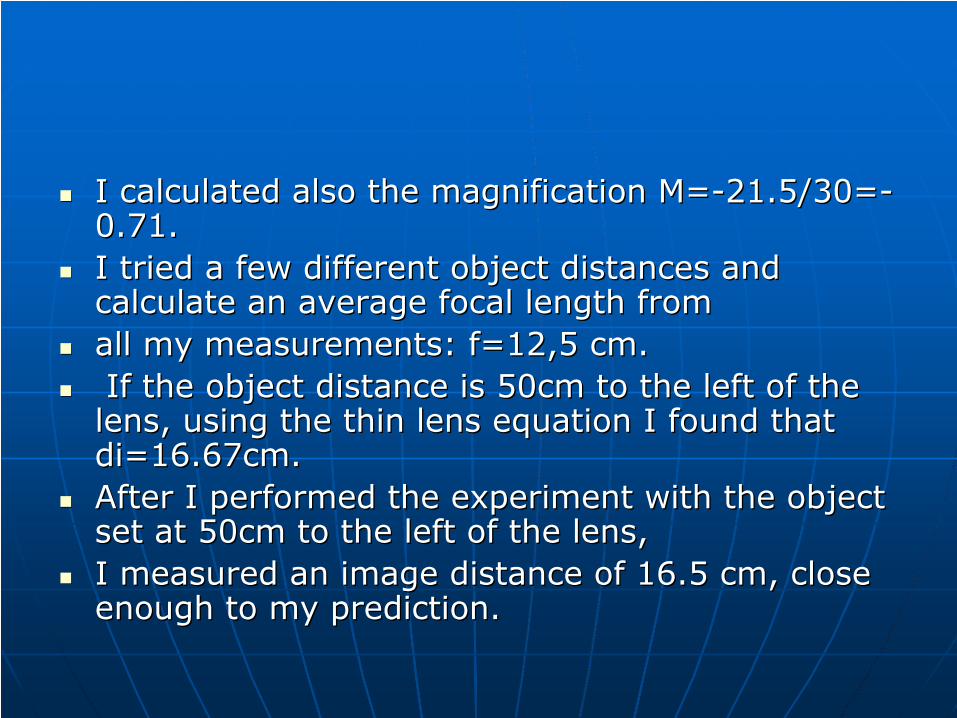
I calculated also the magnification M=I calculated also the magnification M=--21.5/30=21.5/30=--0.71.0.71.I tried a few different object distances and I tried a few different object distances and calculate an average focal length fromcalculate an average focal length fromall my measurements: f=12,5 cm.all my measurements: f=12,5 cm.If the object distance is 50cm to the left of the If the object distance is 50cm to the left of the lens, using the thin lens equation I found that lens, using the thin lens equation I found that didi=16.67cm.=16.67cm.After I performed the experiment with the object After I performed the experiment with the object set at 50cm to the left of the lens,set at 50cm to the left of the lens,I measured an image distance of 16.5 cm, close I measured an image distance of 16.5 cm, close enough to my prediction.enough to my prediction.
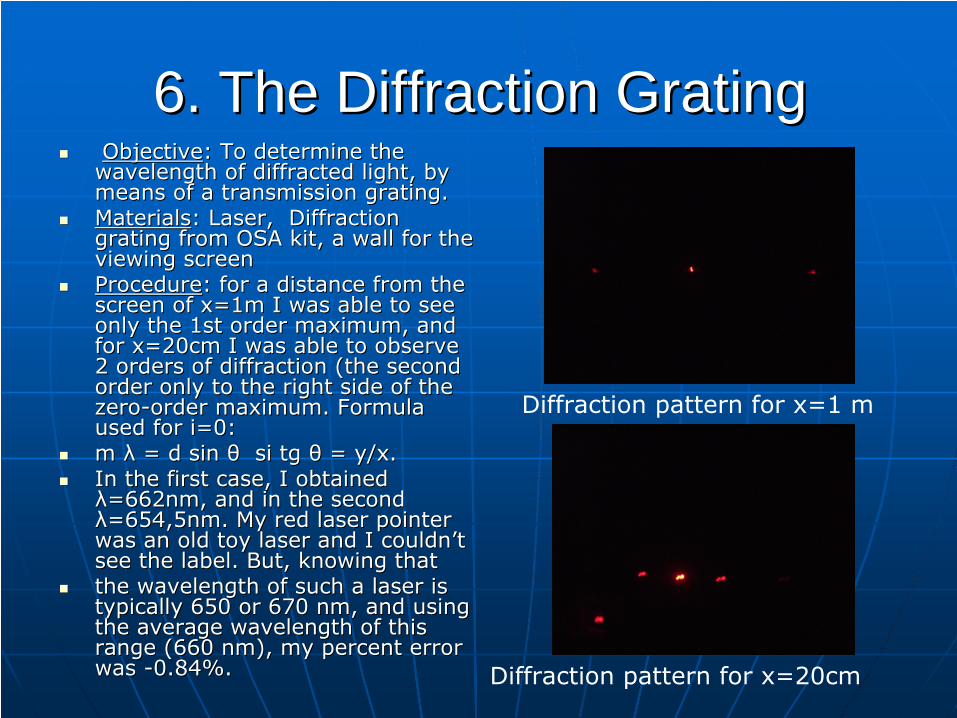
6. The Diffraction Grating6. The Diffraction GratingObjectiveObjective: To determine the : To determine the
wavelength of diffracted light, by wavelength of diffracted light, by means of a transmission grating.means of a transmission grating.MaterialsMaterials: Laser, Diffraction : Laser, Diffraction grating from OSA kit, a wall for the grating from OSA kit, a wall for the viewing screenviewing screenProcedureProcedure: for a distance from the : for a distance from the screen of x=1m I was able to see screen of x=1m I was able to see only the 1st order maximum, and only the 1st order maximum, and for x=20cm I was able to observe for x=20cm I was able to observe 2 orders of diffraction (the second 2 orders of diffraction (the second order only to the right side of the order only to the right side of the zerozero--order maximum. Formula order maximum. Formula used for i=0: used for i=0: m λ = d sin θ m λ = d sin θ sisi tgtg θ = θ = y/xy/x. . In the first case, I obtained In the first case, I obtained λ=662nm, and in the second λ=662nm, and in the second λ=654,5nm. My red laser pointer λ=654,5nm. My red laser pointer was an old toy laser and I couldn’t was an old toy laser and I couldn’t see the label. But, knowing thatsee the label. But, knowing thatthe wavelength of such a laser is the wavelength of such a laser is typically 650 or 670 nm, and using typically 650 or 670 nm, and using the average wavelength of this the average wavelength of this range (660 nm), my percent error range (660 nm), my percent error was was --0.84%.0.84%.
Diffraction pattern for x=1 m
Diffraction pattern for x=20cm
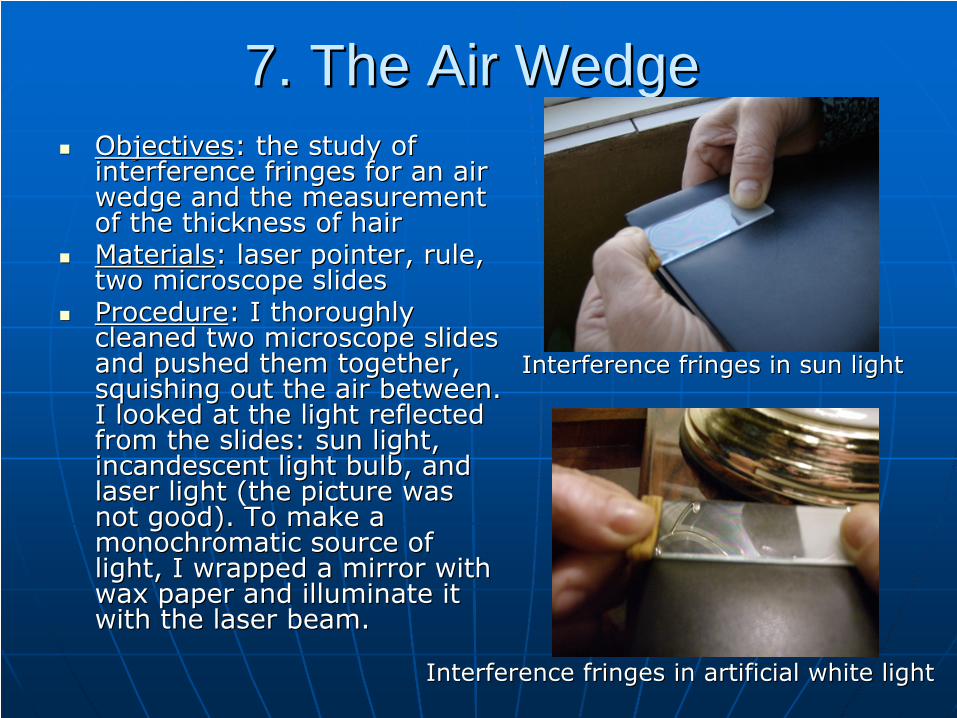
7. The Air Wedge7. The Air WedgeObjectivesObjectives: the study of : the study of interference fringes for an air interference fringes for an air wedge and the measurement wedge and the measurement of the thickness of hairof the thickness of hairMaterialsMaterials: laser pointer, rule, : laser pointer, rule, two microscope slides two microscope slides ProcedureProcedure: I thoroughly : I thoroughly cleaned two microscope slides cleaned two microscope slides and pushed them together, and pushed them together, squishing out the air between. squishing out the air between. I looked at the light reflected I looked at the light reflected from the slides: sun light, from the slides: sun light, incandescent light bulb, and incandescent light bulb, and laser light (the picture was laser light (the picture was not good). To make a not good). To make a monochromatic source of monochromatic source of light, I wrapped a mirror with light, I wrapped a mirror with wax paper and illuminate it wax paper and illuminate it with the laser beam. with the laser beam.
Interference fringes in sun lightInterference fringes in sun light
Interference fringes in artificial white lightInterference fringes in artificial white light
I counted the number of fringes per 0.5 cm at I counted the number of fringes per 0.5 cm at several locations, because was very, very hard and several locations, because was very, very hard and I multiplied by the total length 7.5 cm. Also, my I multiplied by the total length 7.5 cm. Also, my wrapped mirror didn’t illuminate the whole length wrapped mirror didn’t illuminate the whole length of the glass plates, but only a little area. In order of the glass plates, but only a little area. In order to make a better counting, I marked the wax paper to make a better counting, I marked the wax paper in 1 cm increments with a pencil.in 1 cm increments with a pencil.I found m=34 fringes/cm x 7.5 cm=255 fringes. I I found m=34 fringes/cm x 7.5 cm=255 fringes. I used a magnifying lens and my husband’s hair used a magnifying lens and my husband’s hair (dark(dark--haired). Unfortunately, I couldn’t make a haired). Unfortunately, I couldn’t make a good photo.good photo.The thickness of hair measured by my air wedge The thickness of hair measured by my air wedge was t=m8/2=(255 x 660 nm)/2=84,15 6m, which was t=m8/2=(255 x 660 nm)/2=84,15 6m, which is reasonable, I think.is reasonable, I think.
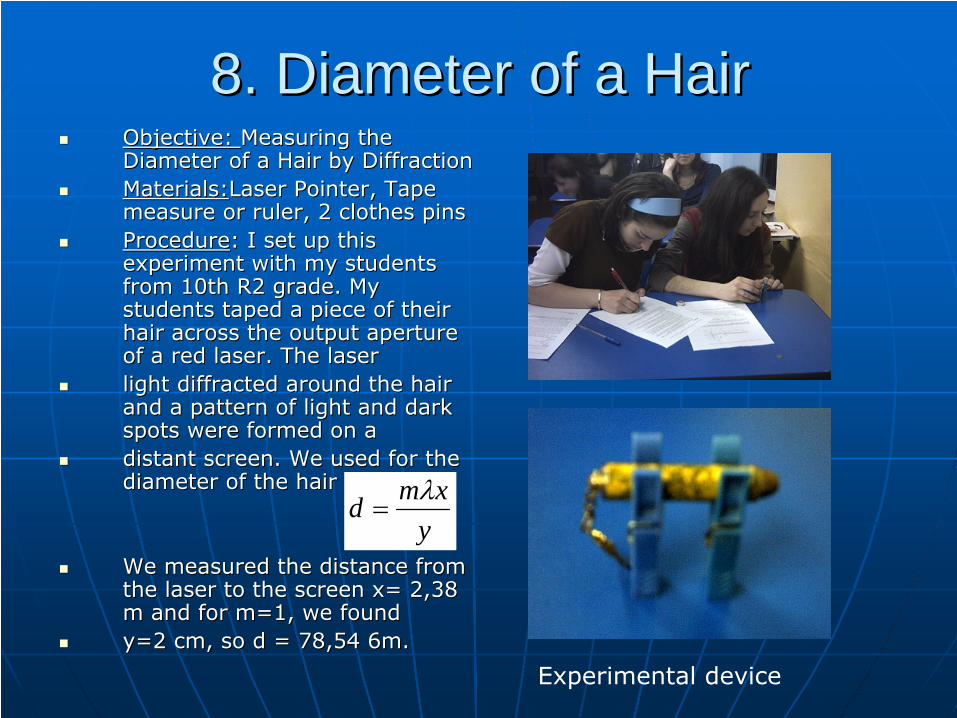
8. Diameter of a Hair8. Diameter of a HairObjective: Objective: Measuring the Measuring the Diameter of a Hair by DiffractionDiameter of a Hair by DiffractionMaterials:Materials:LaserLaser Pointer, Tape Pointer, Tape measure or ruler, 2 clothes pinsmeasure or ruler, 2 clothes pinsProcedureProcedure: I set up this : I set up this experiment with my students experiment with my students from 10th R2 grade. My from 10th R2 grade. My students taped a piece of their students taped a piece of their hair across the output aperture hair across the output aperture of a red laser. The laserof a red laser. The laserlight diffracted around the hair light diffracted around the hair and a pattern of light and dark and a pattern of light and dark spots were formed on aspots were formed on adistant screen. We used for the distant screen. We used for the diameter of the hairdiameter of the hair
We measured the distance from We measured the distance from the laser to the screen x= 2,38 the laser to the screen x= 2,38 m and for m=1, we foundm and for m=1, we foundy=2 cm, so d = 78,54 6m. y=2 cm, so d = 78,54 6m.
Experimental device
yxmd λ
=
9. Polarization of light9. Polarization of lightObjectiveObjective: exploring polarization: exploring polarizationMaterialsMaterials: two pieces of : two pieces of polarizing plastic from the OSA polarizing plastic from the OSA Optics Discovery kit, bowl of Optics Discovery kit, bowl of water, transparent plastic water, transparent plastic objects: ruler, protractor, comb, objects: ruler, protractor, comb, etc.etc.ProcedureProcedure: "Natural" or : "Natural" or randomly polarized light has randomly polarized light has light waves that vibrate in all light waves that vibrate in all directions, and the vibration directions, and the vibration directions vary randomly in directions vary randomly in time. When randomly polarized time. When randomly polarized (natural) light is passed through (natural) light is passed through an optical element known as a an optical element known as a linear polarizer, one component linear polarizer, one component of the electric fieldof the electric field
vector is absorbed, resulting vector is absorbed, resulting in light that is strongly in light that is strongly polarized in one direction.polarized in one direction.To determine the To determine the transmission axis of the transmission axis of the polarizer, you need to view polarizer, you need to view the glare or shine from the glare or shine from surface such as glass, water surface such as glass, water or ice through one of the or ice through one of the polarizing filters. While polarizing filters. While looking through the polarizer, looking through the polarizer, rotate it and notice that the rotate it and notice that the reflected light becomes reflected light becomes dimmer and brighter. When dimmer and brighter. When you can see the reflection at you can see the reflection at its brightest, the transmission its brightest, the transmission axis of the polarizer is axis of the polarizer is horizontal.horizontal.
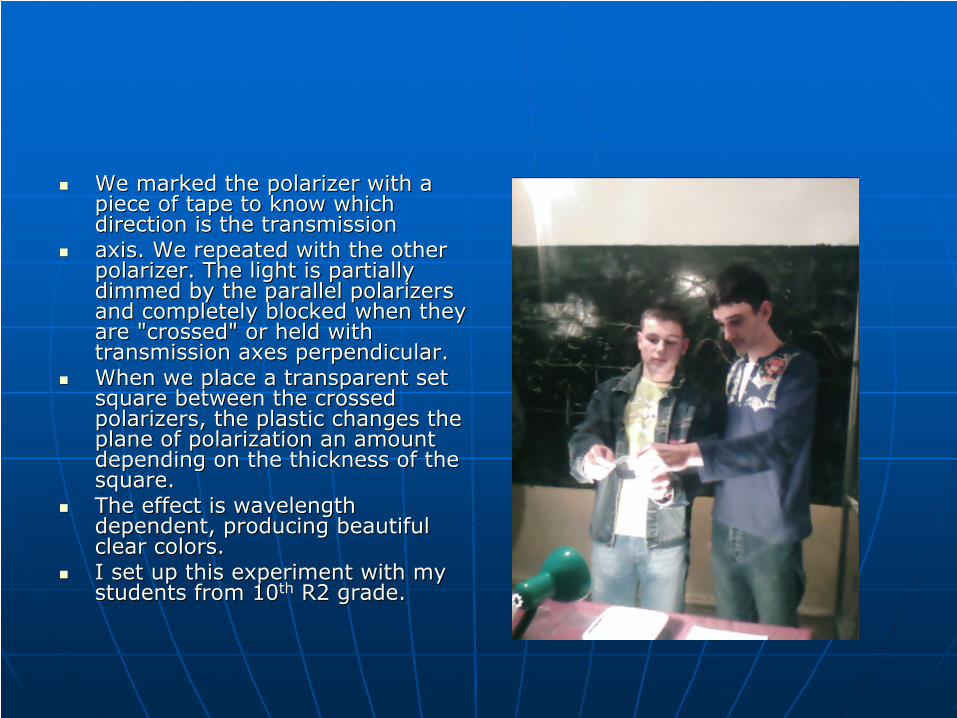
We marked the polarizer with a We marked the polarizer with a piece of tape to know which piece of tape to know which direction is the transmissiondirection is the transmissionaxis. We repeated with the other axis. We repeated with the other polarizer. The light is partially polarizer. The light is partially dimmed by the parallel dimmed by the parallel polarizerspolarizersand completely blocked when they and completely blocked when they are "crossed" or held with are "crossed" or held with transmission axes perpendicular.transmission axes perpendicular.When we place a transparent set When we place a transparent set square between the crossed square between the crossed polarizerspolarizers, the plastic changes the , the plastic changes the plane of polarization an amount plane of polarization an amount depending on the thickness of the depending on the thickness of the square.square.The effect is wavelength The effect is wavelength dependent, producing beautiful dependent, producing beautiful clear colors. clear colors. I set up this experiment with my I set up this experiment with my students from 10students from 10thth R2 grade.R2 grade.
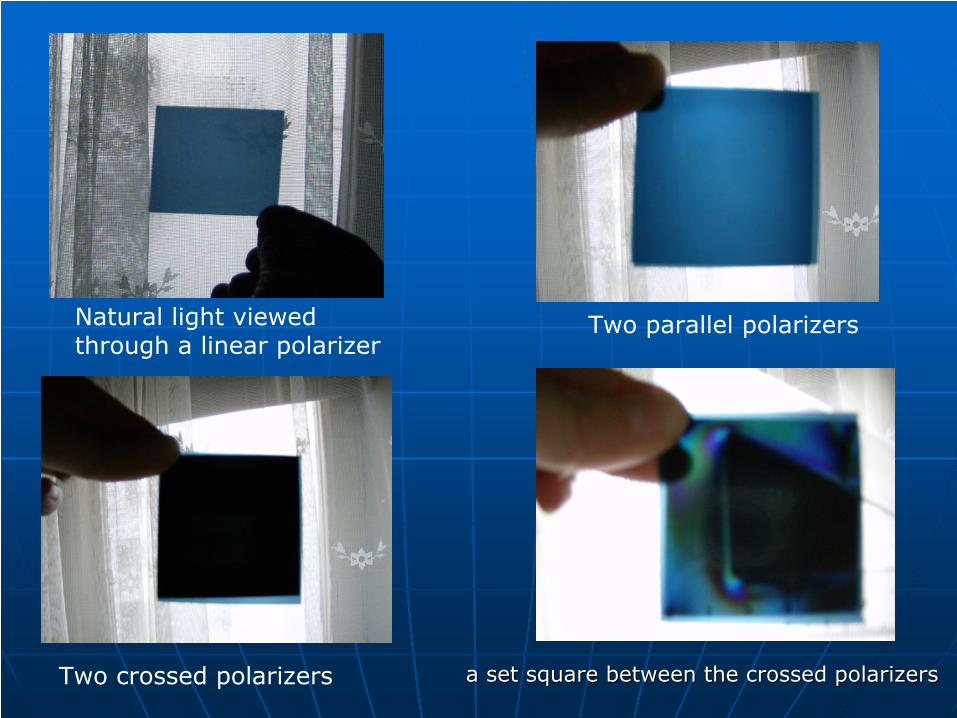
Natural light viewed through a linear polarizer
Two parallel polarizers
Two crossed polarizers a set square between the crossed a set square between the crossed polarizerspolarizers
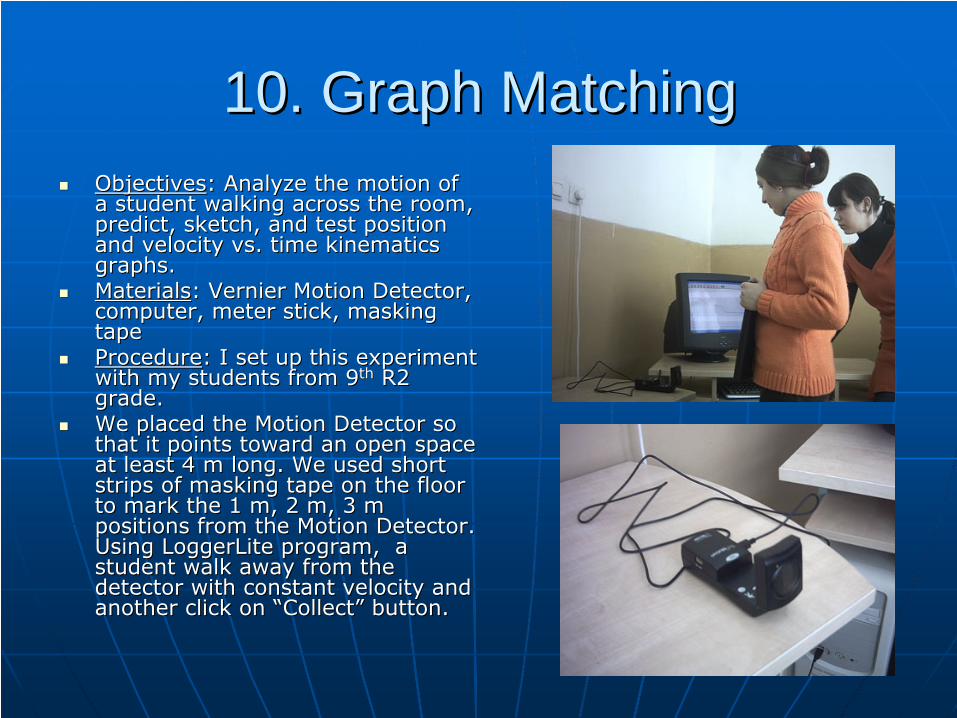
10. Graph Matching10. Graph MatchingObjectivesObjectives: Analyze the motion of : Analyze the motion of a student walking across the room, a student walking across the room, predict, sketch, and test position predict, sketch, and test position and velocity vs. time kinematics and velocity vs. time kinematics graphs.graphs.MaterialsMaterials: : VernierVernier Motion Detector, Motion Detector, computer, meter stick, masking computer, meter stick, masking tape tape ProcedureProcedure: I set up this experiment : I set up this experiment with my students from 9with my students from 9thth R2 R2 grade.grade.We placed the Motion Detector so We placed the Motion Detector so that it points toward an open space that it points toward an open space at least 4 m long. We used short at least 4 m long. We used short strips of masking tape on the floor strips of masking tape on the floor to mark the 1 m, 2 m, 3 m to mark the 1 m, 2 m, 3 m positions from the Motion Detector. positions from the Motion Detector. Using Using LoggerLiteLoggerLite program, a program, a student walk away from the student walk away from the detector with constant velocity and detector with constant velocity and another click on “Collect” button. another click on “Collect” button.
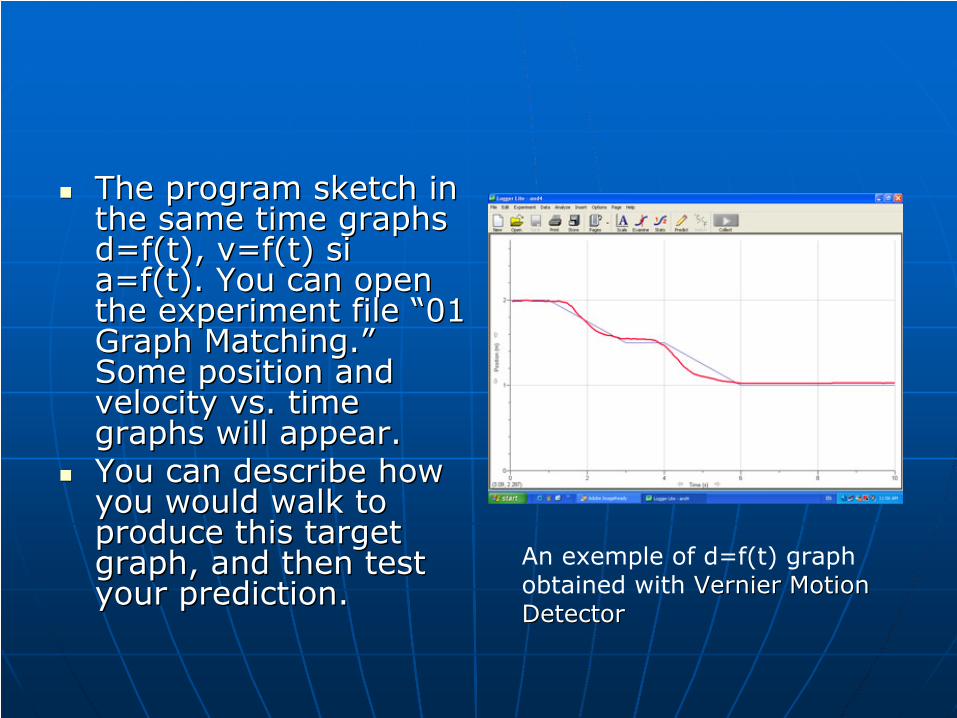
The program sketch in The program sketch in the same time graphs the same time graphs d=d=f(tf(t), v=), v=f(tf(t) ) sisia=a=f(tf(t). You can open ). You can open the experiment file “01 the experiment file “01 Graph Matching.” Graph Matching.” Some position and Some position and velocity vs. time velocity vs. time graphs will appear.graphs will appear.You can describe how You can describe how you would walk to you would walk to produce this target produce this target graph, and then test graph, and then test your prediction. your prediction.
An exemple
of d=f(t) graph obtained with VernierVernier
Motion Motion DetectorDetector
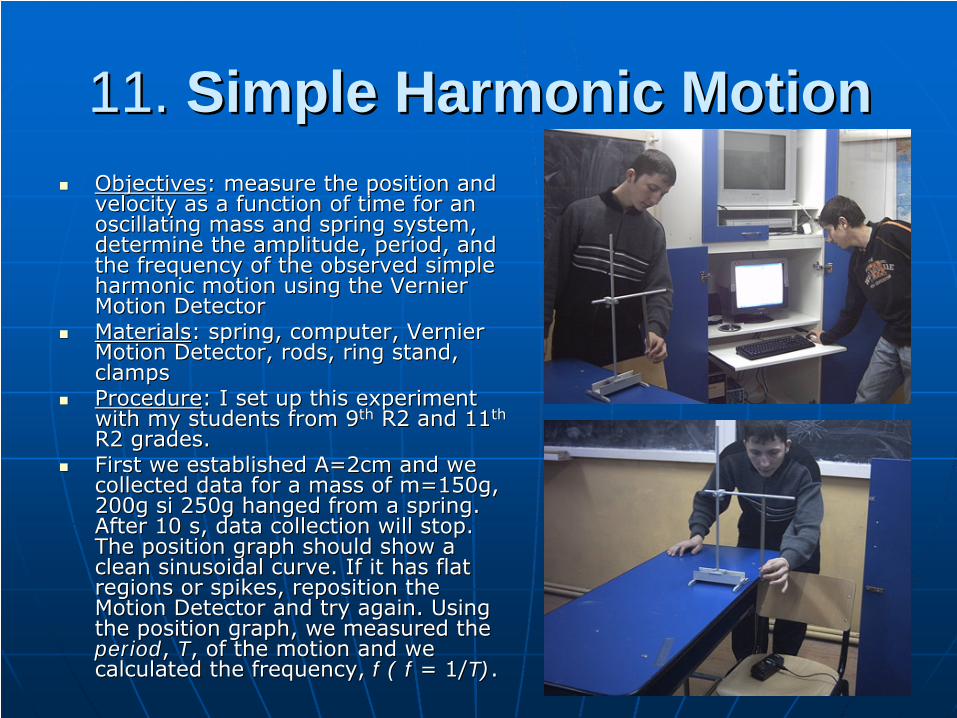
11. 11. Simple Harmonic MotionSimple Harmonic MotionObjectivesObjectives: measure the position and : measure the position and velocity as a function of time for an velocity as a function of time for an oscillating mass and spring system, oscillating mass and spring system, determine the amplitude, period, and determine the amplitude, period, and the frequency of the observed simple the frequency of the observed simple harmonic motion using the harmonic motion using the VernierVernierMotion DetectorMotion DetectorMaterialsMaterials: spring, computer, : spring, computer, VernierVernierMotion Detector, rods, ring stand, Motion Detector, rods, ring stand, clampsclampsProcedureProcedure: I set up this experiment : I set up this experiment with my students from 9with my students from 9thth R2 and 11R2 and 11thth
R2 grades.R2 grades.First we established A=2cm and we First we established A=2cm and we collected data for a mass of m=150g, collected data for a mass of m=150g, 200g 200g sisi 250g hanged from a spring. 250g hanged from a spring. After 10 s, data collection will stop. After 10 s, data collection will stop. The position graph should show a The position graph should show a clean sinusoidal curve. If it has flat clean sinusoidal curve. If it has flat regions or spikes, reposition the regions or spikes, reposition the Motion Detector and try again. Using Motion Detector and try again. Using the position graph, we measured the the position graph, we measured the periodperiod, , TT, of the motion and we , of the motion and we calculated the frequency, calculated the frequency, f (f ( ff = 1/= 1/T)T). .
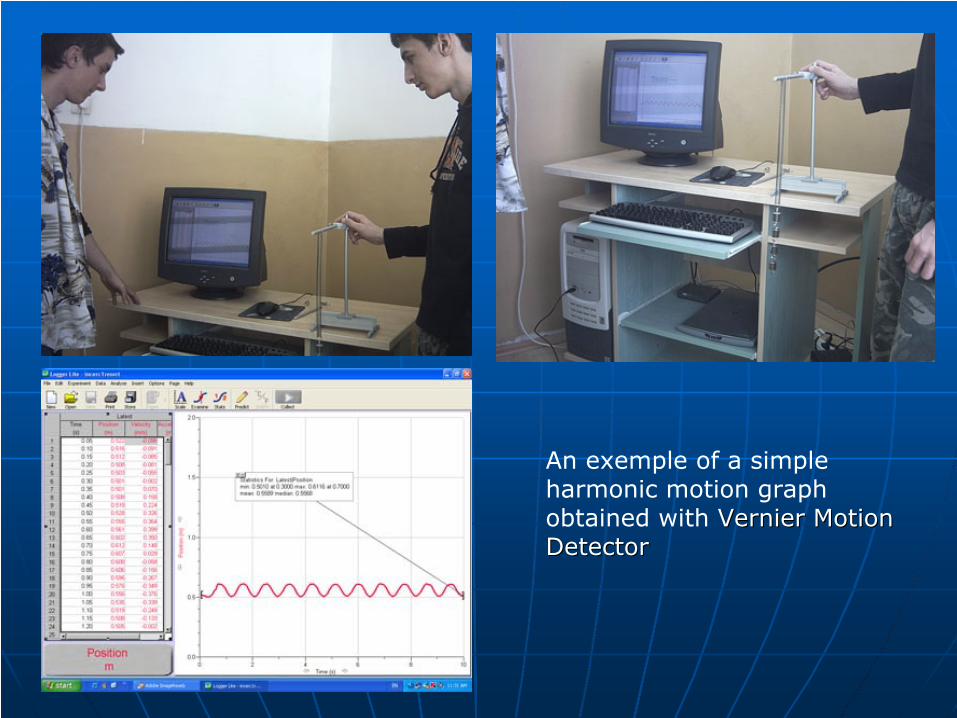
An exemple
of a simple harmonic motion graph obtained with VernierVernier
Motion Motion DetectorDetector
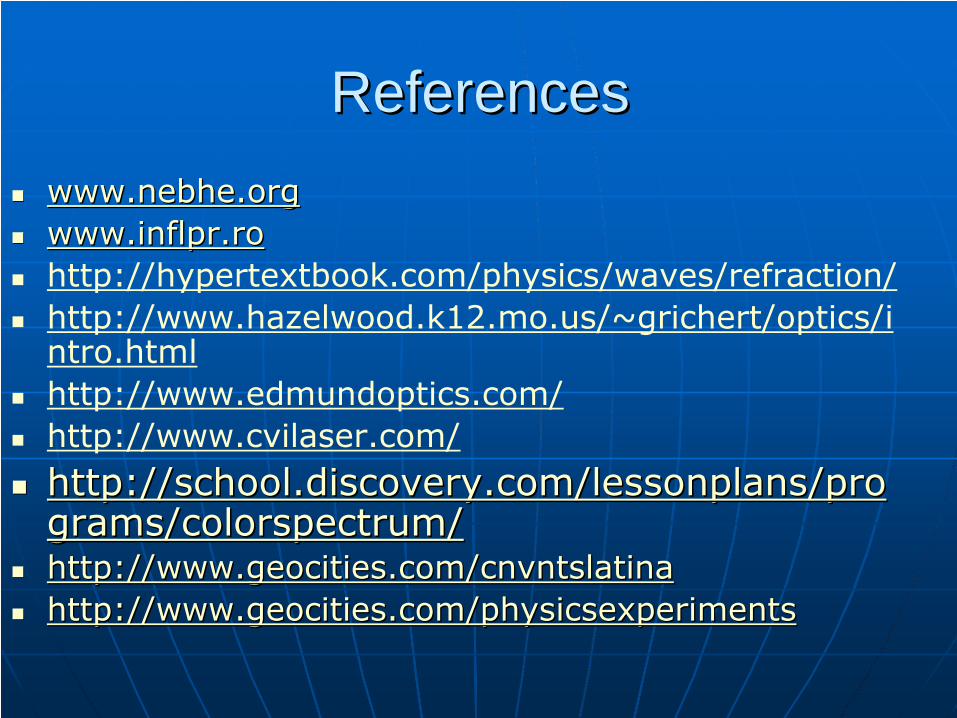
ReferencesReferenceswww.nebhe.orgwww.nebhe.orgwww.inflpr.rowww.inflpr.rohttp://hypertextbook.com/physics/waves/refraction/http://www.hazelwood.k12.mo.us/~grichert/optics/intro.htmlhttp://www.edmundoptics.com/http://www.cvilaser.com/
http://http://school.discovery.com/lessonplans/proschool.discovery.com/lessonplans/programs/colorspectrumgrams/colorspectrum//http://http://www.geocities.com/cnvntslatinawww.geocities.com/cnvntslatinahttp://http://www.geocities.com/physicsexperimentswww.geocities.com/physicsexperiments
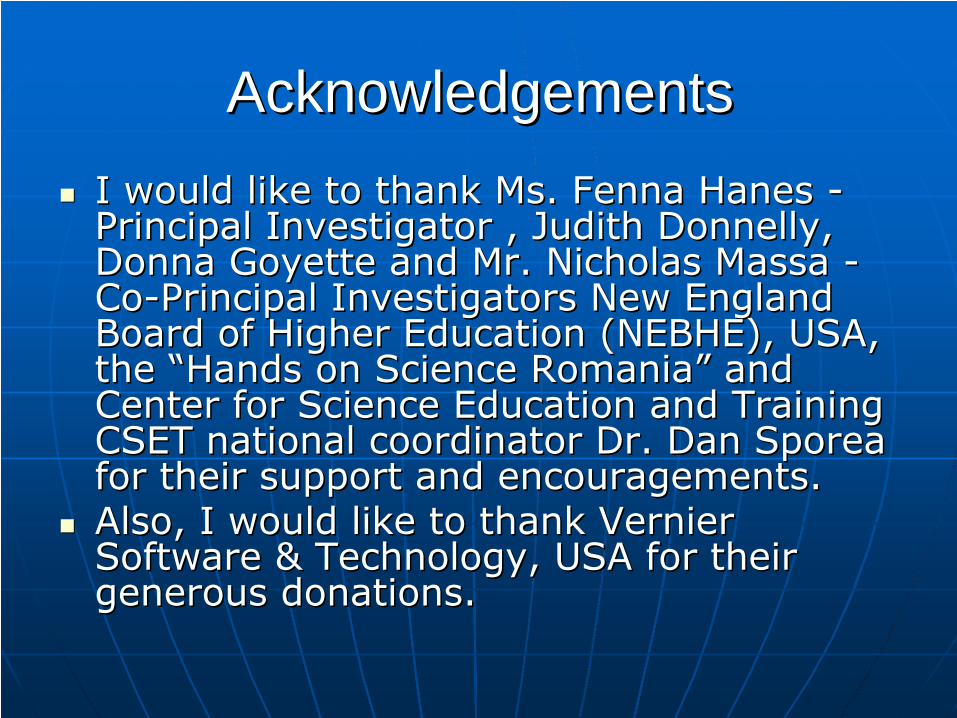
AcknowledgementsAcknowledgementsI would like to thank Ms. I would like to thank Ms. FennaFenna Hanes Hanes --Principal Investigator , Judith Donnelly, Principal Investigator , Judith Donnelly, Donna Donna GoyetteGoyette and Mr. Nicholas and Mr. Nicholas MassaMassa --CoCo--Principal Investigators New England Principal Investigators New England Board of Higher Education (NEBHE), USA, Board of Higher Education (NEBHE), USA, the “Hands on Science Romania” and the “Hands on Science Romania” and Center for Science Education and Training Center for Science Education and Training CSET national coordinator Dr. Dan CSET national coordinator Dr. Dan SporeaSporeafor their support and encouragements. for their support and encouragements. Also, I would like to thank Also, I would like to thank VernierVernierSoftware & Technology, USA for their Software & Technology, USA for their generous donations.generous donations.
![1941] Fauna of Newdownloads.hindawi.com/journals/psyche/1941/041692.pdf · 2019-08-01 · 1941] Spider Fauna of NewEngland 131 the first issue of its "Fauna of NewEngland";the ninth](https://img.pdfslide.us/doc/110x75/5e97ce969339886a9725f218/1941-fauna-of-2019-08-01-1941-spider-fauna-of-newengland-131-the-first-issue.jpg)