Embed Size (px)
Citation preview

Experimental Design Overview
Southern China Monsoon Rainfall Experiment (SCMREX)
A WMO/WWRP Research and Development Project (RDP)
March 25, 2013

Table of Content Executive
Summary
1. Introduction 1.1 History
1.2 Motivation 1.3 Goals
2. Scientific Objectives and Hypotheses 3. Field Campaigns 3.1 Experiment time
3.2 Experiment area 3.3 Experiment design 3.4 Experiment measurements 3.4.1 Upper air observation
3.4.2 Surface observation 3.4.3 Precipitation system observation 3.4.4 Satellite observation
3.5 Experiment organization 4. Numerical Modeling Study
4.1 Improvement of the initial field 4.2 Improvement of the model physical processes 4.3 Meso-scale ensemble prediction (MEP) experiments 5. Data Collection, Processing and Sharing
6. Programme Management 7. International Participation and Collaboration 8. Implementation Schedule
Acknowledgments
References

Executive Summary
During the early summer rainy season (April to June) of China, frequency and intensity of
torrential-rain in South China increase after the onset of South China Sea (SCS) Monsoon in
late May, being a serious threat to people’s lives and properties and causing great economic
losses. To expedite our understanding of processes key to the torrential rain formation and our
efforts to improve simulation and prediction of the torrential rain, the China Meteorological
Administration initiated and are organizing Southern China Monsoon Rainfall Experiment
(SCMREX). SCMREX consists of four integrated components: field campaign, data
collection/processing/sharing, numerical modeling study, and physical mechanism study.
The field campaign of SCMREX aims to obtain unique and composite observations of the
fine-scale structures of the convective systems and of their atmospheric environment during
the early summer rainy season. The field experiments will be launched in a region mainly
covering Guangdong, Guangxi, Hainan, Hong Kong and the offshore of SCS during
mid-April to mid-June of 2013-2014. The experiments will capture the thermodynamic and
dynamic properties of the atmosphere, the boundary-layer wind field in particular which is
of significant importance to convection initiation, by utilizing the wind profilers,
rawinsondes, GPS/MET stations, and dropsondes. Dynamic and microphysical structures of
precipitating systems will be detected not only by the Doppler weather radars and lightning
location system, but also multiple advanced remote sensing equipments in two enhanced
observing areas: 2 C-band dual-polarization radars, 1 X-band dual-polarization radar, 1
micro-rain radar, 4 raindrop distrometers, and 2 millimeter-wave cloud radars.
The numerical modeling study of SCMREX aims to reduce initial errors of numerical
weather prediction, improve physical schemes in numerical model, and conduct/evaluate
meso-scale ensemble prediction experiments. The physical mechanism studies are mainly
about (a) the roles of low-level jet, planetary boundary layer, and underlying surface on
initiation and development of the rainy storms; (b) the microphysical features and
processes of the convective systems. A scientific database and a website will be setup to
share the data sets from the field campaign and modeling study

.
SCMREX has been endorsed as a Research and Development Project (RDP) of
WMO/WWRP, and has attracted widespread participation and cooperation from many
countries such as India, Japan, Korea, Australia, and the Philippines.

1. Introduction
1.1 History
In September 2011, the Chinese Academy of Meteorological Sciences (CAMS) of China
Meteorological Administration (CMA) submitted a proposal conducting field experiments
on “Deep Convection and Intense Rainfall in Southern China during the Monsoon Outbreak
over South China Sea” to the Tropical Meteorology Research Working Group (WGTMR)
Monsoon Panel of the World Meteorological Organization/World Weather Research
Programme (WMO/WWRP). This proposal was later accepted as the WMO/WWRP
Research and Development Project (RDP), and it was treated as the key subject of the
WMO/WWRP’s “International Workshop on Heavy Monsoon Rainfall”, which was held at
CMA on 12-14 October 2011. During the morning session of October 13, Prof. Renhe
Zhang from CAMS introduced plans to conduct the above-mentioned field experiments.
Scientists from CMA/CAMS and CMA/Numerical Prediction Center reported their related
work on the numerical model development, and the modeling and analysis of monsoon
rainfall. After one-day discussion, the workshop participants affirmed the scientific
objectives of the experimental plans and CMA implement plan. Meanwhile, they made
some recommendations to improve the plans. Based on these recommendations and those
by Expert Group of the WWRP WGTMR Monsoon Panel, the above-mentioned plans were
renamed as the "Southern China Monsoon Rainfall Experiment (SCMREX), with an
improved version of the proposal. This revised proposal was submitted in January 2012 to
and later accepted by the WMO Monsoon Panel, which was recommended to the WWRP in
February 2012.
The SCMREX RDP proposal was approved during the 5th
meeting of the WWRP Joint
Scientific Committee which was held on 11-13 April 2012 at the WMO’s Headquarters in
Geneva. The WMO Executive Council’s Annual Meeting, held in Geneva on 25 June – 3
July 2012 officially approved the SCMREX RDP as the WMO/WWRP RDP.

During the WMO/WWRP’s 2nd International Workshop on Heavy Monsoon Rainfall,
which was held on 10-12 December 2012 in Kuala Lumpur, Malaysia, as an important part
of the workshop, Prof. Yali Luo from CAMS introduced the origin, scientific objectives
and implementation plans of SCMREX RDP, in the afternoon of December 11. Extensive
discussions on the scientific goals, observing systems, data sharing were carried out by
experts from China, the United States, Japan, South Korea and Australia, and other
countries. Many useful recommendations and required actions were put forward.
On 26 December 2012, CMA/Division of Science and Technology and Climate Change
organized a meeting to develop the SCMREX implementation plan, with divided tasks
for several authors. This plan was completed a couple of month later.
In recent years, the WMO/WWRP has established several research development projects
and Forecast Demonstration Project (FDP). They include the mesoscale Alpine Programme
(MAP, Bougeault et al 2001; Ranzi et al. 2007) and its predecessor; the MAP
Demonstration of Probabilistic Hydrological and Atmospheric Simulation of Flood Events
(i.e., the MAP D-Phase, Zappa, et al 2008); the IMPROVE experiment over the Cascade
Mountains of western North America aiming at improving cloud microphysical schemes
(Stoelinga et al 2003); Sydney 2000 FDP (Anderson-Berry et al. 2004) aiming at
promoting and showcasing summer convection nowcasting systems; Beijing 2008 FDP
(Wilson et al 2010) demonstrating the progress in nowcasts and the technological advances
in transforming research to applications since 2000; Beijing 2008 RDP (Duan et al. 2012)
focusing on the mesoscale ensemble forecasts; Beijing 2008 FDP and RDP both
emphasizing quantitative precipitation forecasts (QPFs), convective initiation, and summer
severe weather; the Science of Nowcasting Olympic Weather for Vancouver 2010 Olympic
(SNOW V10; Isaac et al. 2009) aiming at the winter weather nowcasts under complex
terrain.
The SCMREX RDP aims at expediting our efforts to improve the prediction of heavy
rainfall events in South China during the first rainy season through field campaigns and the
subsequent data processing and sharing, numerical modeling and

analysis. The project will improve our understanding of the structures and evolution of the
South China heavy-rain-producing storms during the monsoon outbreak period, and
improve our ability to predict these high-impact events through minimizing the errors in
initial conditions and uncertainties in physics schemes in NWP models, and
conduct/evaluate mesoscale ensemble prediction experiments. The unique background of
the East Asian monsoon (and its associated abundant moisture) plus the complex surface
conditions over South China (e.g., mesoscale mountains, plains, coastal, urban complexes;
see Figs. 1 and 3d) gives rise to the uniqueness and complexity of heavy rainfall
development during the first rainy season in South China. This also provides a great
opportunity for SCMREX RDP to extend the WMO/WWRP RDP/FDP previous
programs.
Fig. 1 Schematic surface conditions over the central field observing areas: vegetation (green), cities
(red dots) including those around the Zhu-River Delta (red circles with filled green shadings).
Triangles in red denote the location of Doppler radar in two intensive observing areas.
1.2 Motivation

Southern China is one of the rainiest regions in China, with an annual amount of over 2000
mm. The rainfall amount, accumulated from the onset in April to the end in middle or late
June, the so-called first rainy season, as the monsoon rainbelt moves northward to the
Yangtze-Huai River basin (Ding, 1994), accounts for about 50% of the annual amount. This
period often experiences the most frequent occurrences of heavy rainfall, leading to severe
flooding and inundations. So these storms endanger the safety of lives, and cause marked
property damages, often producing devastating economic losses. The first rainy season in
southern China reaches its peak in terms of occurrence frequency and rainfall intensity
during the period (Zhou et al., 2003; Fig.2). Most precipitation during the first rainy season
in South China is of convective nature with mesoscale organizational characteristics, and
more than 50% contributions to the total rainfall are from those heavy rainfall events with
the rates of more than 50 mm day-1
(Fig. 3b). Major heavy rainfall centers are typically
distributed over the coastal areas of Guangdong and Guangxi provinces, northern Guangxi
as well as the western and northern Fujian, with the maximum rainfall located in Guandong
Province (Fig. 3a). These rainfall centers correspond well to the most frequent occurrences
of deep convection.
Fig. 2 (a) The mean frequency of rainfall rates (> 50 mm day-1); and (b) the frequency
distribution of rainfall rates occurring in South China for the phases of before and after the

monsoon outbreak in South China Sea during the years of 1998-2010. The maps are obtained using
the daily rainfall observations at 0.25° resolution. The South China region is defined as the
continental area of 21o
–28o
N, 109o
–120o
E. The pre-monsoon and monsoon phases are defined as
the one month prior to the monsoon outbreak in South China Sea, and the period from the monsoon
outbreak to the beginning of the Meiyu season in the Yangtze-Huai River Basin (Luo et al. 2013).
Fig. 3 (a) The annual mean rainfall (mm); (b) the percentage of heavy rainfall (> 50 mm day-1)
contribution; and (c) the frequency of convective precipitating features (PFs) observed by TRMM
during the mature stage of the first rainy season in the years of 1998-2010; and (d) the geography
and terrain distribution in South China. A PF is defined as a contiguous area consisting of the
TRMM 2A25 (Iguchi et al. 2000) near surface raining pixels. A convective PF contains at least one
convective pixel. The criterion of a convective pixel is based on the TRMM 2A23 product ( Awaka
et al. 1998 ).
In order to better understand the heavy rainfall development during the first rainy season in
South China, we have conducted for the first time in 1977-1980 “the Southern China
Monsoon Rainfall Experiment”. Results indicate that these heavy rainfall events took place
in the warm sector, and they are accompanied by the low-level jets, mesoscale convective
systems (MCSs), and moist planetary boundary layer (PBL). The second such field
experiment was conducted in 1998 (Zhou et al. 2003). Results from this experiment reveal
some meso-β-scale structures of MCSs, and certain mechanisms by which they form. In
particular, it is shown that

high-resolution NWP models, initialized with large-scale observations, can simulate some
observed meso-β-scale features associated with the heavy rainfall events. During the
months of May-July 2008 and 2009, CAMS/the State Key Laboratory of Severe Weather
conducted the South China Heavy Rainfall Experiment (SCHeREX) with four mesoscale
observing networks distributed in South China, the low valley, and the middle valley of
Yantze-River, and the Yangtze-Huai River basin, respectively (Zhang et al., 2011). One
millimeter-wave radar and one C-band dual polarmetric Doppler radar were utilized; some
dropsondes were used over the northern South China Sea. Mesos-analysis of the SCHeREX
data and three-dimensional wind retrieval have revealed some mesoscale characteristics of
heavy rainfall events.
The previous observational analyses show that the heavy rainfall events during the first
rainy season in South China are mostly associated with mesoscale convective complexes
(MCCs). However, the linkages from convective cells to convective clusters, to MCCs and
further to regional heavy rainfall, as well as their multi-scale interactions are still unknown.
Thus, it is extremely difficult to predict the timing and location of the heavy rainfall
occurrence and its associated intensity changes. In general, we are lacking the predictability
of heavy rainfall during the first rainy season (Fig. 4), and our ability to predict the
warm-sector rainfall is much lower than that associated with the front rainfall.

Fig. 4 The TS scores of the monthly accumulated rainfall forecasts in South China for the month of
May (top), and June (bottom) 2010 (provided by CMA/NWP Center). Different color bars denote
the TS scores of forecasters, the global model of T639 and that used in Japan and German,
mesoscale models of MM5 and GRAPES. (Data source: Numerical Prediction Center, CMA)
To improve the forecast skill of heavy rainfall, it is desirable to explore the mechanisms whereby
convective initiation and subsequent mesoscale organization occur, as well as the processes leading
to rainfall intensity changes. On the other hand, it is important to improve the short-and
medium-range quantitative precipitation forecasts (QPFs) with NWP models. To achieve this
requires the accurate representation of clouds and precipitation as well as mesoscale information in
the model initial conditions, the reasonable description of the model physical processes, and the
development of ensemble prediction systems. For the model physics schemes,

the PBL and cloud microphysics deserve special attention, because (a) these heavy rainfall events
are highly associated with the PBL processes (b) the triggering of deep convection is closely related
to the flows, moisture and thermal conditions in the PBL;
(c) convective development and rainfall intensity are controlled by cloud-precipitation
physical processes, especially as the grid size decreases to 1-3 km; and (d) few studies
have been done to verify the model-simulated fine-scale structures of the PBL and
convective systems, mainly due to the lack of suitable observations. Thus, we are uncertain
about the ability of the current PBL and cloud microphysics schemes to simulate the
development of heavy rainfall during the first rainy season in South China.
Through the previous field experiments, Chinese scientists have gained valuable experience
in collecting and processing various non-conventional observational datasets (Ni et al.,
2011), and in using the data in their research and operational forecasts (Zhang et al., 2011).
However, the previous field experiments were unable to capture the inner-core
characteristics of MCSs and the underlying PBL processes leading to heavy rainfall events.
In addition, the high-resolution observations so obtained have not been applied to the
verification and improvement of physical parameterization schemes in NWP models.
Today, we have better observing facilities measuring the inner-core structures and PBL
processes during the first rainy season in South China. For example, since 2007, we have
installed 16 windprofiler radars, including 2 in Hong Kong, over Guangdong Province,
which consists of 14 PBL windprofilers and 2 tropospheric windprofilers. These
instruments will greatly improve the observational capability of low-level flows triggering
deep convection, and help us capture the low-level shear or convergence line, and
fluctuations in the LLJs. Moreover, as compared to SCHeREX, we now have more
advanced portable remote sensing equipment, to be described in section 3.4.3, which can
provide more comprehensive detection of the inner-core structures of MCSs. We have also
made significant progress in data quality control and retrieval algorithm (Hu et al. 2010,
2012; Liu et al. 2010), which would allow us to obtain more accurate information of

the microphysical and dynamic structures in the inner regions of MCSs. In addition, since
2009, CMA/National Meteorological Information Center, has began to perform the
real-time quality control of all automated surface observatories, and established a real-time
quality control system for basic meteorological variables (i.e., air temperature, air pressure,
humidity, wind speed and direction, and precipitation), with error information feedback
mechanisms (Ren et al. 2012; Ju et al. 2010a,b; Zhao et al. 2011). These high-resolution
(i.e., hourly and a grid spacing of about 10 km) continuous surface observations have
provided us with new opportunities to carry out surface meso-analysis, and investigate the
mechanisms whereby heavy precipitation develops.
1.3 Goals
With the above-mentioned favorable background conditions, CMA conducts the
international research and development project of “Southern China Monsoon Rainfall
Experiment” with the following goals: (i) To obtain comprehensive observational datasets
that could be shared among researchers of interest and then used to describe MCSs and
their environmental conditions during the first rainy season in South China;
(ii) To improve simulation and QPF of the torrential rain through advancing data
assimilation technique and improving physics parameterizations in model and by
conducting/evaluating mesoscale ensemble prediction (MEP) experiments. (iii) To increase
our knowledge on the development of heavy rainfall in the warm sector and the associated
dynamical and microphysical processes; and (iv) To establish a high-quality meteorological
data bank to facilitate future scientific exchange.
2. Scientific Objectives and Hypotheses
This project is targeted to the following four broad scientific questions focusing on the
prefrontal and/or warm-sector linear convective lines and nonlinear cloud clusters in
central Guangdong province during mid-April to mid-June.
(1) The role of low level jet (LLJ) in the convection initiation and the

development/maintenance of the warm-sector heavy-rain-producing MCS
LLJ is one of the main weather components that may trigger the heavy rainfall in south
China in early summer rainy season (Bao 1986; Ding et al. 2011). About 75-80% of the
heavy rainfall events (>50 mm/day) are associated with LLJ (Zhao and Wang 2009).
Statistic shows that 16 out of 19 strong LLJ processes in Guangdong during May and June
of 1970-1973 were followed by heavy rainfall of > 100 mm/day (Bao 1986). About 94% of
heavy rainfall events in North Taiwan are also accompanied by LLJ at 850hPa (Chen et al.
2005). Studies show that the appearance of LLJ above 2 km is usually a couple of hours
ahead of the occurrence of severe heavy rain (Liu et al. 2003; Cao et al. 2006). The
appearance of severe heavy rain is better associated with the intensification of LLJ and
downward expansion to below 1.5-2 km. It is hypothesized that the intensification and
downward expansion of LLJ play important roles in triggering the severe heavy rain likely
through providing moisture, heat, energy and disturbance and/or trigger inertial gravity
wave.
This project will use the obtained comprehensive data set and numerical simulation and
dynamic diagnoses to examine the evolution features of the LLJ, the interaction between
LLJ and upper tropospheric systems (such as south Asia high) and its impact on the
initiation and development of warm-sector heavy-rain-producing MCS.
(2) The roles of boundary layer processes and underlying surface on the initiation
and evolution of the heavy-rain-producing MCS
The topography of Guangdong province is very complicated which involves land-sea,
mountain-valley, and city-rural contrasts. The nonlinear interaction between underlying
surface and large-scale environmental flow may lead to the development of mesoscale
disturbance such as the convergent lines and/or vortex to trigger convection initiation.
Land-sea contrast may produce apparent convergence in coastal area during land breeze
phase from mid-night to early morning and apparent convergence in inner land area during
sea breeze phase from afternoon to early evening (Bao 1986). The trumpet shape
mountain-valley distribution around Zhujiang

River delta area is favorable for the convergence between westerly or southwesterly flow
and southeasterly flow. Heating differences between city and rural areas in the central part
of Guangdong province may trigger local mesoscale circulation and thus mesoscale
disturbance. Mesoscale boundaries such as convergent lines may form due to the complex
interaction between above mentioned various local mesoscale circulations forced by
topography and PBL processes or between the local mesoscale circulations and background
flow.
This project will use the obtained comprehensive data set and numerical simulation and
dynamic diagnoses to examine the roles of boundary layer processes and underlying
surface (such as sea breeze, mountain-valley wind, urban heat island, PBL rolls, convergent
lines, and mesoscale convective vortex) on the initiation and evolution of the
heavy-rain-producing MCS.
(3) The microphysical processes in the heavy-rain-producing MCS
Microphysical processes in the heavy-rain-producing MCS are closely related to the
precipitation properties such as the intensity, efficiency, lightening, and more importantly
the accuracy of microphysics parameterization scheme of NWP. The rain rate in the warm
sector is generally much larger than that at front which may be closely related to
microphysical properties. Observations on the microphysical properties of the MCSs in
early summer rainy season in South China were very limited in previous field experiments
due to the unavailability of polarimetric radars. Numerical studies indicated that both ice
cloud and warm cloud could be the main microphysical process of the MCSs in early
summer rainy season in South China (e.g., Wang et al. 2002).
This project is aimed to examine the key microphysics and the distribution of hydrometers
in warm-sector heavy-rainfall-producing MCS in South China based on the
dual-polarimetric radar, micro rain radar, millimeter wave cloud radar, raindrop
disdrometer in combination with satellite products such as TRMM and CloudSat.
(4) Key differences of the warm sector and frontal heavy rainfall before and after the
onset of SCS monsoon

Heavy rains in warm sector and at front are the two main rainfall categories in early summer
in South China. Previous case studies show that these two kinds of heavy rain have apparent
differences in the rainfall features and their formation environment (Zhao et al. 2008; Zhang
and Ni 2009). Heavy rains in warm sector are more convective and intensive than at front.
The environment of the heavy rain in warm sector has stronger upper level divergence than
lower level convergence, greater convective instability, while the environment of the heavy
rain at front has stronger lower level convergence than upper level divergence and greater
symmetric instability. Warm-sector heavy rain has more direct influence from monsoon,
less direct influence from cold air, stronger low-level vertical wind shear, smaller
convective inhibition, higher column precipitable water relative to that at front. The
behavior of inertial gravity wave triggered by the enhancement of vertical wind shear due to
cold air intrusion and their roles in the convection initiation of frontal and warm-sector
heavy rainfall could be different. The two kinds of rainfall may also have different
microphysical processes and different initiation and maintenance mechanisms partly due to
possible different impacts from mountain-valley and land-sea contrasts.
This project will use the obtained comprehensive data set and numerical simulation and
dynamic diagnoses to examine the different convection-initiation mechanism and
microphysical properties of the warm sector rainfalls before and after the onset of monsoon
under the apparently different common flow and moisture supply, as well as the differences
in the evolution and microphysical processes of warm-sector and frontal rainfall, the
isolated and linearly organized convections.
3. Field Campaigns
3.1 Experiment time
The field experiment is planned to take place in southern China during
mid-April to mid-June 2013/2014. The first rainy season in Southern
China is from April to June

with a peak occurring between the onset of the South China Sea monsoon and the
northward shift of its rain belt to the Yangtz-Huai River Valleys. In the past 15
years (1998-2012), the earliest onset of the SCS monsoon took place on 5 May
(2008) and the latest on 26 May (2005/2009)
(http://cmdp.ncc.cma.gov.cn/Monitoring/monsoon.htm). The average duration
from the SCS monsoon onset to the ending of the first rainy season in Southern
China is about 31 days (Luo et al. 2013). Therefore, observation between April and
June would most probably capture the heavy rainfall processes before and after the
monsoon’s onset during the first rainy season in Southern China.
3.2 Experiment area
The observation areas of the field campaign are designed at three levels of scale, i.e., the
large-, meso-, and cloud-convective-scales. The large-scale observing network covers
Guangdong, Guangxi, Hainan, most part of Fujian, the southern part of Jiangxi, Hunan and
Guizhou, as well as Hong Kong and the adjacent oceanic areas (Fig. 5). The major
observation area (also called “the mesoscale observing area”) includes Guangdong and the
adjacent oceanic regions as well as eastern Guangxi (Figs. 5 and Fig. 6). The underlying
conditions over the mesoscale observation area are very complicated (Fig. 1 and Fig. 3d):
Guangdong is adjacent to northern South China Sea with complicated land topography
lower in the southern side and higher in the northern side; mountains such as Yunwu,
Lianhua, Qingyun, Huashi are scattered in this area; the Pearl River Delta city group is
located in the central plain area of Guangdong. Thus, this observation area is a natural
experimental base to carry out research on the southwest monsoon, land and sea breeze,
mountain-valley winds and urban influences. Within the meso-scale observation area, there
are two cloud-convective-scale observation areas.

Figure 5 Distribution of major instruments in the observing network. Blue and red rectangles
represent the boundaries of the large-scale and meso-scale observing networks, respectively.

3.3 Experiment design
Large-scale observing network
This network builds upon the meteorological operational observation network at
Guangdong, Guangxi, Hainan, and Hong Kong, that consists mainly of the radiosonde
sounding stations, weather radars, ground-based GPS water vapor stations, AWSs, and
satellites. During intensive observation period, observations in the sounding stations in
Guangdong, Hainan and Hong Kong will increase from the routine of twice per day to 4
times per day. These data should provide information on thermodynamics in the
atmosphere.
Meso-scale observing network
Information to be obtained is important for the understanding of the trigger mechanism in
the meso-scale. The equipments employed in this campaign include 16 fixed wind-profiling
radars (14 boundary layer wind-profiling radars plus 2 troposphere profiling radars) and 2
mobile boundary layer wind-profiling radars. The two mobile boundary layer wind profiler
radars, which are used to record information on the atmospheric boundary layer wind field,
(blue five-pointed star in Fig. 5 and Fig. 6) will be placed at Yangjiang and Qingyuan to
complement the fixed wind profiler radar (red five-pointed star in Fig. 5 and Fig. 6)
network and provide data comparable with upper air radiosounding observations. We also
plan to carry out dropsonde experiments by using airforce aircrafts over the northern South
China Sea when possible. Moreover, 11 operational Doppler weather radars are put in place
to cover the entire range of the studied region, making it possible to record the evolution of
the precipitating convective system.
Intensive Observation area of Convective Systems
Two intensive observation stations will been built. The dynamic and microphysical
structures inside convective systems will be acquired by remote sensing instruments
including 2 C-band dual polarization radars, 1 X-band dual

polarization radar, 2 millimeter wave radars, 1 micro precipitation radar and 4 rain drop
disdrometers. Two sites for intensive observation have been selected based on the
distribution of the averaged precipitation over the South China during the first rainy season
in South China (Fig. 3a and Fig. 3b). One is near Yangjiang-Enping located along the
southwestern coast of Guangdong, the other is near Fugang-Longmen located in the central
part of Guangdong and about 100 km from the southwestern coast. This design help capture
the different aspects of the nature of precipitation systems. In addition, observations
obtained by the Doppler weather radar stations in Yangjiang and Heyuan can be compared
with that obtained by the mobile dual polarization radar.
The 2 mobile C-band dual polarization radars will be placed at Enping and Xinfeng
meteorological stations, respectively. The radar in Enping station is about 49 km from the
S-band Doppler radar in Yangjiang station, and that in Xinfeng station is about 58 km from
S-band Doppler radar in Heyuan station. The two set of radar not only allow data to be
analyzed in parallel, but also make it is possible to examine wind retrievals. A X-band dual
polarization radar will be placed near Enping and Yangjiang to be compared with C-band
and S-band Doppler radar observations.
The placement of instruments including 1 micro rain radar, 4 raindrop disdrometers, 2
millimeter wave cloud radars in 2013 will differ from that in 2014. During the pre-phase
experiment period, all of the instruments will be concentrated near Yangjiang and Enping.
The comparisons will be made among the 4 raindrop distrometers, between the raindrop
disdrometer and rain gauge observations, between the lowest-level (10-200 m height)
precipitation retrieved by micro rain radar and rain gauge observations, and between the 2
millimeter wave cloud radars. During the formal experiment in 2014, the 4 raindrop
spectrometers and 2 millimeter wave cloud radar will be divided into 2 groups to observe
in the two intensive observing areas, respectively, and the micro rain radar will still be
placed around Yangjiang and Enping.

Figure 6 Distribution of major instruments in the meso-scale observing network.

Figure 7 Schematic diagram of the coverage of dual-Doppler radar 3D wind field retrieval on 2, 4,
6, 8 km altitudes for the S-band radar at Yangjiang and the C-band polarimetric radar at Enping.
The distance between the two radars is about 49 km.
Figure 8 Similar to Figure 7, except for the radars at Heyuan and Xinfeng.

3.4 Experiment measurements
3.4.1 Upper air observation
1) Wind-profiling radars
In the meso-scale observing network, there will be 16 fixed (red stars in Fig. 6; 14
boundary layer radars, 2 troposphere radars) and 2 mobile wind-profiling radars (blue stars
in Fig. 6). Wind profiler is a five-wave beam radio remote sensing instrument. Based on
Bragg scattering theory, each antenna can measure radial velocity through several signal
and data processing such as coherent accumulate, FFT transform, spectrum average, etc.
Final products such as profile of horizontal wind, vertical velocity and atmospheric
structure constant of refractive index can then be obtained .
According to the different working frequency and detecting range, wind profilers are
classified into three types: stratosphere wind profiler (46–68MHz), troposphere wind
profiler (440–450MHz) and boundary layer wind profiler (1270–1295MHz,
1300–1375MHz). The two latter wind profilers are widely used in China at present.
Based on wind profiler standards of functional specification and data format established by
China Meteorology Administration, wind profiler observation data include: real time wind
profile data, half-hour averaged wind profile data and one-hour averaged wind profile data.
All of these data contain radial velocity, spectrum width, SNR, horizontal wind, vertical
velocity and power spectrum density.

Table 1 wind profiler fundamental characteristics
2) Radiosonding stations
Twenty-two upper air sounding stations (blue dots in Fig. 5) , built by China
Meteorological Administration (CMA) are put in place in the experiment area to conduct
operational observation twice per day. Eight of them (4 in Guangdong, 3 in Hainan and 1
in Hong Kong) will release radiosondes four times a day during intensive observation.
3) GPS/MET stations
There are 85 ground-based GPS water vapor observation stations in the large-scale
observing network, among which 35 are located in the meso-scale region (black triangles in
Figs. 5 and 6). They are designed to measure precipitable water in the atmospheric column
at one hour interval.
4) Air-borne dropsonde observation
Hong Kong Observatory, one of the international participants of the SCMREX
Boundary layer wind
profiler
Troposphere wind
profiler
Frequency of operation 1320MHz 445 MHz
Beam width ≤4.5º ≤4.5º
Transmitter power ≥2kW ≥6kW
Maximum detecting range 3-5km 6-8km
Minimum detecting range 100m 150m
Range resolution 60m 120m
Time resolution ≤6分钟 ≤6分钟
Maximum detecting range of
vertical velocity ±20m/s ±24m/s
Measuring precision of wind
speed ≤1.5m/s (RMS) ≤1.5m/s (RMS)
Measuring precision of
vertical velocity ≤0.2m/s ≤0.2m/s
Measuring precision of wind
direction ≤10°(RMS) ≤10°(RMS)

RDP, plans to implement the air-borne dropsonde observation in the northern region of the
South China Sea to collect the upper-air meteorological data of upstream atmosphere
within the trial period in 2014.
3.4.2 Surface observation
Land-based (in situ) observation network consists of national-level automatic weather
stations (AWSs) with observers on duty and regional AWSs. There are 366 national-level
stations (black dots in Fig. 5) within the large-scale area; 113 national-level stations and
1,503 regional AWSs are located in the meso-scale region with an average distance of
about 10 km. They will provide temperature, sea level pressure, humidity, wind
direction/speed, and precipitation observations every hour.
3.4.3 Precipitation system observation
1) Doppler weather radar
There are 22 Doppler weather radars in the large-scale observing network. The 11 radars in
the mesoscale region are S band, of which nine are SA radars, named CINRAD-SA in
China and Internationally known as WSR-98D, produced by Beijing METSTAR Radar
Co,. Ltd. The specifications of the SINRAD-SA (Table 2) are similar to those of the
WSR-88D of US (http://www.roc.noaa.gov/). The volume scan pattern of the radars is
VCP21, with 9 elevation angles from 0.5o
to 19.5o
. The scan period is 6 minutes.
Table 2 CINRAD-SA Radar Parameters
2) Dual polarimetric radar
Wavelength
(cm)
Beam
width
(°)
Antenna
Gain (dB)
First
Sidelobe
(dB)
Terminal
Sidelobe
(dB)
Transmitting
Power (kW)
Sensitivity (dBm)
Dynamic
Range (dB)
10 ≤0.99 ≥44dB ≤-29 ≤-42 ≥750 ≤-107 ≥85

Two C-and one X-band mobile dual polarimetric radars (the main technical parameters are
listed in Table 3, and the performance parameters in Table 4, respectively) will participate
in the field experiment. Dual polarimetric radar has the significant advantage over ordinary
Doppler weather radar on quantitative precipitation estimation, drop size distribution
inversion, hydrometeor phase identification, etc. (Hu et al., 2010, 2012; Liu et al., 2010;
Chu et al. 1997). The reason is that the amplitude, phase, frequency, and polarization state
of electromagnetic wave will be changed during scattering and propagation process. In
contrast with ordinary Doppler radar, polarization radar has the capability of detecting the
echoes in different polarimetric directions, which can alternately or simultaneously transmit
and receive the echo signals in horizontal and vertical directions. It can also measure
polarimetric parameters, such as the difference of
reflectivity between the two directions (differential reflectivity, ZDR
), cross-
polarization reflectivity (de-polar reflectivity, LDR
), the difference of phase
(differential propagation phase shift, Φdp
), specific differential propagation phase
shift ( K ), and correlation coefficient ( ρ ) between the two directions, as well as DP HV
the echo intensity in horizontal direction (ZH), radial velocity (Vr), and spectrum width (SW)
(Seliga and Bringi 1976; Matrosov et al. 2002; Hu et al. 2008, 2010, 2012).
As examples, Fig. 9 shows the plane position indicator (PPI) pictures of ZH (dBZ), ZDR
(dB), KDP (0
km-1
), and ρHV detected with the C-band dual polarimetric radar, which was
developed by State Key Laboratory of Severe Weather (LaSW) in 2008, in the 4.500
elevation at 0943 BST June 6, 2008 in Boluo, Guangdong province. Fig. 10 shows the
inversion products, which include the phase identification, raindrop mean diameter (D0,
unit: mm), numerical density (N0, unit: 105
mm-1
m-3
), and liquid water content (Lw, unit: g
m-3
). (Fig. 9 and 10 are attached at the end).

Table 3 Main technical parameters of the dual polarimetric radar
Table 4. Specification of dual polarimetric radar
3) Micro Rain Radar (MRR)
One MRR made by METEK (http://www.metek.de/) will be used in the
Wave length C-band X-band
Antenna
Diameter Gain
Beam width First
side lobe Isolation
3.2 m 40 dB 1.4° -32 dB 31
dB
2.4 m 45 dB 1.0° -31 dB 41
dB
Transmitter
Wavelength Pulse
width Peak power
PRF
5.5 cm 1.0/2.0 μs; 150/300m
268 kW 300-1300 Hz
3.2 cm 1.0/0.5 μs; 125/62.5
m 52 kW 300-2000 Hz
Receiver
Polarization
Minimum
detectable power
Noise Dynamic
range
Simultaneous transmitting
and receiving (STSR) -110
dBm 2.9 dB 87 dB (linear)
Alternate transmitting but
simultaneous receiving
(ATSR) -110 dBm 2.3 dB 90
dB (linear)
Band Performance Parameters
Volume
scan
(min)
Detection
Range (km)
Elevaztion
Number
C-band Reflectivity (ZH), Radial velocity (Vr),
Spectral Width (SW), Differential
reflectivity (ZDR), phase shift (ΦDP),
cross-correcting coefficient (ρHV)
6 150 9, 14
X-band
Reflectivity (ZH), Radial velocity (Vr),
Spectral Width (SW), Differential
reflectivity (ZDR), phase shift (ΦDP),
cross-correcting coefficient (ρHV),
Linear depolarization reflectivity (LDR)
6 125 9, 14

experiment, and its main technique variables are described in Table 5. The MRR is a
compact 24.1 GHz FM-CW radar for the measurement of profiles of drop size distributions
and, derived from this, rain rates, liquid water content and characteristic falling velocity
resolved into 30 range gates. MRR can detect very small amounts of precipitation, which
isbelow the detecting threshold of conventional rain gauges. Due to the large scattering
volume (compared to in situ sensors), statistically stable drop size distributions can be
derived within a few seconds. The droplet number concentration in each drop-diameter bin
is derived from the backscatter intensity in each corresponding frequency bin, with
assumption of the relation between terminal falling velocity and drop size.
Table 5 Specification of MRR
4) Raindrop disdrometer
Four raindrop disdrometers made by OTT
( http://www.ott.com/web/ott_uk.nsf/id/pa_parsivel2_e.html ) will be used in the experiment.
Based on operational principle of photoelectric effects, raindrop special density, fall speed and
raindrop size can be measured when raindrops fall through the rectangle sample connection
(180×30 mm). Raindrop diameter and fall speed are
Specification
Frequency (wavelength) 24.1 GHz (1.25 cm)
Transmit power 50 mW
Modulation FM-CW
Beam width(two way, 6 dB) 2°
Antenna Offset parabolic dish of 60cm diameter
Pointing direction vertical
Range resolution 10 m – 200 m
Lowest analyzed range 10 m – 200m
Number of range gates 30
Temporal resolution 1 min
Physical dimension 60 cm X 60 cm X 60 cm
Total weight 12 kg

classified into 32 grades. The measuring precision of raindrop size and fall speed and their
corresponding grades are: 0.125 mm and 0.1m/s in 1-10 grades, 0.25 mm and 0.2m/s in
11-15 grades, 0.5 mm and 0.4m/s in 16-20 grades, 1mm and 0.8m/s in 21-25 grades, 2mm
and 1.6m/s in 26-30 grades, 3mm and3.2m/s in 31-32 grades, respectively. From the
raindrop diameter and fall speed, a variety of properties can be deduced: raindrop size
distribution, rain intensity, visibility, energy of raindrop motion and precipitation type
(such as drizzle, rain, sleet, hail, snow, fog).
Table 6 Specification of raindrop disdrometer
5) Millimeter-wave radar
The Ka band cloud radar from State Key laboratory of Severe weather (LaSW), Chinese
Academy of Meteorological Sciences, and Institute of Heavy Rain, Wuhan (WHIHR)
(Table 7) will be used to observe the internal structures of nonprecipitating and weakly
precipitating clouds with excellent sensitivity, spatial and temporal resolutions, and
accuracy. The cloud and precipitation parameters, such as cloud and precipitation drop size
distribution (DSD), air vertical speed and turbulent fluctuation standard deviation (σ) could
be retrieved from reflectivity, velocity , spectral width and Doppler spectral density data
that are directly measured by the cloud radars (Gossard, 1994; Gossard et al., 1997). The
cloud radar of LaSW normally operates in vertically pointing mode while the cloud radar
of WHIHR can operate in scan mode.
Specification
Measurement range of raindrop diameter 0.2—25 mm, 32 grades
Measurement range of raindrop fall speed 0.2—20 m/s, 32 grades
Precipitation type None, drizzle, light rain, rain, sleet, snow, hail, fog
Judgmental accuracy of precipitation type Coincidence rate exceed 97% under the condition of
drizzle, hail and snow
Measurement range of precipitation 0.001—1200 mm/h
Measurement accuracy of precipitation ± 5% (liquid state), ± 10% (snow), ± 20% (solid state)
Visibility 10—5000 m, ±10%
Measurement interval 15sec—60min
Measuring and sampling area 54 cm2

The minimum observation ranges are 500m and 150m for the LaSW and WHIHR radars,
respectively.
Table7 Specification of Ka band (35GHz) radar
6) Lightning location system (LLS)
Meteorological bureaus in Guangdong province, Hongkong, and Macao started to jointly
construct the Guangdong-Hong Kong-Macao LLS in 2005. Five sub-stations were built in
2005, with the 6th sub-station added in Sep 2007, and another 11 sub-stations in 2012. As a
whole, 7 IMPACT sensors and 10 LS-7000 sensors are employed in the Guangdong-Hong
Kong-Macao LLS (Fig. 11). The combined MDF/TOA technology is also used to detect CG
lightning stroke information such as longitude and latitude, GPS time, peak current, polarity
and
Institute Institute of Heavy Rainfall,
Wuhan, CMA CAMS
Antenna
Diameter Gain
Beam width First
side lobe Cross
polarization
isolation
1.5 m 53 dB 0.4° -27 dB 32
dB
1.3 m 50 dB 0.44 -30 dB 33
dB
Transmitter
Wavelength Pulse
length Peak power
PRF
0.86 mm 1.32/0.66/0.33μs
0.67kW 2000-4000Hz
0.86 mm 0.3/1.5/20/40μs
0.6kW 2500 or 5000Hz
Receiver
Mode Sensitivity
Noise figure
Dynamic range
Transmit H, receive H and
-110 dBm 4.9 dB 84dB
Transmit H, receive H and
≤-98.4 dBm ≤5.6 dB 70dB
Platform mobile mobile
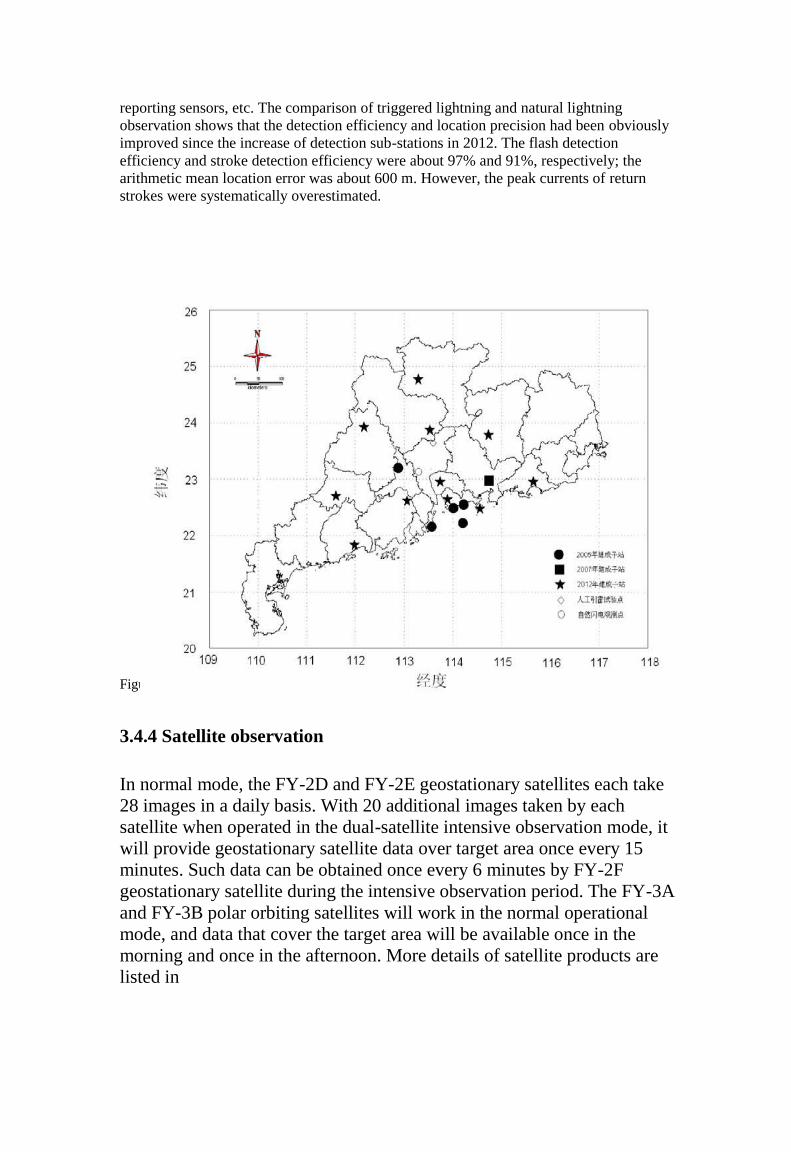
reporting sensors, etc. The comparison of triggered lightning and natural lightning
observation shows that the detection efficiency and location precision had been obviously
improved since the increase of detection sub-stations in 2012. The flash detection
efficiency and stroke detection efficiency were about 97% and 91%, respectively; the
arithmetic mean location error was about 600 m. However, the peak currents of return
strokes were systematically overestimated.
Figure 11 Distribution of sub-stations in the Guangdong-Hong Kong-Macao LLS
3.4.4 Satellite observation
In normal mode, the FY-2D and FY-2E geostationary satellites each take
28 images in a daily basis. With 20 additional images taken by each
satellite when operated in the dual-satellite intensive observation mode, it
will provide geostationary satellite data over target area once every 15
minutes. Such data can be obtained once every 6 minutes by FY-2F
geostationary satellite during the intensive observation period. The FY-3A
and FY-3B polar orbiting satellites will work in the normal operational
mode, and data that cover the target area will be available once in the
morning and once in the afternoon. More details of satellite products are
listed in

Table
8. Table 8 Satellite Products

Product name Spatial coverage and resolutions Frequency
FY-2E Precipitation Estimation 55°E-155°E,50°N-0°N, 0.1°×0.1° 24 times per day
FY-2E Atmospheric Motion Vectors 55°E-155°E,50°N-50°S, 1°×1° 4 times per day
FY-2E Cloud total Amount 55°E-155°E,50°N-50°S, 0.1°×0.1° 24 times per day
FY-2E Upper Troposphere Humidity 55°E-155°E,50°N-50°S, 0.1°×0.1° 8 times per day
FY-2E Humidity Profile derived from
Cloud Analysis
55°E-155°E,50°N-50°S, 0.1°×0.1° 8 times per day
FY-2E Total Precipitation Water for
Clear Sky
55°E-155°E,50°N-50°S, 0.1°×0.1° 8 times per day
FY-2E Cloud Classification 55°E-155°E,50°N-50°S, 0.1°×0.1° 24 times per day
FY-2D precipitation estimation
products
37°E-137°E,50°N-0°N, 0.1°×0.1° 24 times per day
FY-2D Atmospheric Motion Vectors 37°E-137°E,50°N-50°S, 1°×1° 4 times per day
FY-2D Cloud total Amount 27°E-147°E,60°N-60°S, 0.1°×0.1° 24 times per day
FY-2D Upper Troposphere Humidity 27°E-147°E,60°N-60°S, 0.1°×0.1° 8 times per day
FY-2D Humidity Profile derived
from Cloud Analysis
27°E-147°E,60°N-60°S, 0.1°×0.1° 8 times per day
FY-2D Total Precipitation Water for
Clear Sky
27°E-147°E,60°N-60°S, 0.1°×0.1° 8 times per day
FY-2D Cloud Classification 27°E-147°E,60°N-60°S, 0.1°×0.1° 24 times per day
FY-3A/VIRR Cloud Physical
Parameters
Global, 5km 1 times per day
FY-3A/VIRR Cloud Amount and
Cloud Type
Global, 5km 1 times per day
FY-3B/VIRR Cloud Physical
Parameters
Global, 5km 1 times per day
FY-3B/VIRR Cloud Amount and
Cloud Type
Global, 5km 1 times per day

3.5 Experiment organization/frame
31 / 52

In order to direct the science experiment in a more unified and integrated manner, the field
experiment operation center will be established at China Meteorological Administration
(CMA) Southern China regional meteorological center. The operation center is responsible
for the command and coordination of the science experiment over the testing regions. The
observational period of the field experiment (mid-April to mid-June) is divided into two
categories: routine observational period and intensive observation period. Routine
observational period is defined when the forecast predicts that no precipitation systems
would be affecting the testing region, and that the operational weather radar network does
not detect any precipitation systems moving into the testing region in the next 24 hours.
Intensive observation period is defined, when any precipitation system is forecasted to
influence the testing region, or when the operational weather radar network detects any
precipitation systems that will be moving into the testing region in the next 24 hours, in
which case the operation center will give the instruction immediately and enter the
intensive observation period. The intensive observation will not be stopped until the
systems fade away or move out the testing region. During the intensive observation period,
Mobile C, X-band dual linear polarization radar, millimeter wave cloud detection radar
will be launched, and the temporal intense observations (from 2-time per day to 4-time per
day) will be made in the observation stations over Guangdong, Guangxi and Hainan
provinces. Furthermore, air-borne dropsonde observation (Hong Kong Observatory) plans
to be launched over northern SCS when necessary. The other observational systems and
equipments will keep running as regular during both the routine observation period and the
intense observation period.
During the middle of the observation period, the review meeting will be convened in
middle or late May. Main directors of each team should report the data situation collected in
the test, discuss whether the experimental design should be partially adjusted, and
meanwhile accordingly modify the deficiency of the experimental design.
4. Numerical Modeling Study

Because errors in the initial conditions of model simulations are present and the model
parameterization schemes are insufficiently representative of meso-and micro-scale
physical processes in reality, the forecast of heavy rainfall in the warm sector is less
accurate than that of the front-associated rainfall. It has been demonstrated that numerical
simulations of a meso-scale convective system in the warm season is quite sensitive to the
initial atmospheric conditions and the model physical parameterization schemes adopted
(Luo et al. 2010; Wu et al. 2013). Compared with the single forecast, ensemble forecasts
can provide further information on the uncertainty (Toth and Kalnay 1993, Tracton and
Kalnay 1993), accuracy and predictability of the numerical models. This project will use
data collected during the field experiment (2013-2014) and, along with other historical
observations/data, to improve the model initial conditions and model physical processes, to
carry out ensemble experiments, and to examine the model capability.
4.1 Improvement of the initial field
The quality of the initial field is important for the short-term numerical weather prediction
(NWP). It is a also the key to improving heavy rainfall forecasts during the early summer
rainy season in South China and understanding corresponding physical mechanisms. A
good initial field can also serve as the foundation stone for the construction of
representative ensemble forecasts and their perturbation. Data assimilation has been used to
reduce initial condition error. Applications of different methodologies in data assimilations
of weather systems have been proposed and well developed, ranging from single
conventional measurement to sorts of nonconventional measurements and from the single
time observation to multi-times, such as the evaluation from the simple interpolation,
successive correlation (Barnes,1964), optimal interpolation (OI) (Bratseth,1986) and three
dimensional variation (3DVAR) (Lorenc,1981;Parrish and Derber,1992;Anderson et al.,
1998) to ensemble Kalman filter (EnKF) (EnKF,Houtekamer et al.,1996; Hamill and
Snyder,2000) and four dimensional variation (4DVAR) (Lewis and

Derber 1985;Courtier and Talagrand 1990). More and more measurements are better
assimilated due to the continuous advance in data assimilation methodology. Nowadays,
various studies based on different measurements take account of the impact on analysis and
forecast, and propose a lot of assessment methods (Purser and Huang 1993;Cardinali et al.
2004;Chapnik et al. 2004). The advanced methodologies help reveal how the assimilated
measurements affect the model forecast via the data assimilation system, and what roles the
measurements and background field in the analysis and forecast play. Based on these
findings, an improved method of assimilation system can be proposed.
This project will use various measurements collected by different observation platforms to
investigate the correspondent data assimilation methods and to quantitatively verify the
analysis obtained through data assimilation. The dataset created by our data assimilation
system will be open to researchers of interests. A number of assimilation methods, such as
3DVAR, 4DVAR, EnKF and the hybrid method (Hamill and Snyder,2000), will be
adopted to generate the accurate analytic data during the early summer rainy season in
South China and study the impacts aroused by various situ measurements on forecast.
Application of observation data obtained in the field experiment and the construction of
analytic data via data assimilation that provide a good initial field for NWP are our primary
propositions. This project aims to create a dataset, which contains the best analytic grid
data of the early summer rainy season in South China and the most valued situ
observations. Meanwhile, this project provides a unique opportunity to identify the most
efficient and effective data assimilation algorithm.
4.2 Improvement of the model physical processes
The model error is another major contributor to an inadequate numerical weather
prediction. The triggering mechanisms for warm sector rainstorm generally involve
complicated boundary layer processes, the surface topography and different properties
between land and sea, the interaction among multi-scale systems, and

sophisticated cloud-precipitation microphysical processes. A warm sector rainstorm is
rarely well forecasted by numerical models, implying caveats in the physical processes
among models. Since most key parameters of the applied physical processes in mesoscale
numerical models are primarily based on some empirical values of similar weather
backgrounds obtained in foreign areas. The representativeness of this empirical value is of
major concern and may lead to model forecast errors associated with the peculiar monsoon
rainstorm in China, especially in the warm sector scenario.
The project will take full advantage of the data collected during the field experiment. The
integration/combination of the historical observation data, and the TRMM and
CloudSat/CALIPSO satellite active measurements that reflect the cloud-precipitation
characteristics, will be utilized to improve the parameterization schemes in mesoscale
model by a variety of strategies (for instance: updating and improving the values of the key
parameters in the model physical schemes via data assimilation based on the EnKF
parameter estimation). Here, we focus on improving the boundary layer processes and the
cloud-precipitation microphysical processes to reduce the model error and then improve
the forecasting capability of warm sector rainstorm before and after the outbreak of
summer monsoon rainfall.
4.3 Mesoscale Ensemble Prediction (MEP) Experiments
Errors from model dynamics, physics schemes and initial conditions create
uncertainties in model simulations. While a single simulation or prediction
cannot provide information on uncertainty, ensemble prediction serves to
provide the statistical state of a collection of possible results, which can
help improve the forecast quality and extend valid prediction periods. The
ensemble members created for one single model are generally approached
with two methods, either by adding perturbations to initial condition,
including random Monte Carlo (Leith 1974), Lagged Average Forecast,
Singular Vector (Molteni et al. 1996, Ono et al. 2010), Breeding of
Growing Modes (Toth and Kalnay 1993) and etc., or by selecting different
model physical schemes and adopting different values of key parameters.
Moreover,

ensemble members across a couple of models can be used to provide the
so-called “super ensemble forecasts”.
Making good use of initial conditions and physics perturbation methods (by changing
physical schemes or parameters), we will carry out MEP experiments with model
horizontal grid spacing less than 10 km for heavy rainfall in the first rainy season and cold
front cases in South China. Super ensemble prediction will also be constructed based on
individual model MEP experiments at all institutions in the presented project, so as to
evaluate the performance of MEP of heavy rainfall in South China.
Based on current operational system, CMA will set up a specified verification system for a
careful assessment of all participating MEPSs. The verification of meso-scale ensemble
forecast systems will be carried out against the shareable observational datasets in Southern
China. Variables to be examined and verified are those of highest concerns in meso-scale
forecasts, such as the surface and low-level troposphere parameters, including surface
precipitation, 2-m temperature, 2-m dew point temperature, 2-m relative humidity, sea
level pressure, 850-hPa temperature, 850 relative humidity, etc. Two main types of
methods will be used to verify the ensemble forecasts conducted: one is the probability
density function (PDF), and the other is the probability forecast exceeding some specific
thresholds (e.g., equitable threat score, ETS).
5. Data Management
5.1 Data transmission, collection and processing
The project will produce three parts of data: the operational observations, the
non-operational observations from the mobile equipments, and data from the modeling
study.
The operational observations: The observational data from the meteorological
operational network including the AWSs, radiosonde observation stations, GPS/MET

water vapor stations, weather radars, and satellites will be conveyed to the National
Meteorological Information Centre (NMIC) in real time. NMIC will conduct quality
control for and gridding analysis based on the AWS observations. 3D gridded radar
reflectivity (at coordinates of longitude, latitude, and altitude) will be produced using the
Radar Mosaic System developed by the State Key Laboratory of Severe Weather, Chinese
Academy of Meteorological Sciences.
The non-operational observations: This part of data will be collected by the instrument
people that participate in the field campaign, and sorted out after the field experiment. The
raw data and the data after quality control should be submitted within about one month
after the end of the field experiment.
The numerical simulation data: The people who participate in the modeling study will
submit two types of gridded data. One is produced by the corresponding data assimilation
systems. The other is from the MEP experiments.
Information of the key contact persons in charge of the observational data and/or
equipments are listed in Table 9.
5.2 Data sharing
Data sharing will be in accordance with the WMO rules and the CMA relevant rules. A
data base will be set up at the National Meteorological Information Center/CMA. For
user’s convenience, the data products will be stored in standard, internationally common,
“self explanatory” formats. Furthermore, a website will be built as the main platform for
data and information sharing.

Table 9 Information of the key contact persons in charge of the observational data and/or
equipments
6. Programme Management

1) CMA Steering Committee
The CMA leader will act as the head of the Steering Committee including members from
the Department of Science and Technology and Climate Change, Department of
Forecasting and Information System, Department of Integrated Observations, Department
of International Cooperation of CMA, Chinese Academy of Meteorological Sciences as
well as the leaders of the meteorological bureaus of Guangdong, Guangxi, Hainan, and
Hong Kong. The Steering Committee is responsible for leading the field experiment and
organizing and coordinating the participating units.
2) International Science Steering Committee
The International Science Steering Committee (ISSC) consists of leading international
experts. The purpose of the committee is to instruct and deliberate the design of this field
experiment and other research-related work, and to oversee the operation of the field
experiment.
3) Project Chief Scientist
The Chief Scientist is responsible for the field experiments and scientific aspects of the
project.
4) Working Groups
The project has established four working groups, including Observation Working Group,
Data Working Group, Modeling Working Group, and Physics Working Group. Each
working group consists of some interested scientists/researchers with a few leaders, who
will be responsible for the research and various work related to the field campaign under
the leadership of the Chief Scientist.
5) Leading and participating units and scientists
This field experiment is leaded and organized by the State Key Laboratory of

Severe Weather at CAMS. The participating units in mainland China include Guangzhou
Institute of Tropical and Marine Meteorology, Wuhan Institute of Heavy Rains of CMA,
National Meteorological Centre, National Satellite Meteorological Centre, National
Meteorological Information Centre, National Meteorological Observation Center,
Guangdong Meteorological Bureau, Guangxi Meteorological Bureau, Hainan
Meteorological Bureau, the Meteorological Department of Hong Kong Special
Administrative Region, Institute of Atmospheric Physics of Chinese Academy of Sciences,
Peking University, Nanjing University, Nanjing University of Information Science and
Technology.
7. International Participation and Collaboration
We will collaborate closely with the Mesoscale Working Group of WWRP on modeling
and model verification and the Monsoon Panel of the WMO/CAS Working Group on
Tropical Meteorology Research (WGTMR) on monsoon heavy rainfall study. Both the
Pukyong University in Korea and Nagoya University in Japan may join the project through
coordination of the observation periods of their related projects in and around Korea, Japan
and East China Sea with the proposed field experiment. Some southern and southeastern
Asian countries are willing to participate by enhancing the frequency of radiosonde
observations.

8. Implementation Schedule

Year/Month Data WG
• Format and QC data of historical cases
• Design & develop website
2013/1-4
Update website Collect operational data Process the operational data Improve data base and website Submit annual report
Year/Month Modeling WG
• Setup MEPS • Conduct relevant studies 2013/4-6
Conduct MEP experiments for 2013 cases 2013/7
Submit data products ~
Evaluate MEP experiments 2014/6
Conduct relevant studies
Submit annual report

During 2013-2014 the physics WG will conduct research that is relevant to the scientific
objectives of SCMREX, by analyzing the data sets available from the project.
During the year of 2015, each WG will continue to complete their work.
Acknowledgments
A meeting was organized by the Department of Science and Technology and Climate
Change (DSTCC) of China Meteorological Administration (CMA) on 21 March 2013 to
review this Implementation Plan of SCMREX. The invited experts from Chinese Academy
of Science, Zhongshan University, National Natural Science Fundation of China, and CMA
in the meeting are greatly appreciated for providing helpful suggestions for improving the
plan. Professors C.P. Chang (Naval Postgraduate School of US) and Ben Jou (ACTS)
reviewed an earlier version of the plan. Their constructive comments are greatly
appreciated. Professors Ben Jou (NCTS) and Da-Lin Zhang (Maryland University of US)
are also deeply appreciated for refining the English expression in parts of the plan.
References
Anderson, E., and Coauthors, 1998: The ECMWF implementation of three-dimensional
variational assimilation (3D-var). III: experimental results. Quart. J. Roy. Meteor. Soc., 124,
1831-1860.
Anderson-Berry, L., and Coauthors, 2004: The societal, social, and economic impacts of the
World Weather Research Programme Sydney 2000 Forecast Demonstration Project (WWRP
S2000 FDP). Weather and Forecasting, 19, 168-178.
Awaka, J., T. Iguchi, and K. Okamoto, 1998: Early results on rain type classification by
the Tropical Rainfall Measuring Mission (TRMM) precipitation radar, Proc. 8th URSI
Commision F Open Symp., Aveiro, Portugal, pp. 143-146.
Barnes, S., 1964: A techniques for maximizing details in numerical map analysis. J. Appl.
Meteor. 3, 395-409.
Bougeault, P., and Coauthors, 2001: The MAP Special Observing Period. Bull. Amer.
Meteor. Soc., 82, 433–462.

Bratseth, A., 1986: Statistical interpolation by means of successive corrections. Tellus,
38A, 439-447.
Cardinali C, Pezzulli S, Andersson E., 2004: Influence-matrix diagnostic of a data
assimilation system. Q. J. R. Meteorol. Soc., 130, 2767–2786.
Chapnik B, Desroziers G, Rabier F, Talagrand O., 2004: Properties and first application of
an error-statistics tuning method in variational assimilation. Q. J.
R. Meteorol. Soc., 130, 2253–2275.
Chen, G., C. Wang, and D. Lin, 2005: Characteristics of low-level jets over Northern
Taiwan in meiyu season and their relationship to heavy rain. Mon. Wea. Rev., 133(1),
20-43.
Courtier, P., and O. Talagrand, 1990: Variational assimilation of meteorological
observations with the direct and adjoint shallow water equations. Tellus, 42A, 531-549.
Ding, Y.,1994:Monsoons 0ver China.Dordrecht/Boston/London:Kluwer Academic
Publishers,419pp.
Duan, Y.-H., and Coauthors, 2012: An overview of the Beijing 2008 Olympics Research
and Development Project (B08RDP). Bull. Amer. Meteor. Soc., 93, 381–403.
Frisch, A. S., C. W. Fairall, and J. B. Snider. 1995. Measurement of stratus cloud and
drizzle parameters in ASTEX with a Ka-band Doppler radar and a microwave radiometer
[J]. J. Atmos. Sci., 52: 2788–2799.
Gossard, E. E. 1994. Measurement of cloud droplet spectra by Doppler radar [J]. J. Atmos.
Oceanic Technol., 11: 712–726.
Gossard E. E.,J. B. Snider,E. E. Clothiaux,B. Martner, J. S. Gibson,R. A. Kropfli, and
A. S. Frisch. 1997. The Potential of 8-mm Radars for Remotely Sensing Cloud Drop
Size Distributions, J. Atmos. Oceanic Technology [J]. 14(1): 76–87.
Hamill, T. M. and C. Synder, 2000: A hybrid ensemble Kalman filter-3D variational
analysis scheme. Mon. Wea. Rev., 128, 2905-2919.
Houtekamer, P. L., and Coauthors, 1996: A system simulation approach to ensemble
prediction. Mon. Wea. Rev., 124, 1225-1242.
Hu, Z.Q., L.P. Liu, R.Z. Chu, and R.H. Jin, 2010: Study of Different Attenuation
Correction Methods in Association with Rainfall Estimation for X-Band Polarimetric
Radars. Acta Meteor. Sinica, 24 (5), 602-613.
Hu, Z.Q., L.P. Liu, and L.R. Wang, 2012: A Quality Assurance Procedure and Evaluation
of Rainfall Estimates for C-Band Polarimetric Radar. Adv. Atmos. Sci., 29(1), 144 -156.
Iguchi, T., T. Kozu, R. Meneghin, J. Awaka, and K. Okamoto, 2000: Rain-profiling
algorithm for the TRMM precipitaton radar. J. Appl. Meteor., 39, 2038-2052.
Isaac, G. A., and Coauthors, 2009: Science and Nowcasting Olympic Weather for
Vancouver 2010 (SNOW-V10) --A new World Weather Research Program Project.
Abstract at The 25th
Conference on International Interactive Information and Processing
Systems (IIPS) for Meteorology, Oceanography, and Hydrology. The 89th
American
Meteorological Society Annual Meeting, Phoenix, AZ, 10-16 January 2009.
Kummerow, C., W. Barnes, T. Kozu, J. Shiue, and J. Simpron, 1998: The Tropical Rainfall
Measuring Mission (TRMM) sensor package. J. Atmos. Oceanic Technol., 15, 809–817.
Leith, C. E., 1974: Theoretical skill of Monte Carlo forecasts. Mon. Wea. Rev., 102,
409-418.
Lewis, J., and J. Derber, 1985: The use of adjoint equations to solve a variational adjust
problem with advective constraints. Tellus, 37A, 309-322.
Liu, L.P., Z.Q. Hu, W.G. Fang, and Coauthors, 2010: Calibration and Data Quallity
Analysis with Mobile C-Band Polarimetric Radar. Acta Meteor. Sinica, 24 (4): 501–509.
Liu, S., Y. Zheng, and Z. Tao, 2003: The analysis of the relationship between pulse of LLJ
and heavy rain using wind profiler data. J. Tropic. Meteor., 19(3), 285-290.
Lorenc, A., 1981: A global three-dimensional multivariate statistical interpolation scheme.
Mon. Wea. Rev., 109, 701-721.
Luo, Y.L., Y.J. Wang, H.Y. Wang, Y.J. Zheng, and H. Morrison, 2010: Modeling
convective-stratiform precipitation processes on a Mei-Yu front with the WRF model:
Comparison with observations and sensitivity to cloud microphysics parameterizations. J.
Geophys. Res., 115, D18117, doi:10.1029/2010JD013873.
Luo, Y.L., H. Wang, R.H. Zhang, W.M. Qian, Z.Z. Luo, 2013: Comparison of rainfall
characteristics and convective properties of monsoon precipitation systems over South
China and the Yangtze and Huai River Basin. J. Climate, 26, 110-132.
Matrosov S Y, Clark K A, Martner B E, and Coauthors, 2002: X-band polarimetric radar
measurements of rainfall. J Appl Meteor, 41: 941–952.
Molteni, F., T. N. Palmer, R. Buizza and T. Pertroliagis, 1996: The ESMWF ensemble
prediction system methodology and verification. Quart. J. Roy. Met. Soc., 122, 73-121.
Ono, K., Y. Honda and M. Kunii, 2010: Development of a mesoscale ensemble prediction
system using a singular vector method. CAS/JSC WGNE Res. Act. Atmos. Ocea. Modell.,
40, 5.17-5.18.
Parrish, D.F., and J. D. Derber, 1992: The National Meteorological Center spectral
statistical interpolation analysis system. Mon. Wea. Rev., 120, 1747-1763. 45 / 52

Purser, R.J., and H.L. Huang, 1993: Estimating effective data density in a satellite
retrieval or an objective analysis. J. Appl. Meteorol., 32, 1092–1107.
Ranzi, R., M. Zappa, and B. Bacchi, 2007: Hydrological aspects of the Mesoscale Alpine
Programmes: Findings from field experiments and simulations. Q. J. R. Meteorol. Soc. 133,
867–880.
Ray, P.S., C.L. Ziegler, W. Bumgarner, and R.J. Serafin, 1980: Single-and multiple-Doller
radar observations of tornadic storms. Mon. Wea. Rev., 108, 1607-1625.
Seliga, T. A., and V. N. Bringi, 1976: Potential use of radar differential reflectivity
measurements at orthogonal polarizations for measuring precipitation. J. Appl. Meteor.,
1976 15: 69-76.
Stephens, G. L., and Coauthors, 2002: The CloudSat mission and the A-Train. Bull. Amer.
Meteor. Soc., 83, 1771–1790.
Stephens, G. L., and Coauthors, 2008a: CloudSat mission: Performance and early science
after the first year of operation. J. Geophys. Res., 113, D00A18,
doi:10.1029/2008JD009982.
Stoelinga, Mark T., and Coauthors, 2003: Improvement of Microphysical Parameterization
through Observational Verification Experiment. Bull. Amer. Meteor. Soc., 84, 1807–1826.
Toth, Zoltan, Eugenia Kalnay, 1993: Ensemble Forecasting at NMC: The Generation of
Perturbations. Bull. Amer. Meteor. Soc., 74, 2317–2330.
Tracton, M. Steven, Eugenia Kalnay, 1993: Operational Ensemble Prediction at the
National Meteorological Center: Practical Aspects. Wea. Forecasting, 8, 379–398.
Wilson, J. W., Y.-R. Feng, M. Chen, and R. D. Roberts, 2010: Nowcasting challenged
during the Beijing Olympics: Successes, failures, and implications for future nowcasting
systems. Wea. Forecasting, 25, 1691-1714.
Wu, D., Z. Meng, and D. Yan, 2013: The predictability of a squall line in South China on
23 April 2007. Adv. Atmos. Sci., 30(2), 485-502.
Zappa, M., and Coauthors, 2008: MAP D-PHASE: real-time demonstration of hydrological
ensemble prediction systems. Atmospheric Science Letters, 9, 80-87.
Zhang, X., and Y. Ni, 2009: A comparative study of a frontal and a non-frontal convective
systems. Acta Meteorologica Sinica, 67(1), 108-121.
Zhang, R., Y. Ni, L. Liu, Y. Luo, and Y. Wang, 2011: South China heavy rainfall
experiments (SCHeREX). J. Meteor. Soc. Japan, 89A, 153-166.
Bao, C., 1986: Research progress of heavy rainfall of south China in pre-summer

flood season. Acta Ocean. Sinca (in Chinese), 8(1), 31-40.
Cao, Y., Y. Jiang, and X. Sun, 2006: Relationship between low altitude jet stream and
heavy precipitation in a heavy rainfall event. Meteoro. Mon. (in Chinese), 32(6),
102-106.
Chu, R., Z. Wang, L. Liu, W. Lei, and X. Li, 1997: Preliminary analysis of rainfall
estimate utilizing dual linear polarization radar. Acta Meteor. Sinica (in Chinese),
55(1), 103-109.
Ding, Z., C. Liu, and X. Shen, 2011: Statistical analysis of the relationship among
warm sector heavy rainfall, upper and lower tropospheric jet stream and south Asia
high in May and June from 2005 to 2008. J. Trop. Meteoro. (in Chinese), 27(3),
307-316.
Hu, Z., L. Liu, and Y. Xiao, 2008: A simulation study on raindrop orientation
variation to dual linear polarimetric radar. J. Appl. Meteor. Sci. (in Chinese), 19(3),
362-366.
<<Heavy Rainfall of South China in Early-Summer Flood Season>> drafting group,
1986: Heavy Rainfall of South China in Early-Summer Flood Season. Guangdong
Science and Technology Press, 244pp.
Liang, Q., S. Xiang, L. Lin, and W. Meng, 2012: MCS characteristics over south
China during the annually first rainy season and their organization types. J. Trop.
Meteoro. (in Chinese), 28(4), 541-551.
Liu, L., L. Wu, and Y. Yang, 2007: Development of fuzzy-logical two-step ground
clutter detection algorithm. Acta Meteor. Sinica (in Chinese), 65(2), 252-260.
Liu, L., R. Zong, Y. Qi, and J. Liu, 2012: Microphysical parameters retrieval by cloud
radar and comparing with aircraft observation in stratiform cloud. Engineering
Sciences (in Chinese), 14(9), 64-71.
Ju, X., Z. Ren, and Q. Zhang, 2010: Research on quality control technology of
automatic hourly pressure. J. Anhui Agri. Sci. (in Chinese), 38(27), 15130-15133.
Ju, X., L. Cao, and J. Zhu, 2010: Check method on surface pressure extreme value
from ground automatic weather station. J. Meteor. Environment (in Chinese), 26(3),
48-52.
Ni, Y., R. Zhang, L., Liu and Coauthors, 2013: South China heavy rainfall
experiments (SCHeREX). China Meteorological Press, in press.
Ren, Z., P. Zhao, Q. Zhang, and Coauthors, 2010: Quality control procedures for
hourly precipitation data from automatic weather stations in China. Meteor. Mon. (in
Chinese), 36(7), 123-132.
Wang, P., Z. Ruan, and H. Kang, 2002: Numerical study of cloud physical

processes of heavy rainfall in south China. J. Appl. Meteor. Sci. (in Chinese),
13(1), 78-87.
Zhang, H, H. Zuo, X. Qie, and S. Guo, 2002: Analysis of echo characteristics of
Pingliang hailstorm. Acta Meteor. Sinica (in Chinese), 60(1), 110-115.
Zhang, X., and Y. Ni, 2009: A comparative study of a frontal and a non-frontal
convective systems. Acta Meteor. Sinica (in Chinese), 67(1), 108-121.
Zhao, Y., and Y. Wang, 2009: A review of studies on torrential rain during
pre-summer flood season in south China since the 1980’s. Torrential Rain and
Disasters (in Chinese), 28(3), 1993-202.
Zhao, Y., Z. Li, and Z. Xiao, 2008: Comparison analysis of south China front and
warm-area heavy rain systems in June 2006. Meteoro. Sci. Tech. (in Chinese), 36(1),
47-54.
Zhao, Y., Z. Ren, and Q. Zhang, 2011: Quality control procedures for hourly relative
humidity data from national automatic weather stations. J. Meteor. Sci., 31(6),
687-693.
Zhou, X., J. Xue, Z. Tao, S. Zhao, Q. Yi and B. Su, 2003: ’98 Huanan Area Meso
scale Experiment (HUAMEX). China Meteorological Press, 220pp.

Figure 9 The 4.50 PPIs detected by the C-band dual polarization radar of LaSW at 0943 LST on 6
June, 2008 in Boluo, Guangdong province: (a) ZH (dBZ), (b) ZDR (dB), (c) KDP,(o km-1), and (d)
ρHV.
Figure 10 Similar to Fig. 9, but for the retrieved variables: (a) Phase identify, (b) mean diameter of
particles (D0; mm), (c) particle number density ( N0; 10-5mm-1m-3), and (d) liquid water content
(Lw; g m-3).

50 / 52
䘀椀最甀爀攀............................................................
....... ........................................................................................ ............................... .. ...........................
..................