Embed Size (px)
DESCRIPTION
Irina Machikhiliyan , 20.07.2011. Technical stop: Recovery during July technical stop (detector + monitoring system) C-W pumping frequency measurements Comparison of LEDs with minbias data ECAL cells DQ. ECAL. Irina Machikhiliyan , 20.07.2011. Fills 1799 – 1955. - PowerPoint PPT Presentation
Citation preview

ECAL
Technical stop: Recovery during July technical stop (detector +
monitoring system) C-W pumping frequency measurements
Comparison of LEDs with minbias data
ECAL cells DQ
Irina Machikhiliyan, 20.07.2011

Fills 1799 – 1955Average relative PmToPin change with respect to 1st run (fill 1799)
Irina Machikhiliyan, 20.07.2011
1799,21/5/11
Time, minutes.One point per run
Red: physics runsBlack: the rest
1901,28/6/11
1944,14/7/11
1955,18/7/11

Fills 1799 – 1955, InnerAverage relative PmToPin change with respect to 1st run (fill 1799)
Irina Machikhiliyan, 20.07.2011
Time, minutes.One point per run
1955,18/7/11
1944,14/7/11
1901,28/6/11
1799,21/5/11

Fills 1799 – 1955, MiddleAverage relative PmToPin change with respect to 1st run (fill 1799)
Irina Machikhiliyan, 20.07.2011
Time, minutes.One point per run
1955,18/7/11
1944,14/7/11
1901,28/6/11
1799,21/5/11

Fills 1799 – 1955, OuterAverage relative PmToPin change with respect to 1st run (fill 1799)
Irina Machikhiliyan, 20.07.2011
Time, minutes.One point per run
1955,18/7/11
1944,14/7/11
1901,28/6/11
1799,21/5/11
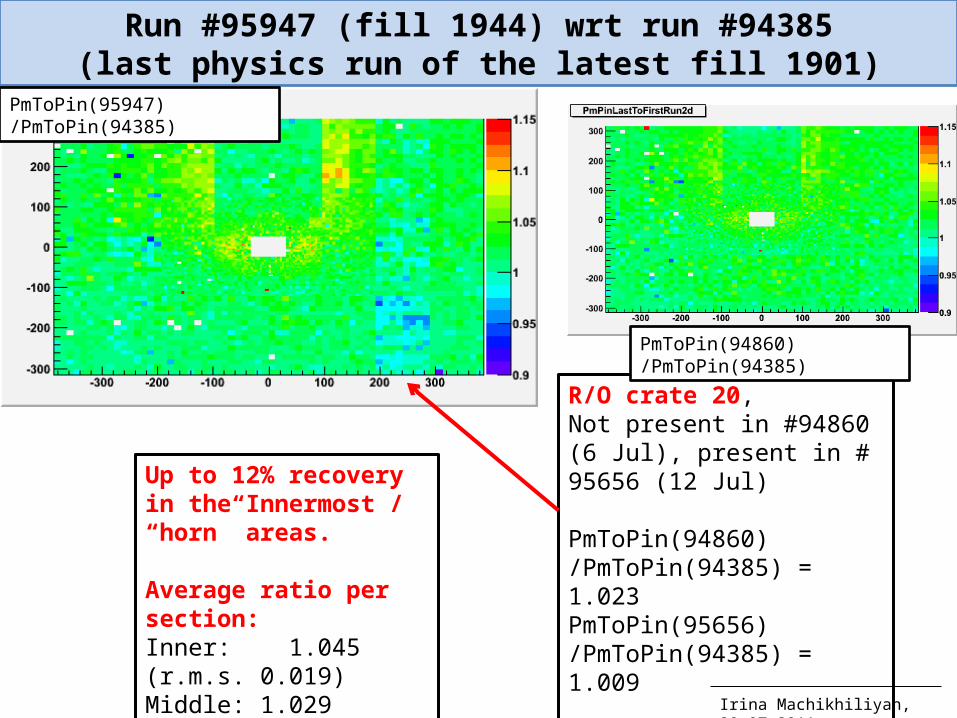
Run #95947 (fill 1944) wrt run #94385(last physics run of the latest fill 1901)
PmToPin(95947) /PmToPin(94385)
Irina Machikhiliyan, 20.07.2011
R/O crate 20, Not present in #94860 (6 Jul), present in # 95656 (12 Jul)
PmToPin(94860) /PmToPin(94385) = 1.023PmToPin(95656) /PmToPin(94385) = 1.009
PmToPin(94860) /PmToPin(94385)
Up to 12% recovery in the Innermost / “horn” areas.
Average ratio per section:Inner: 1.045 (r.m.s. 0.019)Middle: 1.029 (r.m.s. 0.019)Outer: 1.018 (r.m.s. 0.022)

Average frequency <f>, kHz: Group # 10 May 5 Jul
#1 64.8 61.9 #2 65.5 65.2 #3 68.9 69.1 #4 69.0 69.2Innermost C-Ws (group #1) show decrease of <f>
on ~4%, which must not affect C-W performance. <f>-values for other C-W groups are stable.
C-W pumping frequency(done together with Yu. Guz)
- initial measurement: 10 May, logbook entry: http://lblogbook.cern.ch/CALO/1587- second measurement: 05 Jul, logbook entry: http://lblogbook.cern.ch/CALO/1701
1
2
3
4
Irina Machikhiliyan, 20.07.2011

LEDs vs mbias: fills 1799 – 1883Average relative PmToPin change with respect to 1st run (fill 1799)
Irina Machikhiliyan, 20.07.2011
Fill 1799: 21 May, 10.5 hoursFill 1883: 21 Jun, 18 hours
Physics data: mbias selectionSignal: position of π⁰ peakPhotons: et > 300 MeV
M(92035) M(94012) M(94012) / M(92035)
PmPin(94012)/PmPin(92035)
M(1799) M(1883) M(1883) / M(1799)
All 135.1±0.8 130.2±0.7 0.964±0.006 0.952 134.1±0.2 σ = 8.6±0.1%
131.0±0.1σ = 9.1±0.1%
0.977±0.001
Inn 131.6±1.9 125.6±1.2 0.954±0.016 0.936 132.0±0.3σ = 8.7±0.2%
127.4±0.3σ = 9.1±0.2%
0.965±0.003
Mid 135.7±1.3 132.8±1.3 0.979±0.013 0.957 135.1±0.3σ = 8.5±0.2%
132.9±0.3σ = 9.3±0.2%
0.984±0.003
Out 134.7±1.3 130.9±1.3 0.972±0.013 0.956 134.8±0.3σ = 8.5±0.2%
131.6±0.2σ = 8.6±0.2%
0.976±0.003
Run 92035
Run 94012

LEDs vs mbias: fill1883, signal change during the fill (1)
Irina Machikhiliyan, 20.07.2011
(PmPin(N) – PmPin(0)) / PmPin(0) (PmPin(N) – PmPin(0)) / PmPin(0)
N (Relative run #) N (Relative run #)
All cells
(M(N) – M(0)) / M(0) (M(N) – M(0)) / M(0)
Inner cells
Net π⁰ peak π⁰ peak, Inner

Irina Machikhiliyan, 20.07.2011
LEDs vs mbias: fill1883, signal change during the fill (2) (PmPin(N) – PmPin(0)) / PmPin(0) (PmPin(N) – PmPin(0)) / PmPin(0)
N (Relative run #) N (Relative run #)(M(N) – M(0)) / M(0) (M(N) – M(0)) / M(0)
Outer cells
π⁰ peak, Outerπ⁰ peak, Middle
Middle cells
For π⁰-signal:try to add other selections? (π⁰ position compatibility for different selections should be checked)
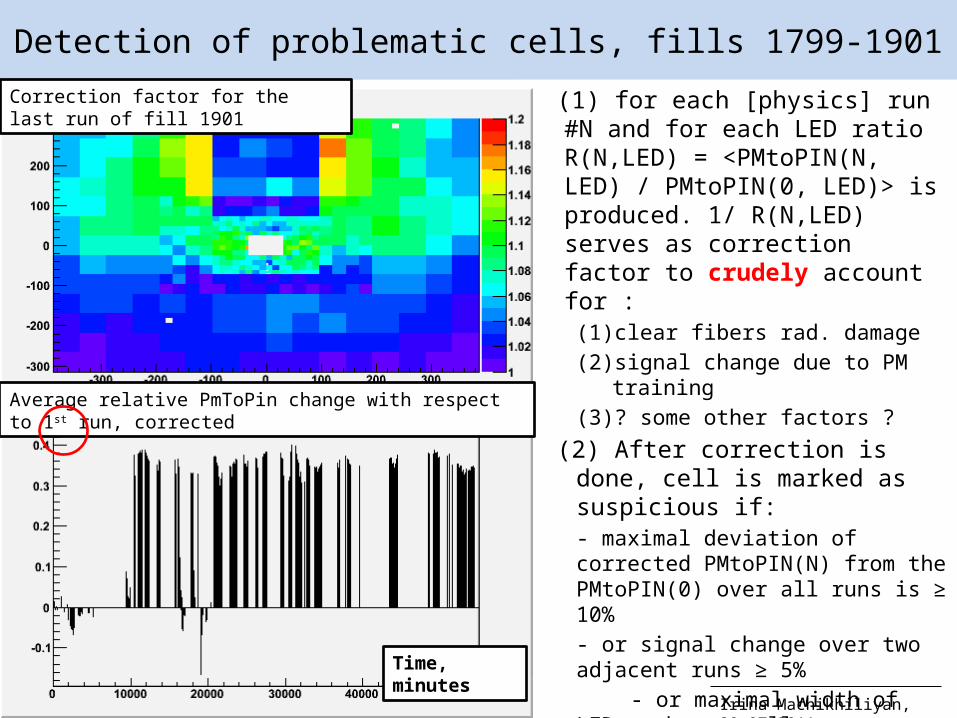
Detection of problematic cells, fills 1799-1901 (1) for each [physics] run #N and for each
LED ratio R(N,LED) = <PMtoPIN(N, LED) / PMtoPIN(0, LED)> is produced. 1/ R(N,LED) serves as correction factor to crudely account for :
(1) clear fibers rad. damage(2) signal change due to PM training(3) ? some other factors ?
(2) After correction is done, cell is marked as suspicious if:- maximal deviation of corrected PMtoPIN(N) from the PMtoPIN(0) over all runs is ≥ 10%- or signal change over two adjacent runs ≥ 5%
- or maximal width of LED peak over all runs > threshold
(3) Individual check of suspicious cells (see next slide)
Finally : 19 cells have been found
Average relative PmToPin change with respect to 1st run, corrected
Correction factor for the last run of fill 1901
Time, minutes
Irina Machikhiliyan, 20.07.2011

Example of the cell with “unexpected” behaviour (O 61/28)Original trend
Correction factor for current cell
Corrected trend
Correction makes things worse
6%3.5%
Cells where correction makes things worse
Irina Machikhiliyan, 20.07.2011

List of problems + suggestions(1)One cell out of 19 must be excluded for all runs (O 51/56, bad C-W:
unstable, noisy spectrum, presently: very low gain)(2)The rest: noticeable signal change in one-few-many runs. In many cases
it is accompanied by an increase of the r.m.s of LED peak due to noisy spectrum. Signal change: could be gradual drift during some time period(2 cells); one abrupt change(1 cell); unstable behaviour (more than one abrupt change, 11 cells)
• Suggestion: – if for certain runs spectra are noisy but signal change is small (1-2%), do nothing
(4 cells)– if few runs are affected and signal change is large, mask the cell for that
particular run(s) or make [rough] gain corrections if possible– if during certain period signal variations are large and frequent: exclude such
cell for this period
Correction factors / periods to mask for each cells could be provided before the beginning of the next week. Do we agree that the reference point should be fill 1799? Run-based or fill based corrections?Irina Machikhiliyan, 20.07.2011

Example #1: Cell O-01-32
The signal change is not significant, no action is needed
Irina Machikhiliyan, 20.07.2011
Average relative PmToPin change with respect to 1st run
LED peak r.m.s. (ADC counts)

Irina Machikhiliyan, 20.07.2011
Example #2: Cell O-46-44
In one run over several hundred signal decreased, r.m.s. OK
Mask this cell for one run?
Average relative PmToPin change with respect to 1st run
LED peak r.m.s. (ADC counts)

Irina Machikhiliyan, 20.07.2011
Make correction for this period
Example #3: Cell O-02-26
1400 ADC cnt
Transition
1300 ADC cnt
Average relative PmToPin change with respect to 1st run
LED peak r.m.s. (ADC counts)

Irina Machikhiliyan, 20.07.2011
Example #4: Cell O-09-15Average relative PmToPin change with respect to 1st run
Make correction for this period + exclude some runs
LED peak r.m.s. (ADC counts)
1100 ADC cnt
Transition
800 ADC cnt

Ex #5:Cell I-40-29
Large signal variation, exclude period t<22000, correct the rest w.r.t. first point
Ex #6:Cell O-09-17
Large signal variation, exclude period 20000 - 30000
Average relative PmToPin change with respect to 1st run Average relative PmToPin change with respect to 1st run
LED peak r.m.s. (ADC counts) LED peak r.m.s. (ADC counts)

Ex #7: Cell O-08-57
Gradual signal increase for t < 5000. Correct all points > 5000 ?
Ex #8: Cell I-41-43
Signal increase, than gradual decrease for t < 5000. Correct points < 5000 ?
Average relative PmToPin change with respect to 1st run Average relative PmToPin change with respect to 1st run
LED peak r.m.s. (ADC counts) LED peak r.m.s. (ADC counts)