Embed Size (px)
Citation preview

Dissecton of a Research Project
Vicken Y. Totten MD
1

Scholarly Work
• Of publishable quality• Many undergrad programs require a thesis• Most Masters programs• All PhD programs• Some MD / DO programs• All EM residencies.
2
General Outline
• Idea• Look it up, who has done what, refine idea• Background search, lit review (publishable)• Formulate study, protocol, IRB (if necessary)• Actually gather the data• Analyze and present the data• Graduate and / or publish the study.
3
Idea
• Lots of obese people in Cleveland• Plain Dealer -> talks about “food deserts”• Fruits and vegetables intake inversely
proportional to obesity• Other studies show that it is hard for the poor
to access food• Brainstorming -> what are factors in “access”?
4
Access
• Questions for the respondent– Can you get there? – Can you afford it?– Is it worth buying?
• For the researcher– Where can I access such a population?– How can I get them to answer?– How much time and effort can I afford to spend?
5
Measuring Access To Fresh Produce In An
Urban Midwestern City
Apoorva K. Chandar, MBBS
6

The parts of a study
• Goal = what change in the world?• Objectives = what can I achieve in
this study?• Background = why does this matter?
Who’s done what before?• Significance = Who cares?• Method = HOW will I get this done?
7
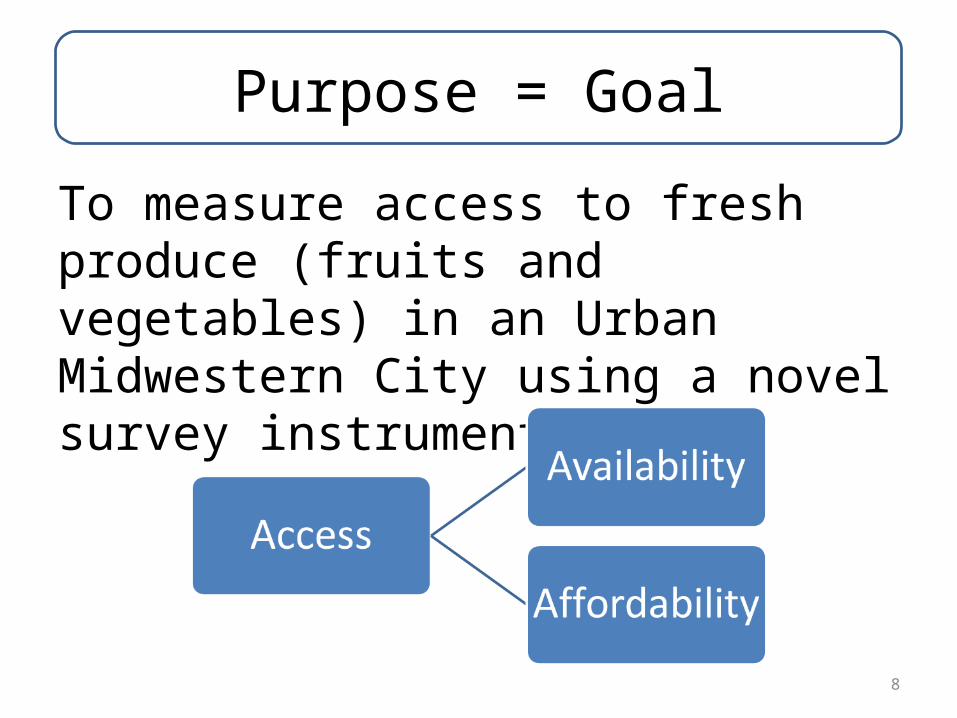
Purpose = Goal
To measure access to fresh produce (fruits and vegetables) in an Urban Midwestern City using a novel survey instrument
8
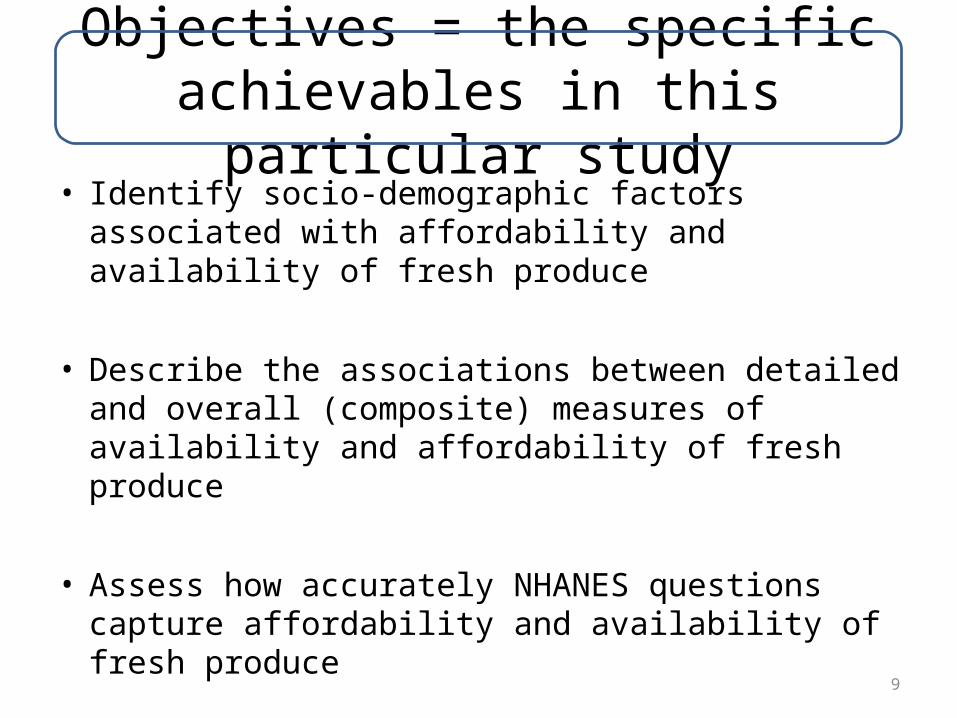
Objectives = the specific achievables in this particular
study• Identify socio-demographic factors associated with
affordability and availability of fresh produce
• Describe the associations between detailed and overall (composite) measures of availability and affordability of fresh produce
• Assess how accurately NHANES questions capture affordability and availability of fresh produce
9
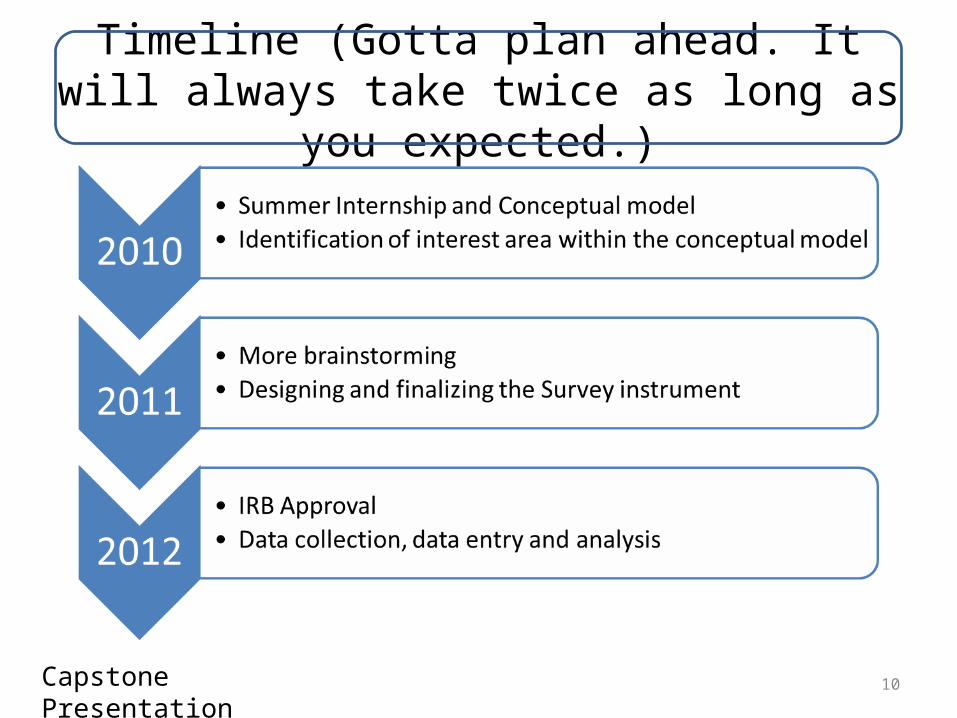
Timeline (Gotta plan ahead. It will always take twice as long as you
expected.)
Capstone Presentation 10
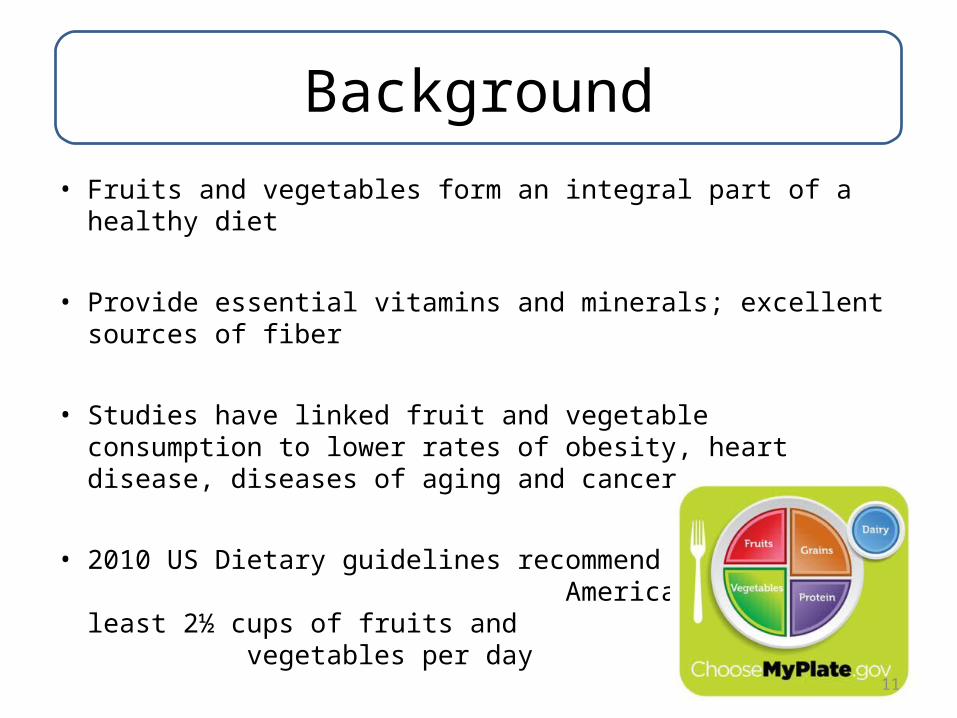
Background
• Fruits and vegetables form an integral part of a healthy diet
• Provide essential vitamins and minerals; excellent sources of fiber
• Studies have linked fruit and vegetable consumption to lower rates of obesity, heart disease, diseases of aging and cancer
• 2010 US Dietary guidelines recommend that Americans get at least 2½ cups of fruits and vegetables per day
11
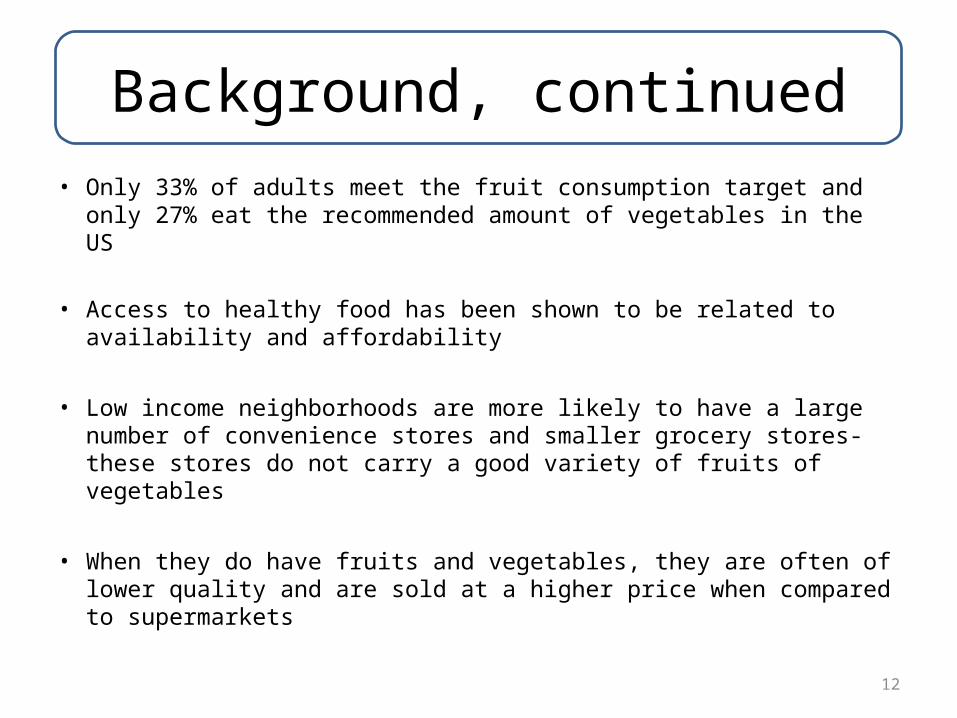
Background, continued
• Only 33% of adults meet the fruit consumption target and only 27% eat the recommended amount of vegetables in the US
• Access to healthy food has been shown to be related to availability
and affordability
• Low income neighborhoods are more likely to have a large number of convenience stores and smaller grocery stores-these stores do not carry a good variety of fruits of vegetables
• When they do have fruits and vegetables, they are often of lower quality and are sold at a higher price when compared to supermarkets
12
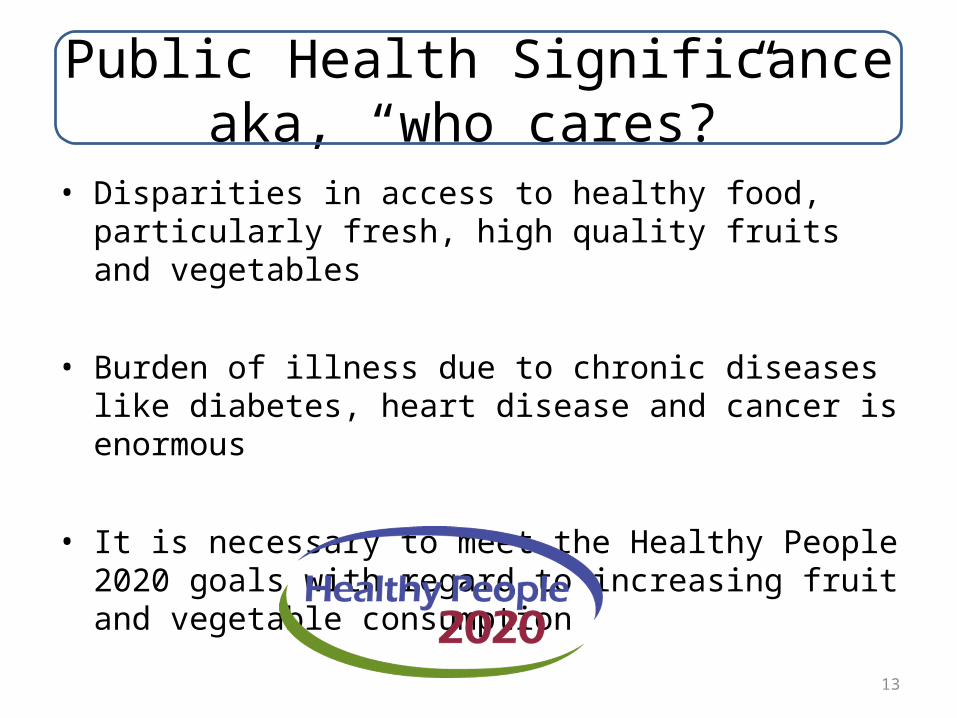
Public Health Significanceaka, “who cares?”
• Disparities in access to healthy food, particularly fresh, high quality fruits and vegetables
• Burden of illness due to chronic diseases like diabetes, heart disease and cancer is enormous
• It is necessary to meet the Healthy People 2020 goals with regard to increasing fruit and vegetable consumption
13
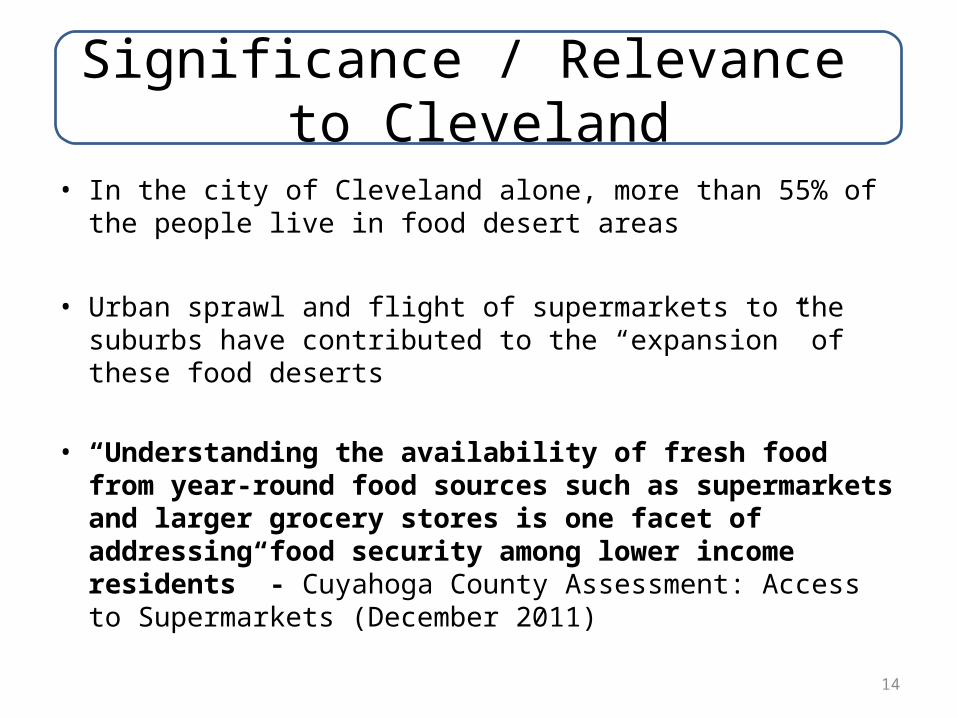
Significance / Relevance to Cleveland
• In the city of Cleveland alone, more than 55% of the people live in food desert areas
• Urban sprawl and flight of supermarkets to the suburbs have contributed to the “expansion” of these food deserts
• “Understanding the availability of fresh food from year-round food sources such as supermarkets and larger grocery stores is one facet of addressing food security among lower income residents” - Cuyahoga County Assessment: Access to Supermarkets (December 2011)
14

Design your study
• What do you want to know? (objective)
• What do you think will predict it?– Predictive variables
• How will you know if you now have the answer?– Outcome variables
• What else might factor in? – Confounding variables
15
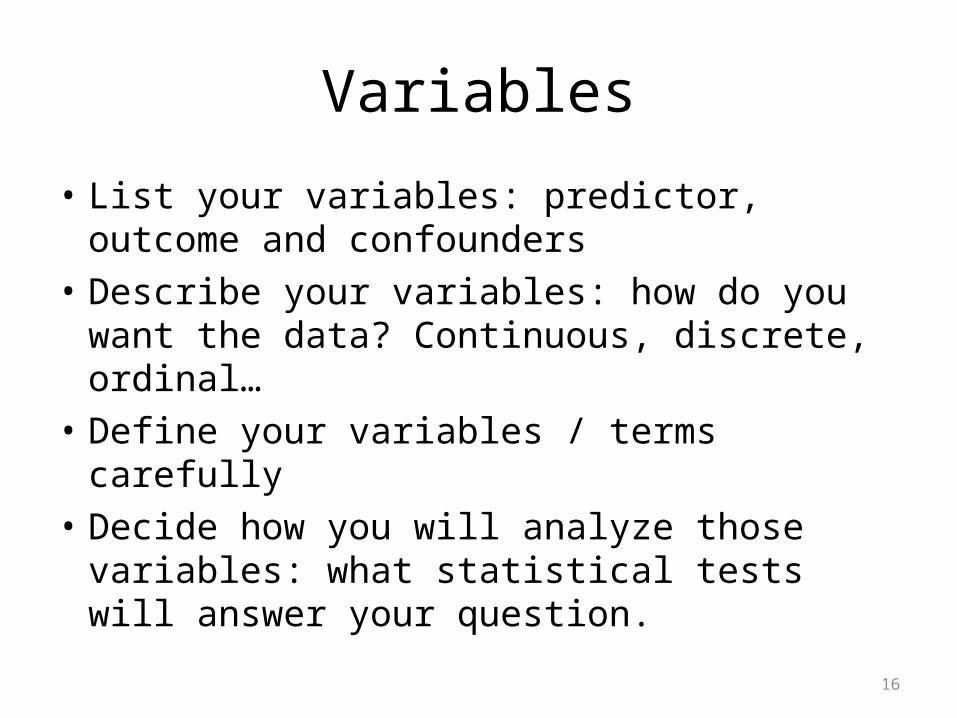
Variables
• List your variables: predictor, outcome and confounders
• Describe your variables: how do you want the data? Continuous, discrete, ordinal…
• Define your variables / terms carefully• Decide how you will analyze those
variables: what statistical tests will answer your question.
16
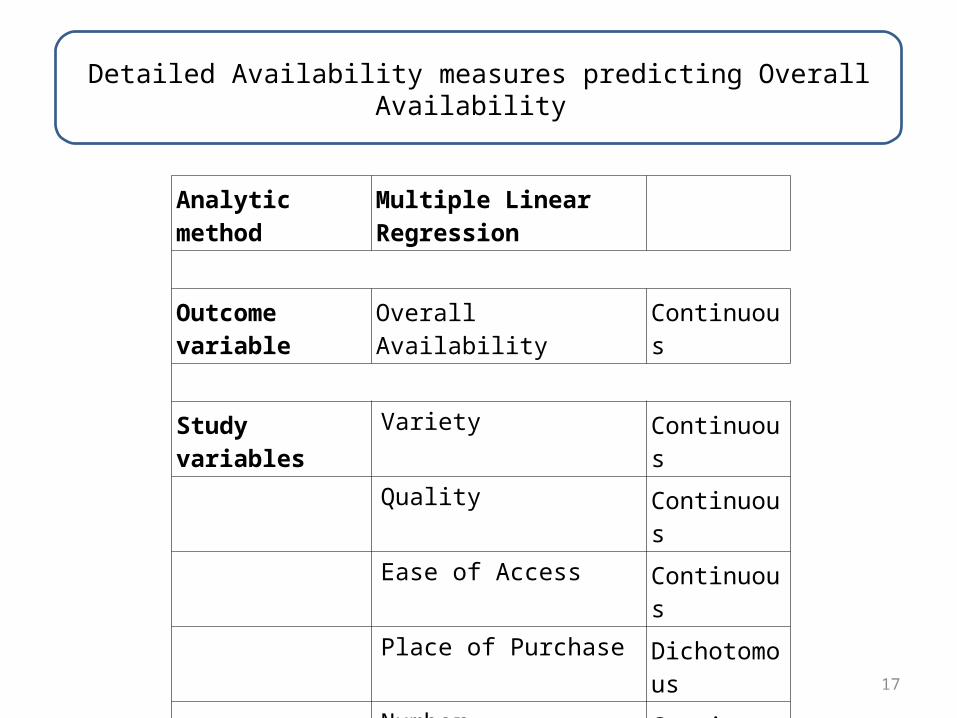
Detailed Availability measures predicting Overall Availability
Analytic method Multiple Linear Regression
Outcome variable Overall Availability Continuous
Study variables Variety Continuous Quality Continuous Ease of Access Continuous Place of Purchase Dichotomous Number Continuous Time Continuous
17
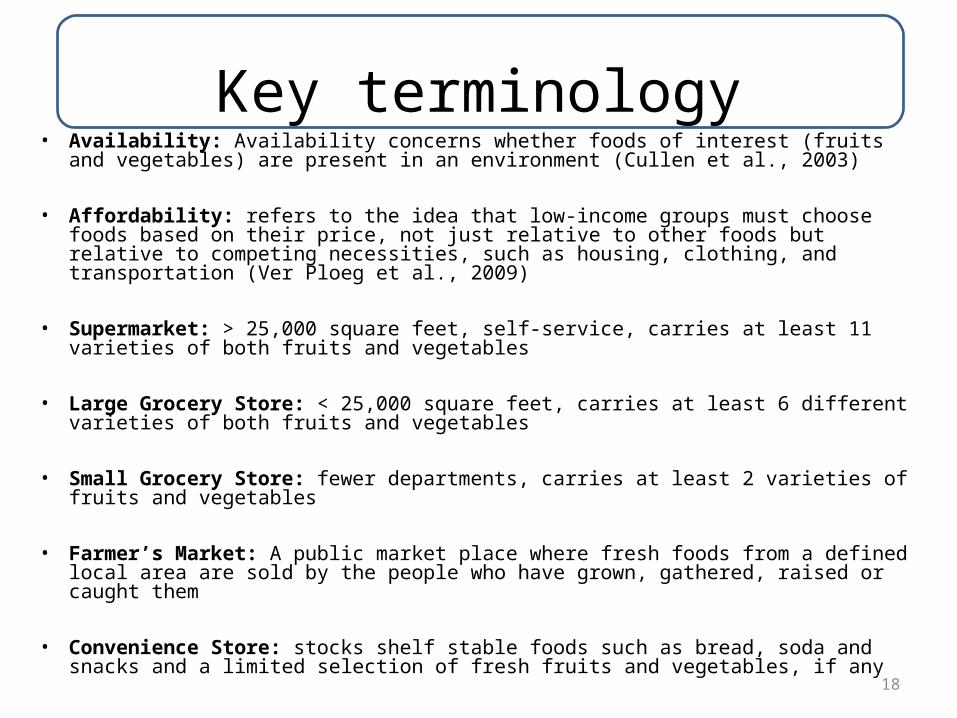
Key terminology• Availability: Availability concerns whether foods of interest (fruits and vegetables) are
present in an environment (Cullen et al., 2003)
• Affordability: refers to the idea that low-income groups must choose foods based on their price, not just relative to other foods but relative to competing necessities, such as housing, clothing, and transportation (Ver Ploeg et al., 2009)
• Supermarket: > 25,000 square feet, self-service, carries at least 11 varieties of both fruits and vegetables
• Large Grocery Store: < 25,000 square feet, carries at least 6 different varieties of both fruits and vegetables
• Small Grocery Store: fewer departments, carries at least 2 varieties of fruits and vegetables
• Farmer’s Market: A public market place where fresh foods from a defined local area are sold by the people who have grown, gathered, raised or caught them
• Convenience Store: stocks shelf stable foods such as bread, soda and snacks and a limited selection of fresh fruits and vegetables, if any 18
Methods
• This is a description of how you plan to carry out your study.
• It should be written so that another intelligent person could carry it out without asking you anything, and get the same results.
• Often written very formally (in a particular format)
19

This study
• Survey – best to use one already validated• Validity of surveys includes face validity, use
validity, internal and external validities• If you create your own, should describe how
you chose the items you chose, and why.• Chandar chose to write his own, use NHANES questions. His
paper-based surveys-took about 7 minutes to complete
20
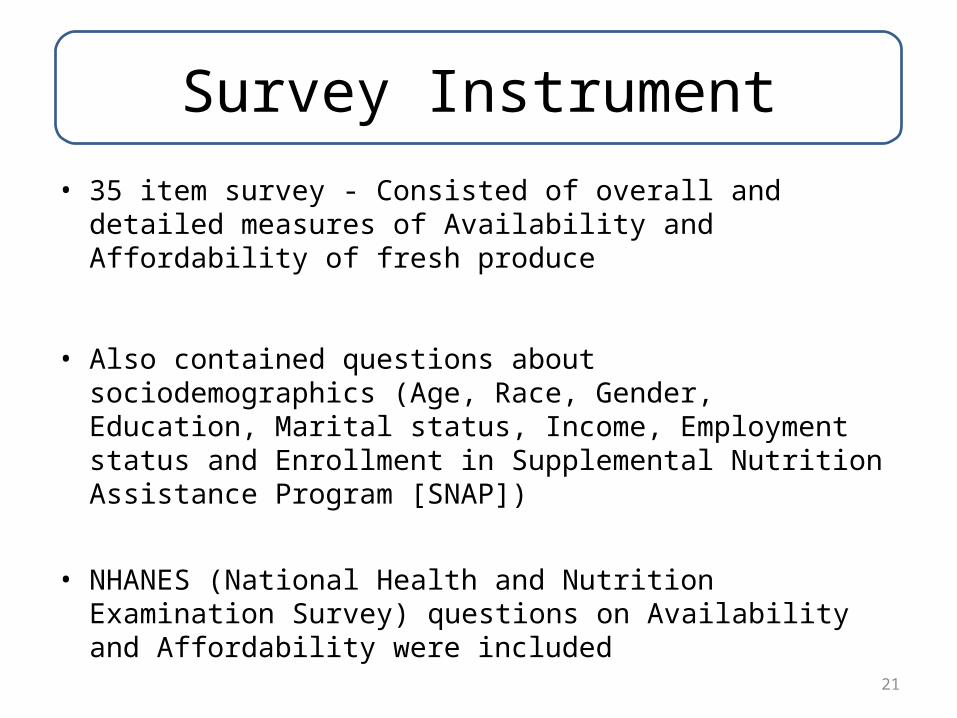
Survey Instrument
• 35 item survey - Consisted of overall and detailed measures of Availability and Affordability of fresh produce
• Also contained questions about sociodemographics (Age, Race, Gender, Education, Marital status, Income, Employment status and Enrollment in Supplemental Nutrition Assistance Program [SNAP])
• NHANES (National Health and Nutrition Examination Survey) questions on Availability and Affordability were included
21
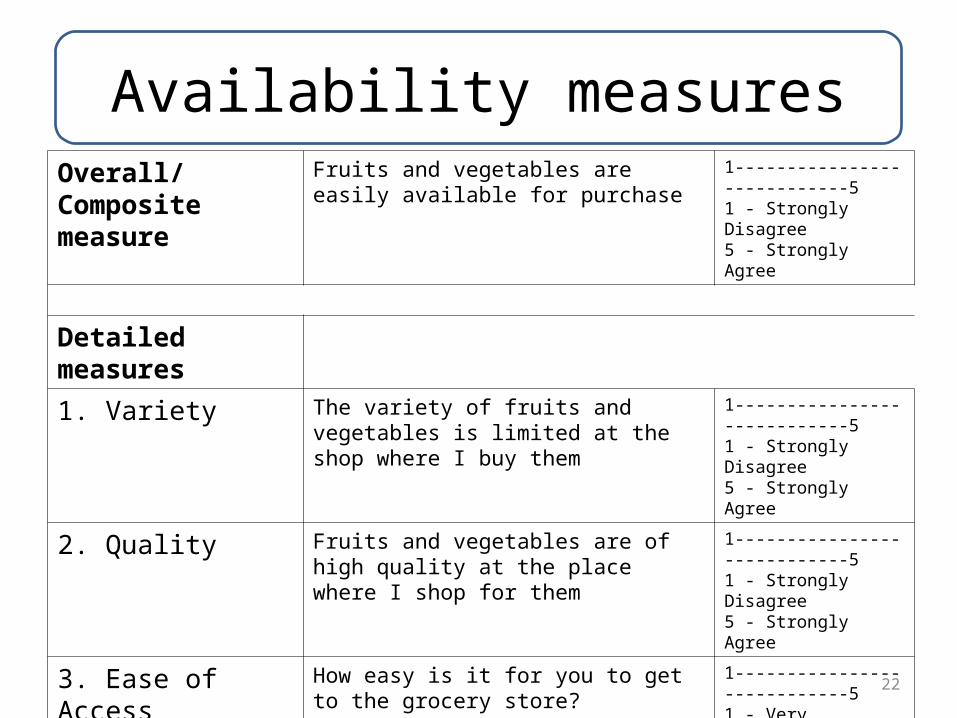
Availability measuresOverall/Composite measure
Fruits and vegetables are easily available for purchase
1----------------------------51 - Strongly Disagree5 - Strongly Agree
Detailed measures
1. Variety The variety of fruits and vegetables is limited at the shop where I buy them
1----------------------------51 - Strongly Disagree5 - Strongly Agree
2. Quality Fruits and vegetables are of high quality at the place where I shop for them
1----------------------------51 - Strongly Disagree5 - Strongly Agree
3. Ease of Access How easy is it for you to get to the grocery store?
1----------------------------51 - Very Difficult5 - Very Easy
4. Place of Purchase Where do you primarily shop for fruits and vegetables?
1. Supermarket 2. Small Grocery Store 3. Convenience Store 4. Farmer’s Market
5. Number How many grocery stores selling fruits and vegetables are close to where you live?
Continuous variable
22
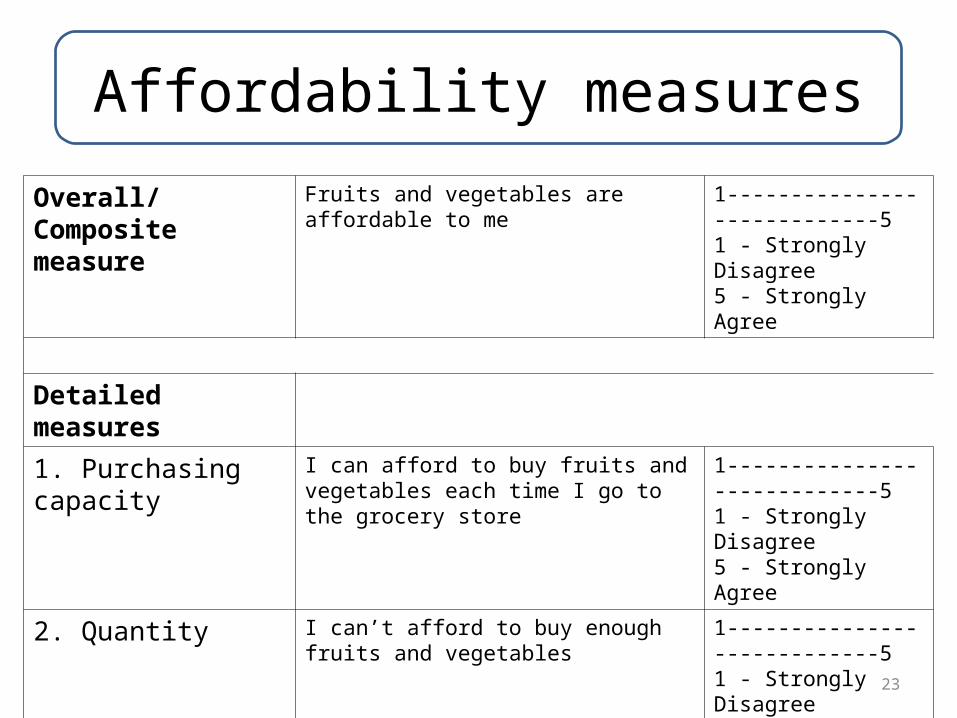
Affordability measures
Overall/Composite measure
Fruits and vegetables are affordable to me 1----------------------------51 - Strongly Disagree5 - Strongly Agree
Detailed measures
1. Purchasing capacity I can afford to buy fruits and vegetables each time I go to the grocery store
1----------------------------51 - Strongly Disagree5 - Strongly Agree
2. Quantity I can’t afford to buy enough fruits and vegetables
1----------------------------51 - Strongly Disagree5 - Strongly Agree
3. Eating healthy Lack of money prevents me from eating healthier
1----------------------------51 - Strongly Disagree5 - Strongly Agree
23
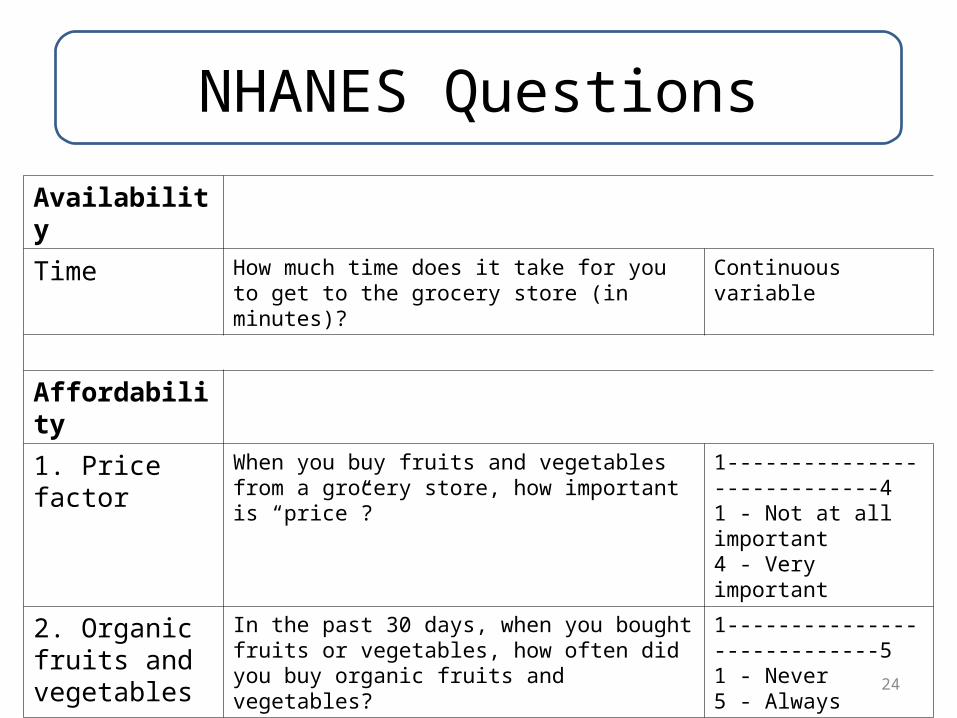
NHANES Questions
Availability
Time How much time does it take for you to get to the grocery store (in minutes)?
Continuous variable
Affordability
1. Price factor When you buy fruits and vegetables from a grocery store, how important is “price”?
1----------------------------41 - Not at all important4 - Very important
2. Organic fruits and vegetables
In the past 30 days, when you bought fruits or vegetables, how often did you buy organic fruits and vegetables?
1----------------------------51 - Never5 - Always
24

Methods: Data Collection
• Site: Emergency Department (ED) of University Hospitals of Cleveland
• ED of University Hospitals gets over 30000 patients per year –predominantly Black neighborhoods of Hough-Norwood, poorer parts of East side of Cleveland
• Convenience sample: 300 surveys
• PI and trained EMRD Research Assistants collected the surveys
25
Methods: Data Collection
• Surveys were handed out to any willing participant over the age of 18
• Surveys were collected in the ED patient rooms and waiting areas
• People could take the survey only if they did grocery shopping for themselves or their household
26
Methods: Data Entry and Analysis
• Data was entered and stored in REDCap
• Analysis was done using IBM SPSS v.20
• Descriptive statistics, tests of association, correlations and regression analysis
27
Statistics
• The type of variables you chose determine which statistical analysis you will use.
• The computing power available to you may determine what type of variable you will gather.
• In your first draft, boilerplate statistics may be used, but for your own purposes are not enough.
28
Results
• Before you run your statistics, decide what is “significant” and to whom.
• In a large enough study, 1 person of 10,000 difference can be statistically significant, but not clinically significant.
• “p-values” are inadequate. NNT / NNH and costs are of greater importance clinically.
29
Description
• The first part of your results is to describe your population. Others will want to know how similar are their populations, and the population itself determines many of the confounders.
• Confounders are also part of limitations
30

Descriptive: Demographics Table 1 (N = 300)
Demographic characteristics and associations with overall Availability and Affordability
Age N (%) Availability (p-value) Affordability (p-value)18 to 34 141 (47.2) 0.04 0.1135 to 54 104 (34.8)55 to 64 36 (12.0)
Above 65 18 (6.0)
Gender Male 61 (20.6) 0.38 0.26
Female 235 (79.4)
Race White 48 (16.2) 0.25 0.58Black 225 (75.8)Other 24 (8.1)
Education
Less than High School 24 (8.0) 0.88 0.28High School Graduate 98 (32.8)
Some College 130 (43.5)Bachelor/Graduate/Professional 47 (15.7) 31
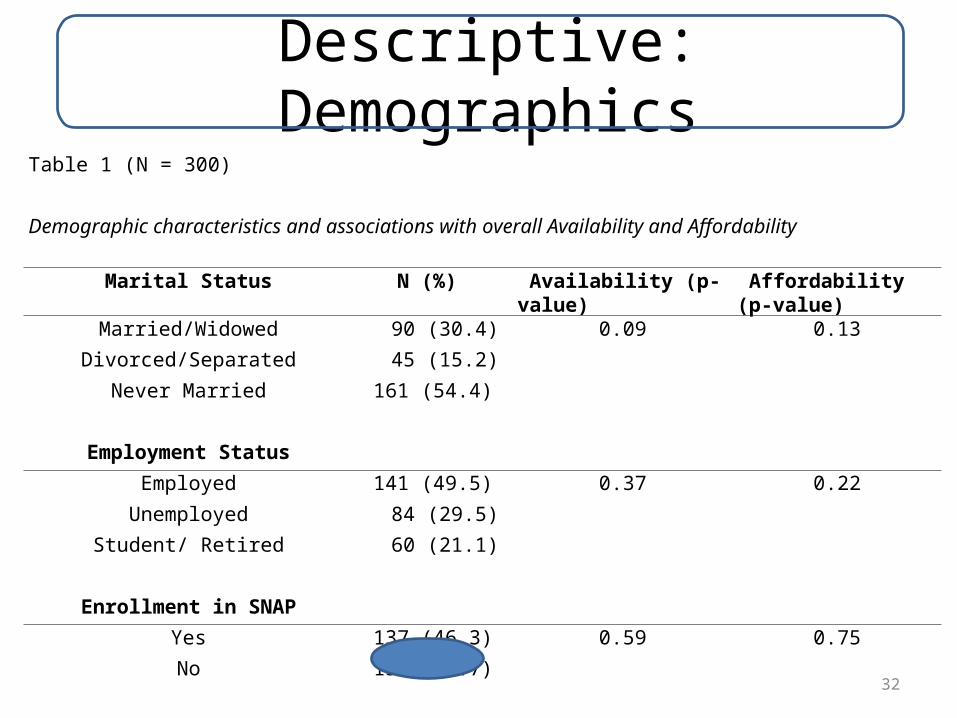
Descriptive: DemographicsTable 1 (N = 300)
Demographic characteristics and associations with overall Availability and Affordability
Marital Status N (%) Availability (p-value) Affordability (p-value)
Married/Widowed 90 (30.4) 0.09 0.13
Divorced/Separated 45 (15.2)
Never Married 161 (54.4)
Employment Status
Employed 141 (49.5) 0.37 0.22
Unemployed 84 (29.5)
Student/ Retired 60 (21.1)
Enrollment in SNAP
Yes 137 (46.3) 0.59 0.75
No 159 (53.7)32

Descriptive: Demographics
Table 1 (N = 300)
Demographic characteristics and associations with overall Availability and Affordability
Means (SD) Availability (p-value)
Affordability (p-value)
Number of People in Household 3.1 (1.60) 0.44 0.10
Income 33346.94 (28317.25) 0.36 0.29
33
Availability and Affordability “simple descriptive statistics”
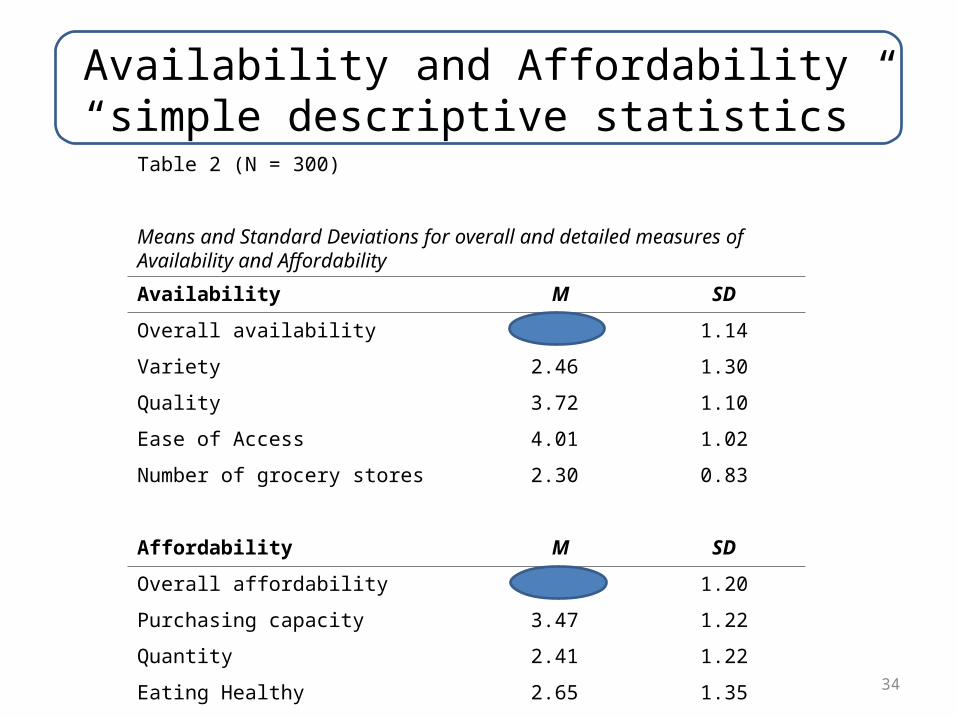
Table 2 (N = 300)
Means and Standard Deviations for overall and detailed measures of Availability and Affordability
Availability M SD
Overall availability 4.03 1.14
Variety 2.46 1.30
Quality 3.72 1.10
Ease of Access 4.01 1.02
Number of grocery stores 2.30 0.83
Affordability M SD
Overall affordability 3.55 1.20
Purchasing capacity 3.47 1.22
Quantity 2.41 1.22
Eating Healthy 2.65 1.35 34
Descriptive: NHANES
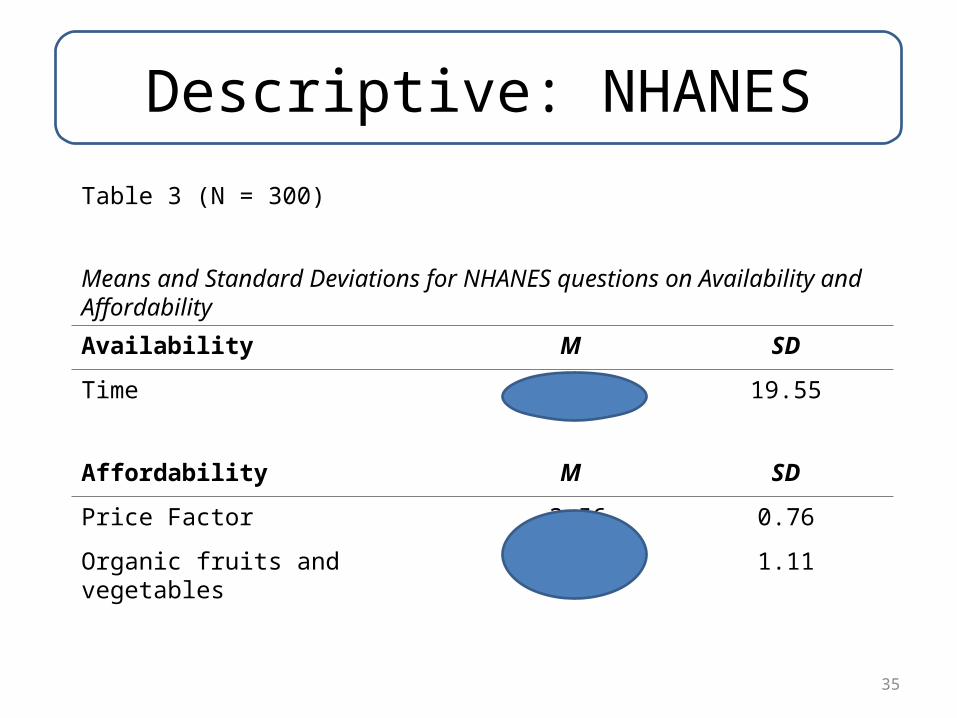
Table 3 (N = 300)
Means and Standard Deviations for NHANES questions on Availability and Affordability
Availability M SD
Time 24.09 19.55
Affordability M SD
Price Factor 3.56 0.76
Organic fruits and vegetables 1.91 1.11
35
Statistical Analysis
• After the first “simple descriptive statistics” come the comparisons
• Relationships and comparisons • Relationships do not prove causality,
(causality care rarely be ‘proven’) but increasingly frequent association suggests at least common factors.
36
Regression analyses
37

Regression analysis• A technique for modeling the effects of many
predictor variables on one outcome. • Linear regression• Simple regression
Ordinary least squares• Polynomial regression• General linear model• Generalized linear model• Nonlinear regression• And many more
38
Sociodemographic variables predicting Overall Availability
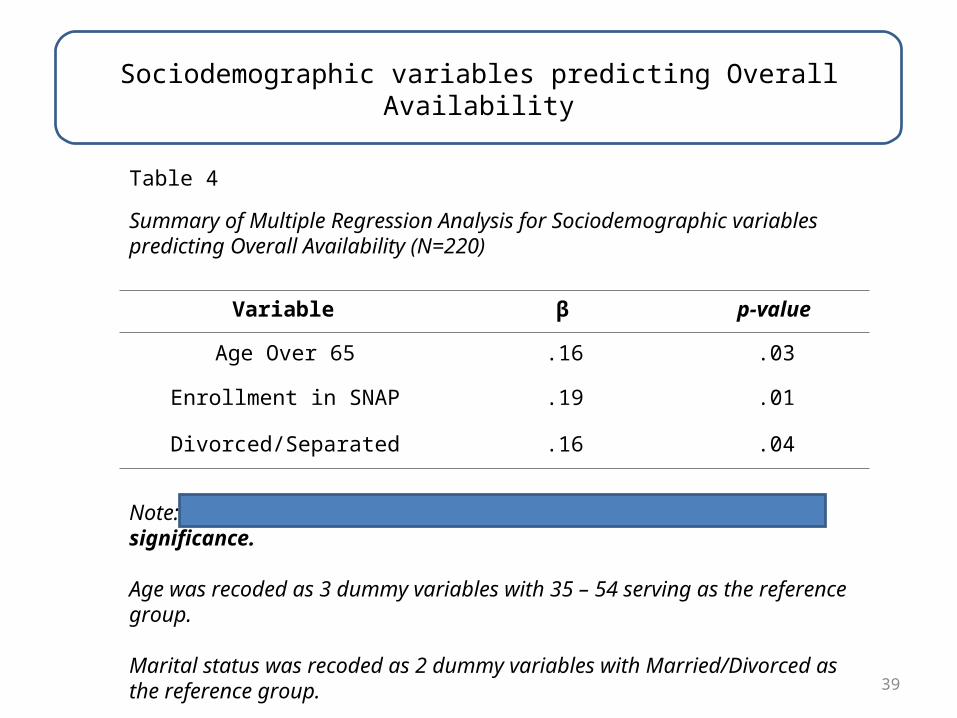
Table 4
Summary of Multiple Regression Analysis for Sociodemographic variables predicting Overall Availability (N=220)
Variable β p-value
Age Over 65 .16 .03
Enrollment in SNAP .19 .01
Divorced/Separated .16 .04
Note: R2 = 0.10 (p = 0.09) indicating that the model did not attain significance.
Age was recoded as 3 dummy variables with 35 – 54 serving as the reference group.
Marital status was recoded as 2 dummy variables with Married/Divorced as the reference group.
39
Sociodemographic variables predicting Overall Affordability
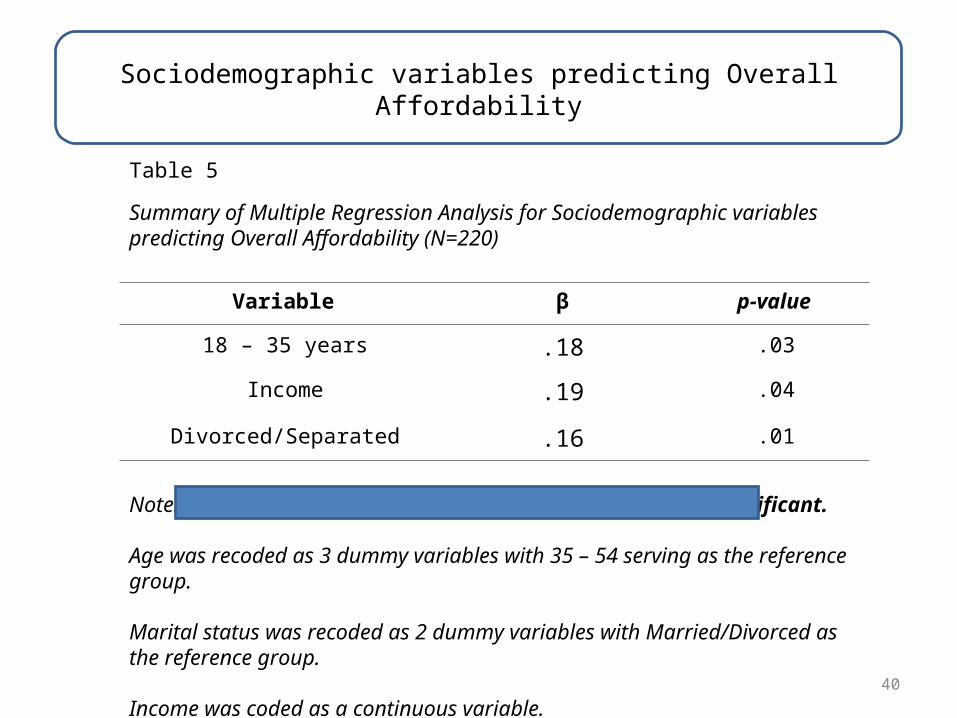
Table 5
Summary of Multiple Regression Analysis for Sociodemographic variables predicting Overall Affordability (N=220)
Variable β p-value
18 – 35 years .18 .03
Income .19 .04
Divorced/Separated .16 .01
Note: R2 = 0.11 (p = 0.07) indicating that the model was not significant.
Age was recoded as 3 dummy variables with 35 – 54 serving as the reference group.
Marital status was recoded as 2 dummy variables with Married/Divorced as the reference group.
Income was coded as a continuous variable. 40

Detailed Availability measures predicting Overall Availability
Analytic method Multiple Linear Regression
Outcome variable Overall Availability Continuous
Study variables Variety Continuous Quality Continuous Ease of Access Continuous Place of Purchase Dichotomous Number Continuous Time Continuous
41
Detailed Availability measures predicting Overall Availability
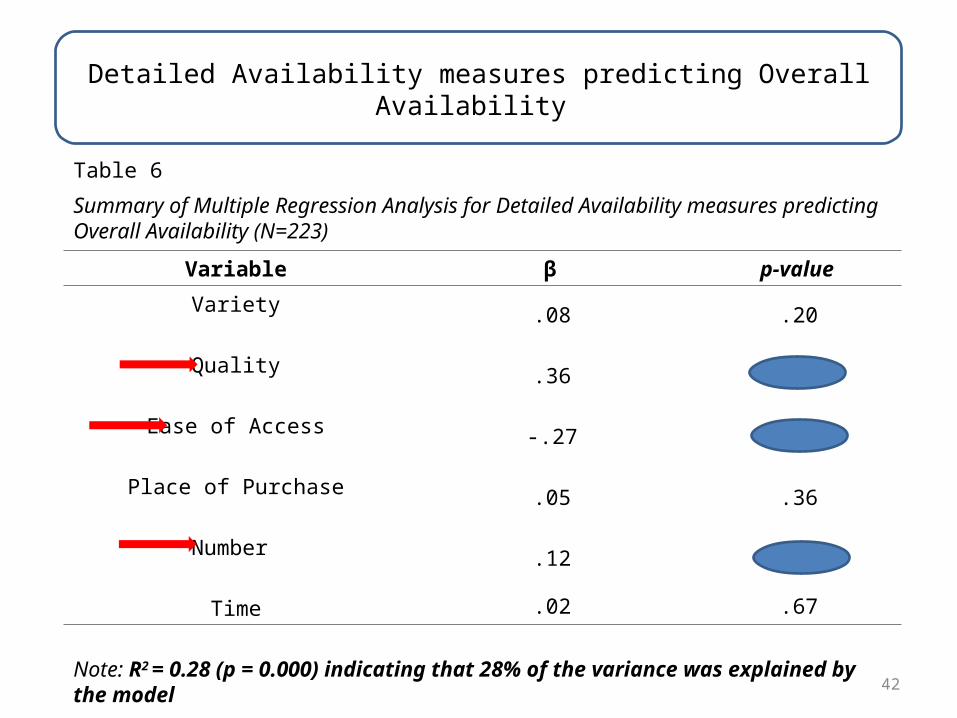
Table 6
Summary of Multiple Regression Analysis for Detailed Availability measures predicting Overall Availability (N=223)
Variable β p-value
Variety .08 .20
Quality .36 .00
Ease of Access -.27 .00
Place of Purchase .05 .36
Number .12 .04
Time .02 .67
Note: R2 = 0.28 (p = 0.000) indicating that 28% of the variance was explained by the model42
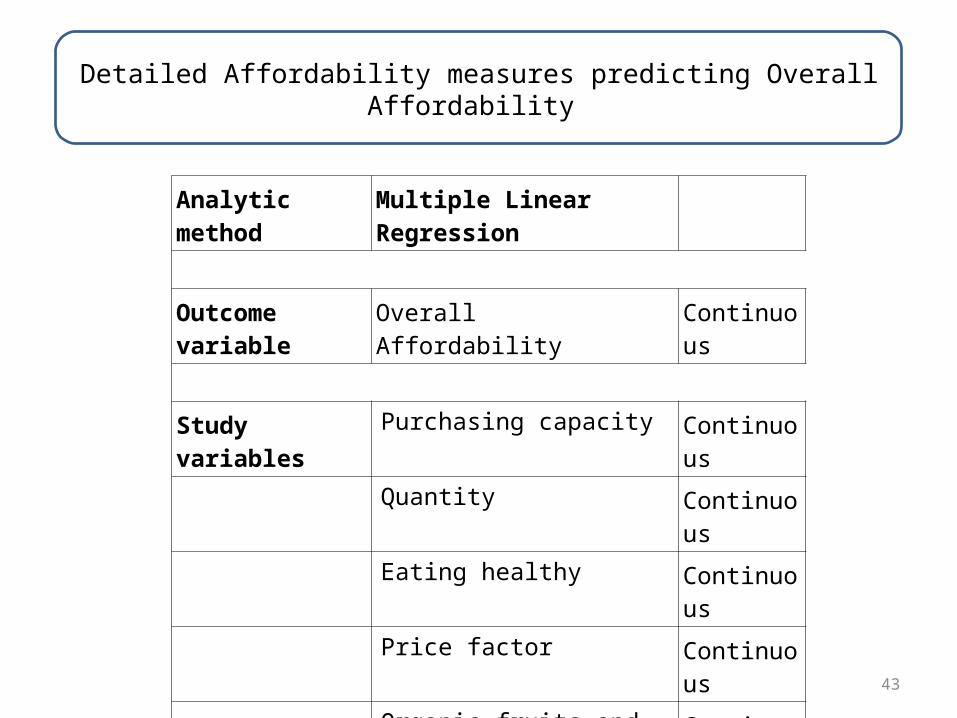
Detailed Affordability measures predicting Overall Affordability
Analytic method Multiple Linear Regression
Outcome variable Overall Affordability Continuous
Study variables Purchasing capacity Continuous Quantity Continuous Eating healthy Continuous Price factor Continuous Organic fruits and vegetables Continuous
43
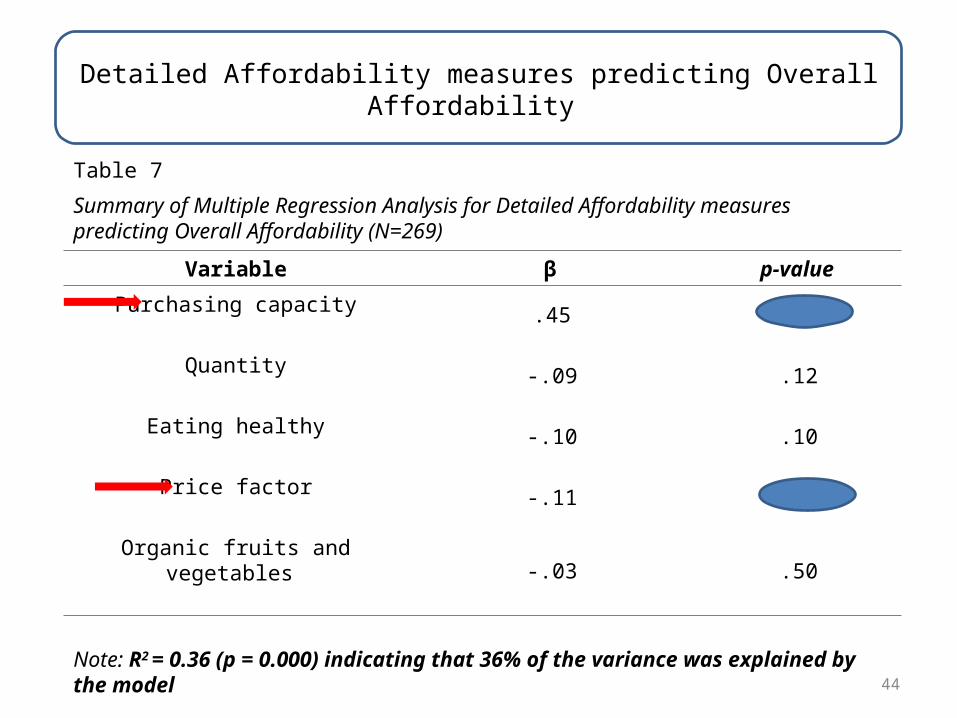
Detailed Affordability measures predicting Overall Affordability
Table 7
Summary of Multiple Regression Analysis for Detailed Affordability measures predicting Overall Affordability (N=269)
Variable β p-value
Purchasing capacity .45 .00
Quantity -.09 .12
Eating healthy -.10 .10
Price factor -.11 .04
Organic fruits and vegetables -.03 .50
Note: R2 = 0.36 (p = 0.000) indicating that 36% of the variance was explained by the model
44
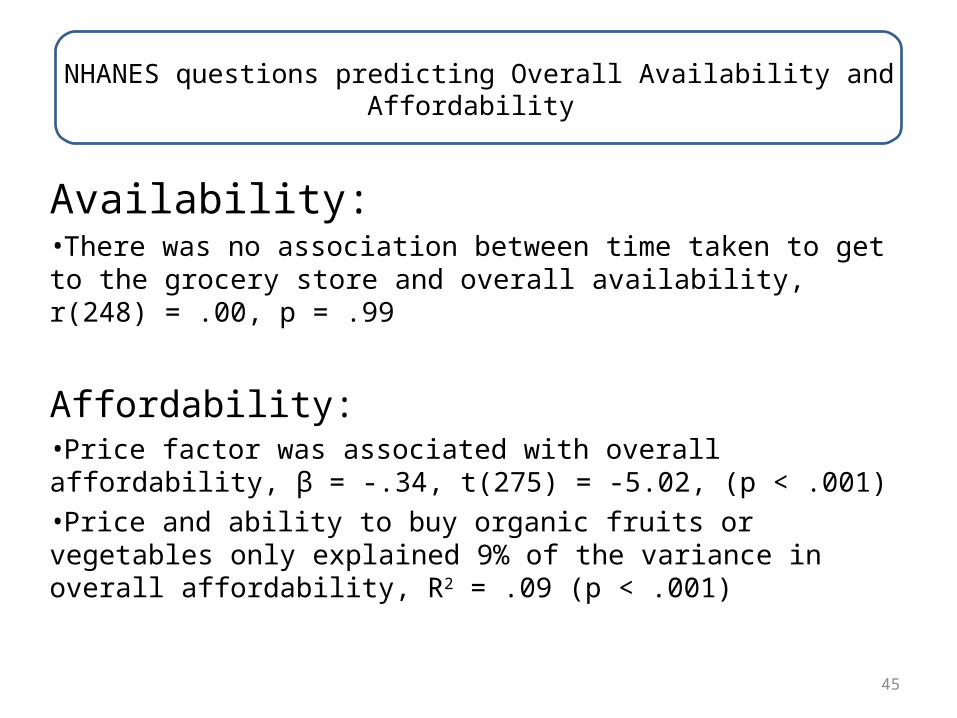
NHANES questions predicting Overall Availability and Affordability
Availability:•There was no association between time taken to get to the grocery store and overall availability, r(248) = .00, p = .99
Affordability:•Price factor was associated with overall affordability, β = -.34, t(275) = -5.02, (p < .001)•Price and ability to buy organic fruits or vegetables only explained 9% of the variance in overall affordability, R2 = .09 (p < .001)
45
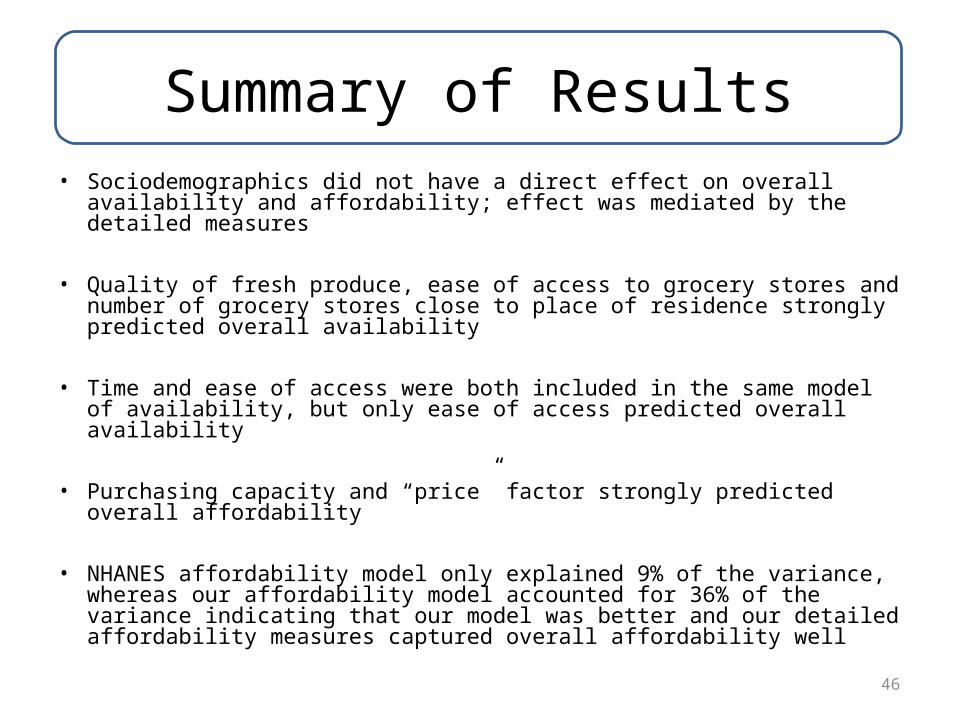
Summary of Results• Sociodemographics did not have a direct effect on overall availability and
affordability; effect was mediated by the detailed measures
• Quality of fresh produce, ease of access to grocery stores and number of grocery stores close to place of residence strongly predicted overall availability
• Time and ease of access were both included in the same model of availability, but only ease of access predicted overall availability
• Purchasing capacity and “price” factor strongly predicted overall affordability
• NHANES affordability model only explained 9% of the variance, whereas our affordability model accounted for 36% of the variance indicating that our model was better and our detailed affordability measures captured overall affordability well
46
Summary of results
• After presenting the data so that others can see it, interpret it for them, make your point.
• Keep it brief
47
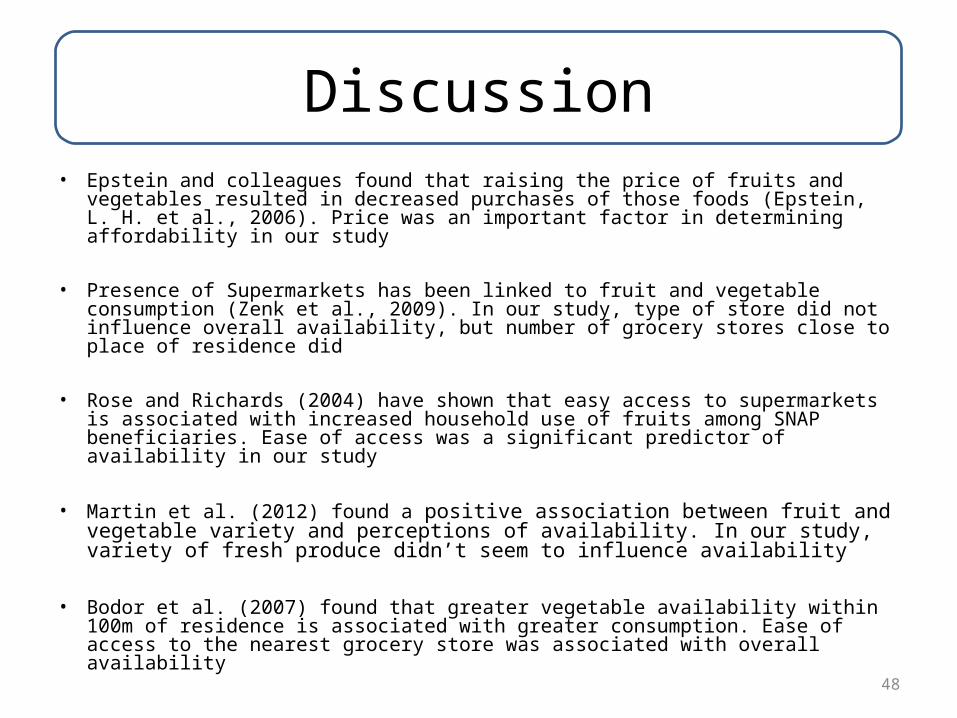
Discussion• Epstein and colleagues found that raising the price of fruits and vegetables
resulted in decreased purchases of those foods (Epstein, L. H. et al., 2006). Price was an important factor in determining affordability in our study
• Presence of Supermarkets has been linked to fruit and vegetable consumption (Zenk et al., 2009). In our study, type of store did not influence overall availability, but number of grocery stores close to place of residence did
• Rose and Richards (2004) have shown that easy access to supermarkets is associated with increased household use of fruits among SNAP beneficiaries. Ease of access was a significant predictor of availability in our study
• Martin et al. (2012) found a positive association between fruit and vegetable variety and perceptions of availability. In our study, variety of fresh produce didn’t seem to influence availability
• Bodor et al. (2007) found that greater vegetable availability within 100m of residence is associated with greater consumption. Ease of access to the nearest grocery store was associated with overall availability
48

Discussion
• This is where you get some free rein to write about your passion. When you write the final paper, this is where much of your background ends up.
• The exact order of discussion / limitations / summary / Conclusions / recommendations (where do we go from here), depends on the journal you want to submit to.
49
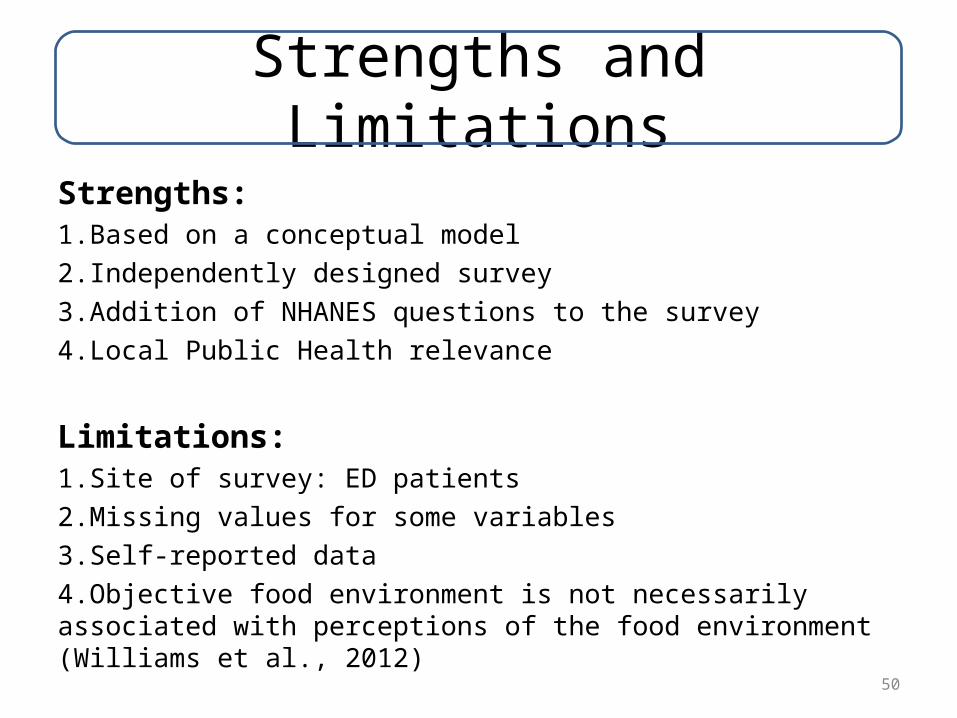
Strengths and Limitations
Strengths:1.Based on a conceptual model2.Independently designed survey3.Addition of NHANES questions to the survey4.Local Public Health relevance
Limitations:1.Site of survey: ED patients 2.Missing values for some variables3.Self-reported data4.Objective food environment is not necessarily associated with perceptions of the food environment (Williams et al., 2012)
50
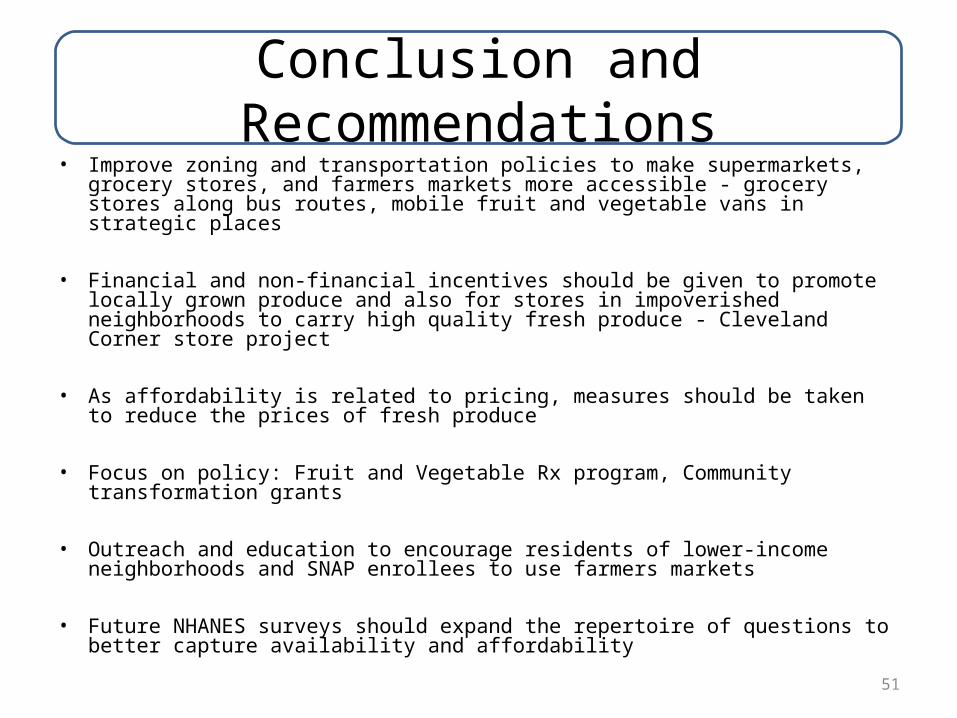
Conclusion and Recommendations
• Improve zoning and transportation policies to make supermarkets, grocery stores, and farmers markets more accessible - grocery stores along bus routes, mobile fruit and vegetable vans in strategic places
• Financial and non-financial incentives should be given to promote locally grown produce and also for stores in impoverished neighborhoods to carry high quality fresh produce - Cleveland Corner store project
• As affordability is related to pricing, measures should be taken to reduce the prices of fresh produce
• Focus on policy: Fruit and Vegetable Rx program, Community transformation grants
• Outreach and education to encourage residents of lower-income neighborhoods and SNAP enrollees to use farmers markets
• Future NHANES surveys should expand the repertoire of questions to better capture availability and affordability
51
Future Work
• Recoding variables as dichotomous and running logistic regressions
• Conduct the survey across a broader sociodemographic spectrum, with a larger sample size
• Reliability testing of the scale52
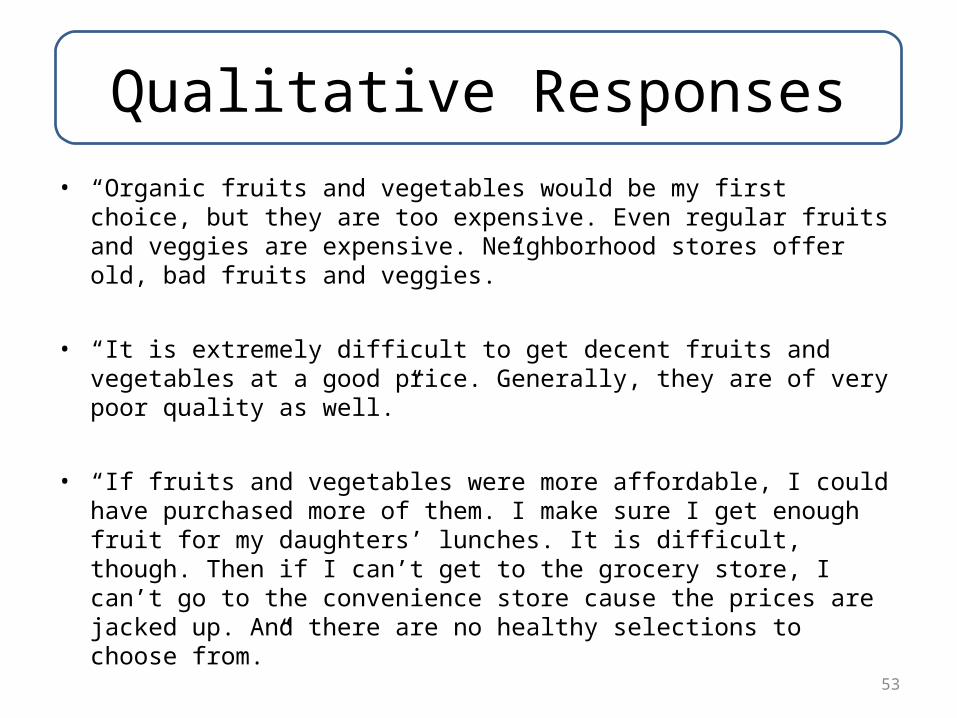
Qualitative Responses
• “Organic fruits and vegetables would be my first choice, but they are too expensive. Even regular fruits and veggies are expensive. Neighborhood stores offer old, bad fruits and veggies.”
• “It is extremely difficult to get decent fruits and vegetables at a good price. Generally, they are of very poor quality as well.”
• “If fruits and vegetables were more affordable, I could have purchased more of them. I make sure I get enough fruit for my daughters’ lunches. It is difficult, though. Then if I can’t get to the grocery store, I can’t go to the convenience store cause the prices are jacked up. And there are no healthy selections to choose from.”
53
Questions?
54
![Untitled-12 [] 8478 Donation... · Title: Untitled-12 Author: Vicken Massoyan Created Date: 7/22/2016 10:58:10 AM](https://img.pdfslide.us/doc/110x75/5fbf3bbe4d347933d2315e61/untitled-12-8478-donation-title-untitled-12-author-vicken-massoyan-created.jpg)