Embed Size (px)
Citation preview
Ocean forced variability of Totten Glacier mass loss
JASON ROBERTS1,2*, BENJAMIN K. GALTON-FENZI1,2, FERNANDO S. PAOLO3,CLAIRE DONNELLY4, DAVID E. GWYTHER2,5, LAURIE PADMAN6, DUNCANYOUNG7,
ROLAND WARNER2, JAMIN GREENBAUM7, HELEN A. FRICKER3, ANTONYJ. PAYNE4, STEPHEN CORNFORD4, ANNE LE BROCQ8, TAS VAN OMMEN1,2,
DON BLANKENSHIP7 & MARTIN J. SIEGERT9
1Australian Antarctic Division, Hobart, Tasmania, Australia2Antarctic Climate & Ecosystems Cooperative Research Centre,
University of Tasmania, Hobart, Tasmania, Australia3Scripps Institution of Oceanography, University of California San Diego,
La Jolla, California, USA4School of Geographical Sciences, University of Bristol, Bristol, UK
5Institute for Marine and Antarctic Studies, University of Tasmania, Hobart, Tasmania, Australia6Earth & Space Research, Corvallis, Oregon, USA
7Jackson School of Geosciences, University of Texas at Austin, Austin, Texas, USA8School of Geography, University of Exeter, Exeter, Devon, UK
9Grantham Institute and Department of Earth Science and Engineering,Imperial College London, South Kensington, London, UK
*Correspondence: [email protected]
Abstract: A large volume of the East Antarctic Ice Sheet drains through the Totten Glacier (TG)and is thought to be a potential source of substantial global sea-level rise over the coming centuries.We show that the surface velocity and height of the floating part of the TG, which buttresses thegrounded component, have varied substantially over two decades (1989–2011), with variations insurface height strongly anti-correlated with simulated basal melt rates (r = 0.70, p < 0.05). Coupledglacier–ice shelf simulations confirm that ice flow and thickness respond to both basal melting ofthe ice shelf and grounding on bed obstacles. We conclude the observed variability of the TG isprimarily ocean-driven. Ocean warming in this region will lead to enhanced ice-sheet dynamismand loss of upstream grounded ice.
Gold Open Access: This article is published under the terms of the CC-BY 3.0 license.
The East Antarctic Ice Sheet (EAIS) is the world’slargest potential source of sea-level rise (53.3 m; anorder of magnitude greater than either West Antarc-tica or Greenland), with the marine-based compo-nent (i.e. where the ice sheet is grounded below sealevel) containing enough ice to raise sea levels by19.2 m (Fretwell et al. 2013). The Totten Glacier(TG: see Fig. 1c for the location) has the largest out-flow (70 ± 4 km3 a−1) of any glacier in East Antarc-tica, and has the third highest ice flux of all Antarcticglaciers, behind only the Pine Island and Thwaitesglaciers (Rignot & Thomas 2002), both in theAmundsen Sea (AS) region of West Antarctica.The Aurora Subglacial Basin is an extensive region
of grounded ice that drains primarily through themain trunk of the TG (Roberts et al. 2011; Younget al. 2011; Wright et al. 2012) and contains enoughmarine-based ice to raise the global sea level by3.5 m (Greenbaum et al. 2015). The TG has anextensive embayed floating ice shelf adjoining aweakly grounded ‘ice plain’ containing topographi-cal features (Li et al. 2015) that have previouslybeen interpreted as ‘ice rumples’, with the ice surfaceslightly above the flotation limit (Greenbaum et al.2015). It is thought that, by analogy with observedchanges in the AS region of West Antarctica (Shep-herd &Wingham 2007; Pritchard et al. 2009, 2012),these features make the TG susceptible to rapid
From: SIEGERT, M. J., JAMIESON, S. S. R. & WHITE, D. A. (eds) Exploration of Subsurface Antarctica: UncoveringPast Changes and Modern Processes. Geological Society, London, Special Publications, 461,https://doi.org/10.1144/SP461.6© 2017 The Author(s). Published by The Geological Society of London. Publishing disclaimer:www.geolsoc.org.uk/pub_ethics
grounding zone retreat via the marine ice-sheetinstability mechanism (Schoof 2007) and potentiallysensitive to changing ocean conditions (Li et al.2016). Indeed, evidence of past large-scale retreatcycles has been inferred from erosion patternsbeneath the ice sheet (Aitken et al. 2016), potentiallydriven by changing ocean conditions.
Analysis of satellite laser-altimeter measurements(ICESat), of relatively short-duration (2003–08),showed a mass-loss trend for the TG, with surfacelowering in some regions in excess of 1.9 m a−1
(Pritchard et al. 2009). Mass balance estimatesfrom accumulation over the catchment basin, andvelocities at the grounding line, show the TG catch-ment was losing ice at a rate of approximately 8 Gta−1 over the period 1992–2006 (Rignot & Thomas2002; Rignot et al. 2008), despite a period of anom-alously high regional snowfall (van Ommen & Mor-gan 2010). Furthermore, analysis of satellite gravitydata from the GRACE mission indicated acceleratedmass loss of the grounded region from slightly over2 Gt a−1 in mid-2002 to nearly 18 Gt a−1 in 2009(Chen et al. 2009). Recent analysis of a longer timeseries (1994–2012) of surface-height data for theice shelf revealed large interannual variability in
elevation over the floating portion of the TG (TottenIce Shelf; TIS), with an overall slight negative trendover the full time interval that becomes more pro-nounced during the ICESat period (Paolo et al. 2015).
Here we present further evidence showing thatthe variability of the TG is apparent in observationsof both surface ice velocities and surface height.Numerical ocean modelling indicates that interan-nual differences in water mass properties in theregion can lead to large variations in basal meltingof the TIS (Khazendar et al. 2013; Gwyther et al.2014), suggesting that both TIS elevations and icedynamics may be modulated by variability inocean forcing (Li et al. 2016). Thus, the aim of thispaper is to provide a mechanism which explainsthat the variability of the TIS is in response tochanges in ocean forcing. This aim will be addressedusing both satellite observations and modelling.
Methods
Surface ice velocities
We calculated surface velocities using visible featuretracking techniques for the periods 1989, 1999–2002,
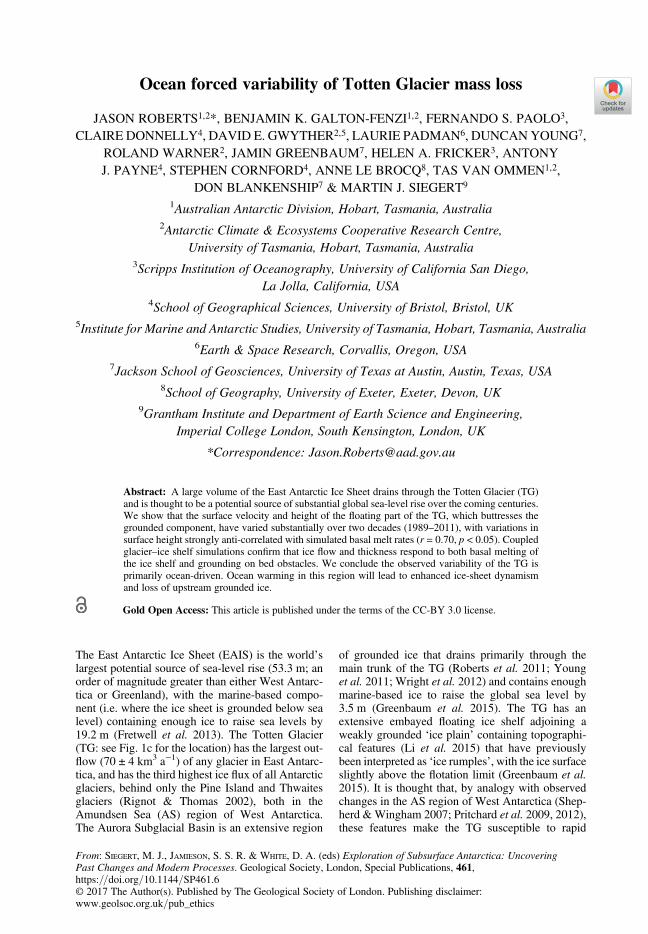
Fig. 1. (a) Surface ice velocity from Landsat4 and Landsat7 image pairs, averaged over the region shown in (c)(white box). (b) Relative changes in surface height from ERS altimetry data (Paolo et al. 2016) (blue) areanti-correlated with computer simulations of melt rate (r2 = 0.70), area-averaged over the TIS. (c) Location of the TG,also showing the MEaSUREs velocity field (Rignot et al. 2011) (vectors), ASAID ice-sheet grounding line(Bindschadler et al. 2011a) (red) and the seawards extent of the TG (green). The white box denotes the area forvelocity averages shown in (a).
J. ROBERTS ET AL.
2002–08 and 2008–10 from a combination of Land-sat4 (1989) and Landsat7 (1999 onwards) imagepairs (see Table 1 for details).
Velocities were obtained from fast Fourier trans-form (FFT)-based correlations derived from surfacefeature displacements from Landsat4 or Landsat7image pairs. The images are ‘Systematic TerrainCorrection’ (Level 1GT) products in standard polarstereographic projection (reference latitude 71°S).Level 1GT images are corrected for terrain distor-tions using the Radarsat Antarctic Mapping Project(RAMP) digital elevation model (DEM), whichmay introduce potentially large errors. However,as our area of interest is an ice shelf of relativelyuniform surface height, we expect any such effectsto be small. To further minimize these effects,co-registration of the image pairs was based onpersistent features near the edge of the ice sheet,where the ice is thin and surface features are areflection of the underlying bedrock features. Theseregions tend to be at broadly similar elevations tothe ice shelf.
To account for Scan Line Correction off (SLC-off ) problems in 2003–present images, the featuretracking software (Scambos et al. 1992) was modi-fied to fill these gaps with random data selectedfrom the intensity histogram for the valid region ofthe image (Warner & Roberts 2013). To reduce var-iability, displacements were calculated for 1920 ×1920 m reference ‘chips’ on a 300 m grid and thenbinned onto a 1 × 1 km grid based on a least trimmedsquares (Rousseeuw & Hubert 1997), requiring atleast three data points per bin. To further reducenoise, we only retained data where at least four ofthe nine neighbouring points had both displacementcomponents within 150 m of each other.
Surface heights
We constructed an 18 year record of ice-shelf heightusing data from three European Space Agency(ESA) satellite radar altimeter (RA) missions: theEuropean Remote Sensing Satellite-1 and Satellite-2
(ERS-1, 1991–96; and ERS-2, 1995–2011), and theEnvironmental Satellite (Envisat, 2002–12). Weobtained Level-2 RA data as Version 5 Ice DataRecords (IDRs) for each mission from the NASA/GSFC (Goddard Space Flight Center) Ice AltimetryGroup (http://icesat4.gsfc.nasa.gov/). At GSFC,the RA waveforms were retracked using a range-retracking algorithm that fits a multi-parameter func-tion to each one (the β-retracker) (Zwally & Brenner2001); one of these parameters is the retrackingpoint, which is the mid-point on the waveform lead-ing edge. The following corrections were applied byGSFC: atmospheric range corrections; instrumentcorrections; slope corrections; ocean and solidEarth tides (Brenner et al. 1983; Zwally & Brenner2001; Zwally et al. 2005); (for ERS) removal of a0.41 m bias from ERS-1 heights to account for achange in instrument parameter used for ERS-2(Femenias 1996); corrections for drifts in the ultra-stable oscillator and bias changes in the scanningpoint target response that are obtained from ESA;and upgraded orbits (DGM-E04 orbits for ERS),which have a radial orbit precision of 0.05–0.06 m(Scharroo & Visser 1998).
Our determination of height changes over theice shelves from multi-mission satellite RA data isbased on ‘crossover analysis’ (Zwally et al. 1989,2005; Davis & Ferguson 2004; Wingham et al.2009), which estimates change in surface height atintersections between time-separated ascendingand descending satellite tracks. The following pro-cessing steps were undertaken (Paolo et al. 2016):subsetting data over floating ice; data editing andadditional corrections required for floating ice andfor radar signal interactions with the surface layeron the ice shelves; crossover analysis; methodsfor merging data records from the different mis-sions; and the averaging scheme required to achievesatisfactory data coverage and accuracy. The outputis 18 year-long records of ice-shelf surface height,which we then analysed using statistical tech-niques to derive long-term trends, acceleration anduncertainties.
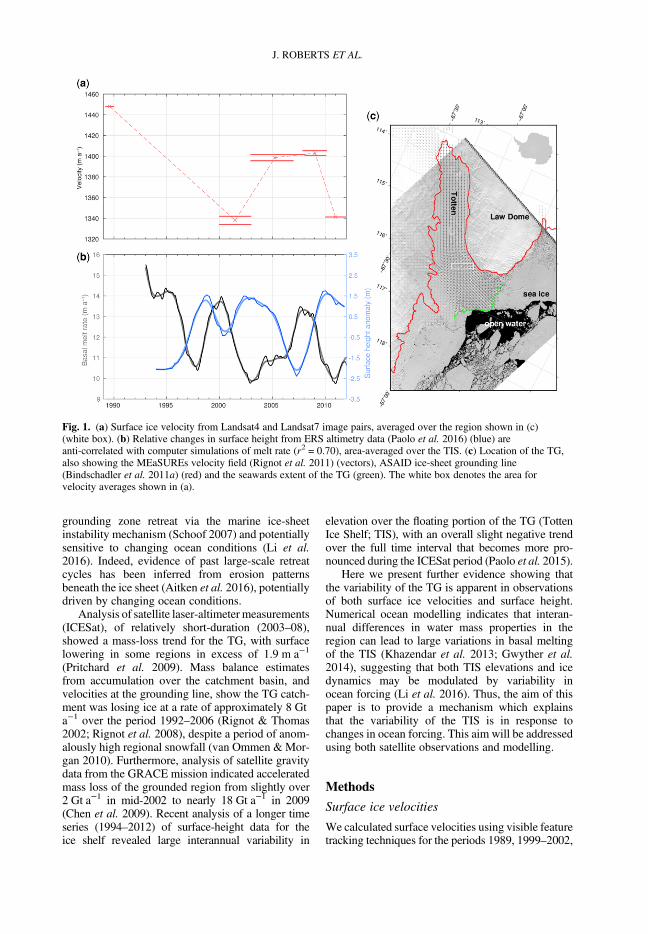
Table 1. Details of Landsat image pairs used to calculate velocity changes
Satellite Path Row Date of initial image Date of final image
Landsat4 102 107 28 March 1989 25 December 1989Landsat7 101 107 30 December 1999 22 December 2002Landsat7 101 107 22 December 2002 6 February 2008Landsat7 101 107 22 December 2002 17 December 2006Landsat7 102 107 6 January 2000 27 November 2002Landsat7 102 107 25 November 2007 18 February 2010Landsat7 102 107 6 January 2000 13 December 2002Landsat7 101 107 6 February 2008 26 January 2010Landsat7 101 107 7 May 2010 30 November 2011
OCEAN FORCING OF TOTTEN GLACIER VARIABILITY
Ice sheet/shelf modelling
Ice sheet and shelf modelling was undertaken (Don-nelly 2014) with a drainage basin regional modelusing the BISICLES model (Cornford et al. 2013,2015). The ‘full Stokes’ equations describing icedynamics are approximated with a so-called higher-order approximation, with vertically integrated treat-ment of momentum for computational efficiency.Horizontal grid resolution varies (1–16 km) through-out the computational domain as a function of theice speed and proximity to the grounding line. Thegeometry is based on the BEDMAP2 (Fretwellet al. 2013) compilation, and an initial thermalstate is specified (Pattyn 2010). The applied patternof ocean-driven melt at the base of the ice shelf isdiagnosed from observed ice-flux divergence, withthe temporal modulation of melt specified as sinusoi-dal with a period of 10 years and an amplitude of 0.5of the temporal average (Donnelly 2014).
Ocean modelling and basal melt
We simulated the ice shelf–ocean interaction withthe Regional Ocean Modeling System (ROMS)(Shchpetkin & McWilliams 2005), a finite-differencemethod ocean model. The primitive equations offluid flow are discretized on a terrain-following ver-tical coordinate, allowing for increased resolutionnear bathymetry/ice-shelf surface and boundary
layers. Modifications are included to simulate tides,ice shelves and for ice–ocean thermodynamics(Galton-Fenzi et al. 2012). Continental shelf anddeep-ocean bathymetry is based on RTOPO (Tim-mermann et al. 2010), while the bathymetry withinthe TIS cavity is added as a constant offset belowthe ice draft (inverted from the ice elevation(ICESAT) assuming a representative density of iceand seawater). The model domain (104.5°E–130°E,68°S–60°S) is forced by relaxation at the lateral(east, north and west) and surface boundaries. SeeGwyther et al. (2014) for a further description ofthe model, including set-up, and the forcing andboundary conditions used here.
Two different models using different atmo-spheric forcing were used. One ocean model simu-lated 1992–2007 with interannual forcing derivedfrom reanalysis products for the lateral boundaries(ECCO2: Menemenlis et al. 2008) and surface(CORE: Large & Yeager 2009) augmented withspecial sensor microwave/imager algorithms forsea-ice production (Tamura et al. 2008), which isdescribed fully in Gwyther et al. (2014). Thismodel is spun-up by 16 years of repeated 1992forcing, at which point the ocean heat content hasapproximately plateaued. The other model runsimulated 1992–2012 conditions with the samefinite-difference code, but employed a more mod-ern ECCO2 version, the reanalysis product ERA-Interim (Dee et al. 2011), for surface forcing and
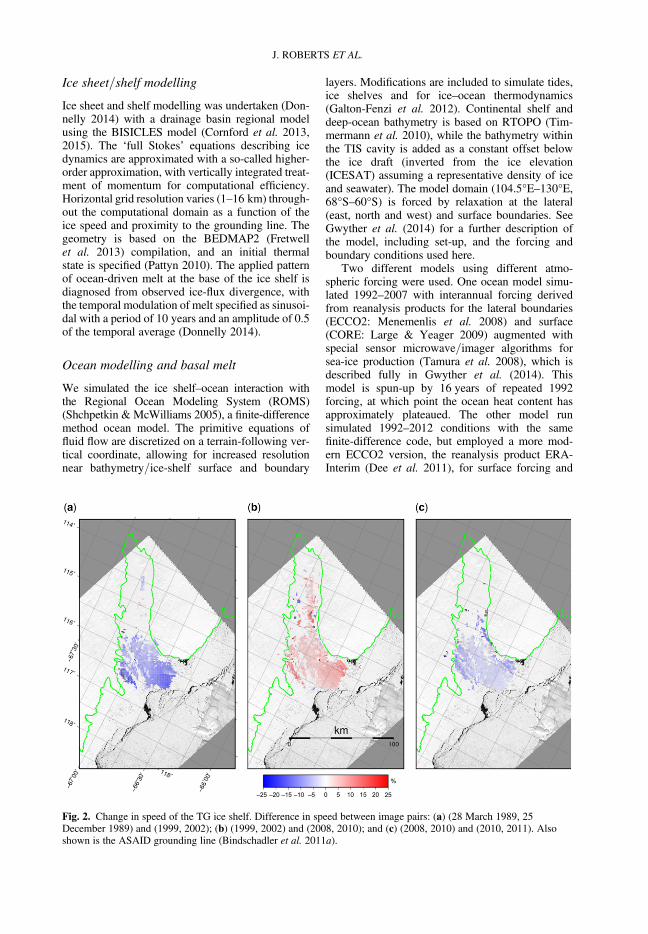
Fig. 2. Change in speed of the TG ice shelf. Difference in speed between image pairs: (a) (28 March 1989, 25December 1989) and (1999, 2002); (b) (1999, 2002) and (2008, 2010); and (c) (2008, 2010) and (2010, 2011). Alsoshown is the ASAID grounding line (Bindschadler et al. 2011a).
J. ROBERTS ET AL.
updated surface sea-ice production rates. Thismodel was run with two periods of 1992–2012 forc-ing (42 years in total), with the first period spinningthe model up and the second period being usedfor analysis.
For comparison with the ocean-model solution,basal melt for the TIS was also calculated from ice-penetrating radar thickness profiles (Young et al.2011) and surface ice velocities (Rignot et al.2011). Both datasets were averaged onto the same1 × 1 km polar stereographic grid. Local mass fluxestimates from coincident thickness and velocitydata points were advected downstream until reachingthe next local mass flux point using a modifiedversion of a the Lagrangian streamline code (Robertset al. 2011), accounting for across-stream conver-gence/divergence. Themass flux difference betweenthese points was assigned uniformly along thestreamline as the average change in mass flux alongthe streamline. All such estimates for each grid cellwhere averaged and a 15 km Gaussian filter applied.This represents an estimate of the local basal meltrate, in general an underestimate as surface snowfallwill have contributed to the along-streamline massflux changes.
Results
We analysed a sequence of ice-surface velocity mea-surements from automated correlation between pairsof co-registered visible-band light satellite images(Scambos et al. 1992; Warner & Roberts 2013)over the period 1989–2012. The results show tem-poral variability in the flow of the TIS during these24 years, in agreement with mass-budget estimates(Li et al. 2016). Between 1989 and 2001, the TISslowed by over 7%, followed by a 4% speed-upbetween 2002 and 2009 and another, more tightlyconstrained, slowdown during 2010–11 of similarmagnitude (Fig. 1a). While the lack of suitable satel-lite imagery leads to sparse temporal coverage, ourvelocity measurements are of sufficient quality tocapture interannual variability (Fig. 2), as it is signif-icantly larger than the uncertainty in each velocitymeasurement. Ice-shelf speeds in the vicinity of therumple near the grounding line are in the range of900–1000 m a−1 (Rignot et al. 2011). The observedvariability of velocity appears linked with an 18 year(1994–2011) record of surface-height change, aver-aged over the central TIS area (Paolo et al. 2015),with an overall trend not significantly different
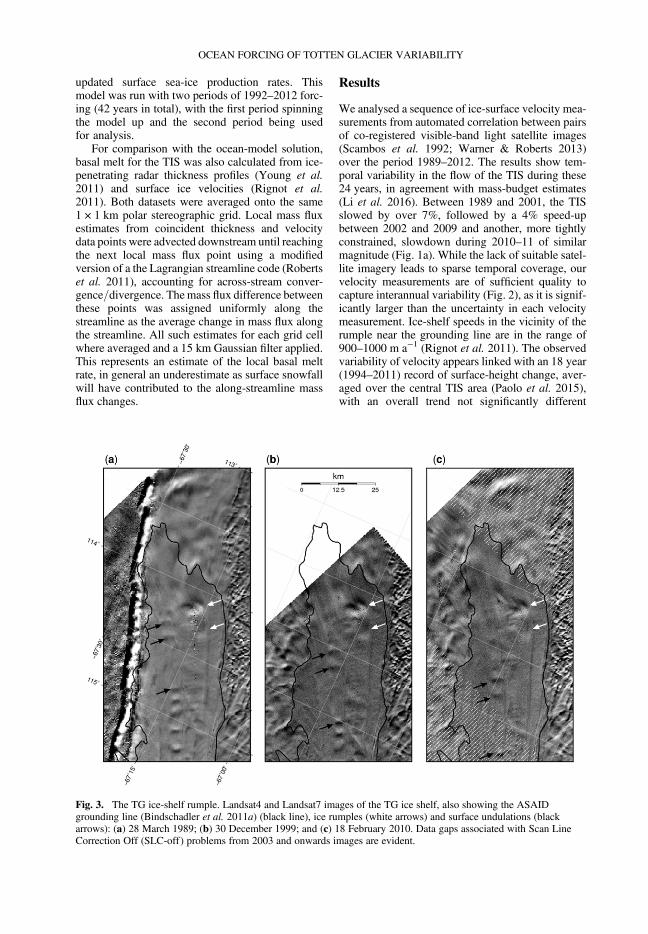
Fig. 3. The TG ice-shelf rumple. Landsat4 and Landsat7 images of the TG ice shelf, also showing the ASAIDgrounding line (Bindschadler et al. 2011a) (black line), ice rumples (white arrows) and surface undulations (blackarrows): (a) 28 March 1989; (b) 30 December 1999; and (c) 18 February 2010. Data gaps associated with Scan LineCorrection Off (SLC-off) problems from 2003 and onwards images are evident.
OCEAN FORCING OF TOTTEN GLACIER VARIABILITY
from zero (Fig. 1b). An approximately 6 year period(2004–09) is characterized by a relatively lowerelevation corresponding to the period of fastersurface velocities.
Hindcast area-averaged TIS basal melt ratesfrom an ocean model (Gwyther et al. 2014), whichshows high variability over a 20 year period (1992–2012), are anti-correlated with surface-height varia-tions (r = 0.70 with a 95% confidence interval of0.69–0.71, calculated using a bootstrap methodtaking into account signal auto-correlation: Ólafsdót-tir & Mudelsee 2014). Increased melting leads to alowering of surface height and vice versa (Fig. 1b),driven primarily by changes in ocean temperature.This result was supported by a second ocean-modelsimulation, although of a shorter 16 year period,using a different source of hindcast forcing (notshown). The average melt rates for the TIS are 9.1 ±2.7 m a−1 for the 16 year run and 12.1 ± 3.0 m a−1
for the 20 year run, in agreement with steady-statemass-budget estimates of 9.2 ± 0.7 m a−1 (Rignotet al. 2013).
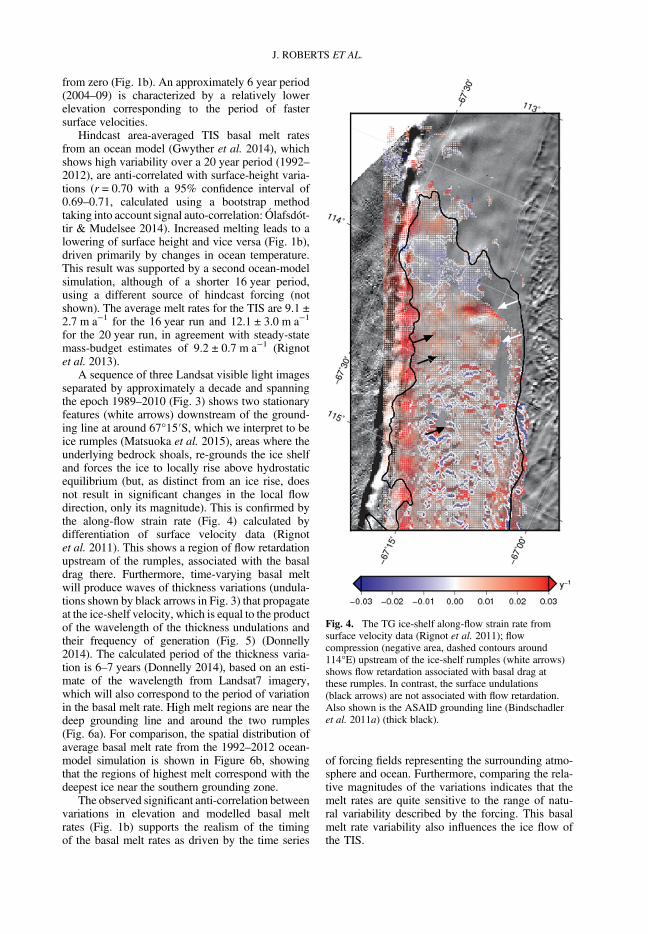
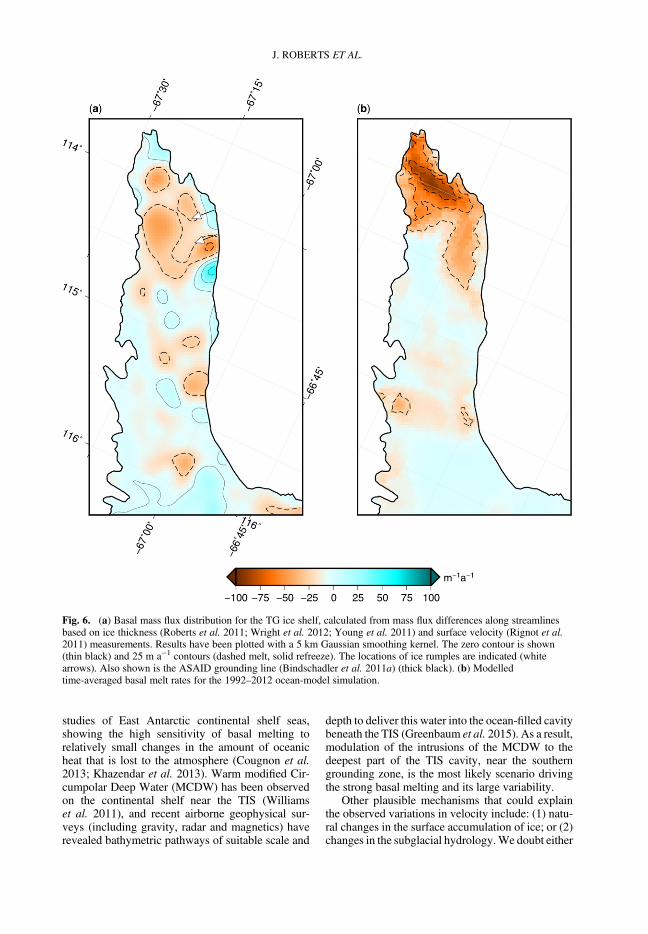
A sequence of three Landsat visible light imagesseparated by approximately a decade and spanningthe epoch 1989–2010 (Fig. 3) shows two stationaryfeatures (white arrows) downstream of the ground-ing line at around 67°15′S, which we interpret to beice rumples (Matsuoka et al. 2015), areas where theunderlying bedrock shoals, re-grounds the ice shelfand forces the ice to locally rise above hydrostaticequilibrium (but, as distinct from an ice rise, doesnot result in significant changes in the local flowdirection, only its magnitude). This is confirmed bythe along-flow strain rate (Fig. 4) calculated bydifferentiation of surface velocity data (Rignotet al. 2011). This shows a region of flow retardationupstream of the rumples, associated with the basaldrag there. Furthermore, time-varying basal meltwill produce waves of thickness variations (undula-tions shown by black arrows in Fig. 3) that propagateat the ice-shelf velocity, which is equal to the productof the wavelength of the thickness undulations andtheir frequency of generation (Fig. 5) (Donnelly2014). The calculated period of the thickness varia-tion is 6–7 years (Donnelly 2014), based on an esti-mate of the wavelength from Landsat7 imagery,which will also correspond to the period of variationin the basal melt rate. High melt regions are near thedeep grounding line and around the two rumples(Fig. 6a). For comparison, the spatial distribution ofaverage basal melt rate from the 1992–2012 ocean-model simulation is shown in Figure 6b, showingthat the regions of highest melt correspond with thedeepest ice near the southern grounding zone.
The observed significant anti-correlation betweenvariations in elevation and modelled basal meltrates (Fig. 1b) supports the realism of the timingof the basal melt rates as driven by the time series
of forcing fields representing the surrounding atmo-sphere and ocean. Furthermore, comparing the rela-tive magnitudes of the variations indicates that themelt rates are quite sensitive to the range of natu-ral variability described by the forcing. This basalmelt rate variability also influences the ice flow ofthe TIS.
Fig. 4. The TG ice-shelf along-flow strain rate fromsurface velocity data (Rignot et al. 2011); flowcompression (negative area, dashed contours around114°E) upstream of the ice-shelf rumples (white arrows)shows flow retardation associated with basal drag atthese rumples. In contrast, the surface undulations(black arrows) are not associated with flow retardation.Also shown is the ASAID grounding line (Bindschadleret al. 2011a) (thick black).
J. ROBERTS ET AL.
Discussion
We suggest that the observed velocity and heightvariations are controlled by ice-shelf back-stressgenerated around two prominent ice rumples nearthe southern grounding zone. The reduced back-stress arises from a combination of basal meltingaround the rumples directly reducing the area of con-tact, and an indirect, lagged response to thinner icethat is transported over the rumples from increasedmelting upstream. This back-stress from the rumpleshas two consequences for the grounded ice stream.First, the drag force of the ice flowing over the rum-ples provides a back-stress, retarding the flow ofthe TIS, as indicated by the observed compressivelongitudinal strain rate. Secondly, reduction in theback-stress induces dynamic thinning of the iceshelf, with subsequent feedbacks on the groundedflow. Modelling shows the thickness of ice flowingover these rumples is highly sensitive to melt rates.Stronger melting thins the ice and reduces back-stress, leading to an increase in ice velocity (Don-nelly 2014) and probable thickness, which is likelyto impact the location of the grounding zone. Theobserved thinning (thickening) appears coincidentwith faster (slower) velocities, which when consid-ered along with the modelling results suggests adynamic ice response to the variations in ice-shelfthickness and flow, driven by changes to the retard-ing (back-stress) forces present in the system due
in turn to ocean-driven variability in the basalmelt rates.
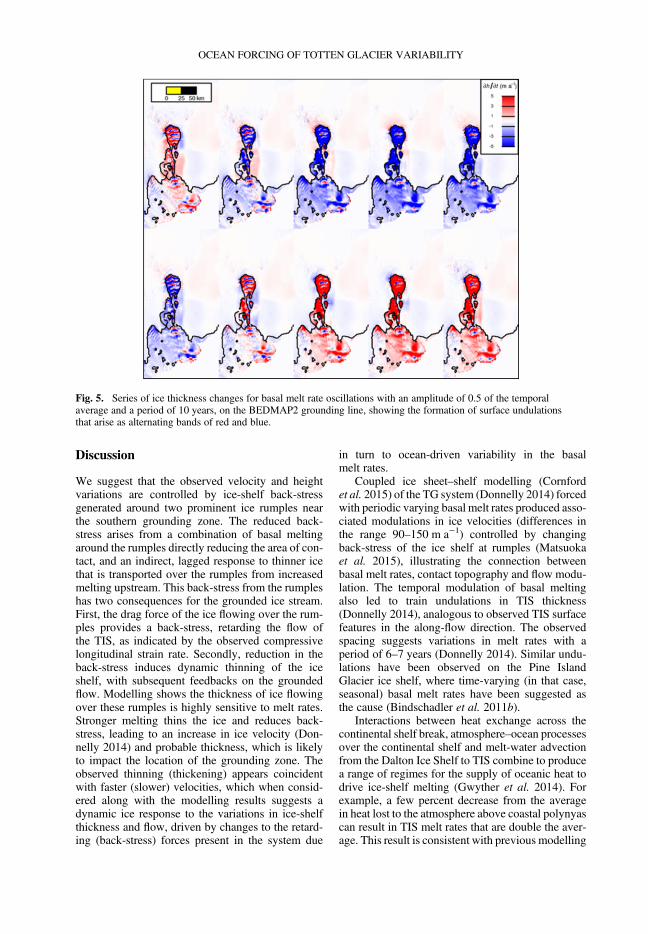
Coupled ice sheet–shelf modelling (Cornfordet al. 2015) of the TG system (Donnelly 2014) forcedwith periodic varying basal melt rates produced asso-ciated modulations in ice velocities (differences inthe range 90–150 m a−1) controlled by changingback-stress of the ice shelf at rumples (Matsuokaet al. 2015), illustrating the connection betweenbasal melt rates, contact topography and flow modu-lation. The temporal modulation of basal meltingalso led to train undulations in TIS thickness(Donnelly 2014), analogous to observed TIS surfacefeatures in the along-flow direction. The observedspacing suggests variations in melt rates with aperiod of 6–7 years (Donnelly 2014). Similar undu-lations have been observed on the Pine IslandGlacier ice shelf, where time-varying (in that case,seasonal) basal melt rates have been suggested asthe cause (Bindschadler et al. 2011b).
Interactions between heat exchange across thecontinental shelf break, atmosphere–ocean processesover the continental shelf and melt-water advectionfrom the Dalton Ice Shelf to TIS combine to producea range of regimes for the supply of oceanic heat todrive ice-shelf melting (Gwyther et al. 2014). Forexample, a few percent decrease from the averagein heat lost to the atmosphere above coastal polynyascan result in TIS melt rates that are double the aver-age. This result is consistent with previous modelling
Fig. 5. Series of ice thickness changes for basal melt rate oscillations with an amplitude of 0.5 of the temporalaverage and a period of 10 years, on the BEDMAP2 grounding line, showing the formation of surface undulationsthat arise as alternating bands of red and blue.
OCEAN FORCING OF TOTTEN GLACIER VARIABILITY
studies of East Antarctic continental shelf seas,showing the high sensitivity of basal melting torelatively small changes in the amount of oceanicheat that is lost to the atmosphere (Cougnon et al.2013; Khazendar et al. 2013). Warm modified Cir-cumpolar Deep Water (MCDW) has been observedon the continental shelf near the TIS (Williamset al. 2011), and recent airborne geophysical sur-veys (including gravity, radar and magnetics) haverevealed bathymetric pathways of suitable scale and
depth to deliver this water into the ocean-filled cavitybeneath the TIS (Greenbaum et al. 2015). As a result,modulation of the intrusions of the MCDW to thedeepest part of the TIS cavity, near the southerngrounding zone, is the most likely scenario drivingthe strong basal melting and its large variability.
Other plausible mechanisms that could explainthe observed variations in velocity include: (1) natu-ral changes in the surface accumulation of ice; or (2)changes in the subglacial hydrology.We doubt either
Fig. 6. (a) Basal mass flux distribution for the TG ice shelf, calculated from mass flux differences along streamlinesbased on ice thickness (Roberts et al. 2011; Wright et al. 2012; Young et al. 2011) and surface velocity (Rignot et al.2011) measurements. Results have been plotted with a 5 km Gaussian smoothing kernel. The zero contour is shown(thin black) and 25 m a−1 contours (dashed melt, solid refreeze). The locations of ice rumples are indicated (whitearrows). Also shown is the ASAID grounding line (Bindschadler et al. 2011a) (thick black). (b) Modelledtime-averaged basal melt rates for the 1992–2012 ocean-model simulation.
J. ROBERTS ET AL.
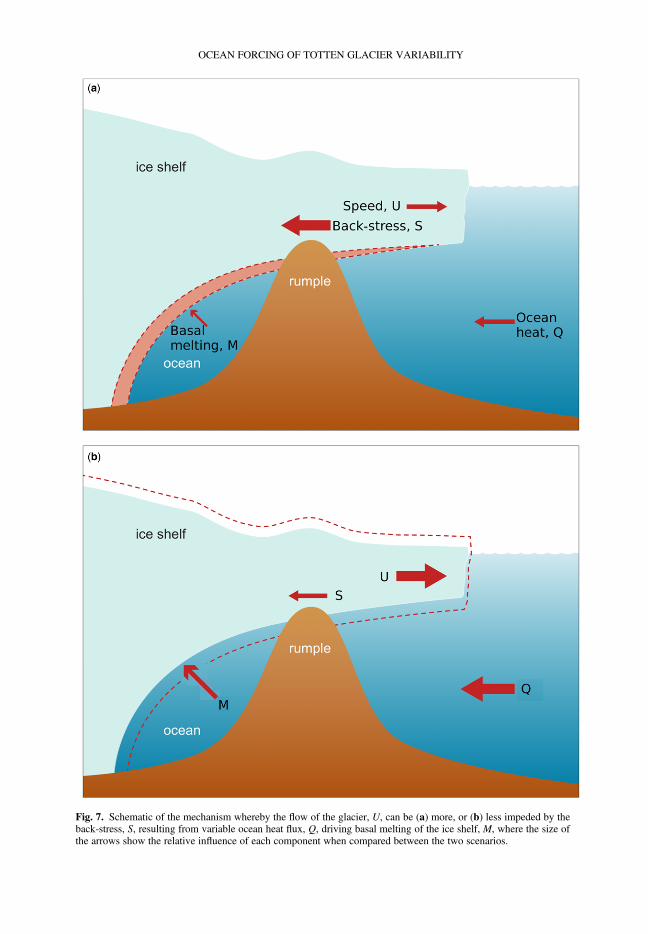
Fig. 7. Schematic of the mechanism whereby the flow of the glacier, U, can be (a) more, or (b) less impeded by theback-stress, S, resulting from variable ocean heat flux, Q, driving basal melting of the ice shelf, M, where the size ofthe arrows show the relative influence of each component when compared between the two scenarios.
OCEAN FORCING OF TOTTEN GLACIER VARIABILITY
can account for the observations. Increased accumu-lation could act to make the ice plain more firmlygrounded, which could slow both the TG and TIS.However, we expect the adjustment in ice flow inresponse to accumulation changes to be much slowerthan observed. Alternatively, there is mountingevidence for an extensive hydrological system inthe Aurora Subglacial Basin (Wright et al. 2012),including subglacial lake discharge events (Smithet al. 2009). Variable basal hydrology is thought toinfluence glacier dynamics (Stearns et al. 2008;Stearns 2011). If the primary mechanism is changingbasal hydrology, then this requires relatively lessinfluence of the basal hydrology during the periods1999–2002 and post-2010. Opportunities for tempo-rary water storage (such as lakes that drain and fill)in the region are limited (Wright et al. 2012), sug-gesting that obvious hydrological-induced ice-flowchanges are unlikely to be responsible for the obser-vations reported here (Fig. 7). In addition, no sub-stantial basal water transfer, as has been inferredfrom satellite altimetry in other regions, has beenobserved in the TG.
We therefore hypothesis the two main modes ofvariation of this system are as follows: (A) duringperiods of cool ocean forcing, basal melt rates arelower and the ice shelf thickens, leading to increas-ing back-stress at rumples, and the ice flow decreases(Fig. 7a); and (B) during periods of warm ocean forc-ing, basal melt rates are higher and the ice shelf thins,decreasing the back-stress at rumples, and the iceflow increases (Fig. 7b). Observational evidencedoes not exist to quantify how promptly the responseshould be between enhanced melting, which mayoccur in a region upstream of the rumple, and theadvection of ice thickness into the region controllingback-stress that is sufficient to change the ice flow.However, we suggest that a time delay betweenmelt-ing and velocity changes is likely to be small giventhe proximity of the rumples to the region of deepestice and highest melting near the grounding line.
Conclusions
From observations and modelling results presentedhere, we conclude that the variability of the TGover the past two decades is primarily ocean-driven.In particular, the anti-correlation of observed broad-scale elevation changes and modelled melt ratessupport the timing and overall magnitude of themodelled melt rates, and indicates a high sensitivityof the TIS melt rates to ocean forcing. We argue thatthe strong variation in melt rate modulates the icedynamics via the rumples that lie near the groundingline. It is likely that thinning, acceleration andgrounding zone retreat of the TG will occur if sub-ice-shelf ocean temperatures, and associated basal
melt rates, rise in the future (Sun et al. 2016). Ourresults also demonstrate that the TIS is sensitiveto relatively small changes in the supply of oceanicheat into the ice-shelf ocean cavity. In particular,variation in basal melting leads to periodic changesin back-stress at topographical rumples, which actto control ice-shelf velocity. This interplay betweenocean forcing, bedrock topography and ice dynamicsis analogous to changes observed for the Pine Islandregion in West Antarctica (Jacobs et al. 2011), and ifTG responds in the same way, the melting mayexceed the ice inflow, leading to sub-ice-shelf cavityenlargement and retreat of the grounding line.
This work was supported by, Australian Antarctic Divisionprojects 3103, 4077, 4287 and 4346, National ComputingInfrastructure grant m68, NSF grant ANT-0733025, NASAgrant NNX09AR52G (Operation Ice Bridge), NERCgrant NE/F016646/1, NERC fellowship NE/G012733/2, the Jackson School of Geoscience, the Jet PropulsionLaboratory and the G. Unger Vetlesen Foundation. Thisresearch was also supported by the Australian Govern-ment’s Cooperative Research Centres Programme throughthe Antarctic Climate & Ecosystems Cooperative ResearchCentre. The work is also supported under the AustralianResearch Council’s Special Research Initiative for Antarc-tic Gateway Partnership SR140300001. Landsat4 andLandsat7 images are courtesy of the United States Geolog-ical Survey. This is UTIG contribution No. 2486. Thanks toBenoit Legresy for useful discussions.
References
AITKEN, A.R.A., ROBERTS, J.L. ET AL. 2016. Repeated large-scale retreat and advance of Totten Glacier indicated byinland bed erosion. Nature, 533, 385–389.
BINDSCHADLER, R., CHOI, H. ET AL. 2011a. Getting aroundAntarctica: new high-resolution mappings of thegrounded and freely-floating boundaries of the Antarc-tic ice sheet created for the International Polar Year.The Cryosphere, 5, 569–588, https://doi.org/10.5194/tc-5-569-2011
BINDSCHADLER, R., VAUGHAN, D.G. & VORNBERGER, P.2011b. Variability of basal melt beneath the PineIsland Glacier ice shelf, West Antarctica. Journal ofGlaciology, 57, 581–595, https://doi.org/10.3189/002214311797409802
BRENNER, A.C., BINDSCHADLER, R.A., THOMAS, R.H. &ZWALLY, H.J. 1983. Slope-induced errors in radar altim-etry over continental ice sheets. Journal of GeophysicalResearch, 88, 1617–1623.
CHEN, J.L., WILSON, C.R., BLANKENSHIP, D. & TAPLEY, B.D.2009. Accelerated Antarctic ice loss from satellite grav-ity measurements. Nature Geoscience, 2, 859–862,https://doi.org/10.1038/ngeo694
CORNFORD, S.L., MARTIN, D.F. ET AL. 2013. Adaptive mesh,finite volume modeling of marine ice sheets. Journal ofComputational Physics, 232, 529–549, https://doi.org/10.1016/j.jcp.2012.08.037
CORNFORD, S.L., MARTIN, D.F. ET AL. 2015. Century-scalesimulations of the response of the West Antarctic Ice
J. ROBERTS ET AL.
Sheet to a warming climate. The Cryosphere, 9,1579–1600, https://doi.org/10.5194/tc-9-1579-2015
COUGNON, E.A., GALTON-FENZI, B.K., MEIJERS, A.J.S. &LEGRESY, B. 2013. Modeling interannual dense shelfwater export in the region of the Mertz Glacier Tongue(1992–2007). Journal of Geophysical Research:Oceans, 118, 5858–5872, https://doi.org/10.1002/2013JC008790
DAVIS, C.H. & FERGUSON, A.C. 2004. Elevation change ofthe Antarctic ice sheet, 1995–2000, from ERS-2 satel-lite radar altimetry. IEEE Transactions on GeoscienceRemote Sensing, 42, 2437–2445.
DEE, D.P., UPPALA, S.M. ET AL. 2011. The ERA-Interimreanalysis: configuration performance of the dataassimilation system. Quarterly Journal of the RoyalMeteorological Society, 137, 553–597, https://doi.org/10.1002/qj.828
DONNELLY, C. 2014.Dynamics sensitivity of Totten Glacier,East Antarctica, in Response to Ocean-Driven Change.School of Geographical Sciences, University of Bristol,Bristol, UK.
FEMENIAS, P. 1996. ERS QLOPR OPR Range Processing.ESA/ESRIN Technical Note ER-TN-RS-RA-0022.European Space Agency/European Space ResearchInstitute, Frascati, Italy.
FRETWELL, P., PRITCHARD, H.D. ET AL. 2013. Bedmap2:improved ice bed, surface thickness datasets for Antarc-tica. The Cryosphere, 7, 375–393, https://doi.org/10.5194/tc-7-375-2013
GALTON-FENZI, B.K., COLEMAN, R., HUNTER, J. & MARS-
LAND, S. 2012. Modelling the basal melting marine iceaccretion of the amery ice shelf. Journal of GeophysicalResearch: Oceans, 117, C09031, https://doi.org/10.1029/2012JC008214
GREENBAUM, J.S., BLANKENSHIP, D.D. ET AL. 2015. Oceanaccess to a cavity beneath Totten Glacier in East Antarc-tica. Nature Geoscience, 8, 294–298, https://doi.org/10.1038/NGEO2388
GWYTHER, D.E., GALTON-FENZI, B.K., HUNTER, J.R. &ROBERTS, J.L. 2014. Simulated melt rates for the TottenDalton ice shelves. Ocean Science, 10, 267–279,https://doi.org/10.5194/os-10-267-2014
JACOBS, S.S., JENKINS, A., GIULIVI, C.F. & DUTRIEUX, P.2011. Stronger ocean circulation increased meltingunder Pine Island Glacier ice shelf. Nature Geoscience,4, 519–523, https://doi.org/10.1038/ngeo1188
KHAZENDAR, A., SCHODLOK, M.P., FENTY, I., LIGTENBERG, S.R.M., RIGNOT, E. & VAN DEN BROEKE, M.R. 2013.Observed thinning of Totten Glacier is linked to coastalpolynya variability. Nature Communications, 4, 2857
LARGE, W.G. &YEAGER, S.G. 2009. The global climatologyof an interannually varying air-sea flux data set.ClimateDynamics, 33, 341–364, https://doi.org/10.1007/s00382-008-0441-3
LI, X., RIGNOT, E., MORLIGHEM, M., MOUGINOT, J. &SCHEUCHL, B. 2015. Grounding line retreat of TottenGlacier, East Antarctica, 1996 to 2013. GeophysicalResearch Letters, 42, 8049–8056, https://doi.org/10.1002/2015GL065701
LI, X., RIGNOT, E., MOUGINOT, J. & SCHEUCHL, B. 2016.Ice flow dynamics and mass loss of Totten Glacier,East Antarctica, from 1989 to 2015. GeophysicalResearch Letters, 43, 6366–6373, https://doi.org/10.1002/2016GL069173
MATSUOKA, K., HINDMARSH, R.C.A. ET AL. 2015. Antarcticice rises and rumples: their properties and significancefor ice-sheet dynamics and evolution. Earth-ScienceReviews, 150, 724–745.
MENEMENLIS, D., CAMPIN, J-M. ET AL. 2008. ECCO2: highresolution global ocean and sea ice data synthesis.Mercator Ocean Quarterly Newsletter, 31, 13–21.
ÓLAFSDÓTTIR, K.B. & MUDELSEE, M. 2014. More accurate,calibrated bootstrap confidence intervals for estimatingthe correlation between two time series. MathematicalGeosciences, 46, 411–427, https://doi.org/10.1007/s11004-014-9523-4
PAOLO, F.S., FRICKER, H.A. & PADMAN, L. 2015. Volume lossfrom Antarctic ice shelves is accelerating. Science, 348,327–331, https://doi.org/10.1126/science.aaa0940
PAOLO, F.S., FRICKER, H.A. & PADMAN, L. 2016. Construct-ing improved decadal records of Antarctic ice shelfheight change from multiple satellite radar altimeters.Remote Sensing of Environment, 177, 192–205.
PATTYN, F. 2010. Antarctic subglacial conditions inferredfrom a hybrid ice sheet/ice stream model. Earth andPlanetary Science Letters, 295, 451–461, https://doi.org/10.1016/j.epsl.2010.04.025
PRITCHARD, H.D., ARTHERN, R.J., VAUGHAN, D.G. & EDWARDS,L.A. 2009. Extensive dynamic thinning on the margins ofthe Greenland Antarctic ice sheets.Nature, 461, 971–975.
PRITCHARD, H.D., LIGTENBERG, S.R.M., FRICKER, H.A.,VAUGHAN, D.G., VAN DEN BROEKE, M.R. & PADMAN, L.2012. Antarctic ice-sheet loss driven by basal meltingof ice shelves. Nature, 484, 502–505, https://doi.org/10.1038/nature10968
RIGNOT, E. & THOMAS, R.H. 2002.Mass balance of polar icesheets. Science, 297, 1502–1506, https://doi.org/10.1126/science.1073888
RIGNOT, E., BAMBER, J.L., VAN DEN BROEKE, M.R., DAVIS, C.,LI, Y., VAN DE BERG, W.J. & VAN MEIJGAARD, E. 2008.Recent Antarctic ice mass loss from radar interferome-try regional climate modelling. Nature Geoscience, 1,106–110, https://doi.org/10.1038/ngeo102
RIGNOT, E., MOUGINOT, J & SCHEUCHL, B. 2011. Ice flowof the Antarctic ice sheet. Science, 333, 1427–1430,https://doi.org/10.1126/science.1208336
RIGNOT, E., JACOBS, S., MOUGINOT, J. & SCHEUCHL, B. 2013.Ice-shelf melting around antarctica. Science, 341,266–270, https://doi.org/10.1126/science.1235798
ROBERTS, J.L., WARNER, R.C. ET AL. 2011. Refined broad-scale sub-glacial morphology of Aurora SubglacialBasin, East Antarctica derived by an ice-dynamics-basedinterpolation scheme. The Cryosphere, 5, 551–560.
ROUSSEEUW, P. & HUBERT, M. 1997. Recent developmentsin PROGRESS. In: DODGE, Y. (ed.) L1-Statistical Pro-cedures and Related Topics: Papers from the 3rd Inter-national Conference on L1-Norm and Related Methodsheld in Neuchâtel, August 11–15, 1997. Institute ofMathematical Statistics Lecture Notes, MonographSeries, 31, 201–214.
SCAMBOS, T.A., DUTKIEWICZ, M.J., WILSON, J.C. & BIND-
SCHADLER, R.A. 1992. Application of image cross-correlation to the measurement of glacier velocityusing satellite image data. Remote Sensing of Environ-ment, 42, 177–186.
SCHARROO, R. & VISSER, P. 1998. Precise orbit determinationgravity field improvement for the ERS satellites. Journalof Geophysical Research: Oceans, 103, 8113–8127.
OCEAN FORCING OF TOTTEN GLACIER VARIABILITY
SCHOOF, C. 2007. Ice sheet grounding line dynamics: steadystates, stability, hysteresis. Journal of GeophysicalResearch: Earth Surface, 112, F03S28, https://doi.org/10.1029/2006JF000664
SHCHPETKIN, A.F. & MCWILLIAMS, J.C. 2005. The regionaloceanic modeling system (ROMS): a split-explicit,free-surface, topography-following-coordinate oceanicmodel. Ocean Modelling, 9, 347–404, https://doi.org/10.1016/j.ocemod.2004.08.002
SHEPHERD, A. & WINGHAM, D. 2007. Recent sea-level con-tributions of the antarctic and greenland ice sheets. Sci-ence, 315, 1529–1532.
SMITH, B.E., FRICKER, H.A., JOUGHIN, I.R. & TULACZYK, S.2009. An inventory of active subglacial lakes in Antarc-tica detected by ICESat (2003–2008). Journal of Glaci-ology, 55, 573–595, https://doi.org/10.3189/002214309789470879
STEARNS, L.A. 2011. Dynamics mass balance of fourlarge East Antarctic outlet glaciers. Annals of Glaciol-ogy, 52, 116–126, https://doi.org/10.3189/172756411799096187
STEARNS, L.A., SMITH, B.E. & HAMILTON, G.S. 2008.Increased flow speed on a large East Antarctic outletglacier caused by subglacial floods.Nature Geoscience,1, 827–831, https://doi.org/10.1038/ngeo356
SUN, S., CORNFORD, S.L., GWYTHER, D.E., GLADSTONE, R.M.,GALTON-FENZI, B.K., ZHAO, L. & MOORE, J.C. 2016.Impact of ocean forcing on the Aurora Basin in the21st–22nd centuries. Annals of Glaciology, 57,79–86, https://doi.org/10.1017/aog.2016.27
TAMURA, T., OHSHIMA, K.I. & NIHASHI, S. 2008. Mapping ofsea ice production for Antarctic coastal polynyas. Geo-physical Research Letters, 35, L07606, https://doi.org/10.1029/2007GL032903
TIMMERMANN, R., LE BROCQ, A. ET AL. 2010. A consistentdata set of Antarctic ice sheet topography, cavitygeometry, global bathymetry. Earth System ScienceData, 2, 261–273, https://doi.org/10.5194/essd-2-261-2010
VAN OMMEN, T.D. &MORGAN, V. 2010. Snowfall increase incoastal East Antarctica linked with southwest WesternAustralian drought. Nature Geoscience, 3, 267–272,https://doi.org/10.1038/ngeo761
WARNER, R.C. & ROBERTS, J.L. 2013. Pine Island Glacier(Antarctica) velocities from Landsat7 images between2001 and 2011: FFT-based image correlation forimages with data gaps. Journal of Glaciology, 59,571–582, https://doi.org/10.3189/2013JoG12J113
WILLIAMS, G.D., MEIJERS, A.J.S., POOLE, A., MATHIOT, P.,TAMURA, T. & KLOCKER, A. 2011. Late winter oceanog-raphy off the Sabrina BANZARE coast (117–128°E),East Antarctica. Deep-Sea Research Part II: TopicalStudies in Oceanography, 58, 1194–1210, https://doi.org/10.1016/j.dsr2.2010.10.035
WINGHAM, D.J., WALLIS, D.W. & SHEPHERD, A. 2009.Spatial temporal evolution of Pine Island Glacier thin-ning, 1995–2006. Geophysical Research Letters, 36,L17501.
WRIGHT, A.P., YOUNG, D.A. ET AL. 2012. Evidence of ahydrological connection between the ice divide andice sheet margin in the Aurora Subglacial Basin, EastAntarctica. Journal of Geophysical Research: EarthSurface, 117, F01033, https://doi.org/10.1029/2011JF002066
YOUNG, D.A., WRIGHT, A.P. ET AL. 2011. A dynamic earlyEast Antarctic Ice Sheet suggested by ice-coveredfjord landscapes. Nature, 474, 72–75.
ZWALLY, H.J. & BRENNER, A.C. 2001. Ice Sheet dynamicsmass balance. In: FU, L.L.&CAZENAVE, A. (eds) SatelliteAltimetry Earth Sciences. Academic Press, New York,351–369.
ZWALLY, H.J., BINDSCHADLER, R.A., BRENNER, A.C., MAJOR,J.A. & MARSH, J.G. 1989. Growth of Greenland Icesheet: measurement. Science, 246, 1587–1589.
ZWALLY, H.J., GIOVINETTO, M. ET AL. 2005. Mass changes ofthe GreenlandAntarctic ice sheets shelves contributionsto sea-level rise: 1992–2002. Journal of Glaciology, 51,509–527.
J. ROBERTS ET AL.