Embed Size (px)
Citation preview
CDP CDP 2017 Climate Change 2017 Information Request
Coca-Cola HBC AG
Module: Introduction
Page: Introduction
CC0.1
Introduction Please give a general description and introduction to your organization. We’re one of the world’s largest bottlers of drinks from The Coca Cola Company and our business has a strong foundation for long-term growth. Coca‑ Cola HBC (Coca‑ Cola Hellenic Bottling Company) is a bottling partner of The Coca‑ Cola Company. This means that The Coca‑ Cola Company manufactures and sells concentrates, bases and syrups to its bottling partners, owns the brands and is responsible for consumer brand marketing initiatives. We use the concentrates and syrups to manufacture, package, merchandise and distribute the final branded products to our trade partners and consumers. Selling more than 2 billion unit cases every year – that’s 50 billion servings – we’re one of the world’s largest bottlers of The Coca‑ Cola Company’s brands. We operate in 28 countries, serving 595m potential consumers across three continents and having 136 brands in our diverse portfolio. We bottle, sell and distribute the world’s most recognised soft drink: Coca‑ Cola. Along with Coca‑ Cola Light, Sprite and Fanta, also licensed to us by The Coca‑ Cola Company, these are four of the world’s five best-selling non-alcoholic ready-to drink beverages. Still drinks – water, juices, tea and energy drinks – make up to 31 percent of our volume. This diverse portfolio means that we’re a strong partner for our customers and provide great choice for consumers. We’ve integrated sustainability and corporate responsibility into every part of our business, aiming to build long-term value for our stakeholders. Coca‑ Cola HBC is headquartered in Zug, Switzerland and has a premium listing on the London Stock Exchange and secondary listing on the Athens Exchange. Our two major shareholders are the Kar-Tess Holding S.A., a private holding company, and The Coca‑ Cola Company.
CC0.2
Reporting Year Please state the start and end date of the year for which you are reporting data. The current reporting year is the latest/most recent 12-month period for which data is reported. Enter the dates of this year first. We request data for more than one reporting period for some emission accounting questions. Please provide data for the three years prior to the current reporting year if you have not provided this information before, or if this is the first time you have answered a CDP information request. (This does not apply if you have been
offered and selected the option of answering the shorter questionnaire). If you are going to provide additional years of data, please give the dates of those reporting periods here. Work backwards from the most recent reporting year. Please enter dates in following format: day(DD)/month(MM)/year(YYYY) (i.e. 31/01/2001).
Enter Periods that will be disclosed
Fri 01 Jan 2016 - Sat 31 Dec 2016
CC0.3
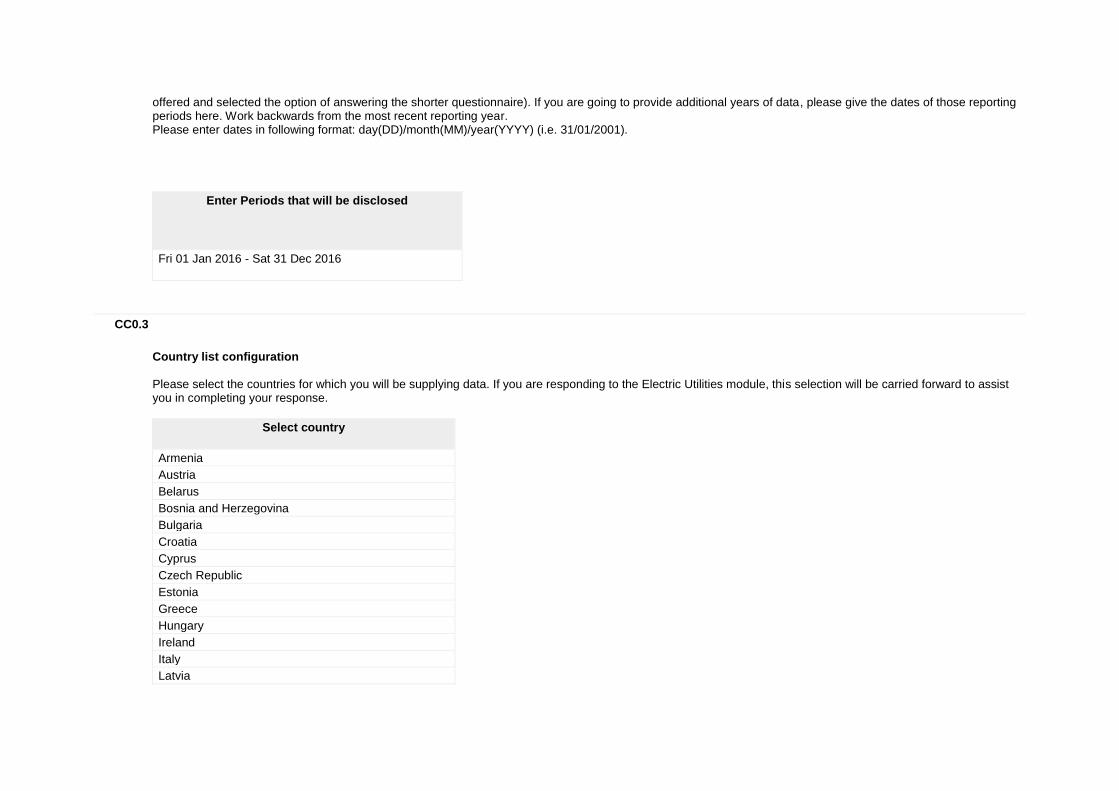
Country list configuration Please select the countries for which you will be supplying data. If you are responding to the Electric Utilities module, this selection will be carried forward to assist you in completing your response.
Select country
Armenia
Austria
Belarus
Bosnia and Herzegovina
Bulgaria
Croatia
Cyprus
Czech Republic
Estonia
Greece
Hungary
Ireland
Italy
Latvia
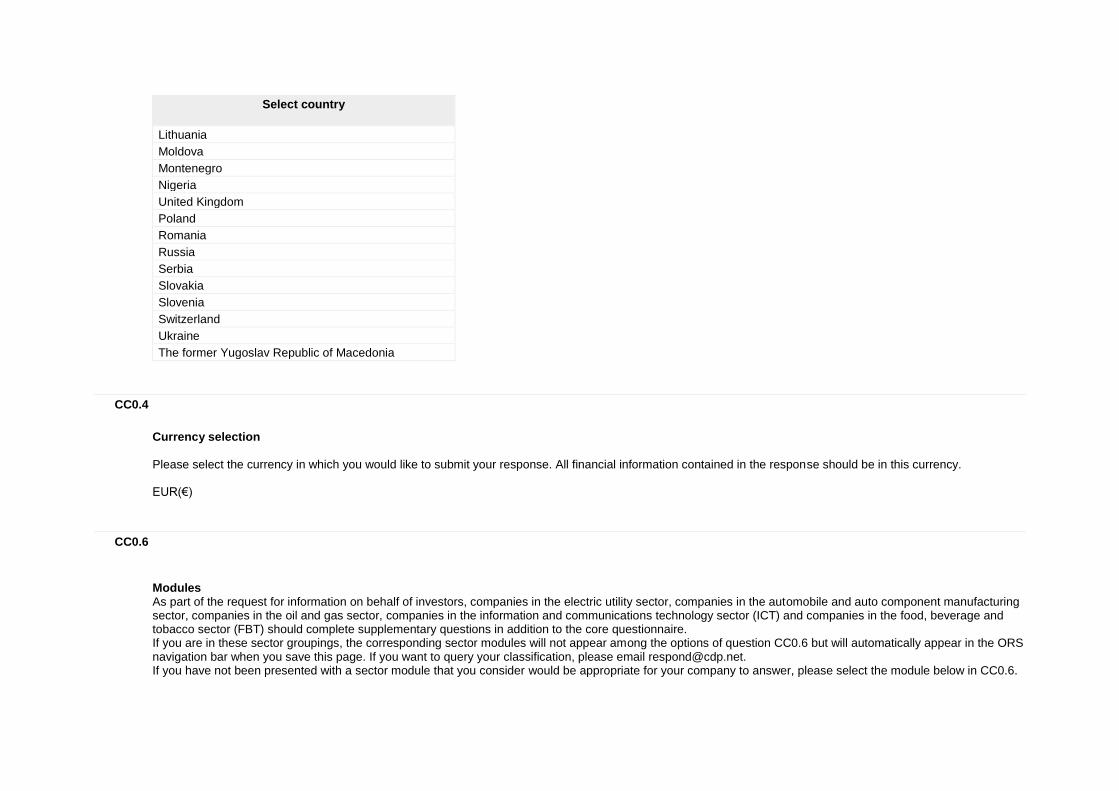
Select country
Lithuania
Moldova
Montenegro
Nigeria
United Kingdom
Poland
Romania
Russia
Serbia
Slovakia
Slovenia
Switzerland
Ukraine
The former Yugoslav Republic of Macedonia
CC0.4
Currency selection Please select the currency in which you would like to submit your response. All financial information contained in the response should be in this currency. EUR(€)
CC0.6
Modules As part of the request for information on behalf of investors, companies in the electric utility sector, companies in the automobile and auto component manufacturing sector, companies in the oil and gas sector, companies in the information and communications technology sector (ICT) and companies in the food, beverage and tobacco sector (FBT) should complete supplementary questions in addition to the core questionnaire. If you are in these sector groupings, the corresponding sector modules will not appear among the options of question CC0.6 but will automatically appear in the ORS navigation bar when you save this page. If you want to query your classification, please email [email protected]. If you have not been presented with a sector module that you consider would be appropriate for your company to answer, please select the module below in CC0.6.

Further Information
Module: Management
Page: CC1. Governance
CC1.1
Where is the highest level of direct responsibility for climate change within your organization? Board or individual/sub-set of the Board or other committee appointed by the Board
CC1.1a
Please identify the position of the individual or name of the committee with this responsibility The Board's Social Responsibility Committee is responsible for the development and supervision of procedures and systems to ensure the pursuit of the Group’s social and environmental goals. The formal role of the Social Responsibility Committee is set out in the charter for the committees of the Board of Directors in Annex C of the Company’s Organisational Regulations. This is available online at http://coca‑ colahellenic.com/en/about-us/corporategovernance/corporate-governance-overview/
CC1.2
Do you provide incentives for the management of climate change issues, including the attainment of targets? Yes
CC1.2a
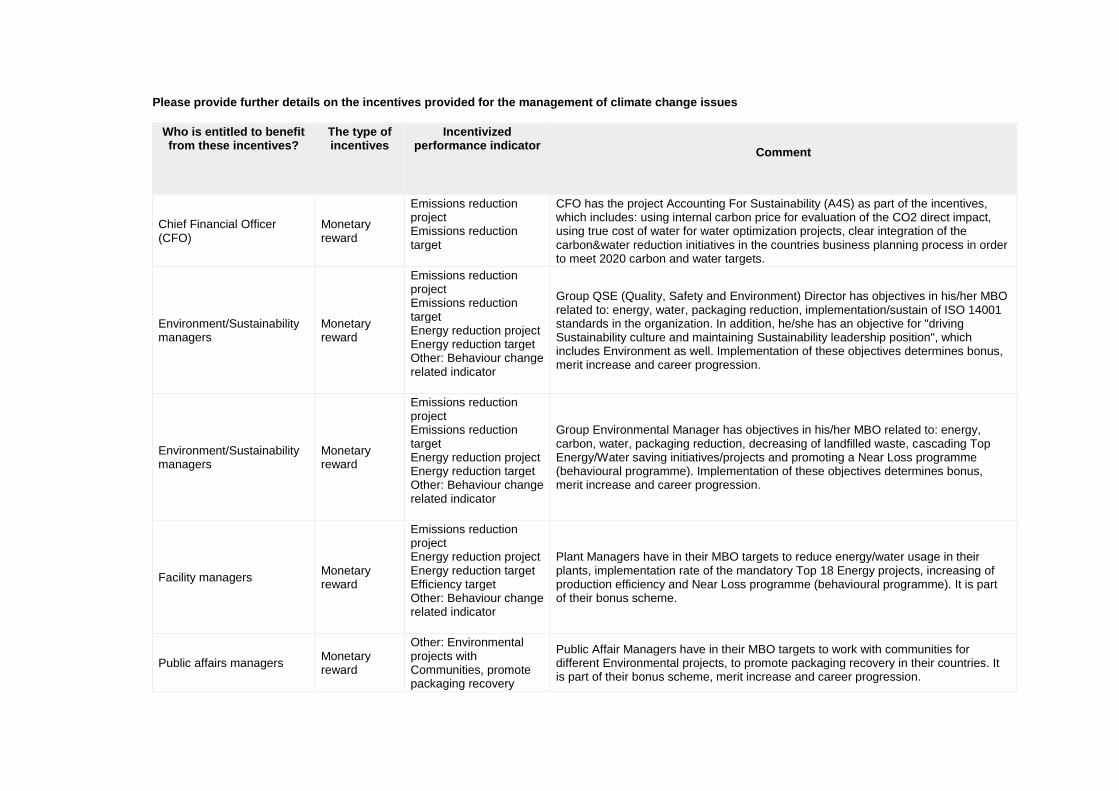
Please provide further details on the incentives provided for the management of climate change issues
Who is entitled to benefit from these incentives?
The type of incentives
Incentivized performance indicator
Comment
Chief Financial Officer (CFO)
Monetary reward
Emissions reduction project Emissions reduction target
CFO has the project Accounting For Sustainability (A4S) as part of the incentives, which includes: using internal carbon price for evaluation of the CO2 direct impact, using true cost of water for water optimization projects, clear integration of the carbon&water reduction initiatives in the countries business planning process in order to meet 2020 carbon and water targets.
Environment/Sustainability managers
Monetary reward
Emissions reduction project Emissions reduction target Energy reduction project Energy reduction target Other: Behaviour change related indicator
Group QSE (Quality, Safety and Environment) Director has objectives in his/her MBO related to: energy, water, packaging reduction, implementation/sustain of ISO 14001 standards in the organization. In addition, he/she has an objective for "driving Sustainability culture and maintaining Sustainability leadership position", which includes Environment as well. Implementation of these objectives determines bonus, merit increase and career progression.
Environment/Sustainability managers
Monetary reward
Emissions reduction project Emissions reduction target Energy reduction project Energy reduction target Other: Behaviour change related indicator
Group Environmental Manager has objectives in his/her MBO related to: energy, carbon, water, packaging reduction, decreasing of landfilled waste, cascading Top Energy/Water saving initiatives/projects and promoting a Near Loss programme (behavioural programme). Implementation of these objectives determines bonus, merit increase and career progression.
Facility managers Monetary reward
Emissions reduction project Energy reduction project Energy reduction target Efficiency target Other: Behaviour change related indicator
Plant Managers have in their MBO targets to reduce energy/water usage in their plants, implementation rate of the mandatory Top 18 Energy projects, increasing of production efficiency and Near Loss programme (behavioural programme). It is part of their bonus scheme.
Public affairs managers Monetary reward
Other: Environmental projects with Communities, promote packaging recovery
Public Affair Managers have in their MBO targets to work with communities for different Environmental projects, to promote packaging recovery in their countries. It is part of their bonus scheme, merit increase and career progression.
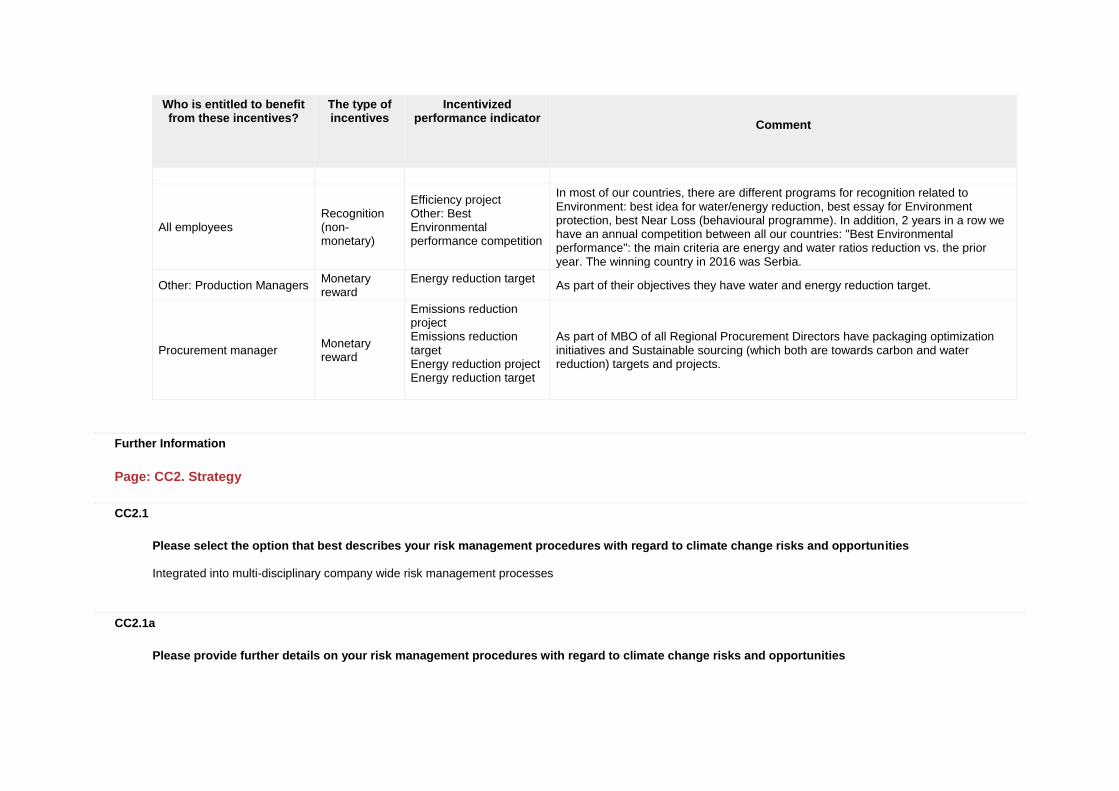
Who is entitled to benefit from these incentives?
The type of incentives
Incentivized performance indicator
Comment
All employees Recognition (non-monetary)
Efficiency project Other: Best Environmental performance competition
In most of our countries, there are different programs for recognition related to Environment: best idea for water/energy reduction, best essay for Environment protection, best Near Loss (behavioural programme). In addition, 2 years in a row we have an annual competition between all our countries: "Best Environmental performance": the main criteria are energy and water ratios reduction vs. the prior year. The winning country in 2016 was Serbia.
Other: Production Managers Monetary reward
Energy reduction target
As part of their objectives they have water and energy reduction target.
Procurement manager Monetary reward
Emissions reduction project Emissions reduction target Energy reduction project Energy reduction target
As part of MBO of all Regional Procurement Directors have packaging optimization initiatives and Sustainable sourcing (which both are towards carbon and water reduction) targets and projects.
Further Information
Page: CC2. Strategy
CC2.1
Please select the option that best describes your risk management procedures with regard to climate change risks and opportunities Integrated into multi-disciplinary company wide risk management processes
CC2.1a
Please provide further details on your risk management procedures with regard to climate change risks and opportunities
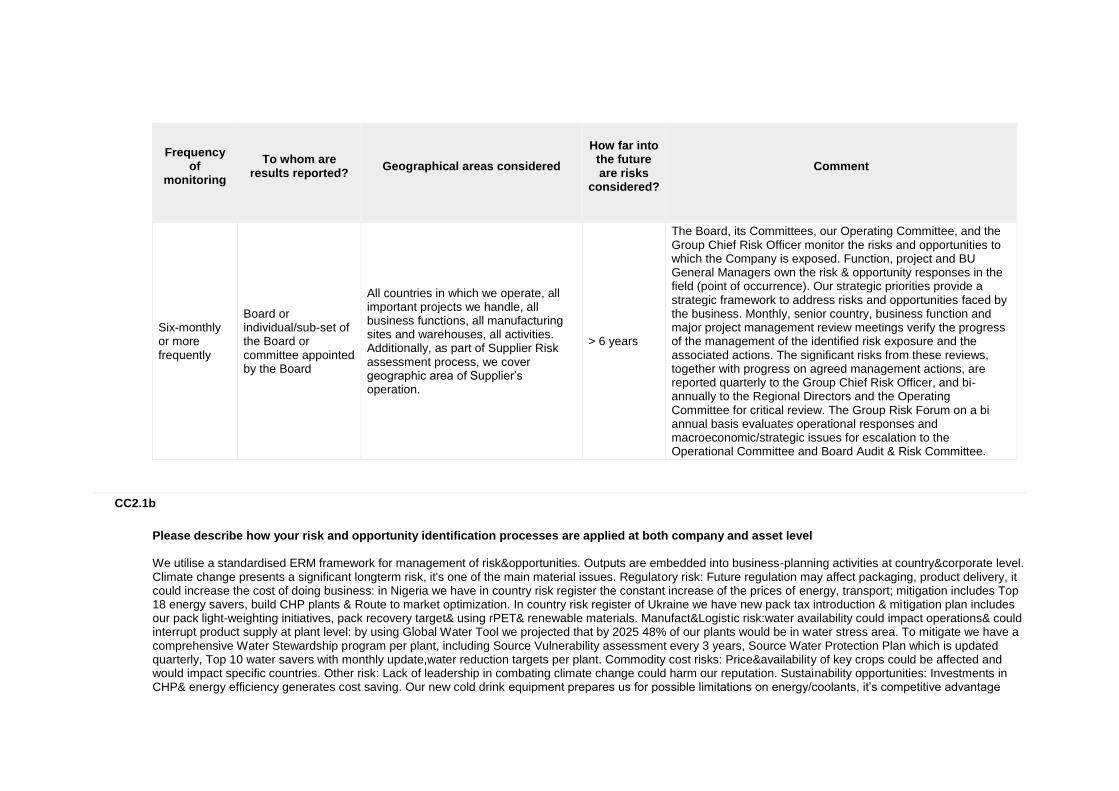
Frequency
of monitoring
To whom are
results reported?
Geographical areas considered
How far into
the future are risks
considered?
Comment
Six-monthly or more frequently
Board or individual/sub-set of the Board or committee appointed by the Board
All countries in which we operate, all important projects we handle, all business functions, all manufacturing sites and warehouses, all activities. Additionally, as part of Supplier Risk assessment process, we cover geographic area of Supplier’s operation.
> 6 years
The Board, its Committees, our Operating Committee, and the Group Chief Risk Officer monitor the risks and opportunities to which the Company is exposed. Function, project and BU General Managers own the risk & opportunity responses in the field (point of occurrence). Our strategic priorities provide a strategic framework to address risks and opportunities faced by the business. Monthly, senior country, business function and major project management review meetings verify the progress of the management of the identified risk exposure and the associated actions. The significant risks from these reviews, together with progress on agreed management actions, are reported quarterly to the Group Chief Risk Officer, and bi-annually to the Regional Directors and the Operating Committee for critical review. The Group Risk Forum on a bi annual basis evaluates operational responses and macroeconomic/strategic issues for escalation to the Operational Committee and Board Audit & Risk Committee.
CC2.1b
Please describe how your risk and opportunity identification processes are applied at both company and asset level We utilise a standardised ERM framework for management of risk&opportunities. Outputs are embedded into business-planning activities at country&corporate level. Climate change presents a significant longterm risk, it's one of the main material issues. Regulatory risk: Future regulation may affect packaging, product delivery, it could increase the cost of doing business: in Nigeria we have in country risk register the constant increase of the prices of energy, transport; mitigation includes Top 18 energy savers, build CHP plants & Route to market optimization. In country risk register of Ukraine we have new pack tax introduction & mitigation plan includes our pack light-weighting initiatives, pack recovery target& using rPET& renewable materials. Manufact&Logistic risk:water availability could impact operations& could interrupt product supply at plant level: by using Global Water Tool we projected that by 2025 48% of our plants would be in water stress area. To mitigate we have a comprehensive Water Stewardship program per plant, including Source Vulnerability assessment every 3 years, Source Water Protection Plan which is updated quarterly, Top 10 water savers with monthly update,water reduction targets per plant. Commodity cost risks: Price&availability of key crops could be affected and would impact specific countries. Other risk: Lack of leadership in combating climate change could harm our reputation. Sustainability opportunities: Investments in CHP& energy efficiency generates cost saving. Our new cold drink equipment prepares us for possible limitations on energy/coolants, it’s competitive advantage
with customers tackling their own footprint. Water stewardship programs protect our physical&social licence to operate. At asset level (plant) we adopted risk processes as part of Environmental Management system: 99.7% of our production volume is certified in ISO14001. Based on that we have specific plans for energy/carbon reduction, energy&renewable investments.
CC2.1c
How do you prioritize the risks and opportunities identified? The Enterprise Risk Management (ERM) approach is used consistently across all business units and operations: the process documents all business related and financial risks against impact, likelihood, vulnerability, etc. Key risks are measured inherently, residually, and by target. The process also documents responsible mitigation plans and accountable managers. Risks are assessed qualitatively and quantitatively across business units, functions and projects. The qualitative assessments are graphically depicted in two ways, as heat maps and risk maps. The Group Business Resilience Function aggregates risks for review by the Group Chief Risk Officer, Regional Directors and the Group Risk Forum on a cyclical timeline. Risks, irrespective of classification, are also evaluated in a quantified risk model. This stage of the risk assessment process is distinct from the qualitative assessment described above as it assesses the residual exposure post management actions as opposed to the pre-management or inherent risk exposure. Actions focusing on mitigation and control are evaluated as to their impact on the overall risk level to formulate target risk as required. The Board approved Risk Management Policy sets the contextual basis for our response and the ERM Framework documents the standardised assessment methodologies utilised. Standardised methodologies enables aggregation and detailed strategic evaluation. Risk sponsors, reporting to the General Managers, have been assigned in all business units and key functions, to drive accountability and focus. Monitoring is performed monthly in Business Units, with quarterly reporting to Group Chief Risk Officer and bi-annual analysis by the Group Risk Forum.
CC2.1d
Please explain why you do not have a process in place for assessing and managing risks and opportunities from climate change, and whether you plan to introduce such a process in future
Main reason for not having a process
Do you plan to introduce a process?
Comment
CC2.2
Is climate change integrated into your business strategy? Yes
CC2.2a
Please describe the process of how climate change is integrated into your business strategy and any outcomes of this process i) How the business strategy has been influenced: We have integrated sustainability into the way we run our business. We identified material issues to our business with our stakeholders and developed ambitious strategies, demanding targets, rigorous governance and integrated reporting. We have also implemented internationally recognized management systems 99.7% of our production volume now comes from plants certified for environment (ISO 14001). In our materiality matrix we have identified several material issues directly linked to climate change: Carbon&energy; Sustainable packaging, recycling and waste management; Sustainable sourcing and Water stewardship. Prior to the UN Climate Change Conference meeting in Paris in late 2015 we joined We Mean Business and we committed to 4 of the initiatives: adopt a science-based emissions reduction target; put a price on carbon; engage responsibly to advance climate policy; and report climate change information in corporate reporting as a fiduciary duty. We have publicly issued our Sustainability commitments and in the area of Environment these are: Reduce direct carbon emissions intensity by 50% (approved science based carbon reduction target); Reduce the carbon emissions intensity in the value chain by 25% (approved science-based target); Cover 40% of total energy use from renewable and clean energy sources; Recover for recycling an average of 40% of total packaging we introduce to our markets; Have 20% of the total PET used coming from recycled PET and/or PET from renewable materials; Reduce the amount of packaging by 25% per litre of beverage produced; Certify over 95% of key agricultural ingredients against the Coca-Cola System’s Supplier Agricultural Guiding Principles; Reduce water use from our plants by 30%; Certify all of our plants in European Water Stewardship or Alliance for Water Stewardship standard. We are among the first 12 companies world-wide with approved by the WRI science-based targets. We have developed and communicated several policies linked to climate: Climate Change Policy, Environmental Policy, Packaging waste & recycling Policy, Water Stewardship Policy, Sustainable Agricultural Guiding principles. ii) Aspects of climate change which have influenced the strategy: •Regulation: increased energy prices and the introduction of CO2 taxes for Scope 1+2 emissions would increase our operational cost. Currently the energy spend is 5%-10% of our OPEX and eventual increase of the energy prices would create 6 Mio € impact on OPEX. An eventual carbon tax of 10 €/t CO2 could have a negative financial effect of 6 Mio €. To mitigate, we put an internal carbon price which we use for our decision making purposes related to investments in energy efficiency, carbon reduction and renewables. We became one of the first 12 companies world-wide with approved science-based carbon reduction targets. In 2016 we invested €6.3 Mio in energy reduction, resulted in 6.2% reduction of direct CO2 vs.2015. •Physical aspect: a) impacts on the supply chain and cost of key raw materials: Poor weather conditions creates significant volatility in our sweeteners’ costs by affecting yields of beet and/or cane crops. For juices extreme weather events can heavily affect availability resulting in high volatility in raw materials cost. Mitigation: work with our suppliers to create joint value programs and reduce costs, complexity and minimize impact on environment. We work with all our ingredients’ suppliers on the adherence to Sustainable Agriculture Guiding Principles which include clear requirements on Environment and Farm Management Systems helping to mitigate climate change risks; b) Water scarcity could restrict the ability of individual sites to produce: we projected that 18% of our sites in some specific geographies would operate in vulnerable areas. Mitigation: setting ambitious water reduction target; set target to have 100% of our plants certified in either European Water Stewardship (EWS) or AWS by 2020; comprehensive Source Vulnerability Assessment, Source Water Protection Programme, Top 10 mandatory Water savers, water replenishment and conservation projects with communities. Physical aspects have triggered the business strategy to have contingency plans, assessments& prevention measures for potential interruptions on business operations. iii) Climate change has influenced short-term strategy (1-3 years) in the aspects of risk management, cost leadership, community trust: • Setting new sustainability targets • Since 2015 all our newly purchased cold drink equipment is HFC-free • Top 18 Energy savers, mandatory for each of our plants • Installing of CHP plants: Totally we have 12 CHP • On-site investments and purchasing of renewable energy: in 2016 27.3% of energy was Renewable&Clean
iv) Long-term business strategy influenced by climate change: • Approved science-based carbon reduction targets for direct operations and the value chain • Using of internal carbon price for decision-making purposes, it is integrated in the financial process • Climate change information is part of our Integrated Annual reports and it is verified by an independent organization for compliance with AA1000AS Assurance Standard, GRI G4 Comprehensive standards, advanced level for COP, Climate Change Reporting Framework • Carbon, energy management and packaging optimization programmes and targets • Partnering with NGOs and INGOs on common issues such as nature conservation • Partnering with local communities to minimise environmental impact • Focus on sustainable procurement v. Strategic advantage over your competitors: • Continuously improved environmental performance increases the reputation and it is recognized by the stakeholders, employees and consumers • Approved science-based carbon reduction targets in both direct operations and the value chain would attract more consumers and are part of our license to operate • Sustainably sourced agricultural raw materials ensure supply and reduce price volatility • Providing HFC-free and energy efficient coolers to our customers make us preferred supplier • Innovation in packaging, such as bio PET bottle gives us an advantage to customers and consumers vi. Most substantial business decisions during the reporting year: • Issued new Sustainability commitments (for Renewable energy, packaging, pack recovery) • For 2 years in a row in our Integrated Annual Report, the carbon information disclosed is based on the Climate Change Reporting Framework (CDSB) • Accounting for Sustainability concept cascading to all operations • We use forward-looking scenarios covered in our Science-based carbon reduction targets set after Paris Agreement
CC2.2b
Please explain why climate change is not integrated into your business strategy
CC2.2c
Does your company use an internal price on carbon? Yes
CC2.2d
Please provide details and examples of how your company uses an internal price on carbon Since 2015 we introduced an internal carbon price and we are among the committed companies from "We mean business" platform prior to COP21 meeting in Paris. The internal carbon price is part of so called "Accounting for Sustainability" programme and it is integrated in our country's business plans. We calculate each investment in energy/carbon reduction by using the internal carbon price and the decision making process is based on the payback with the internal carbon price. With the internal CO2 cost we capture: a.Actual Greenhouse Gas Emissions as per respective regulations and schemes, plus b. Risk of incremental costs incurring due to additional regulation on GHGs, plus c.Risk of reputation damage to brand and share value. At central level, we developed Carbon saving calculation tool, which includes return on investment with and without internal carbon price and this tool is used by each plant for all energy/carbon projects. Our current internal CO2 price is calculated: EU ETS (European Union Emission Trading Scheme) + CRC (Carbon Reduction Commitment) current price. It is updated annually and it is fully integrated with our Finance tool for projects payback calculation (so called Finance Investment Assessment Tool).
CC2.3
Do you engage in activities that could either directly or indirectly influence public policy on climate change through any of the following? (tick all that apply) Direct engagement with policy makers Trade associations Other
CC2.3a
On what issues have you been engaging directly with policy makers?
Focus of legislation
Corporate Position
Details of engagement
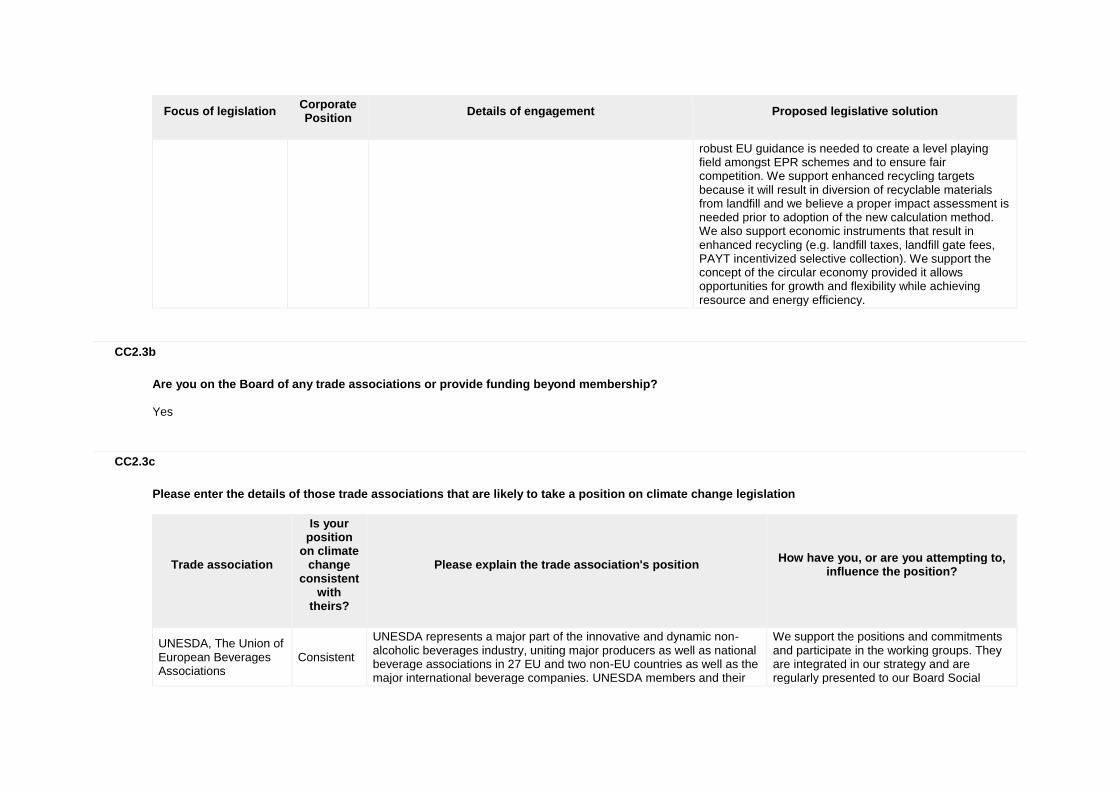
Proposed legislative solution
Other: ERP (Extended Producer Responsibility), landfill taxes and circular economy
Support with minor exceptions
We take part in stakeholder dialogue on EPR and the Circular Economy through trade associations, and we directly participate in roundtable discussions on relevant legal changes at EU level (with DG Environment) and country level (with national Ministries of environment). We chair EPR (Extended Producer Responsibility) policy developments. We work to achieve consensus among relevant stakeholders on relevant policy positions.
We support Extended Producer Responsibility because we believe it is the most sustainable solution for packaging waste management and we welcome the ‘full net cost principle’ because it reflects our call to create a transparent and fair financial base for packaging collection and recycling. We strongly believe that industry’s financial contribution through EPR should be limited to achieving the legally set recycling targets for packaging waste (not to cover entire cost of waste management). We also believe
Focus of legislation
Corporate Position
Details of engagement
Proposed legislative solution
robust EU guidance is needed to create a level playing field amongst EPR schemes and to ensure fair competition. We support enhanced recycling targets because it will result in diversion of recyclable materials from landfill and we believe a proper impact assessment is needed prior to adoption of the new calculation method. We also support economic instruments that result in enhanced recycling (e.g. landfill taxes, landfill gate fees, PAYT incentivized selective collection). We support the concept of the circular economy provided it allows opportunities for growth and flexibility while achieving resource and energy efficiency.
CC2.3b
Are you on the Board of any trade associations or provide funding beyond membership? Yes
CC2.3c
Please enter the details of those trade associations that are likely to take a position on climate change legislation
Trade association
Is your position
on climate change
consistent with
theirs?
Please explain the trade association's position
How have you, or are you attempting to, influence the position?
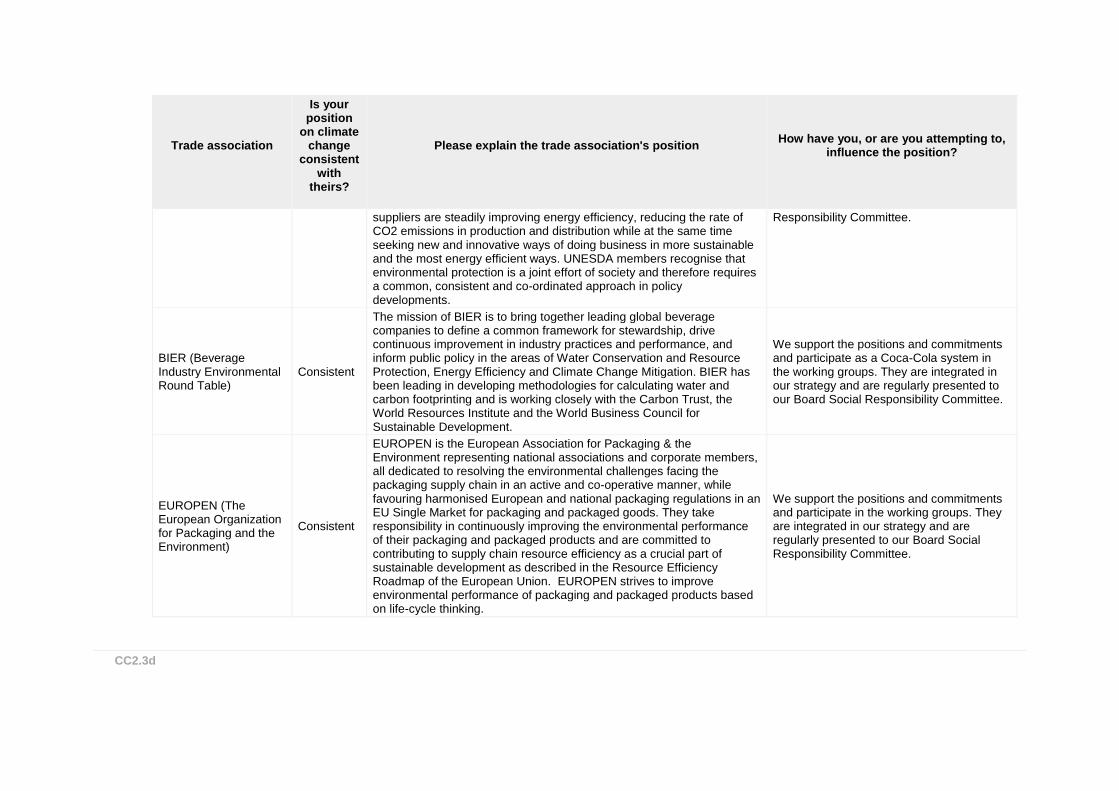
UNESDA, The Union of European Beverages Associations
Consistent
UNESDA represents a major part of the innovative and dynamic non-alcoholic beverages industry, uniting major producers as well as national beverage associations in 27 EU and two non-EU countries as well as the major international beverage companies. UNESDA members and their
We support the positions and commitments and participate in the working groups. They are integrated in our strategy and are regularly presented to our Board Social
Trade association
Is your position
on climate change
consistent with
theirs?
Please explain the trade association's position
How have you, or are you attempting to, influence the position?
suppliers are steadily improving energy efficiency, reducing the rate of CO2 emissions in production and distribution while at the same time seeking new and innovative ways of doing business in more sustainable and the most energy efficient ways. UNESDA members recognise that environmental protection is a joint effort of society and therefore requires a common, consistent and co-ordinated approach in policy developments.
Responsibility Committee.
BIER (Beverage Industry Environmental Round Table)
Consistent
The mission of BIER is to bring together leading global beverage companies to define a common framework for stewardship, drive continuous improvement in industry practices and performance, and inform public policy in the areas of Water Conservation and Resource Protection, Energy Efficiency and Climate Change Mitigation. BIER has been leading in developing methodologies for calculating water and carbon footprinting and is working closely with the Carbon Trust, the World Resources Institute and the World Business Council for Sustainable Development.
We support the positions and commitments and participate as a Coca-Cola system in the working groups. They are integrated in our strategy and are regularly presented to our Board Social Responsibility Committee.
EUROPEN (The European Organization for Packaging and the Environment)
Consistent
EUROPEN is the European Association for Packaging & the Environment representing national associations and corporate members, all dedicated to resolving the environmental challenges facing the packaging supply chain in an active and co-operative manner, while favouring harmonised European and national packaging regulations in an EU Single Market for packaging and packaged goods. They take responsibility in continuously improving the environmental performance of their packaging and packaged products and are committed to contributing to supply chain resource efficiency as a crucial part of sustainable development as described in the Resource Efficiency Roadmap of the European Union. EUROPEN strives to improve environmental performance of packaging and packaged products based on life-cycle thinking.
We support the positions and commitments and participate in the working groups. They are integrated in our strategy and are regularly presented to our Board Social Responsibility Committee.
CC2.3d
Do you publicly disclose a list of all the research organizations that you fund?
CC2.3e
Please provide details of the other engagement activities that you undertake We work closely together with other industries through specific environmental platforms such as the World Business Council for Sustainable Development (WBCSD) and the Water Footprint Network. Since 2005, we have partnered with the International Commission for the Protection of the Danube River (ICPDR), conducting conservation, advocacy, awareness and education in 11 countries. We now have partnerships to conserve and promote the following rivers, water bodies and watersheds: Danube Basin, Danube River, Tisza River, Vistula River, Volga River, Sava River, Vrbas River, Yelnya Bog, Lake Baïkal, in addition to beaches and sea shores in Greece, Montenegro, Ireland and the Baltics. Coca-Cola HBC is a founder signatory of the UN Global Compact's CEO Water Mandate. Our water stewardship strategy and progress can be found in our Integrated Annual Report. Coca-Cola HBC is a founder signatory of the UN Global Compact's Caring for Climate initiative and we provide information on our approach and results in our Integrated Annual Report.
CC2.3f
What processes do you have in place to ensure that all of your direct and indirect activities that influence policy are consistent with your overall climate change strategy? All activities and positions are aligned with the Group Sustainability Council which is at Operational Committee level and they meet quarterly. Group Sustainability Council reports and makes updates every quarter to the Board Social Responsibility Committee. The Social Responsibility Committee ensures that Sustainability and Corporate Responsibility are integrated into all aspects of our business, guiding our decisions and long-term investments and enhancing our corporate reputation in the field. The Social Responsibility Committee is responsible for the development and supervision of procedures and systems to ensure the pursuit of the Group’s social and environmental goals. The formal role of the Social Responsibility Committee is set out in the charter for committees of the Board of Directors in Annex C of the Organisational Regulations. This is available online at www.coca-colahellenic.com/investorrelations/corporategovernance/.
CC2.3g
Please explain why you do not engage with policy makers
Further Information
Page: CC3. Targets and Initiatives
CC3.1
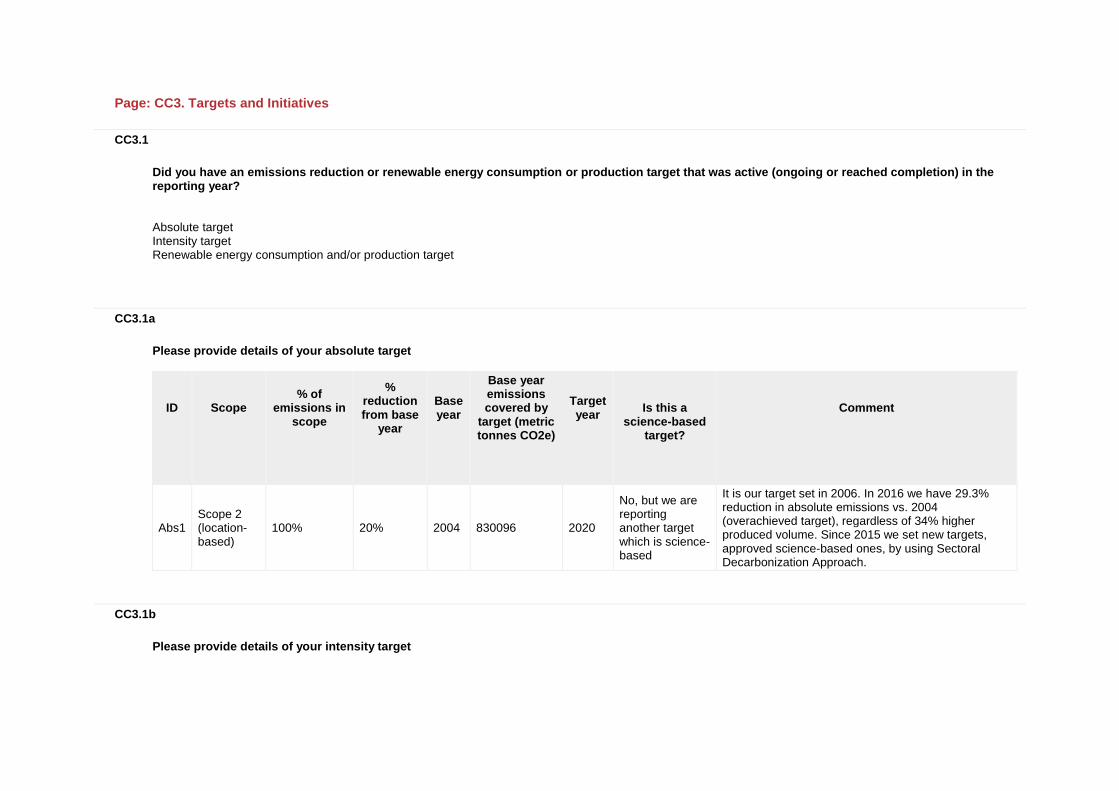
Did you have an emissions reduction or renewable energy consumption or production target that was active (ongoing or reached completion) in the reporting year? Absolute target Intensity target Renewable energy consumption and/or production target
CC3.1a
Please provide details of your absolute target
ID
Scope
% of emissions in
scope
% reduction from base
year
Base year
Base year emissions covered by
target (metric tonnes CO2e)
Target year
Is this a
science-based target?
Comment
Abs1 Scope 2 (location-based)
100% 20% 2004 830096 2020
No, but we are reporting another target which is science-based
It is our target set in 2006. In 2016 we have 29.3% reduction in absolute emissions vs. 2004 (overachieved target), regardless of 34% higher produced volume. Since 2015 we set new targets, approved science-based ones, by using Sectoral Decarbonization Approach.
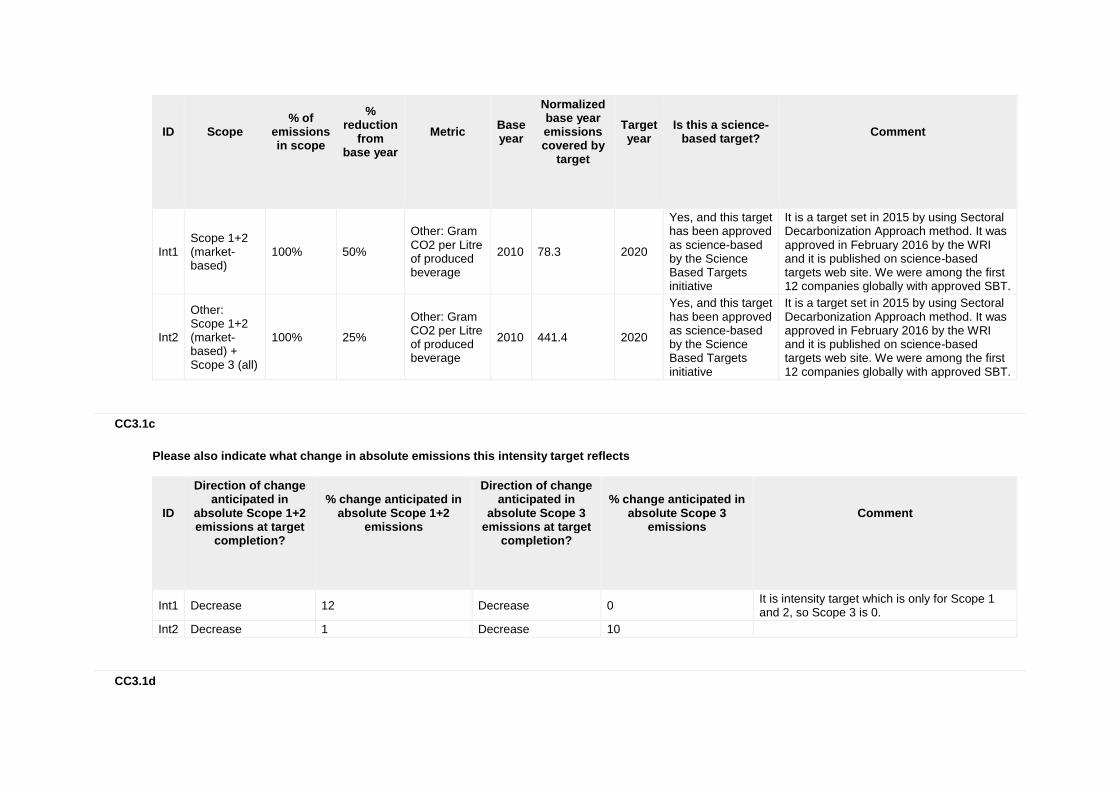
CC3.1b
Please provide details of your intensity target
ID
Scope
% of emissions in scope
% reduction
from base year
Metric
Base year
Normalized base year emissions covered by
target
Target year
Is this a science-based target?
Comment
Int1 Scope 1+2 (market-based)
100% 50%
Other: Gram CO2 per Litre of produced beverage
2010 78.3 2020
Yes, and this target has been approved as science-based by the Science Based Targets initiative
It is a target set in 2015 by using Sectoral Decarbonization Approach method. It was approved in February 2016 by the WRI and it is published on science-based targets web site. We were among the first 12 companies globally with approved SBT.
Int2
Other: Scope 1+2 (market-based) + Scope 3 (all)
100% 25%
Other: Gram CO2 per Litre of produced beverage
2010 441.4 2020
Yes, and this target has been approved as science-based by the Science Based Targets initiative
It is a target set in 2015 by using Sectoral Decarbonization Approach method. It was approved in February 2016 by the WRI and it is published on science-based targets web site. We were among the first 12 companies globally with approved SBT.
CC3.1c
Please also indicate what change in absolute emissions this intensity target reflects
ID
Direction of change anticipated in
absolute Scope 1+2 emissions at target
completion?
% change anticipated in absolute Scope 1+2
emissions
Direction of change anticipated in
absolute Scope 3 emissions at target
completion?
% change anticipated in absolute Scope 3
emissions
Comment
Int1 Decrease 12 Decrease 0 It is intensity target which is only for Scope 1 and 2, so Scope 3 is 0.
Int2 Decrease 1 Decrease 10
CC3.1d
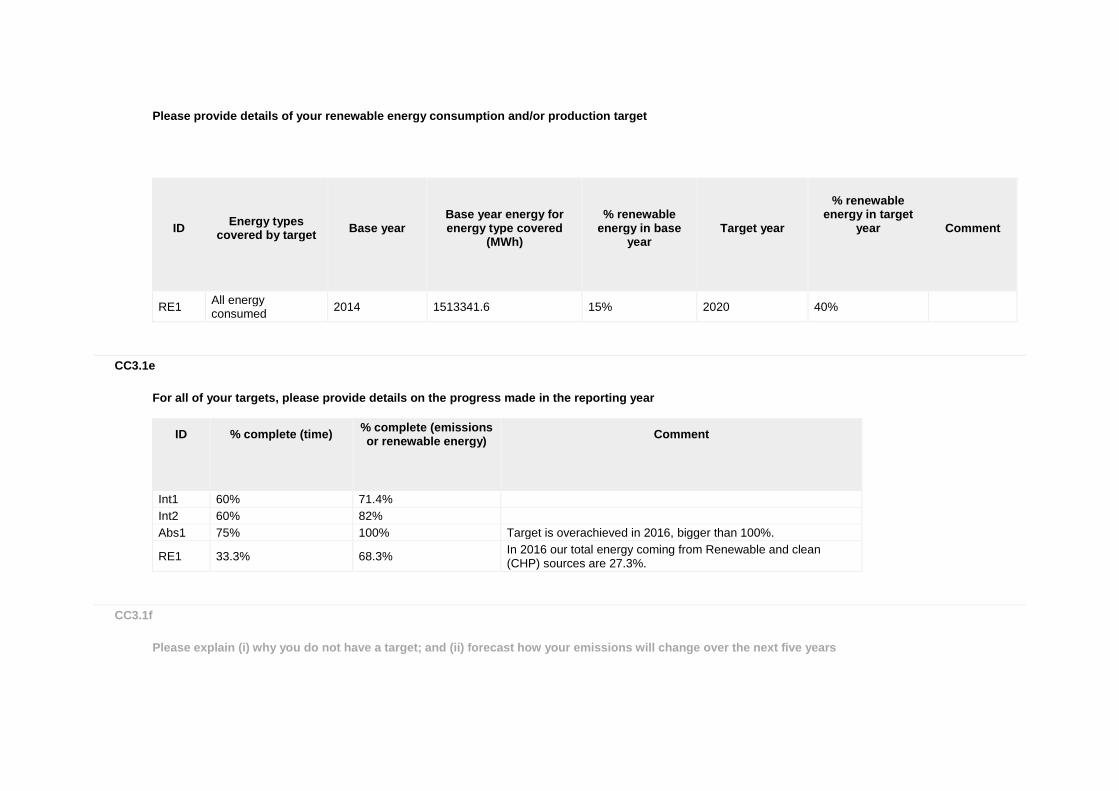
Please provide details of your renewable energy consumption and/or production target
ID
Energy types
covered by target
Base year
Base year energy for energy type covered
(MWh)
% renewable
energy in base year
Target year
% renewable
energy in target year
Comment
RE1 All energy consumed
2014 1513341.6 15% 2020 40%
CC3.1e
For all of your targets, please provide details on the progress made in the reporting year
ID
% complete (time)
% complete (emissions or renewable energy)
Comment
Int1 60% 71.4%
Int2 60% 82%
Abs1 75% 100% Target is overachieved in 2016, bigger than 100%.
RE1 33.3% 68.3% In 2016 our total energy coming from Renewable and clean (CHP) sources are 27.3%.
CC3.1f
Please explain (i) why you do not have a target; and (ii) forecast how your emissions will change over the next five years
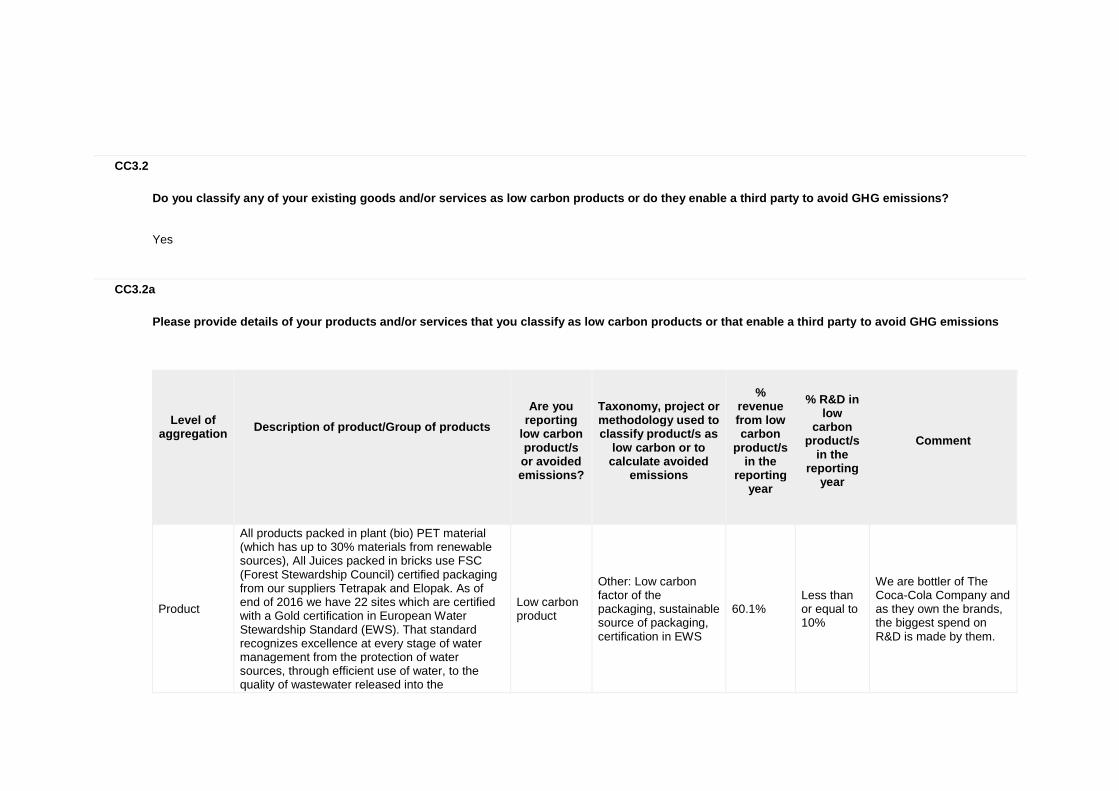
CC3.2
Do you classify any of your existing goods and/or services as low carbon products or do they enable a third party to avoid GHG emissions? Yes
CC3.2a
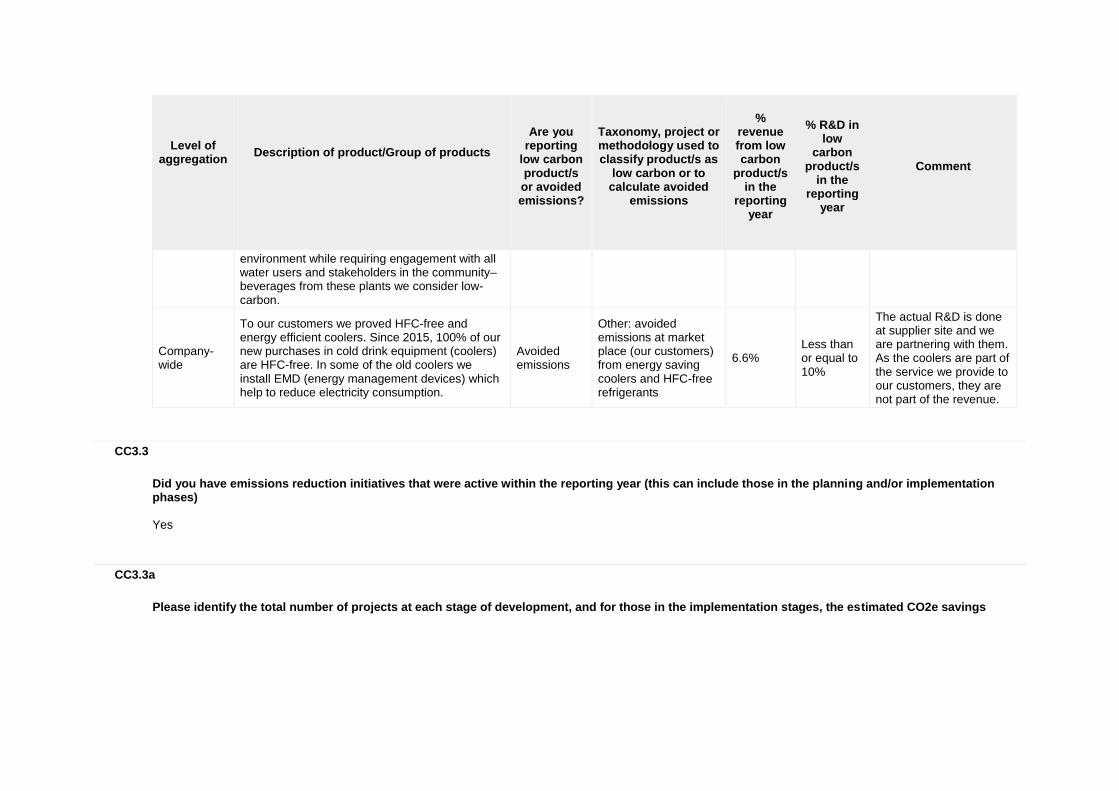
Please provide details of your products and/or services that you classify as low carbon products or that enable a third party to avoid GHG emissions
Level of
aggregation
Description of product/Group of products
Are you
reporting low carbon product/s or avoided emissions?
Taxonomy, project or methodology used to classify product/s as
low carbon or to calculate avoided
emissions
%
revenue from low carbon
product/s in the
reporting year
% R&D in
low carbon
product/s in the
reporting year
Comment
Product
All products packed in plant (bio) PET material (which has up to 30% materials from renewable sources), All Juices packed in bricks use FSC (Forest Stewardship Council) certified packaging from our suppliers Tetrapak and Elopak. As of end of 2016 we have 22 sites which are certified with a Gold certification in European Water Stewardship Standard (EWS). That standard recognizes excellence at every stage of water management from the protection of water sources, through efficient use of water, to the quality of wastewater released into the
Low carbon product
Other: Low carbon factor of the packaging, sustainable source of packaging, certification in EWS
60.1% Less than or equal to 10%
We are bottler of The Coca-Cola Company and as they own the brands, the biggest spend on R&D is made by them.
Level of
aggregation
Description of product/Group of products
Are you
reporting low carbon product/s or avoided emissions?
Taxonomy, project or methodology used to classify product/s as
low carbon or to calculate avoided
emissions
%
revenue from low carbon
product/s in the
reporting year
% R&D in
low carbon
product/s in the
reporting year
Comment
environment while requiring engagement with all water users and stakeholders in the community– beverages from these plants we consider low-carbon.
Company-wide
To our customers we proved HFC-free and energy efficient coolers. Since 2015, 100% of our new purchases in cold drink equipment (coolers) are HFC-free. In some of the old coolers we install EMD (energy management devices) which help to reduce electricity consumption.
Avoided emissions
Other: avoided emissions at market place (our customers) from energy saving coolers and HFC-free refrigerants
6.6% Less than or equal to 10%
The actual R&D is done at supplier site and we are partnering with them. As the coolers are part of the service we provide to our customers, they are not part of the revenue.
CC3.3
Did you have emissions reduction initiatives that were active within the reporting year (this can include those in the planning and/or implementation phases) Yes
CC3.3a
Please identify the total number of projects at each stage of development, and for those in the implementation stages, the estimated CO2e savings
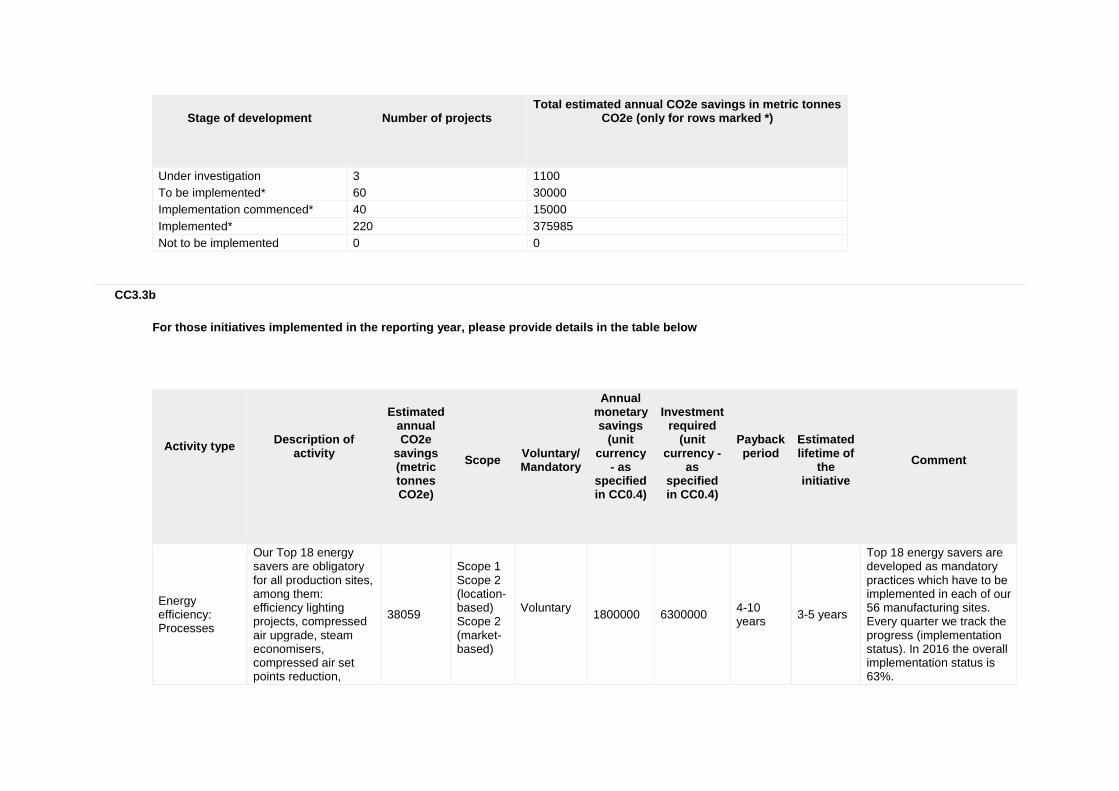
Stage of development
Number of projects
Total estimated annual CO2e savings in metric tonnes CO2e (only for rows marked *)
Under investigation 3 1100
To be implemented* 60 30000
Implementation commenced* 40 15000
Implemented* 220 375985
Not to be implemented 0 0
CC3.3b
For those initiatives implemented in the reporting year, please provide details in the table below
Activity type
Description of activity
Estimated annual CO2e
savings (metric tonnes CO2e)
Scope
Voluntary/ Mandatory
Annual monetary savings
(unit currency
- as specified in CC0.4)
Investment required
(unit currency -
as specified in CC0.4)
Payback period
Estimated lifetime of
the initiative
Comment
Energy efficiency: Processes
Our Top 18 energy savers are obligatory for all production sites, among them: efficiency lighting projects, compressed air upgrade, steam economisers, compressed air set points reduction,
38059
Scope 1 Scope 2 (location-based) Scope 2 (market-based)
Voluntary
1800000 6300000 4-10 years
3-5 years
Top 18 energy savers are developed as mandatory practices which have to be implemented in each of our 56 manufacturing sites. Every quarter we track the progress (implementation status). In 2016 the overall implementation status is 63%.
Activity type
Description of activity
Estimated annual CO2e
savings (metric tonnes CO2e)
Scope
Voluntary/ Mandatory
Annual monetary savings
(unit currency
- as specified in CC0.4)
Investment required
(unit currency -
as specified in CC0.4)
Payback period
Estimated lifetime of
the initiative
Comment
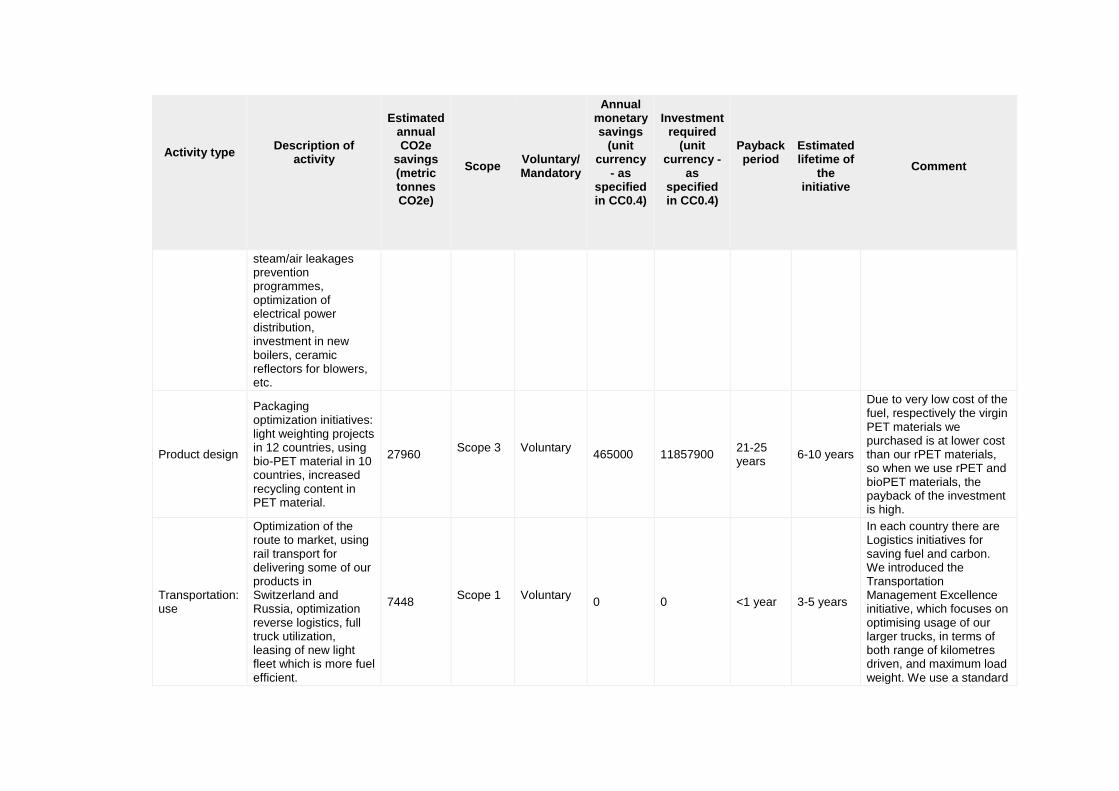
steam/air leakages prevention programmes, optimization of electrical power distribution, investment in new boilers, ceramic reflectors for blowers, etc.
Product design
Packaging optimization initiatives: light weighting projects in 12 countries, using bio-PET material in 10 countries, increased recycling content in PET material.
27960 Scope 3
Voluntary
465000 11857900 21-25 years
6-10 years
Due to very low cost of the fuel, respectively the virgin PET materials we purchased is at lower cost than our rPET materials, so when we use rPET and bioPET materials, the payback of the investment is high.
Transportation: use
Optimization of the route to market, using rail transport for delivering some of our products in Switzerland and Russia, optimization reverse logistics, full truck utilization, leasing of new light fleet which is more fuel efficient.
7448 Scope 1
Voluntary
0 0 <1 year 3-5 years
In each country there are Logistics initiatives for saving fuel and carbon. We introduced the Transportation Management Excellence initiative, which focuses on optimising usage of our larger trucks, in terms of both range of kilometres driven, and maximum load weight. We use a standard
Activity type
Description of activity
Estimated annual CO2e
savings (metric tonnes CO2e)
Scope
Voluntary/ Mandatory
Annual monetary savings
(unit currency
- as specified in CC0.4)
Investment required
(unit currency -
as specified in CC0.4)
Payback period
Estimated lifetime of
the initiative
Comment
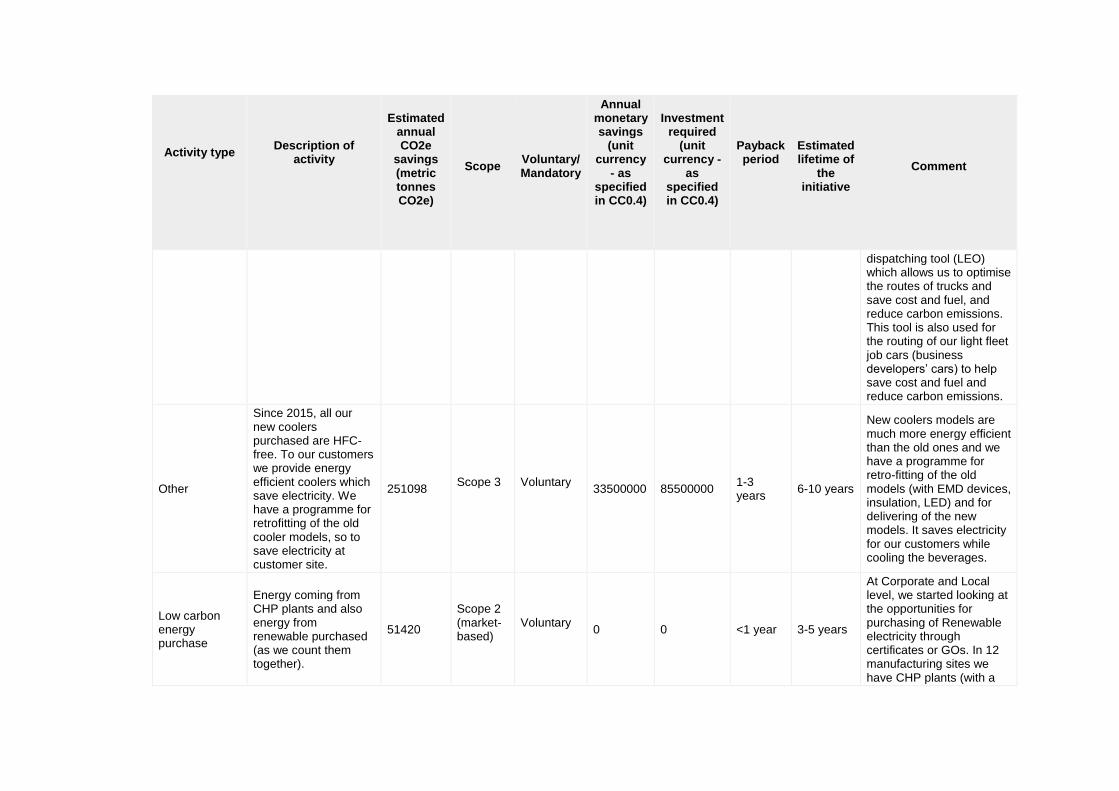
dispatching tool (LEO) which allows us to optimise the routes of trucks and save cost and fuel, and reduce carbon emissions. This tool is also used for the routing of our light fleet job cars (business developersʼ cars) to help save cost and fuel and reduce carbon emissions.
Other
Since 2015, all our new coolers purchased are HFC-free. To our customers we provide energy efficient coolers which save electricity. We have a programme for retrofitting of the old cooler models, so to save electricity at customer site.
251098 Scope 3
Voluntary
33500000 85500000 1-3 years
6-10 years
New coolers models are much more energy efficient than the old ones and we have a programme for retro-fitting of the old models (with EMD devices, insulation, LED) and for delivering of the new models. It saves electricity for our customers while cooling the beverages.
Low carbon energy purchase
Energy coming from CHP plants and also energy from renewable purchased (as we count them together).
51420
Scope 2 (market-based)
Voluntary
0 0 <1 year 3-5 years
At Corporate and Local level, we started looking at the opportunities for purchasing of Renewable electricity through certificates or GOs. In 12 manufacturing sites we have CHP plants (with a
Activity type
Description of activity
Estimated annual CO2e
savings (metric tonnes CO2e)
Scope
Voluntary/ Mandatory
Annual monetary savings
(unit currency
- as specified in CC0.4)
Investment required
(unit currency -
as specified in CC0.4)
Payback period
Estimated lifetime of
the initiative
Comment
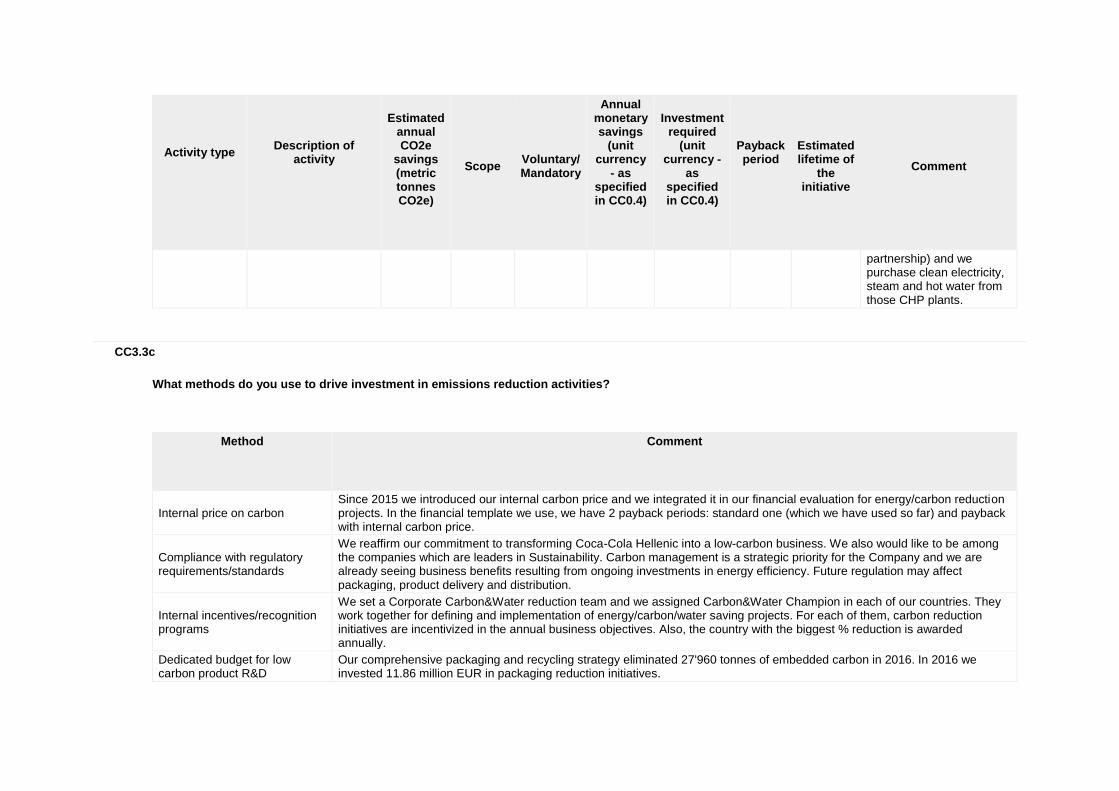
partnership) and we purchase clean electricity, steam and hot water from those CHP plants.
CC3.3c
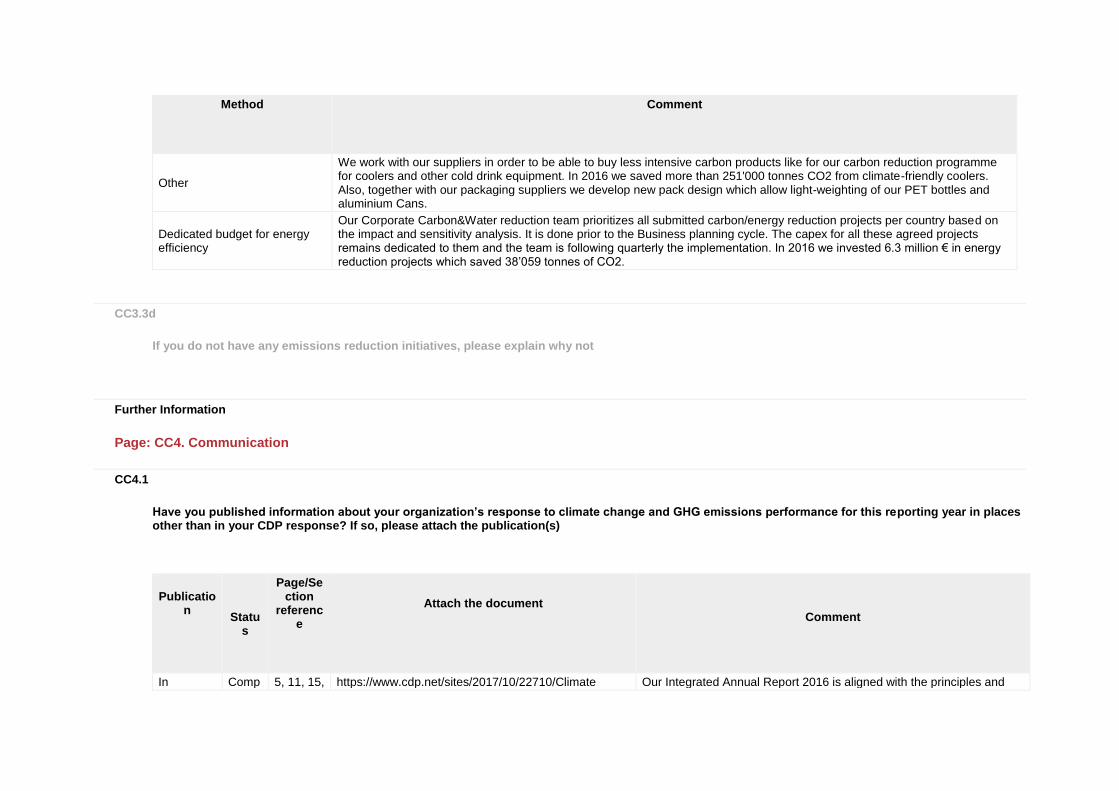
What methods do you use to drive investment in emissions reduction activities?
Method
Comment
Internal price on carbon Since 2015 we introduced our internal carbon price and we integrated it in our financial evaluation for energy/carbon reduction projects. In the financial template we use, we have 2 payback periods: standard one (which we have used so far) and payback with internal carbon price.
Compliance with regulatory requirements/standards
We reaffirm our commitment to transforming Coca-Cola Hellenic into a low-carbon business. We also would like to be among the companies which are leaders in Sustainability. Carbon management is a strategic priority for the Company and we are already seeing business benefits resulting from ongoing investments in energy efficiency. Future regulation may affect packaging, product delivery and distribution.
Internal incentives/recognition programs
We set a Corporate Carbon&Water reduction team and we assigned Carbon&Water Champion in each of our countries. They work together for defining and implementation of energy/carbon/water saving projects. For each of them, carbon reduction initiatives are incentivized in the annual business objectives. Also, the country with the biggest % reduction is awarded annually.
Dedicated budget for low carbon product R&D
Our comprehensive packaging and recycling strategy eliminated 27'960 tonnes of embedded carbon in 2016. In 2016 we invested 11.86 million EUR in packaging reduction initiatives.
Method
Comment
Other
We work with our suppliers in order to be able to buy less intensive carbon products like for our carbon reduction programme for coolers and other cold drink equipment. In 2016 we saved more than 251'000 tonnes CO2 from climate-friendly coolers. Also, together with our packaging suppliers we develop new pack design which allow light-weighting of our PET bottles and aluminium Cans.
Dedicated budget for energy efficiency
Our Corporate Carbon&Water reduction team prioritizes all submitted carbon/energy reduction projects per country based on the impact and sensitivity analysis. It is done prior to the Business planning cycle. The capex for all these agreed projects remains dedicated to them and the team is following quarterly the implementation. In 2016 we invested 6.3 million € in energy reduction projects which saved 38’059 tonnes of CO2.
CC3.3d
If you do not have any emissions reduction initiatives, please explain why not
Further Information
Page: CC4. Communication
CC4.1
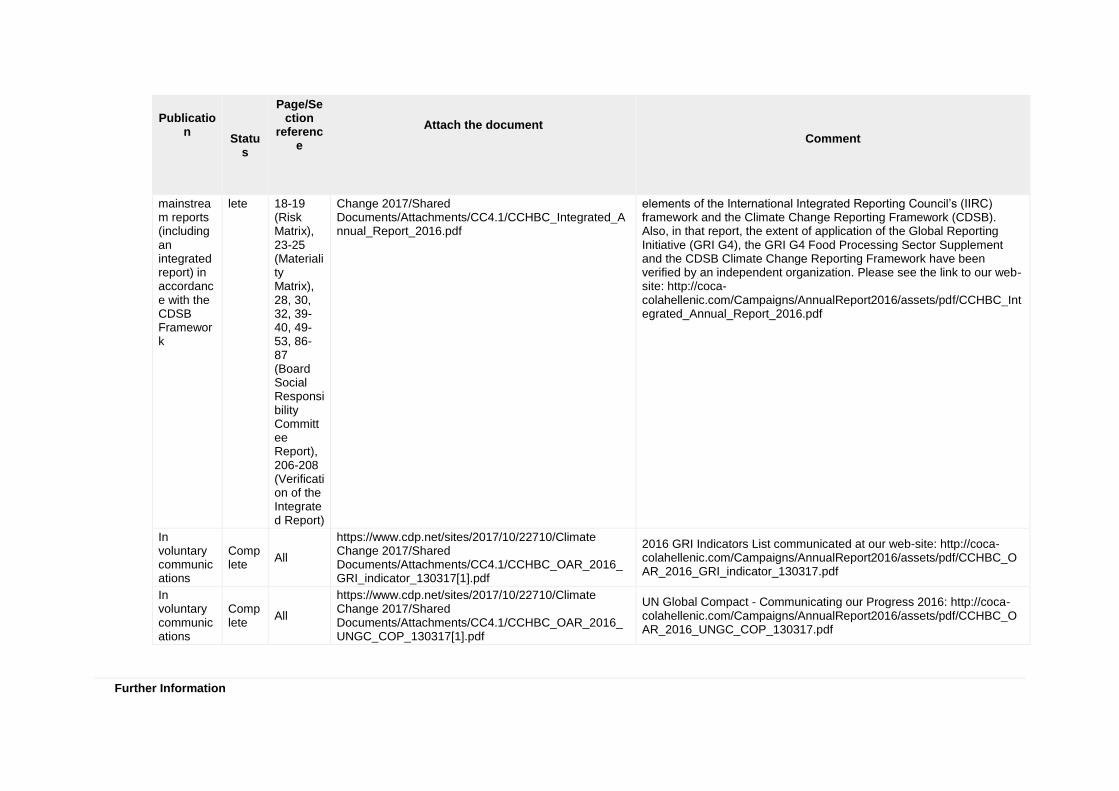
Have you published information about your organization’s response to climate change and GHG emissions performance for this reporting year in places other than in your CDP response? If so, please attach the publication(s)
Publication
Status
Page/Section
reference
Attach the document
Comment
In Comp 5, 11, 15, https://www.cdp.net/sites/2017/10/22710/Climate Our Integrated Annual Report 2016 is aligned with the principles and
Publication
Status
Page/Section
reference
Attach the document
Comment
mainstream reports (including an integrated report) in accordance with the CDSB Framework
lete 18-19 (Risk Matrix), 23-25 (Materiality Matrix), 28, 30, 32, 39-40, 49-53, 86-87 (Board Social Responsibility Committee Report), 206-208 (Verification of the Integrated Report)
Change 2017/Shared Documents/Attachments/CC4.1/CCHBC_Integrated_Annual_Report_2016.pdf
elements of the International Integrated Reporting Council’s (IIRC) framework and the Climate Change Reporting Framework (CDSB). Also, in that report, the extent of application of the Global Reporting Initiative (GRI G4), the GRI G4 Food Processing Sector Supplement and the CDSB Climate Change Reporting Framework have been verified by an independent organization. Please see the link to our web-site: http://coca-colahellenic.com/Campaigns/AnnualReport2016/assets/pdf/CCHBC_Integrated_Annual_Report_2016.pdf
In voluntary communications
Complete
All
https://www.cdp.net/sites/2017/10/22710/Climate Change 2017/Shared Documents/Attachments/CC4.1/CCHBC_OAR_2016_GRI_indicator_130317[1].pdf
2016 GRI Indicators List communicated at our web-site: http://coca-colahellenic.com/Campaigns/AnnualReport2016/assets/pdf/CCHBC_OAR_2016_GRI_indicator_130317.pdf
In voluntary communications
Complete
All
https://www.cdp.net/sites/2017/10/22710/Climate Change 2017/Shared Documents/Attachments/CC4.1/CCHBC_OAR_2016_UNGC_COP_130317[1].pdf
UN Global Compact - Communicating our Progress 2016: http://coca-colahellenic.com/Campaigns/AnnualReport2016/assets/pdf/CCHBC_OAR_2016_UNGC_COP_130317.pdf
Further Information
Module: Risks and Opportunities
Page: CC5. Climate Change Risks
CC5.1
Have you identified any inherent climate change risks that have the potential to generate a substantive change in your business operations, revenue or expenditure? Tick all that apply Risks driven by changes in regulation Risks driven by changes in physical climate parameters Risks driven by changes in other climate-related developments
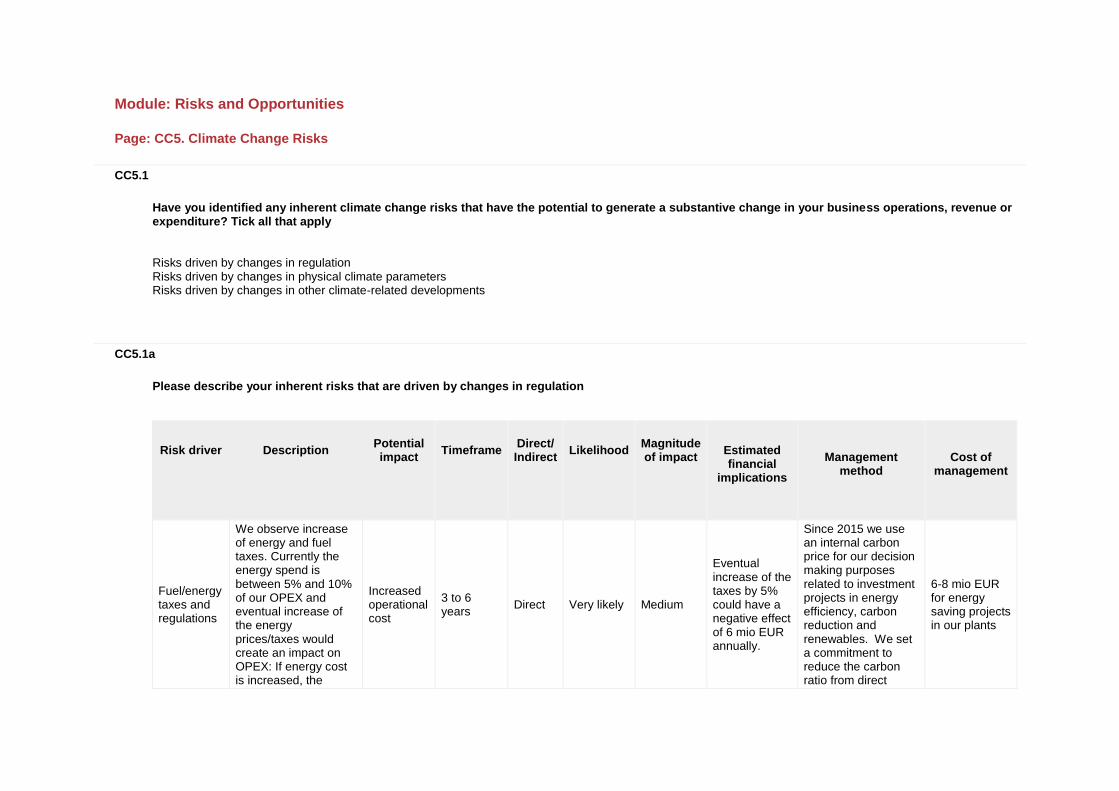
CC5.1a
Please describe your inherent risks that are driven by changes in regulation
Risk driver
Description
Potential impact
Timeframe
Direct/ Indirect
Likelihood
Magnitude of impact
Estimated financial
implications
Management
method
Cost of
management
Fuel/energy taxes and regulations
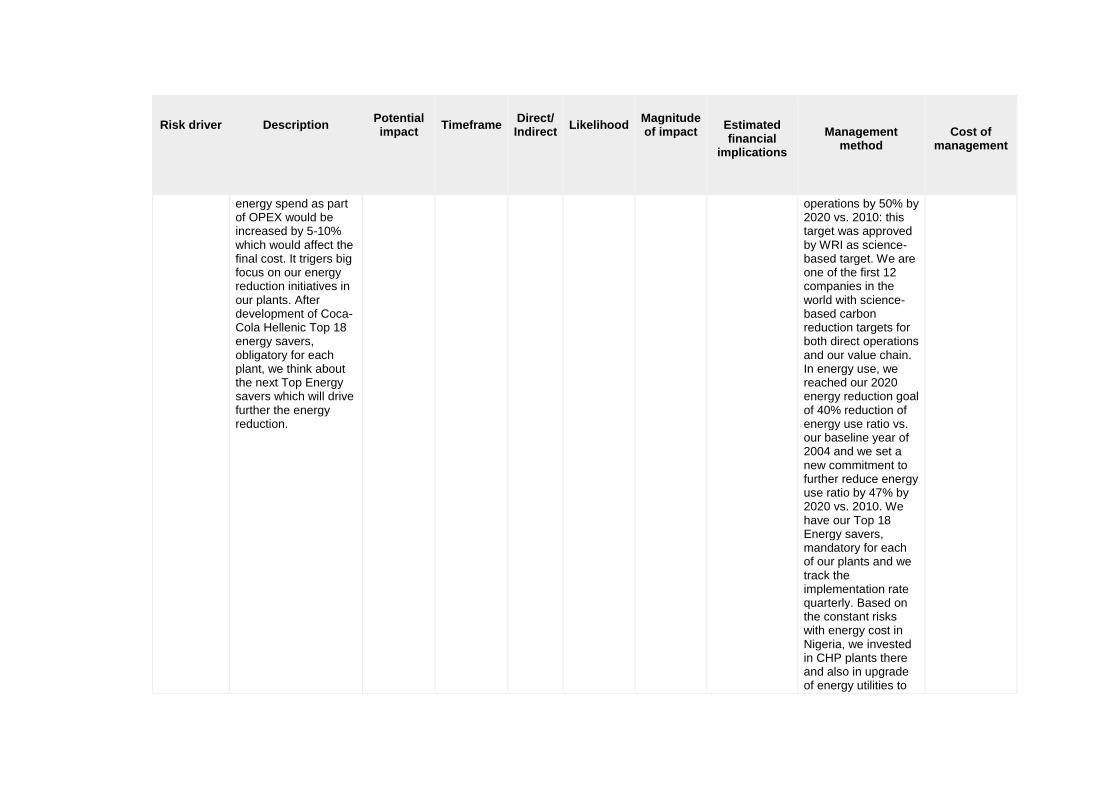
We observe increase of energy and fuel taxes. Currently the energy spend is between 5% and 10% of our OPEX and eventual increase of the energy prices/taxes would create an impact on OPEX: If energy cost is increased, the
Increased operational cost
3 to 6 years
Direct Very likely Medium
Eventual increase of the taxes by 5% could have a negative effect of 6 mio EUR annually.
Since 2015 we use an internal carbon price for our decision making purposes related to investment projects in energy efficiency, carbon reduction and renewables. We set a commitment to reduce the carbon ratio from direct
6-8 mio EUR for energy saving projects in our plants
Risk driver
Description
Potential impact
Timeframe
Direct/ Indirect
Likelihood
Magnitude of impact
Estimated financial
implications
Management
method
Cost of
management
energy spend as part of OPEX would be increased by 5-10% which would affect the final cost. It trigers big focus on our energy reduction initiatives in our plants. After development of Coca-Cola Hellenic Top 18 energy savers, obligatory for each plant, we think about the next Top Energy savers which will drive further the energy reduction.
operations by 50% by 2020 vs. 2010: this target was approved by WRI as science-based target. We are one of the first 12 companies in the world with science-based carbon reduction targets for both direct operations and our value chain. In energy use, we reached our 2020 energy reduction goal of 40% reduction of energy use ratio vs. our baseline year of 2004 and we set a new commitment to further reduce energy use ratio by 47% by 2020 vs. 2010. We have our Top 18 Energy savers, mandatory for each of our plants and we track the implementation rate quarterly. Based on the constant risks with energy cost in Nigeria, we invested in CHP plants there and also in upgrade of energy utilities to
Risk driver
Description
Potential impact
Timeframe
Direct/ Indirect
Likelihood
Magnitude of impact
Estimated financial
implications
Management
method
Cost of
management
tackle energy uncertainties.
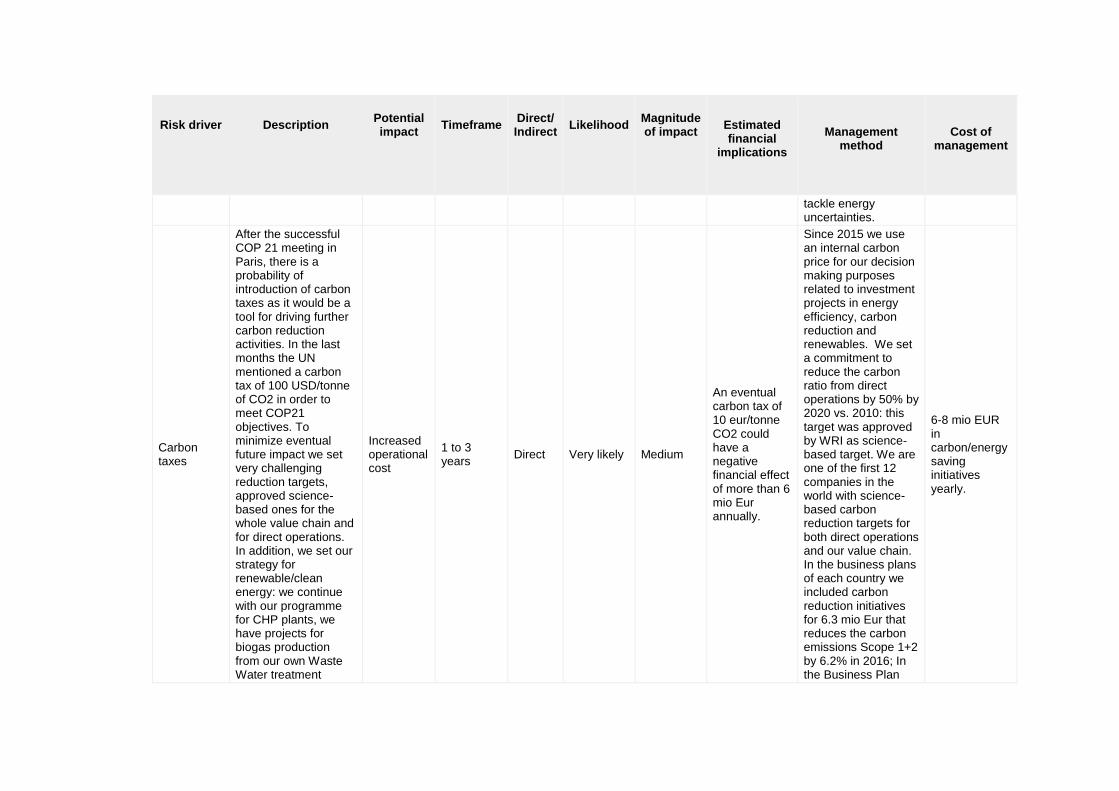
Carbon taxes
After the successful COP 21 meeting in Paris, there is a probability of introduction of carbon taxes as it would be a tool for driving further carbon reduction activities. In the last months the UN mentioned a carbon tax of 100 USD/tonne of CO2 in order to meet COP21 objectives. To minimize eventual future impact we set very challenging reduction targets, approved science-based ones for the whole value chain and for direct operations. In addition, we set our strategy for renewable/clean energy: we continue with our programme for CHP plants, we have projects for biogas production from our own Waste Water treatment
Increased operational cost
1 to 3 years
Direct Very likely Medium
An eventual carbon tax of 10 eur/tonne CO2 could have a negative financial effect of more than 6 mio Eur annually.
Since 2015 we use an internal carbon price for our decision making purposes related to investment projects in energy efficiency, carbon reduction and renewables. We set a commitment to reduce the carbon ratio from direct operations by 50% by 2020 vs. 2010: this target was approved by WRI as science-based target. We are one of the first 12 companies in the world with science-based carbon reduction targets for both direct operations and our value chain. In the business plans of each country we included carbon reduction initiatives for 6.3 mio Eur that reduces the carbon emissions Scope 1+2 by 6.2% in 2016; In the Business Plan
6-8 mio EUR in carbon/energy saving initiatives yearly.
Risk driver
Description
Potential impact
Timeframe
Direct/ Indirect
Likelihood
Magnitude of impact
Estimated financial
implications
Management
method
Cost of
management
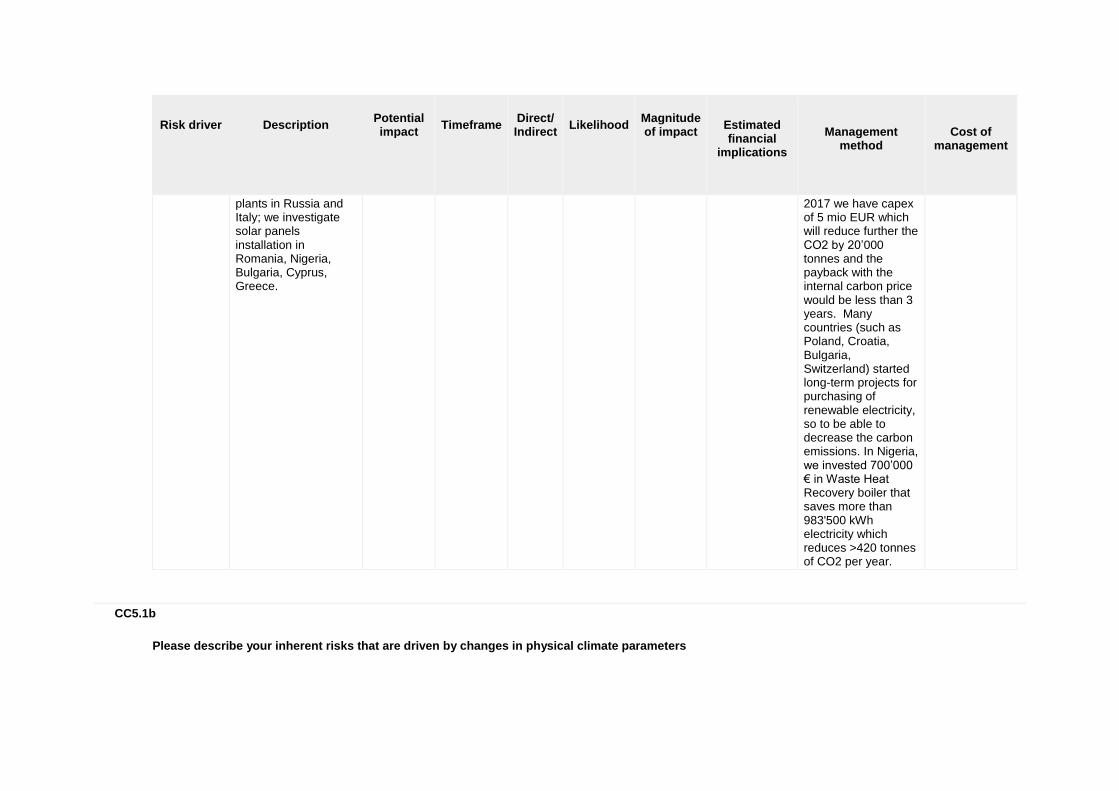
plants in Russia and Italy; we investigate solar panels installation in Romania, Nigeria, Bulgaria, Cyprus, Greece.
2017 we have capex of 5 mio EUR which will reduce further the CO2 by 20’000 tonnes and the payback with the internal carbon price would be less than 3 years. Many countries (such as Poland, Croatia, Bulgaria, Switzerland) started long-term projects for purchasing of renewable electricity, so to be able to decrease the carbon emissions. In Nigeria, we invested 700’000 € in Waste Heat Recovery boiler that saves more than 983'500 kWh electricity which reduces >420 tonnes of CO2 per year.
CC5.1b
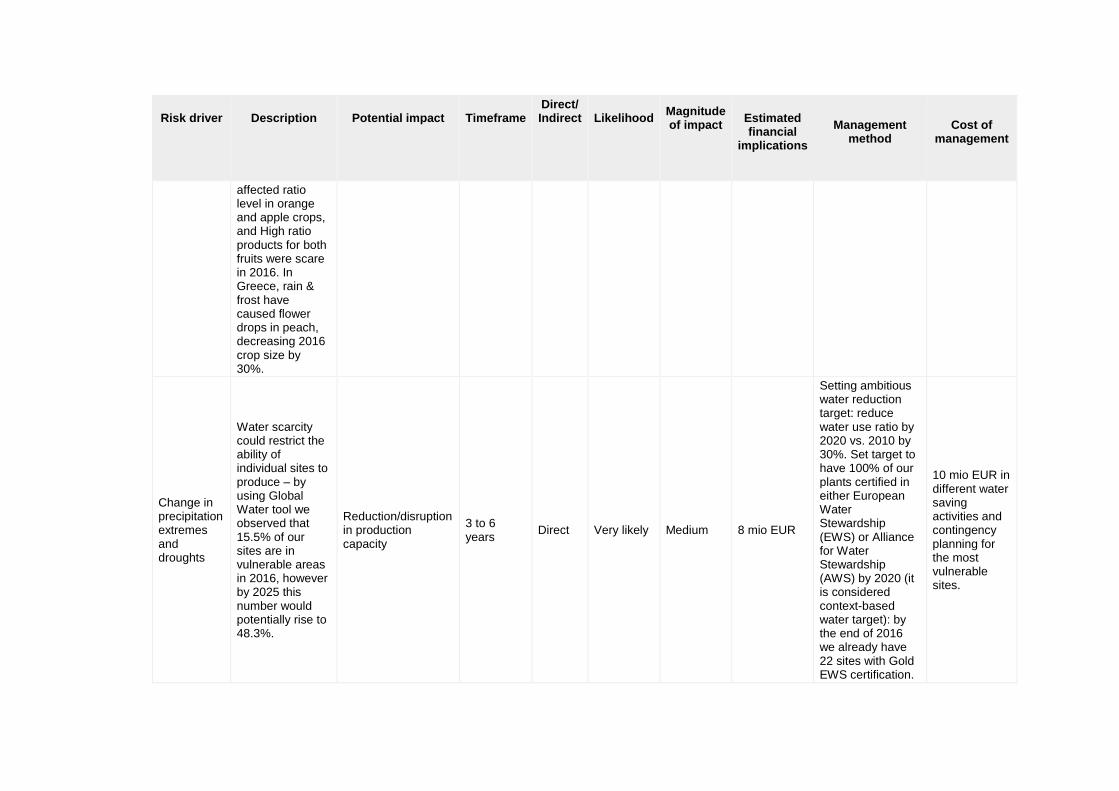
Please describe your inherent risks that are driven by changes in physical climate parameters
Risk driver
Description
Potential impact
Timeframe
Direct/ Indirect
Likelihood
Magnitude of impact
Estimated financial
implications
Management
method
Cost of
management
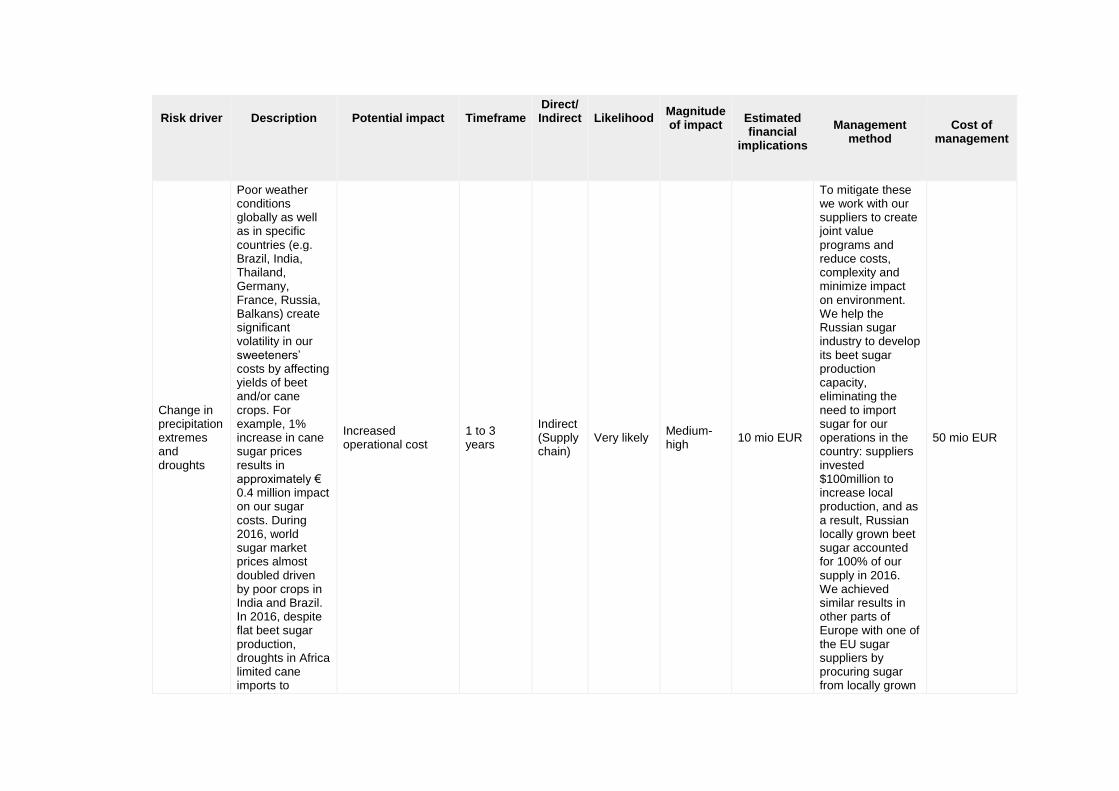
Change in precipitation extremes and droughts
Poor weather conditions globally as well as in specific countries (e.g. Brazil, India, Thailand, Germany, France, Russia, Balkans) create significant volatility in our sweeteners’ costs by affecting yields of beet and/or cane crops. For example, 1% increase in cane sugar prices results in approximately € 0.4 million impact on our sugar costs. During 2016, world sugar market prices almost doubled driven by poor crops in India and Brazil. In 2016, despite flat beet sugar production, droughts in Africa limited cane imports to
Increased operational cost
1 to 3 years
Indirect (Supply chain)
Very likely Medium-high
10 mio EUR
To mitigate these we work with our suppliers to create joint value programs and reduce costs, complexity and minimize impact on environment. We help the Russian sugar industry to develop its beet sugar production capacity, eliminating the need to import sugar for our operations in the country: suppliers invested $100million to increase local production, and as a result, Russian locally grown beet sugar accounted for 100% of our supply in 2016. We achieved similar results in other parts of Europe with one of the EU sugar suppliers by procuring sugar from locally grown
50 mio EUR
Risk driver
Description
Potential impact
Timeframe
Direct/ Indirect
Likelihood
Magnitude of impact
Estimated financial
implications
Management
method
Cost of
management
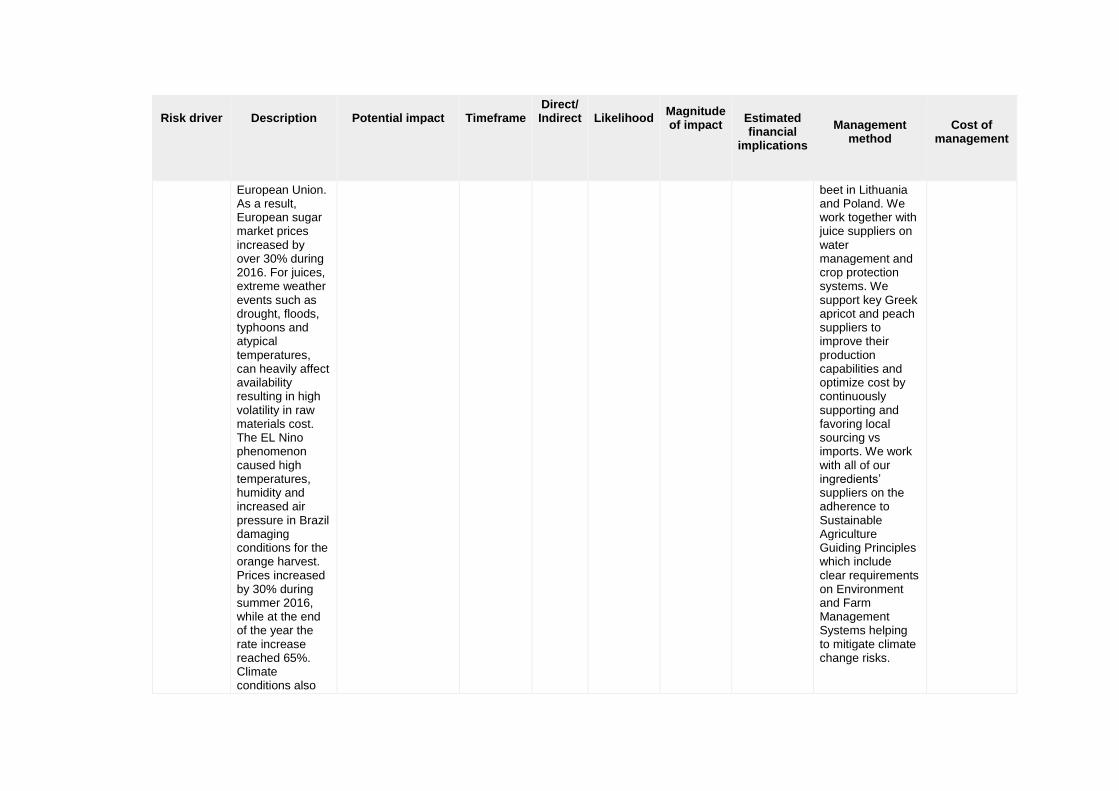
European Union. As a result, European sugar market prices increased by over 30% during 2016. For juices, extreme weather events such as drought, floods, typhoons and atypical temperatures, can heavily affect availability resulting in high volatility in raw materials cost. The EL Nino phenomenon caused high temperatures, humidity and increased air pressure in Brazil damaging conditions for the orange harvest. Prices increased by 30% during summer 2016, while at the end of the year the rate increase reached 65%. Climate conditions also
beet in Lithuania and Poland. We work together with juice suppliers on water management and crop protection systems. We support key Greek apricot and peach suppliers to improve their production capabilities and optimize cost by continuously supporting and favoring local sourcing vs imports. We work with all of our ingredients’ suppliers on the adherence to Sustainable Agriculture Guiding Principles which include clear requirements on Environment and Farm Management Systems helping to mitigate climate change risks.
Risk driver
Description
Potential impact
Timeframe
Direct/ Indirect
Likelihood
Magnitude of impact
Estimated financial
implications
Management
method
Cost of
management
affected ratio level in orange and apple crops, and High ratio products for both fruits were scare in 2016. In Greece, rain & frost have caused flower drops in peach, decreasing 2016 crop size by 30%.
Change in precipitation extremes and droughts
Water scarcity could restrict the ability of individual sites to produce – by using Global Water tool we observed that 15.5% of our sites are in vulnerable areas in 2016, however by 2025 this number would potentially rise to 48.3%.
Reduction/disruption in production capacity
3 to 6 years
Direct Very likely Medium 8 mio EUR
Setting ambitious water reduction target: reduce water use ratio by 2020 vs. 2010 by 30%. Set target to have 100% of our plants certified in either European Water Stewardship (EWS) or Alliance for Water Stewardship (AWS) by 2020 (it is considered context-based water target): by the end of 2016 we already have 22 sites with Gold EWS certification.
10 mio EUR in different water saving activities and contingency planning for the most vulnerable sites.
Risk driver
Description
Potential impact
Timeframe
Direct/ Indirect
Likelihood
Magnitude of impact
Estimated financial
implications
Management
method
Cost of
management
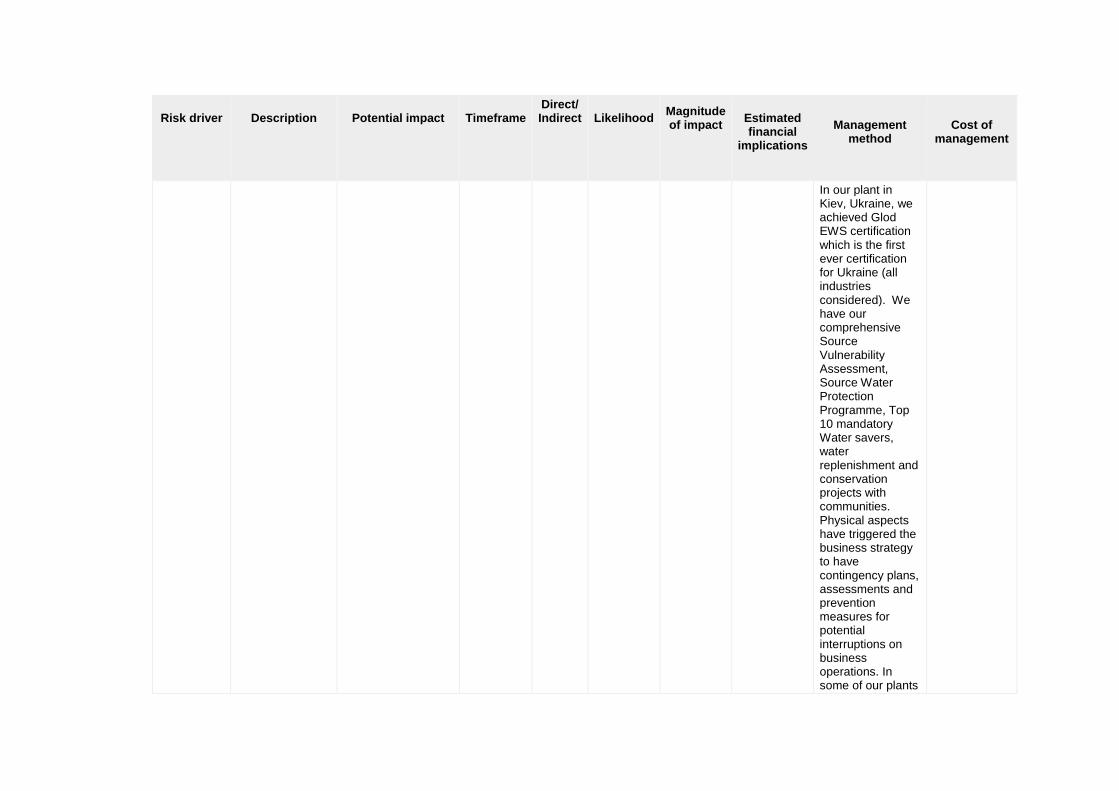
In our plant in Kiev, Ukraine, we achieved Glod EWS certification which is the first ever certification for Ukraine (all industries considered). We have our comprehensive Source Vulnerability Assessment, Source Water Protection Programme, Top 10 mandatory Water savers, water replenishment and conservation projects with communities. Physical aspects have triggered the business strategy to have contingency plans, assessments and prevention measures for potential interruptions on business operations. In some of our plants
Risk driver
Description
Potential impact
Timeframe
Direct/ Indirect
Likelihood
Magnitude of impact
Estimated financial
implications
Management
method
Cost of
management
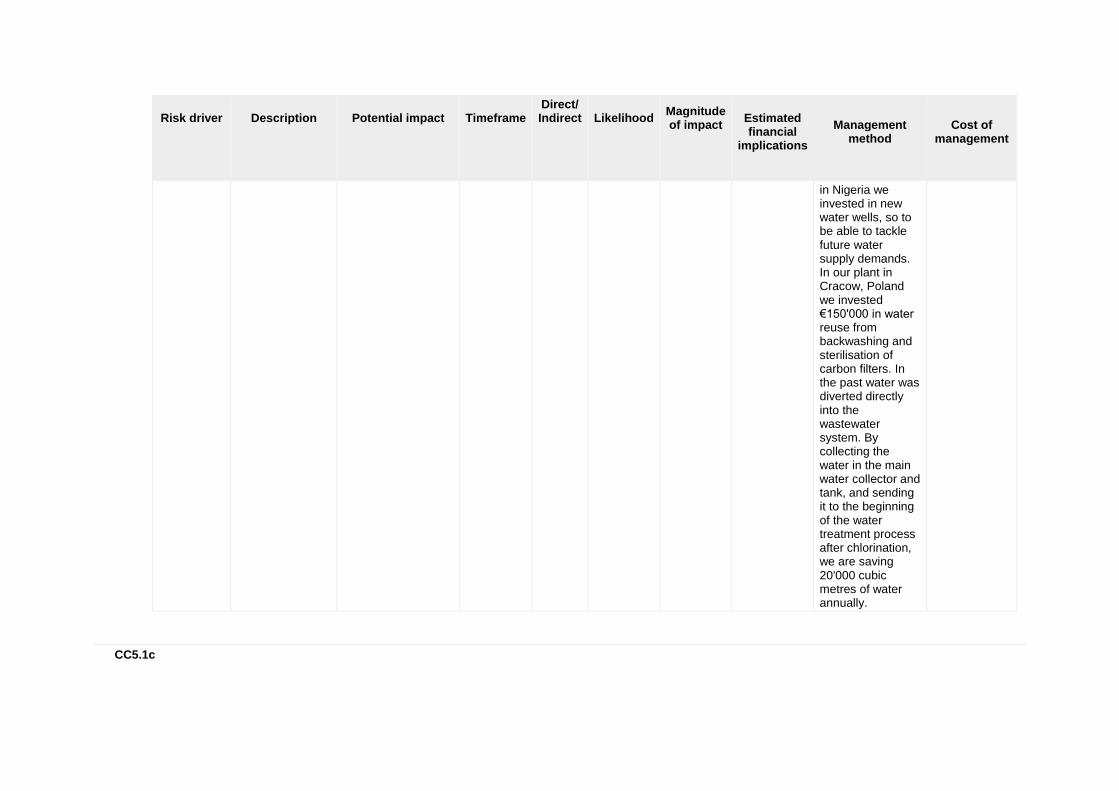
in Nigeria we invested in new water wells, so to be able to tackle future water supply demands. In our plant in Cracow, Poland we invested €150'000 in water reuse from backwashing and sterilisation of carbon filters. In the past water was diverted directly into the wastewater system. By collecting the water in the main water collector and tank, and sending it to the beginning of the water treatment process after chlorination, we are saving 20'000 cubic metres of water annually.
CC5.1c
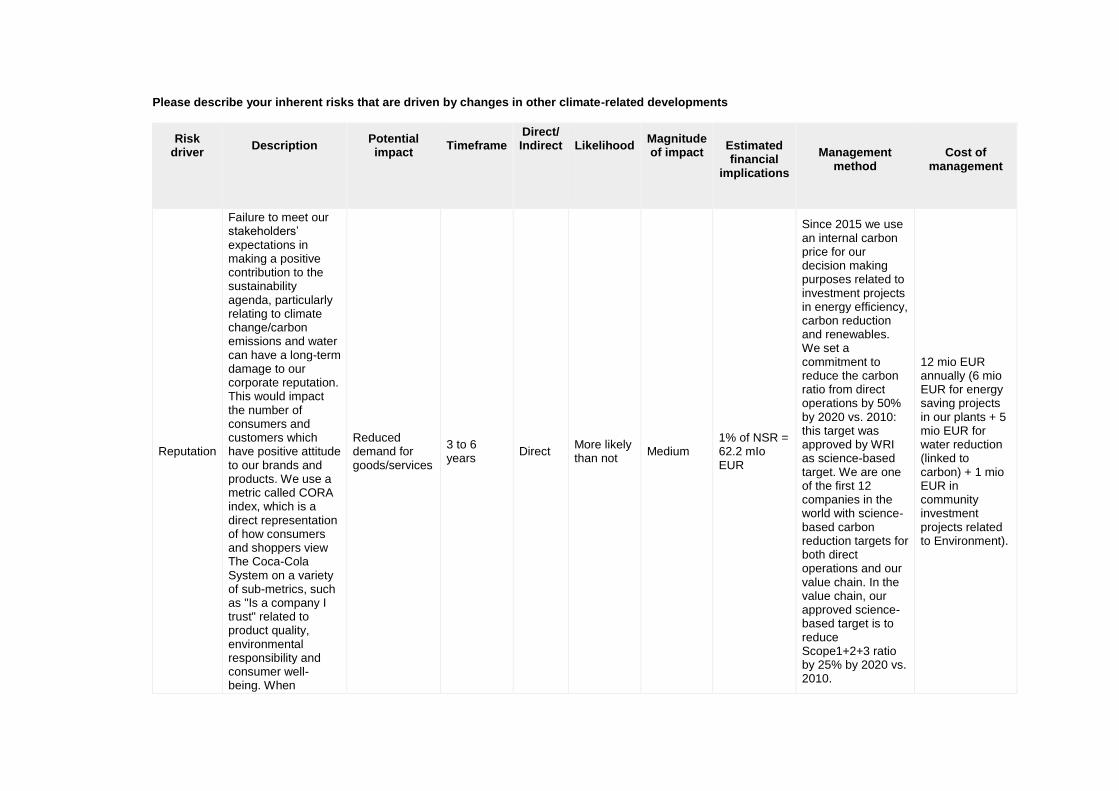
Please describe your inherent risks that are driven by changes in other climate-related developments
Risk driver
Description
Potential impact
Timeframe
Direct/ Indirect
Likelihood
Magnitude of impact
Estimated financial
implications
Management
method
Cost of
management
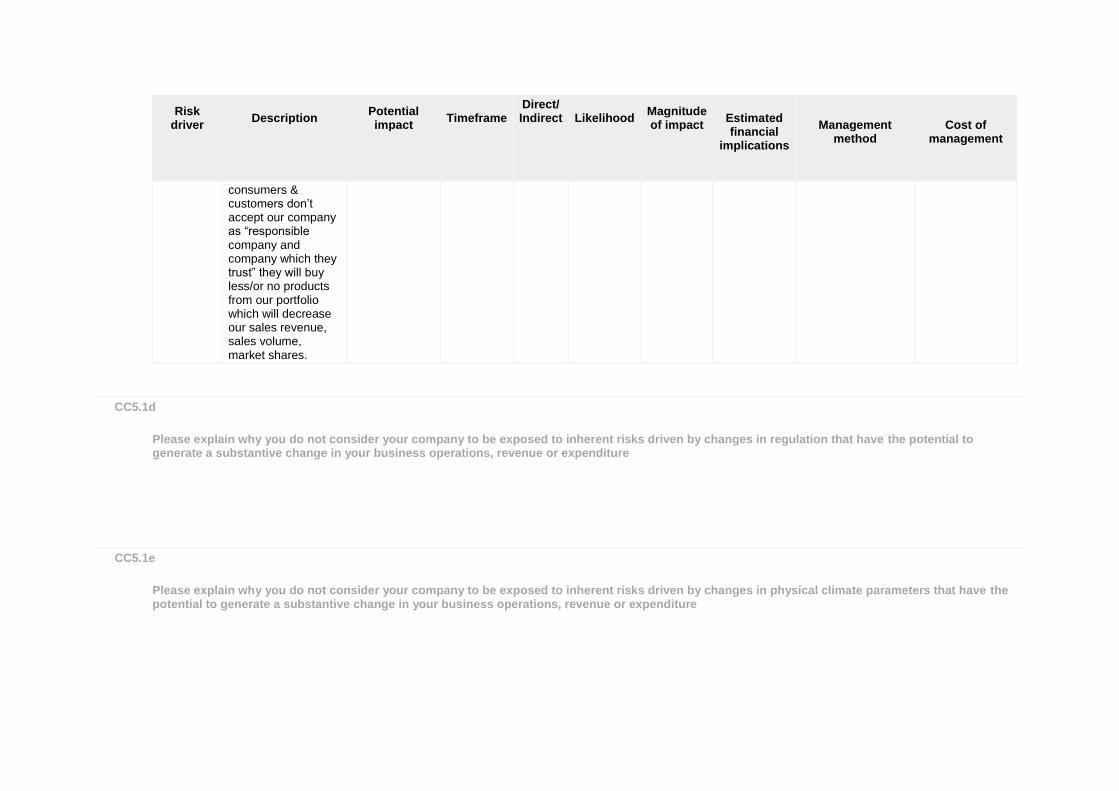
Reputation
Failure to meet our stakeholders’ expectations in making a positive contribution to the sustainability agenda, particularly relating to climate change/carbon emissions and water can have a long-term damage to our corporate reputation. This would impact the number of consumers and customers which have positive attitude to our brands and products. We use a metric called CORA index, which is a direct representation of how consumers and shoppers view The Coca-Cola System on a variety of sub-metrics, such as "Is a company I trust" related to product quality, environmental responsibility and consumer well-being. When
Reduced demand for goods/services
3 to 6 years
Direct More likely than not
Medium 1% of NSR = 62.2 mIo EUR
Since 2015 we use an internal carbon price for our decision making purposes related to investment projects in energy efficiency, carbon reduction and renewables. We set a commitment to reduce the carbon ratio from direct operations by 50% by 2020 vs. 2010: this target was approved by WRI as science-based target. We are one of the first 12 companies in the world with science-based carbon reduction targets for both direct operations and our value chain. In the value chain, our approved science-based target is to reduce Scope1+2+3 ratio by 25% by 2020 vs. 2010.
12 mio EUR annually (6 mio EUR for energy saving projects in our plants + 5 mio EUR for water reduction (linked to carbon) + 1 mio EUR in community investment projects related to Environment).
Risk driver
Description
Potential impact
Timeframe
Direct/ Indirect
Likelihood
Magnitude of impact
Estimated financial
implications
Management
method
Cost of
management
consumers & customers don’t accept our company as “responsible company and company which they trust” they will buy less/or no products from our portfolio which will decrease our sales revenue, sales volume, market shares.
CC5.1d
Please explain why you do not consider your company to be exposed to inherent risks driven by changes in regulation that have the potential to generate a substantive change in your business operations, revenue or expenditure
CC5.1e
Please explain why you do not consider your company to be exposed to inherent risks driven by changes in physical climate parameters that have the potential to generate a substantive change in your business operations, revenue or expenditure
CC5.1f
Please explain why you do not consider your company to be exposed to inherent risks driven by changes in other climate-related developments that have the potential to generate a substantive change in your business operations, revenue or expenditure
Further Information
Page: CC6. Climate Change Opportunities
CC6.1
Have you identified any inherent climate change opportunities that have the potential to generate a substantive change in your business operations, revenue or expenditure? Tick all that apply Opportunities driven by changes in regulation Opportunities driven by changes in physical climate parameters Opportunities driven by changes in other climate-related developments
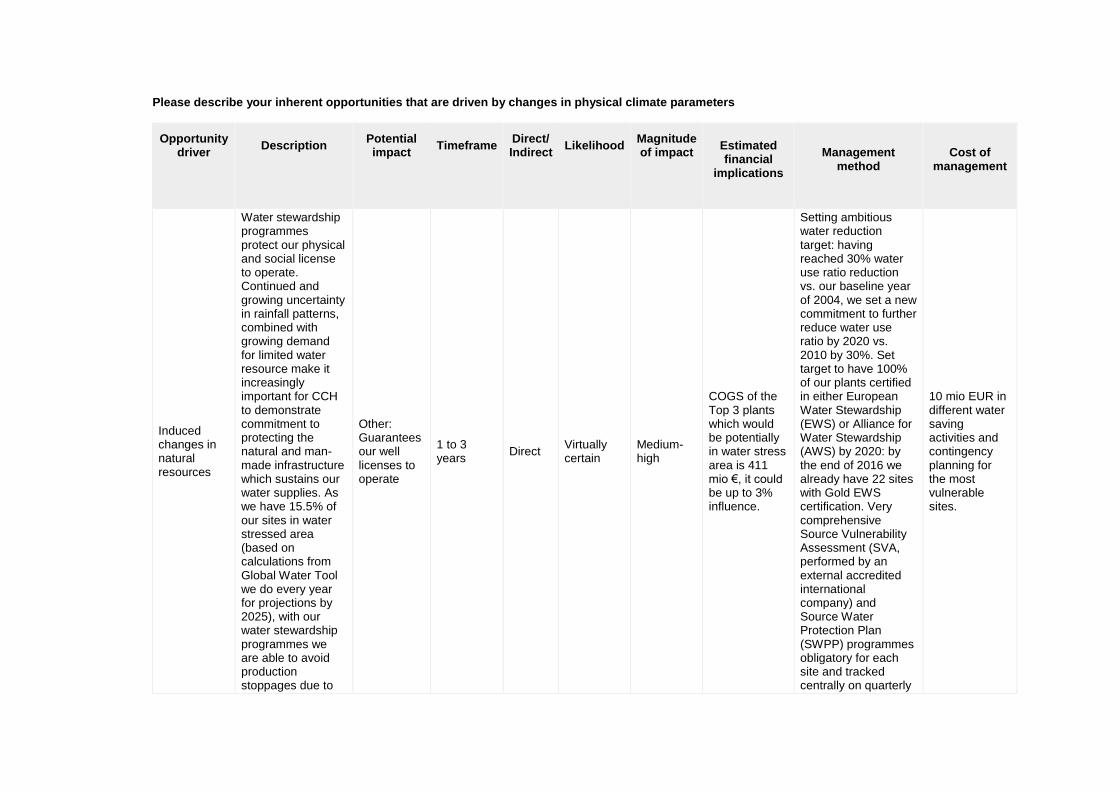
CC6.1a
Please describe your inherent opportunities that are driven by changes in regulation
Opportunity driver
Description
Potential impact
Timeframe
Direct/Indirect
Likelihood
Magnitude of impact
Estimated financial
implications
Management
method
Cost of
management
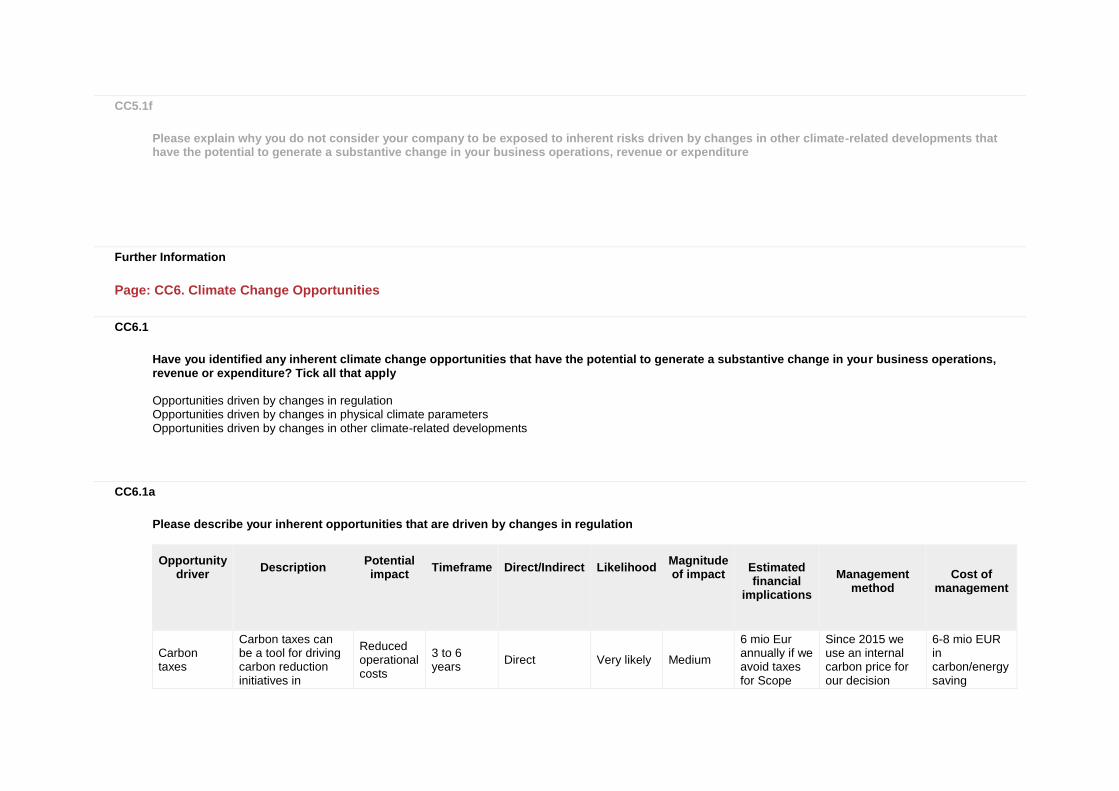
Carbon taxes
Carbon taxes can be a tool for driving carbon reduction initiatives in
Reduced operational costs
3 to 6 years
Direct Very likely Medium
6 mio Eur annually if we avoid taxes for Scope
Since 2015 we use an internal carbon price for our decision
6-8 mio EUR in carbon/energy saving
Opportunity driver
Description
Potential impact
Timeframe
Direct/Indirect
Likelihood
Magnitude of impact
Estimated financial
implications
Management
method
Cost of
management
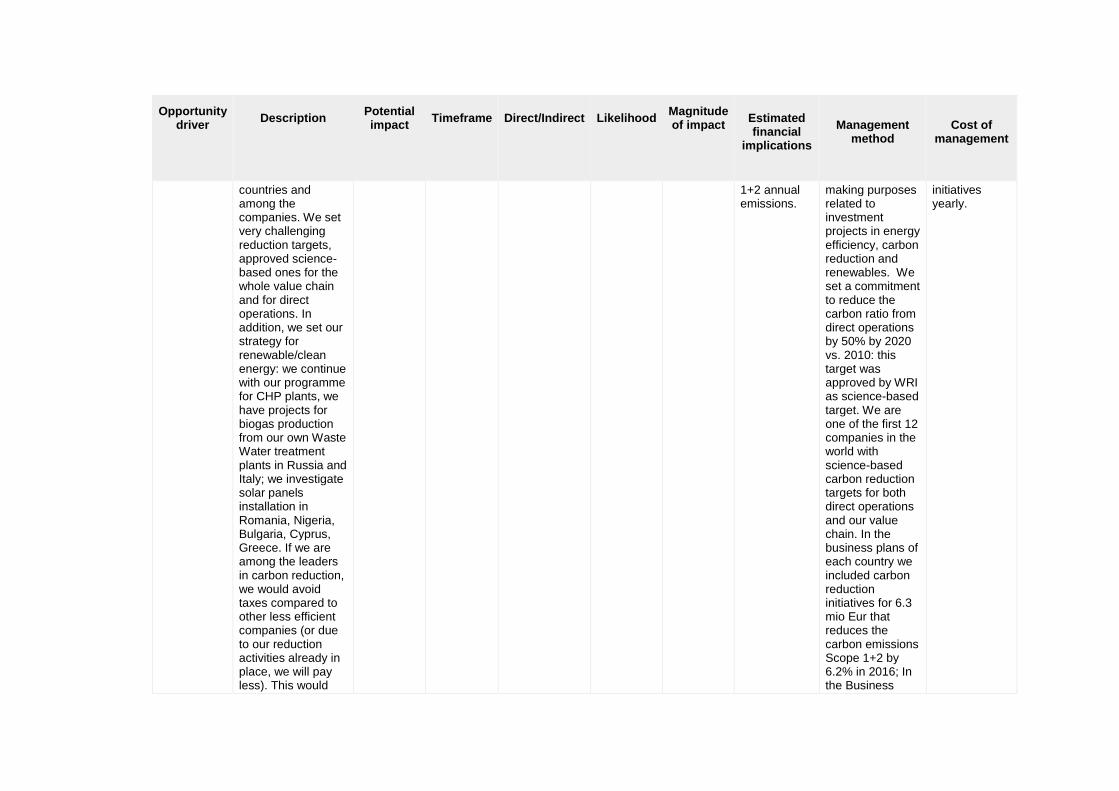
countries and among the companies. We set very challenging reduction targets, approved science-based ones for the whole value chain and for direct operations. In addition, we set our strategy for renewable/clean energy: we continue with our programme for CHP plants, we have projects for biogas production from our own Waste Water treatment plants in Russia and Italy; we investigate solar panels installation in Romania, Nigeria, Bulgaria, Cyprus, Greece. If we are among the leaders in carbon reduction, we would avoid taxes compared to other less efficient companies (or due to our reduction activities already in place, we will pay less). This would
1+2 annual emissions.
making purposes related to investment projects in energy efficiency, carbon reduction and renewables. We set a commitment to reduce the carbon ratio from direct operations by 50% by 2020 vs. 2010: this target was approved by WRI as science-based target. We are one of the first 12 companies in the world with science-based carbon reduction targets for both direct operations and our value chain. In the business plans of each country we included carbon reduction initiatives for 6.3 mio Eur that reduces the carbon emissions Scope 1+2 by 6.2% in 2016; In the Business
initiatives yearly.
Opportunity driver
Description
Potential impact
Timeframe
Direct/Indirect
Likelihood
Magnitude of impact
Estimated financial
implications
Management
method
Cost of
management
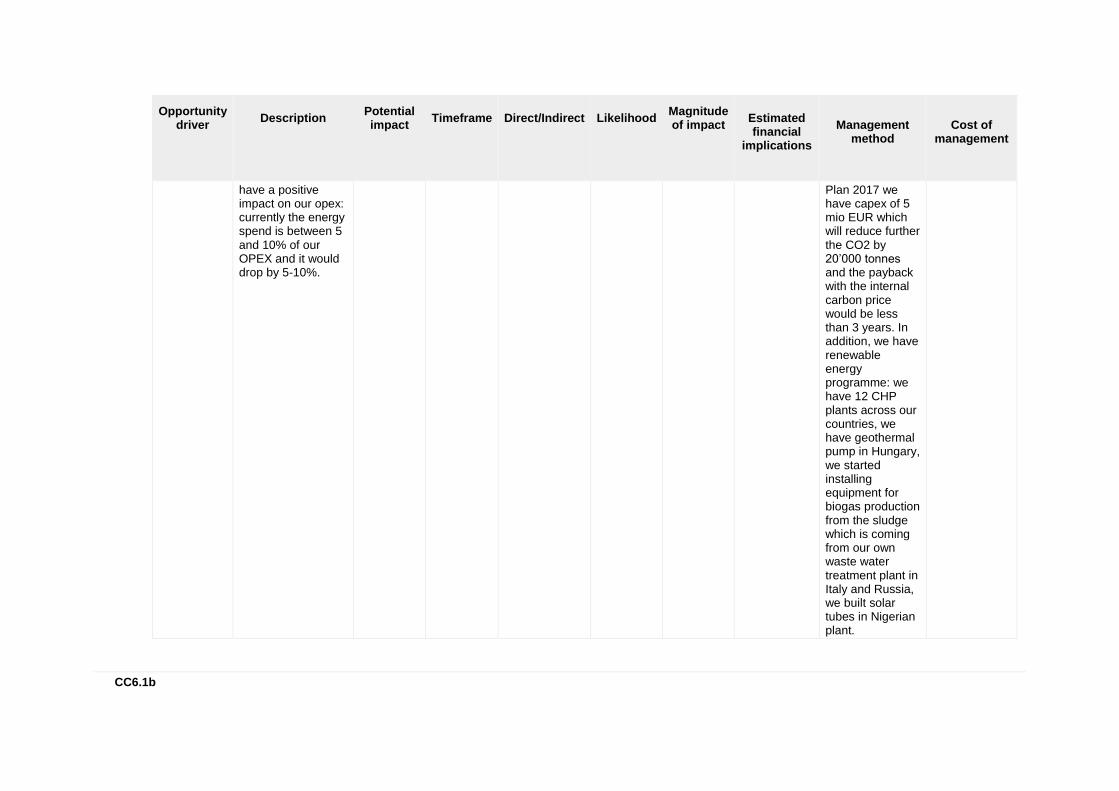
have a positive impact on our opex: currently the energy spend is between 5 and 10% of our OPEX and it would drop by 5-10%.
Plan 2017 we have capex of 5 mio EUR which will reduce further the CO2 by 20’000 tonnes and the payback with the internal carbon price would be less than 3 years. In addition, we have renewable energy programme: we have 12 CHP plants across our countries, we have geothermal pump in Hungary, we started installing equipment for biogas production from the sludge which is coming from our own waste water treatment plant in Italy and Russia, we built solar tubes in Nigerian plant.
CC6.1b
Please describe your inherent opportunities that are driven by changes in physical climate parameters
Opportunity driver
Description
Potential impact
Timeframe
Direct/ Indirect
Likelihood
Magnitude of impact
Estimated financial
implications
Management
method
Cost of
management
Induced changes in natural resources
Water stewardship programmes protect our physical and social license to operate. Continued and growing uncertainty in rainfall patterns, combined with growing demand for limited water resource make it increasingly important for CCH to demonstrate commitment to protecting the natural and man-made infrastructure which sustains our water supplies. As we have 15.5% of our sites in water stressed area (based on calculations from Global Water Tool we do every year for projections by 2025), with our water stewardship programmes we are able to avoid production stoppages due to
Other: Guarantees our well licenses to operate
1 to 3 years
Direct Virtually certain
Medium-high
COGS of the Top 3 plants which would be potentially in water stress area is 411 mio €, it could be up to 3% influence.
Setting ambitious water reduction target: having reached 30% water use ratio reduction vs. our baseline year of 2004, we set a new commitment to further reduce water use ratio by 2020 vs. 2010 by 30%. Set target to have 100% of our plants certified in either European Water Stewardship (EWS) or Alliance for Water Stewardship (AWS) by 2020: by the end of 2016 we already have 22 sites with Gold EWS certification. Very comprehensive Source Vulnerability Assessment (SVA, performed by an external accredited international company) and Source Water Protection Plan (SWPP) programmes obligatory for each site and tracked centrally on quarterly
10 mio EUR in different water saving activities and contingency planning for the most vulnerable sites.
Opportunity driver
Description
Potential impact
Timeframe
Direct/ Indirect
Likelihood
Magnitude of impact
Estimated financial
implications
Management
method
Cost of
management
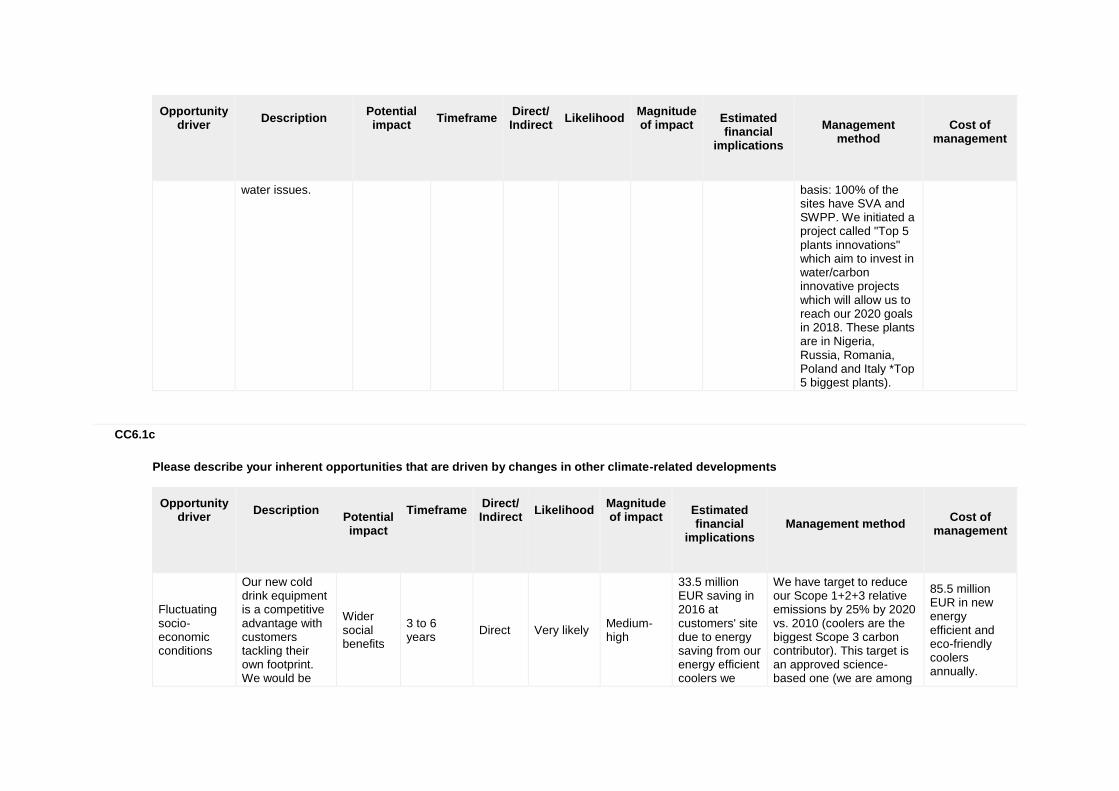
water issues. basis: 100% of the sites have SVA and SWPP. We initiated a project called "Top 5 plants innovations" which aim to invest in water/carbon innovative projects which will allow us to reach our 2020 goals in 2018. These plants are in Nigeria, Russia, Romania, Poland and Italy *Top 5 biggest plants).
CC6.1c
Please describe your inherent opportunities that are driven by changes in other climate-related developments
Opportunity driver
Description
Potential impact
Timeframe
Direct/ Indirect
Likelihood
Magnitude of impact
Estimated financial
implications
Management method
Cost of
management
Fluctuating socio-economic conditions
Our new cold drink equipment is a competitive advantage with customers tackling their own footprint. We would be
Wider social benefits
3 to 6 years
Direct Very likely Medium-high
33.5 million EUR saving in 2016 at customers' site due to energy saving from our energy efficient coolers we
We have target to reduce our Scope 1+2+3 relative emissions by 25% by 2020 vs. 2010 (coolers are the biggest Scope 3 carbon contributor). This target is an approved science-based one (we are among
85.5 million EUR in new energy efficient and eco-friendly coolers annually.
Opportunity driver
Description
Potential impact
Timeframe
Direct/ Indirect
Likelihood
Magnitude of impact
Estimated financial
implications
Management method
Cost of
management
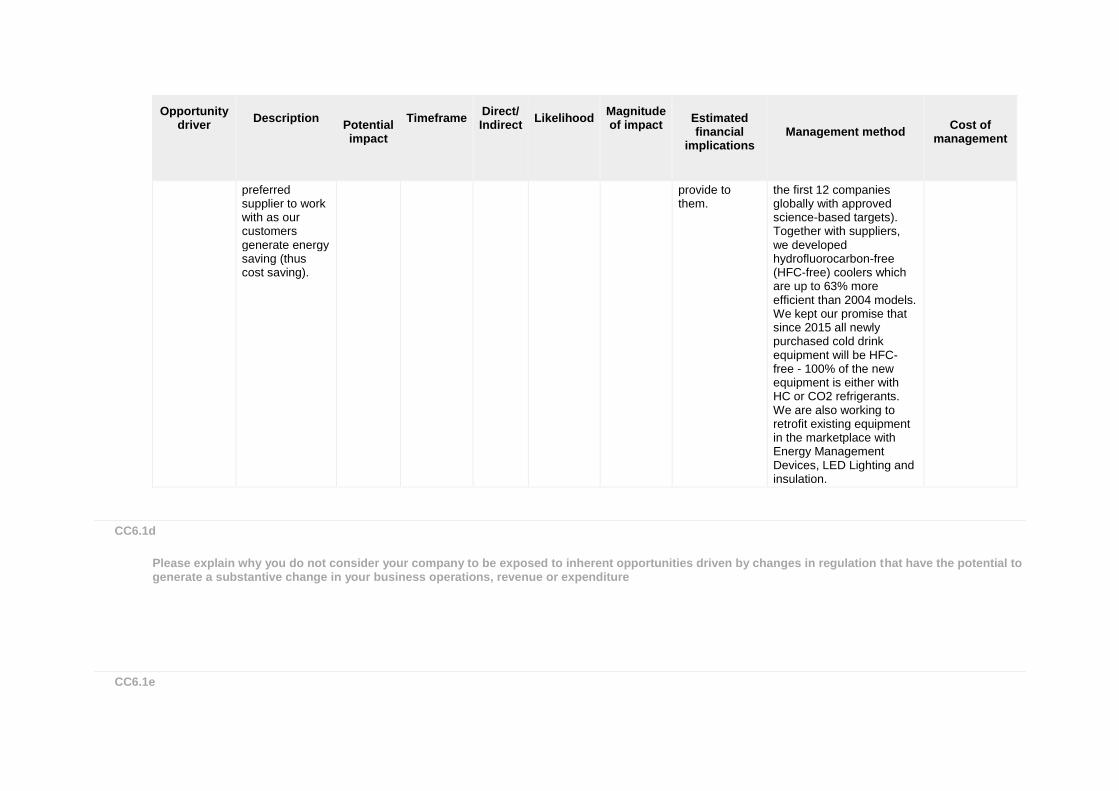
preferred supplier to work with as our customers generate energy saving (thus cost saving).
provide to them.
the first 12 companies globally with approved science-based targets). Together with suppliers, we developed hydrofluorocarbon-free (HFC-free) coolers which are up to 63% more efficient than 2004 models. We kept our promise that since 2015 all newly purchased cold drink equipment will be HFC-free - 100% of the new equipment is either with HC or CO2 refrigerants. We are also working to retrofit existing equipment in the marketplace with Energy Management Devices, LED Lighting and insulation.
CC6.1d
Please explain why you do not consider your company to be exposed to inherent opportunities driven by changes in regulation that have the potential to generate a substantive change in your business operations, revenue or expenditure
CC6.1e
Please explain why you do not consider your company to be exposed to inherent opportunities driven by changes in physical climate parameters that have the potential to generate a substantive change in your business operations, revenue or expenditure
CC6.1f
Please explain why you do not consider your company to be exposed to inherent opportunities driven by changes in other climate-related developments that have the potential to generate a substantive change in your business operations, revenue or expenditure
Further Information
Module: GHG Emissions Accounting, Energy and Fuel Use, and Trading
Page: CC7. Emissions Methodology
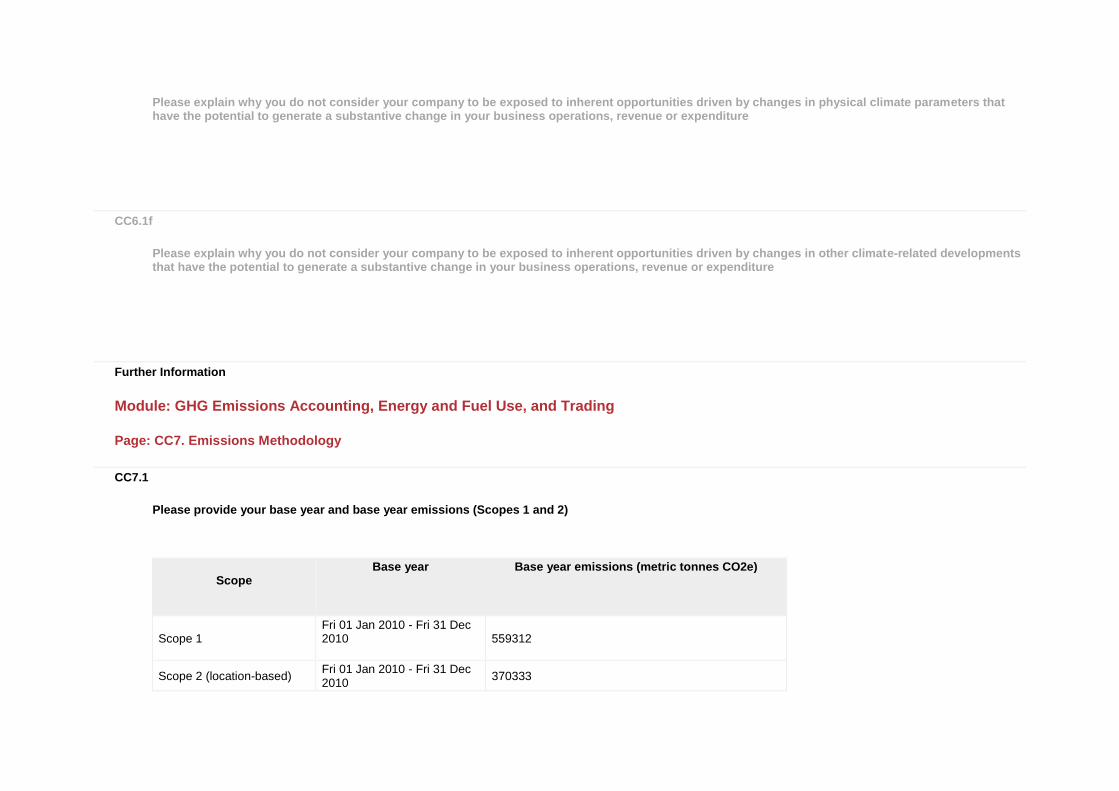
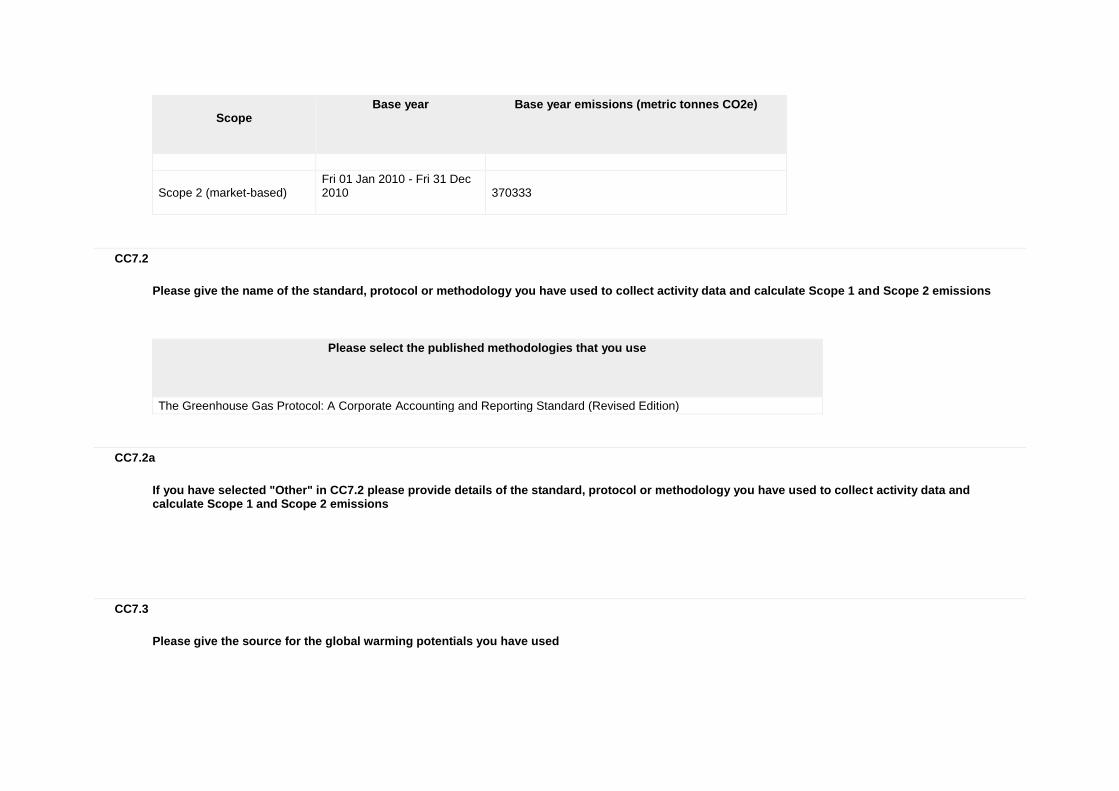
CC7.1
Please provide your base year and base year emissions (Scopes 1 and 2)
Scope
Base year
Base year emissions (metric tonnes CO2e)
Scope 1 Fri 01 Jan 2010 - Fri 31 Dec 2010
559312
Scope 2 (location-based) Fri 01 Jan 2010 - Fri 31 Dec 2010
370333
Scope
Base year
Base year emissions (metric tonnes CO2e)
Scope 2 (market-based) Fri 01 Jan 2010 - Fri 31 Dec 2010
370333
CC7.2
Please give the name of the standard, protocol or methodology you have used to collect activity data and calculate Scope 1 and Scope 2 emissions
Please select the published methodologies that you use
The Greenhouse Gas Protocol: A Corporate Accounting and Reporting Standard (Revised Edition)
CC7.2a
If you have selected "Other" in CC7.2 please provide details of the standard, protocol or methodology you have used to collect activity data and calculate Scope 1 and Scope 2 emissions
CC7.3
Please give the source for the global warming potentials you have used
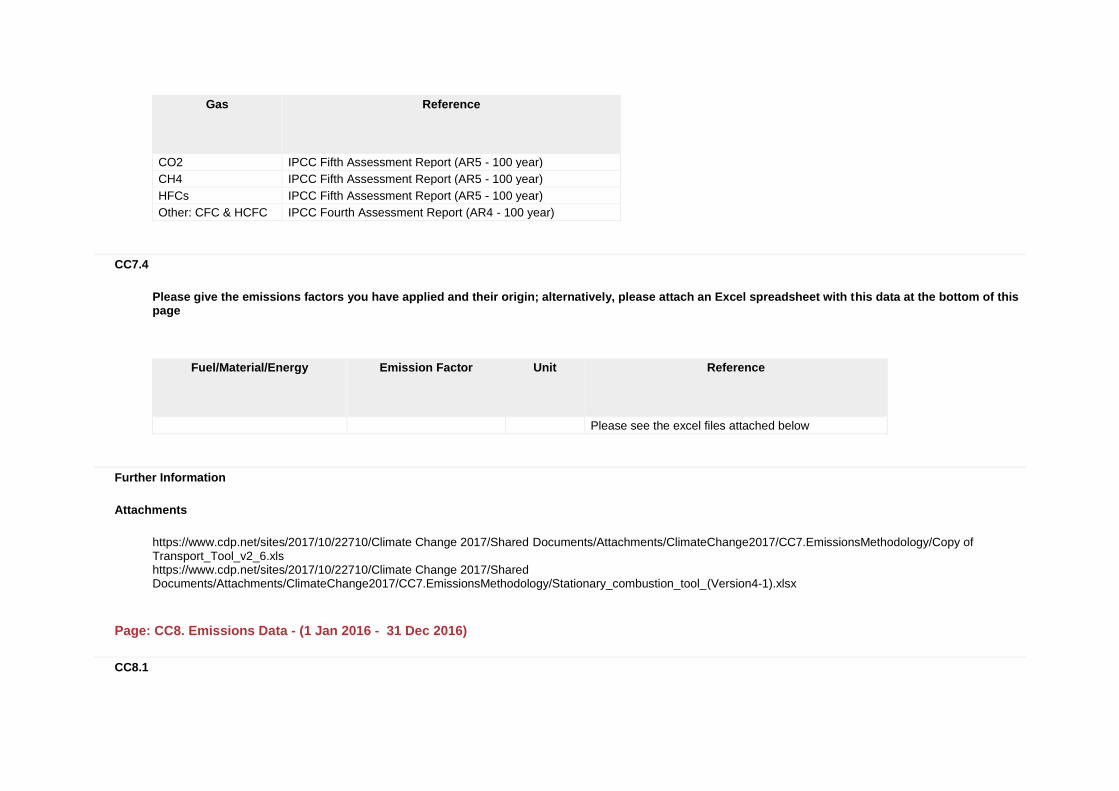
Gas
Reference
CO2 IPCC Fifth Assessment Report (AR5 - 100 year)
CH4 IPCC Fifth Assessment Report (AR5 - 100 year)
HFCs IPCC Fifth Assessment Report (AR5 - 100 year)
Other: CFC & HCFC IPCC Fourth Assessment Report (AR4 - 100 year)
CC7.4
Please give the emissions factors you have applied and their origin; alternatively, please attach an Excel spreadsheet with this data at the bottom of this page
Fuel/Material/Energy
Emission Factor
Unit
Reference
Please see the excel files attached below
Further Information
Attachments
https://www.cdp.net/sites/2017/10/22710/Climate Change 2017/Shared Documents/Attachments/ClimateChange2017/CC7.EmissionsMethodology/Copy of Transport_Tool_v2_6.xls https://www.cdp.net/sites/2017/10/22710/Climate Change 2017/Shared Documents/Attachments/ClimateChange2017/CC7.EmissionsMethodology/Stationary_combustion_tool_(Version4-1).xlsx
Page: CC8. Emissions Data - (1 Jan 2016 - 31 Dec 2016)
CC8.1
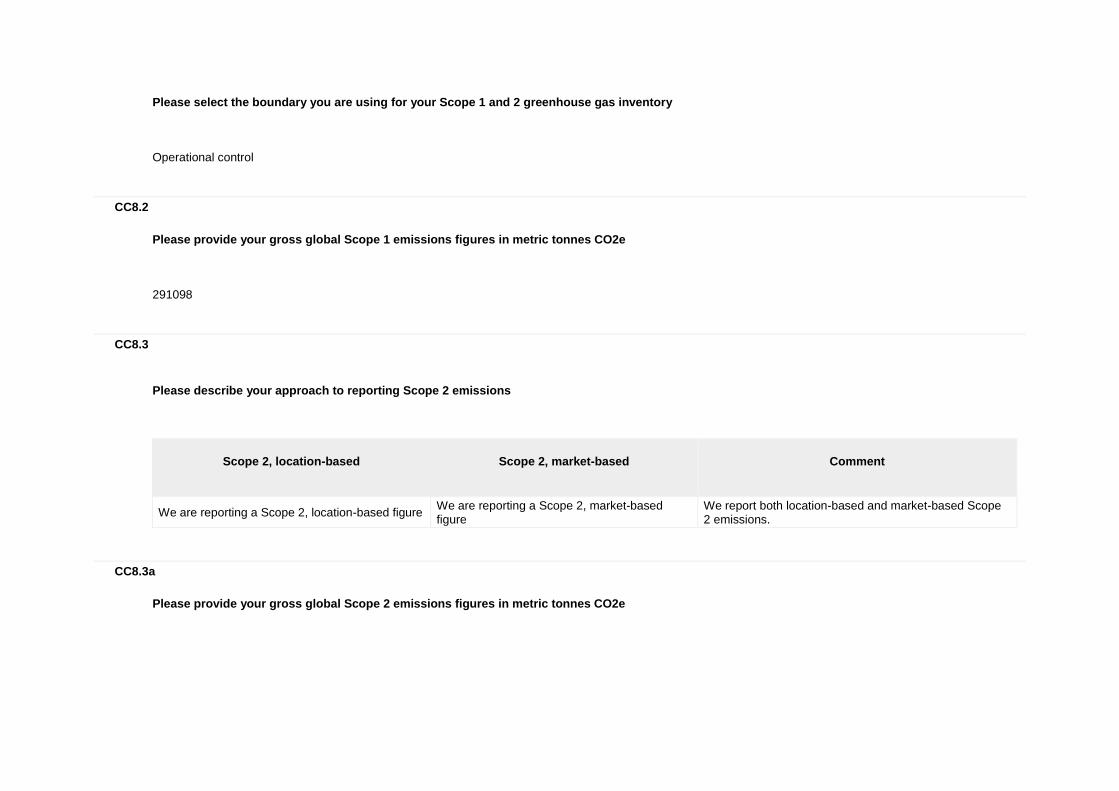
Please select the boundary you are using for your Scope 1 and 2 greenhouse gas inventory Operational control
CC8.2
Please provide your gross global Scope 1 emissions figures in metric tonnes CO2e 291098
CC8.3
Please describe your approach to reporting Scope 2 emissions
Scope 2, location-based
Scope 2, market-based
Comment
We are reporting a Scope 2, location-based figure We are reporting a Scope 2, market-based figure
We report both location-based and market-based Scope 2 emissions.
CC8.3a
Please provide your gross global Scope 2 emissions figures in metric tonnes CO2e
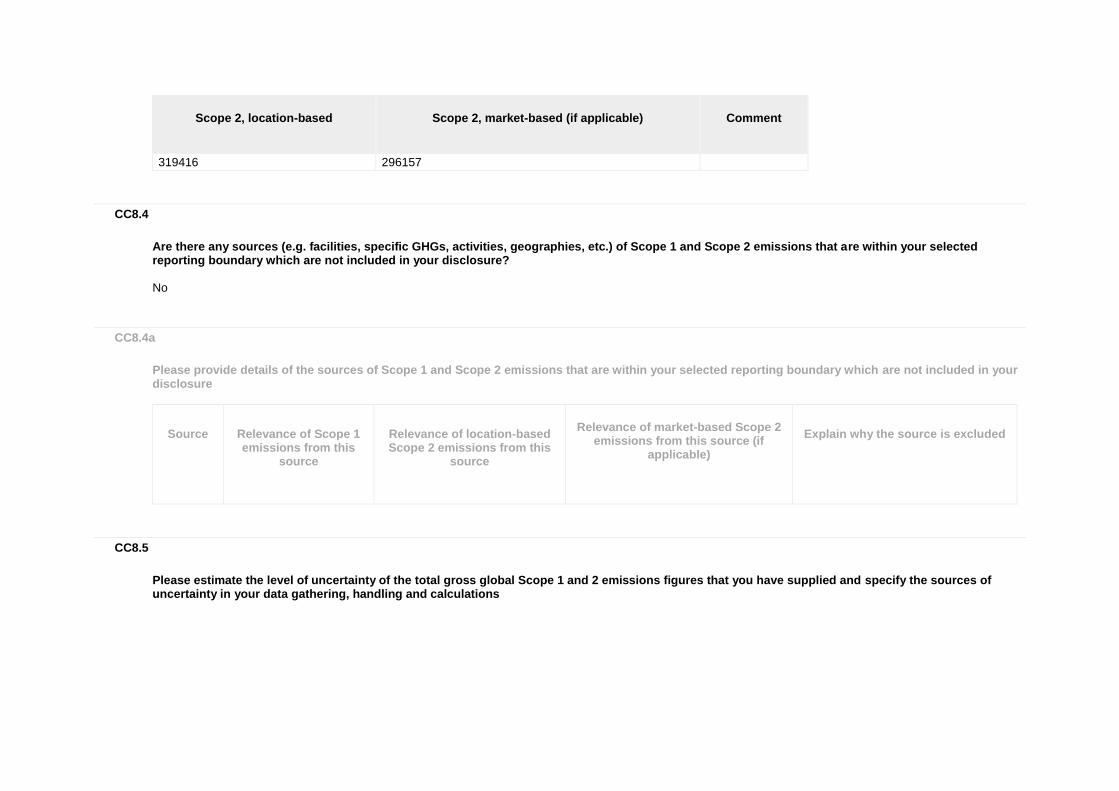
Scope 2, location-based
Scope 2, market-based (if applicable)
Comment
319416 296157
CC8.4
Are there any sources (e.g. facilities, specific GHGs, activities, geographies, etc.) of Scope 1 and Scope 2 emissions that are within your selected reporting boundary which are not included in your disclosure? No
CC8.4a
Please provide details of the sources of Scope 1 and Scope 2 emissions that are within your selected reporting boundary which are not included in your disclosure
Source
Relevance of Scope 1 emissions from this
source
Relevance of location-based Scope 2 emissions from this
source
Relevance of market-based Scope 2
emissions from this source (if applicable)
Explain why the source is excluded
CC8.5
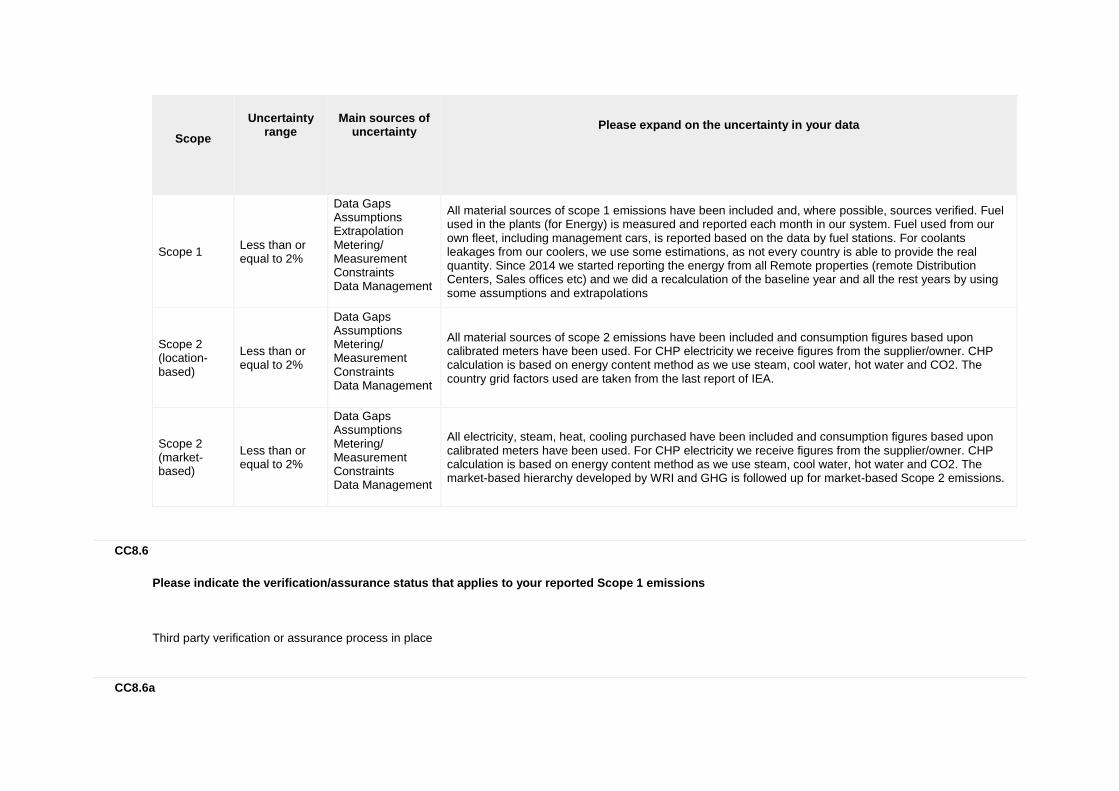
Please estimate the level of uncertainty of the total gross global Scope 1 and 2 emissions figures that you have supplied and specify the sources of uncertainty in your data gathering, handling and calculations
Scope
Uncertainty
range
Main sources of
uncertainty
Please expand on the uncertainty in your data
Scope 1 Less than or equal to 2%
Data Gaps Assumptions Extrapolation Metering/ Measurement Constraints Data Management
All material sources of scope 1 emissions have been included and, where possible, sources verified. Fuel used in the plants (for Energy) is measured and reported each month in our system. Fuel used from our own fleet, including management cars, is reported based on the data by fuel stations. For coolants leakages from our coolers, we use some estimations, as not every country is able to provide the real quantity. Since 2014 we started reporting the energy from all Remote properties (remote Distribution Centers, Sales offices etc) and we did a recalculation of the baseline year and all the rest years by using some assumptions and extrapolations
Scope 2 (location-based)
Less than or equal to 2%
Data Gaps Assumptions Metering/ Measurement Constraints Data Management
All material sources of scope 2 emissions have been included and consumption figures based upon calibrated meters have been used. For CHP electricity we receive figures from the supplier/owner. CHP calculation is based on energy content method as we use steam, cool water, hot water and CO2. The country grid factors used are taken from the last report of IEA.
Scope 2 (market-based)
Less than or equal to 2%
Data Gaps Assumptions Metering/ Measurement Constraints Data Management
All electricity, steam, heat, cooling purchased have been included and consumption figures based upon calibrated meters have been used. For CHP electricity we receive figures from the supplier/owner. CHP calculation is based on energy content method as we use steam, cool water, hot water and CO2. The market-based hierarchy developed by WRI and GHG is followed up for market-based Scope 2 emissions.
CC8.6
Please indicate the verification/assurance status that applies to your reported Scope 1 emissions Third party verification or assurance process in place
CC8.6a
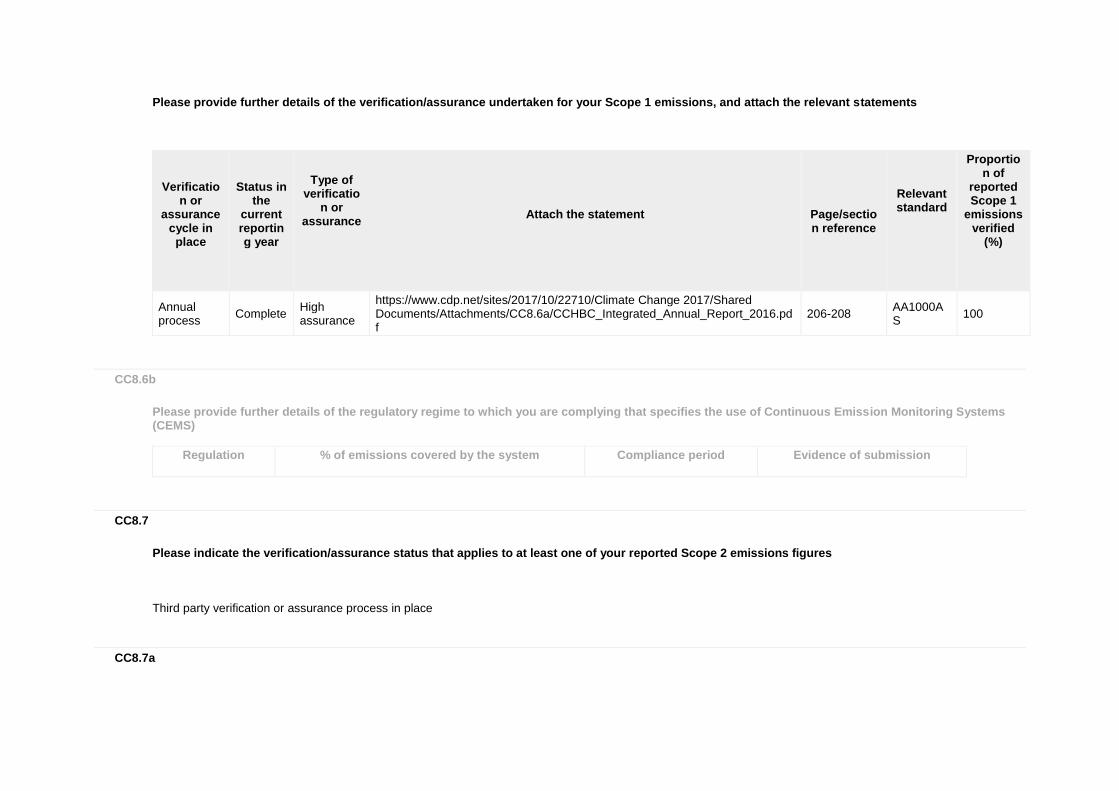
Please provide further details of the verification/assurance undertaken for your Scope 1 emissions, and attach the relevant statements
Verificatio
n or assurance
cycle in place
Status in
the current reporting year
Type of verificatio
n or assurance
Attach the statement
Page/section reference
Relevant standard
Proportion of
reported Scope 1
emissions verified
(%)
Annual process
Complete High assurance
https://www.cdp.net/sites/2017/10/22710/Climate Change 2017/Shared Documents/Attachments/CC8.6a/CCHBC_Integrated_Annual_Report_2016.pdf
206-208 AA1000AS
100
CC8.6b
Please provide further details of the regulatory regime to which you are complying that specifies the use of Continuous Emission Monitoring Systems (CEMS)
Regulation
% of emissions covered by the system
Compliance period
Evidence of submission
CC8.7
Please indicate the verification/assurance status that applies to at least one of your reported Scope 2 emissions figures Third party verification or assurance process in place
CC8.7a
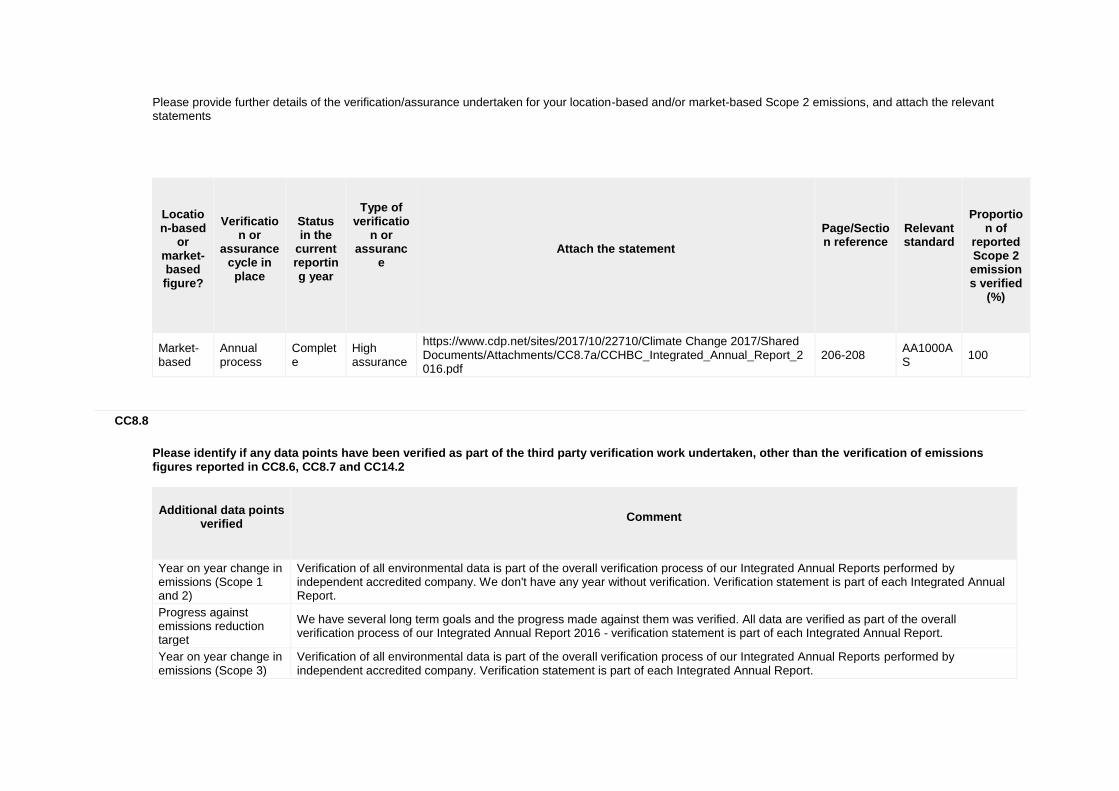
Please provide further details of the verification/assurance undertaken for your location-based and/or market-based Scope 2 emissions, and attach the relevant statements
Location-based
or market-based figure?
Verificatio
n or assurance
cycle in place
Status in the
current reporting year
Type of verificatio
n or assuranc
e
Attach the statement
Page/Section reference
Relevant standard
Proportion of
reported Scope 2 emissions verified
(%)
Market-based
Annual process
Complete
High assurance
https://www.cdp.net/sites/2017/10/22710/Climate Change 2017/Shared Documents/Attachments/CC8.7a/CCHBC_Integrated_Annual_Report_2016.pdf
206-208 AA1000AS
100
CC8.8
Please identify if any data points have been verified as part of the third party verification work undertaken, other than the verification of emissions figures reported in CC8.6, CC8.7 and CC14.2
Additional data points
verified
Comment
Year on year change in emissions (Scope 1 and 2)
Verification of all environmental data is part of the overall verification process of our Integrated Annual Reports performed by independent accredited company. We don't have any year without verification. Verification statement is part of each Integrated Annual Report.
Progress against emissions reduction target
We have several long term goals and the progress made against them was verified. All data are verified as part of the overall verification process of our Integrated Annual Report 2016 - verification statement is part of each Integrated Annual Report.
Year on year change in emissions (Scope 3)
Verification of all environmental data is part of the overall verification process of our Integrated Annual Reports performed by independent accredited company. Verification statement is part of each Integrated Annual Report.
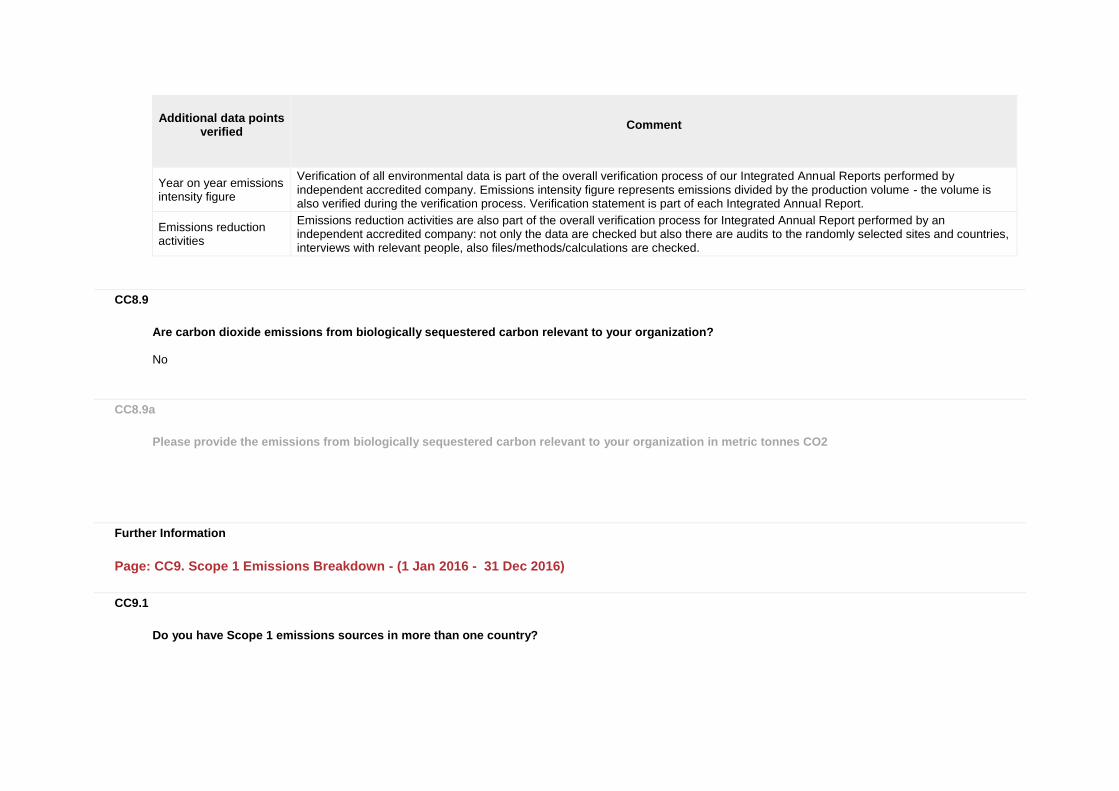
Additional data points
verified
Comment
Year on year emissions intensity figure
Verification of all environmental data is part of the overall verification process of our Integrated Annual Reports performed by independent accredited company. Emissions intensity figure represents emissions divided by the production volume - the volume is also verified during the verification process. Verification statement is part of each Integrated Annual Report.
Emissions reduction activities
Emissions reduction activities are also part of the overall verification process for Integrated Annual Report performed by an independent accredited company: not only the data are checked but also there are audits to the randomly selected sites and countries, interviews with relevant people, also files/methods/calculations are checked.
CC8.9
Are carbon dioxide emissions from biologically sequestered carbon relevant to your organization? No
CC8.9a
Please provide the emissions from biologically sequestered carbon relevant to your organization in metric tonnes CO2
Further Information
Page: CC9. Scope 1 Emissions Breakdown - (1 Jan 2016 - 31 Dec 2016)
CC9.1
Do you have Scope 1 emissions sources in more than one country?
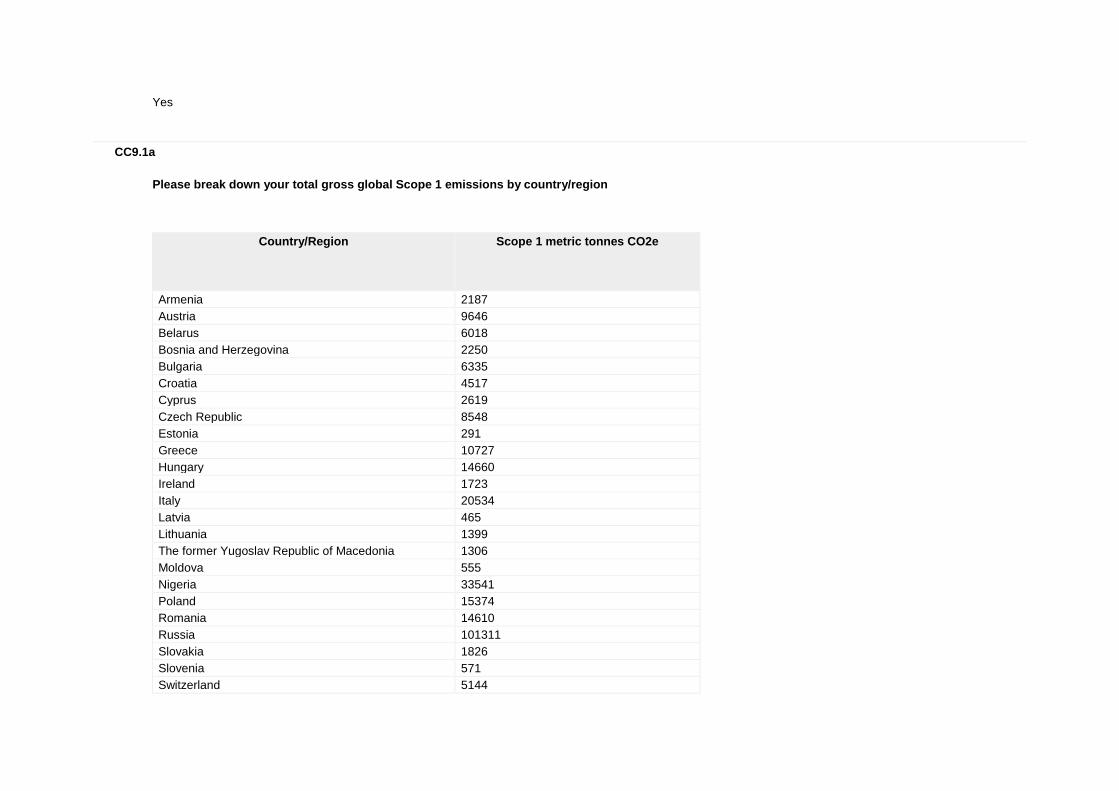
Yes
CC9.1a
Please break down your total gross global Scope 1 emissions by country/region
Country/Region
Scope 1 metric tonnes CO2e
Armenia 2187
Austria 9646
Belarus 6018
Bosnia and Herzegovina 2250
Bulgaria 6335
Croatia 4517
Cyprus 2619
Czech Republic 8548
Estonia 291
Greece 10727
Hungary 14660
Ireland 1723
Italy 20534
Latvia 465
Lithuania 1399
The former Yugoslav Republic of Macedonia 1306
Moldova 555
Nigeria 33541
Poland 15374
Romania 14610
Russia 101311
Slovakia 1826
Slovenia 571
Switzerland 5144
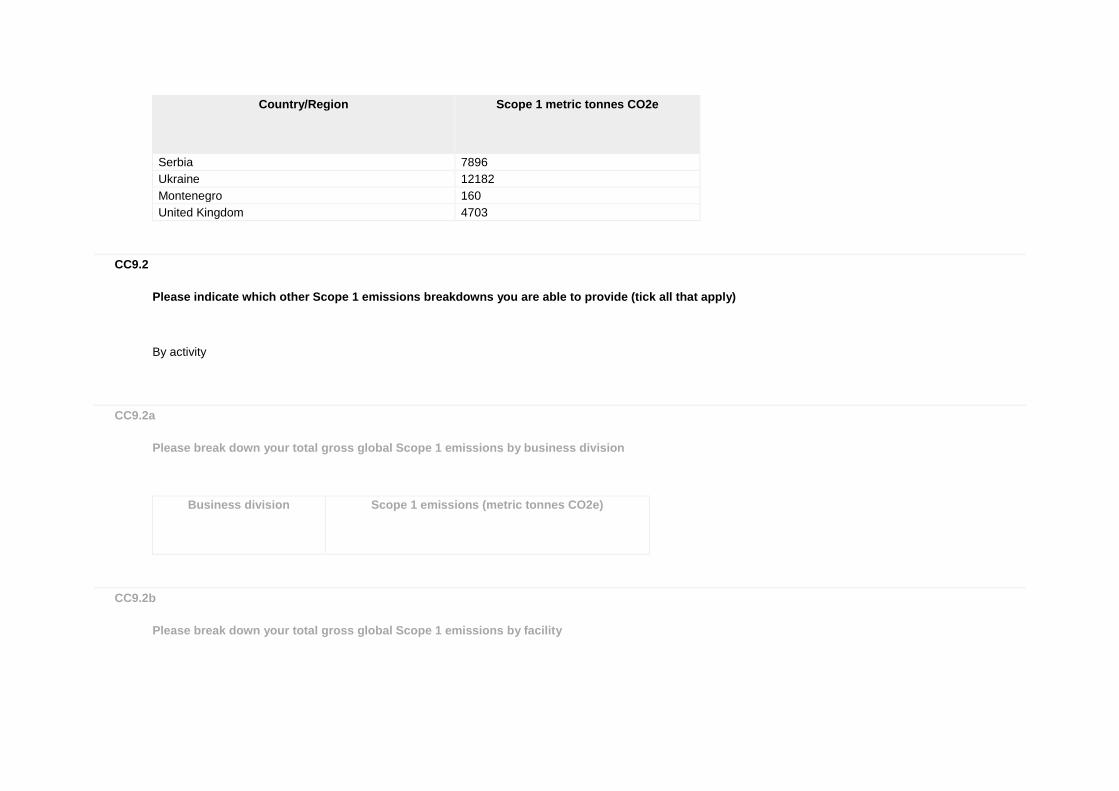
Country/Region
Scope 1 metric tonnes CO2e
Serbia 7896
Ukraine 12182
Montenegro 160
United Kingdom 4703
CC9.2
Please indicate which other Scope 1 emissions breakdowns you are able to provide (tick all that apply) By activity
CC9.2a
Please break down your total gross global Scope 1 emissions by business division
Business division
Scope 1 emissions (metric tonnes CO2e)
CC9.2b
Please break down your total gross global Scope 1 emissions by facility
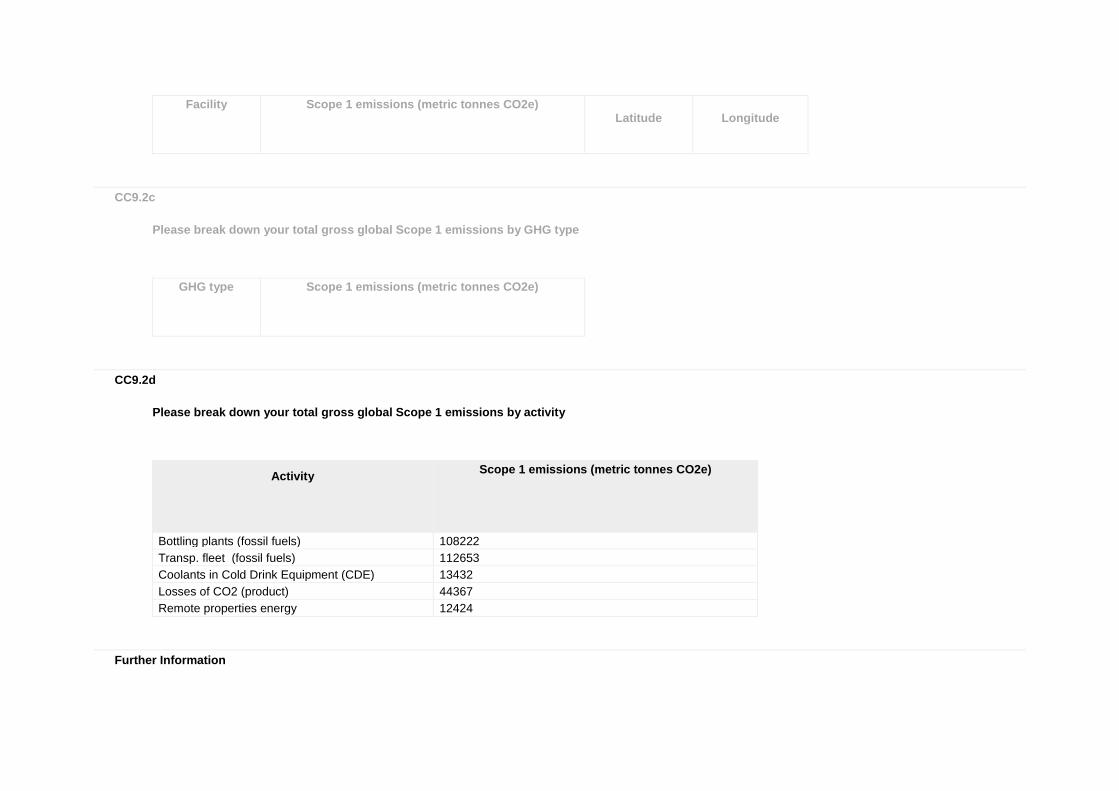
Facility
Scope 1 emissions (metric tonnes CO2e)
Latitude
Longitude
CC9.2c
Please break down your total gross global Scope 1 emissions by GHG type
GHG type
Scope 1 emissions (metric tonnes CO2e)
CC9.2d
Please break down your total gross global Scope 1 emissions by activity
Activity
Scope 1 emissions (metric tonnes CO2e)
Bottling plants (fossil fuels) 108222
Transp. fleet (fossil fuels) 112653
Coolants in Cold Drink Equipment (CDE) 13432
Losses of CO2 (product) 44367
Remote properties energy 12424
Further Information
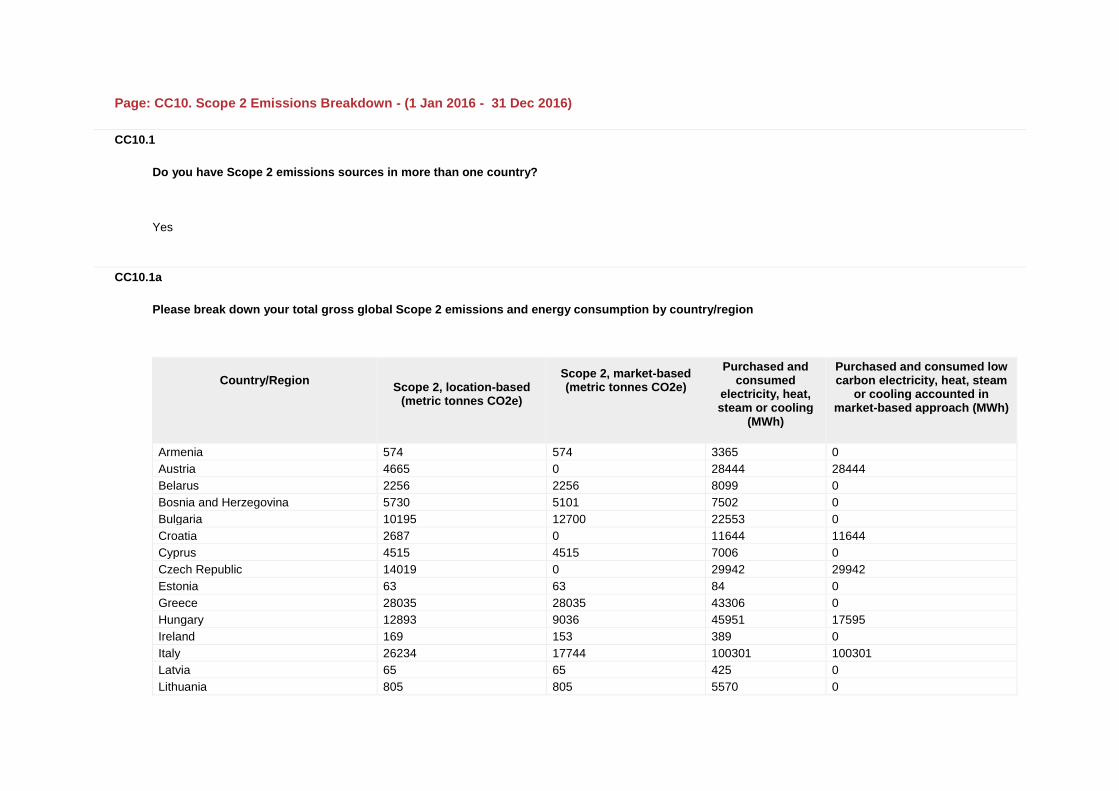
Page: CC10. Scope 2 Emissions Breakdown - (1 Jan 2016 - 31 Dec 2016)
CC10.1
Do you have Scope 2 emissions sources in more than one country? Yes
CC10.1a
Please break down your total gross global Scope 2 emissions and energy consumption by country/region
Country/Region
Scope 2, location-based
(metric tonnes CO2e)
Scope 2, market-based (metric tonnes CO2e)
Purchased and consumed
electricity, heat, steam or cooling
(MWh)
Purchased and consumed low carbon electricity, heat, steam
or cooling accounted in market-based approach (MWh)
Armenia 574 574 3365 0
Austria 4665 0 28444 28444
Belarus 2256 2256 8099 0
Bosnia and Herzegovina 5730 5101 7502 0
Bulgaria 10195 12700 22553 0
Croatia 2687 0 11644 11644
Cyprus 4515 4515 7006 0
Czech Republic 14019 0 29942 29942
Estonia 63 63 84 0
Greece 28035 28035 43306 0
Hungary 12893 9036 45951 17595
Ireland 169 153 389 0
Italy 26234 17744 100301 100301
Latvia 65 65 425 0
Lithuania 805 805 5570 0
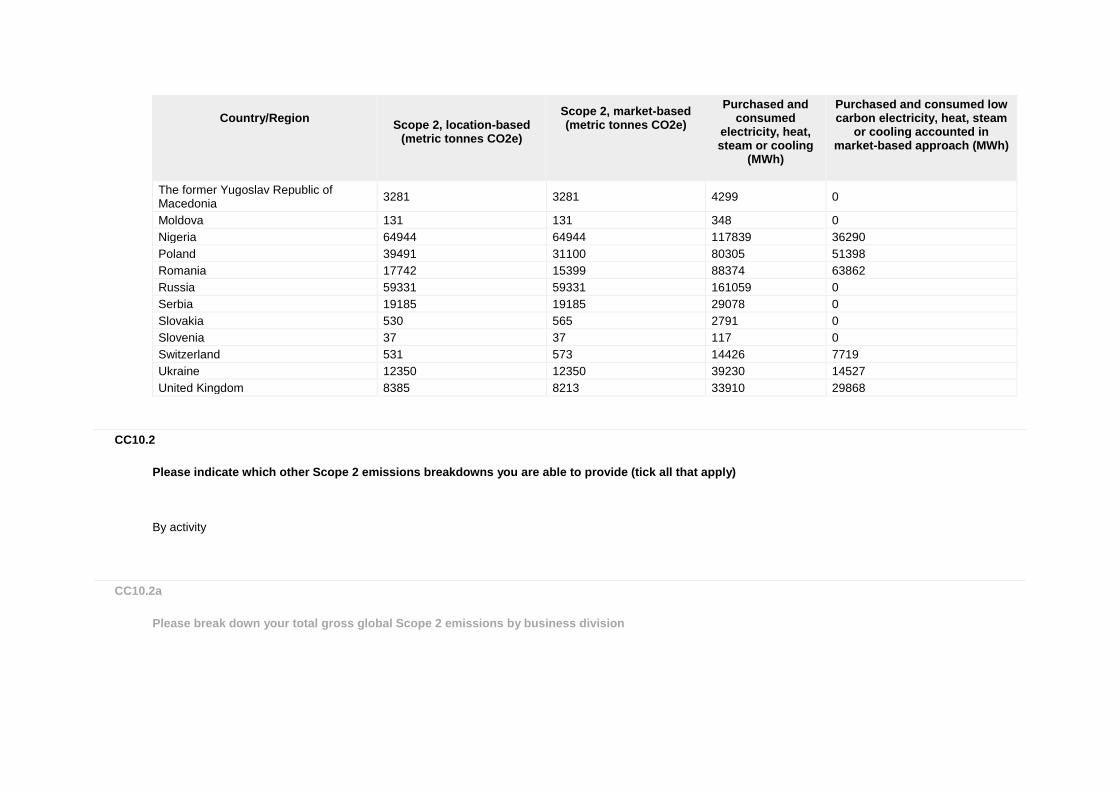
Country/Region
Scope 2, location-based
(metric tonnes CO2e)
Scope 2, market-based (metric tonnes CO2e)
Purchased and consumed
electricity, heat, steam or cooling
(MWh)
Purchased and consumed low carbon electricity, heat, steam
or cooling accounted in market-based approach (MWh)
The former Yugoslav Republic of Macedonia
3281 3281 4299 0
Moldova 131 131 348 0
Nigeria 64944 64944 117839 36290
Poland 39491 31100 80305 51398
Romania 17742 15399 88374 63862
Russia 59331 59331 161059 0
Serbia 19185 19185 29078 0
Slovakia 530 565 2791 0
Slovenia 37 37 117 0
Switzerland 531 573 14426 7719
Ukraine 12350 12350 39230 14527
United Kingdom 8385 8213 33910 29868
CC10.2
Please indicate which other Scope 2 emissions breakdowns you are able to provide (tick all that apply) By activity
CC10.2a
Please break down your total gross global Scope 2 emissions by business division
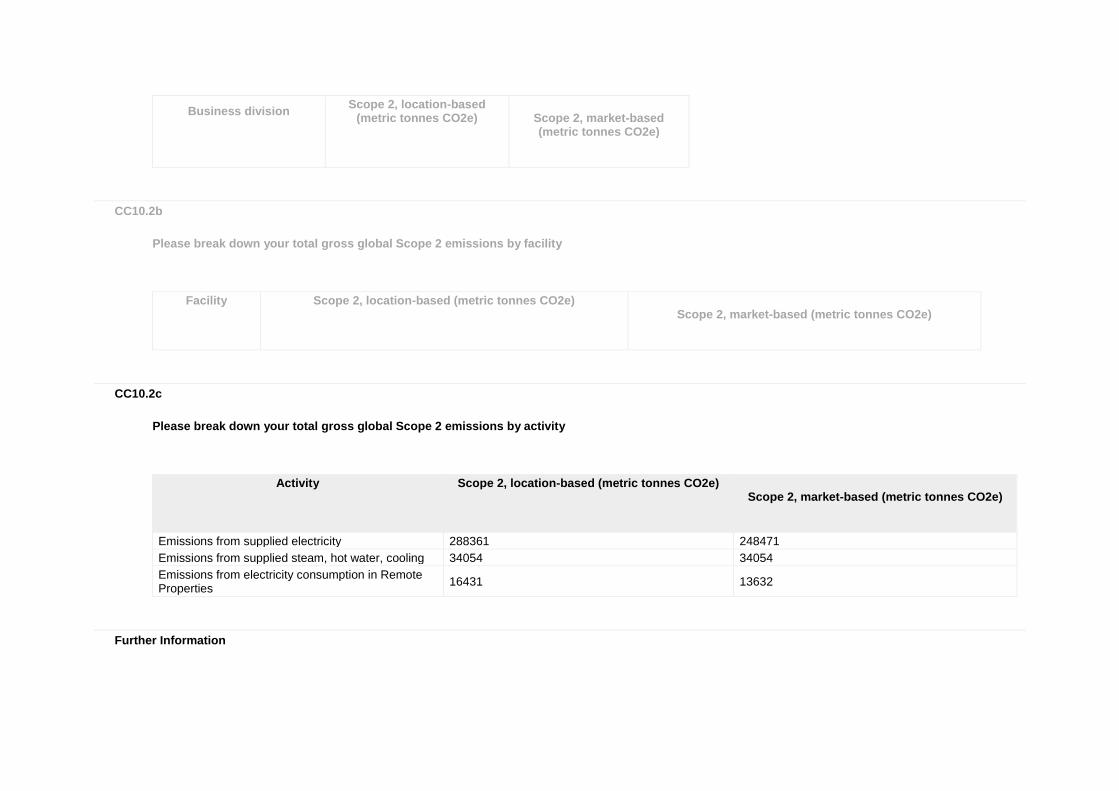
Business division
Scope 2, location-based (metric tonnes CO2e)
Scope 2, market-based (metric tonnes CO2e)
CC10.2b
Please break down your total gross global Scope 2 emissions by facility
Facility
Scope 2, location-based (metric tonnes CO2e)
Scope 2, market-based (metric tonnes CO2e)
CC10.2c
Please break down your total gross global Scope 2 emissions by activity
Activity
Scope 2, location-based (metric tonnes CO2e)
Scope 2, market-based (metric tonnes CO2e)
Emissions from supplied electricity 288361 248471
Emissions from supplied steam, hot water, cooling 34054 34054
Emissions from electricity consumption in Remote Properties
16431 13632
Further Information
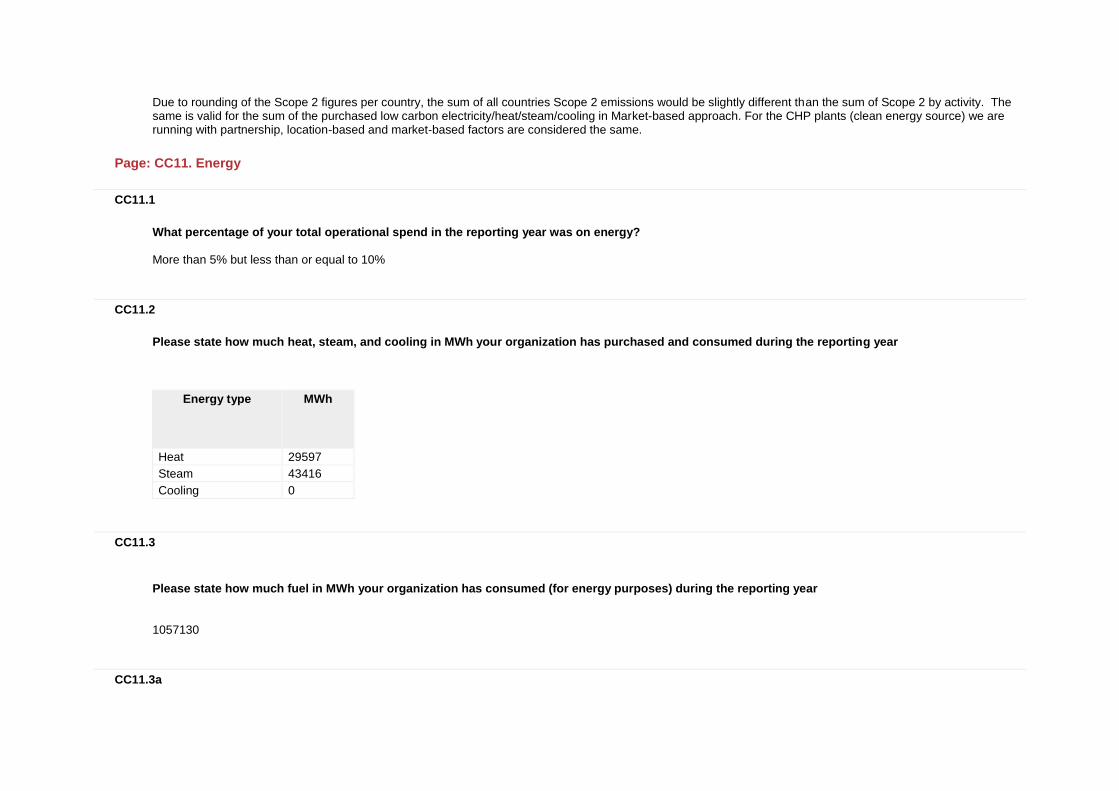
Due to rounding of the Scope 2 figures per country, the sum of all countries Scope 2 emissions would be slightly different than the sum of Scope 2 by activity. The same is valid for the sum of the purchased low carbon electricity/heat/steam/cooling in Market-based approach. For the CHP plants (clean energy source) we are running with partnership, location-based and market-based factors are considered the same.
Page: CC11. Energy
CC11.1
What percentage of your total operational spend in the reporting year was on energy? More than 5% but less than or equal to 10%
CC11.2
Please state how much heat, steam, and cooling in MWh your organization has purchased and consumed during the reporting year
Energy type
MWh
Heat 29597
Steam 43416
Cooling 0
CC11.3
Please state how much fuel in MWh your organization has consumed (for energy purposes) during the reporting year 1057130
CC11.3a
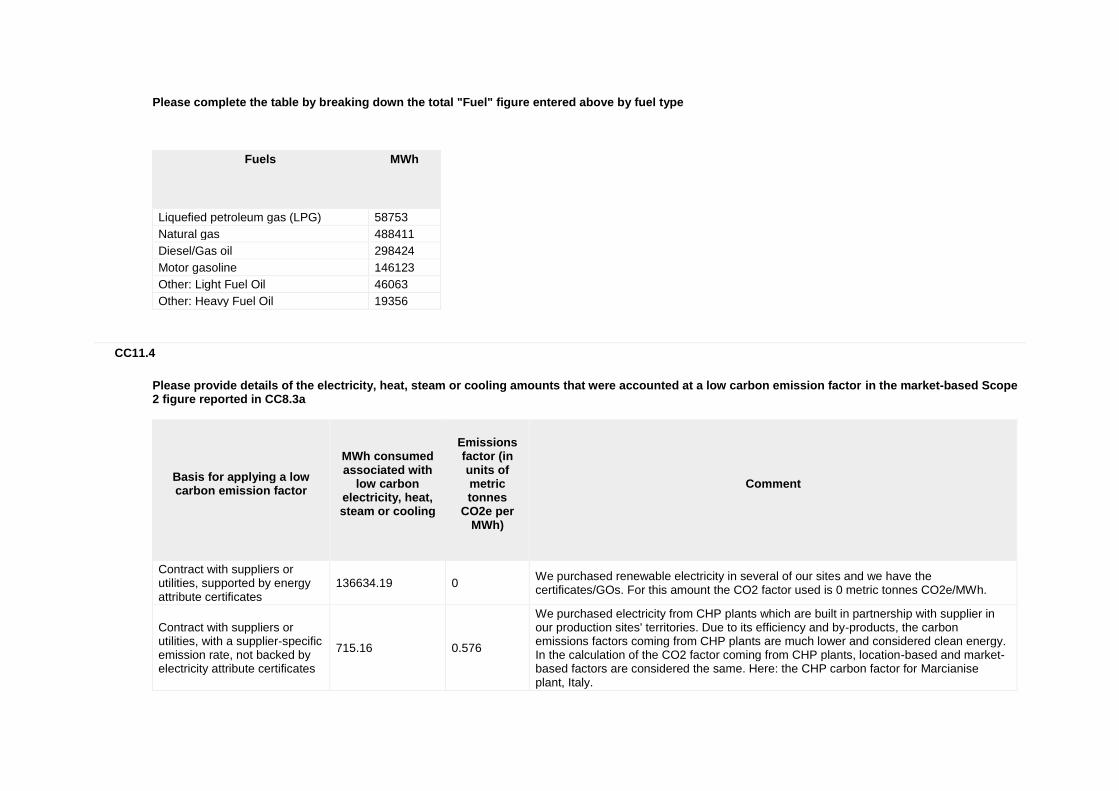
Please complete the table by breaking down the total "Fuel" figure entered above by fuel type
Fuels
MWh
Liquefied petroleum gas (LPG) 58753
Natural gas 488411
Diesel/Gas oil 298424
Motor gasoline 146123
Other: Light Fuel Oil 46063
Other: Heavy Fuel Oil 19356
CC11.4
Please provide details of the electricity, heat, steam or cooling amounts that were accounted at a low carbon emission factor in the market-based Scope 2 figure reported in CC8.3a
Basis for applying a low carbon emission factor
MWh consumed associated with
low carbon electricity, heat, steam or cooling
Emissions factor (in units of metric tonnes
CO2e per MWh)
Comment
Contract with suppliers or utilities, supported by energy attribute certificates
136634.19 0 We purchased renewable electricity in several of our sites and we have the certificates/GOs. For this amount the CO2 factor used is 0 metric tonnes CO2e/MWh.
Contract with suppliers or utilities, with a supplier-specific emission rate, not backed by electricity attribute certificates
715.16 0.576
We purchased electricity from CHP plants which are built in partnership with supplier in our production sites' territories. Due to its efficiency and by-products, the carbon emissions factors coming from CHP plants are much lower and considered clean energy. In the calculation of the CO2 factor coming from CHP plants, location-based and market-based factors are considered the same. Here: the CHP carbon factor for Marcianise plant, Italy.
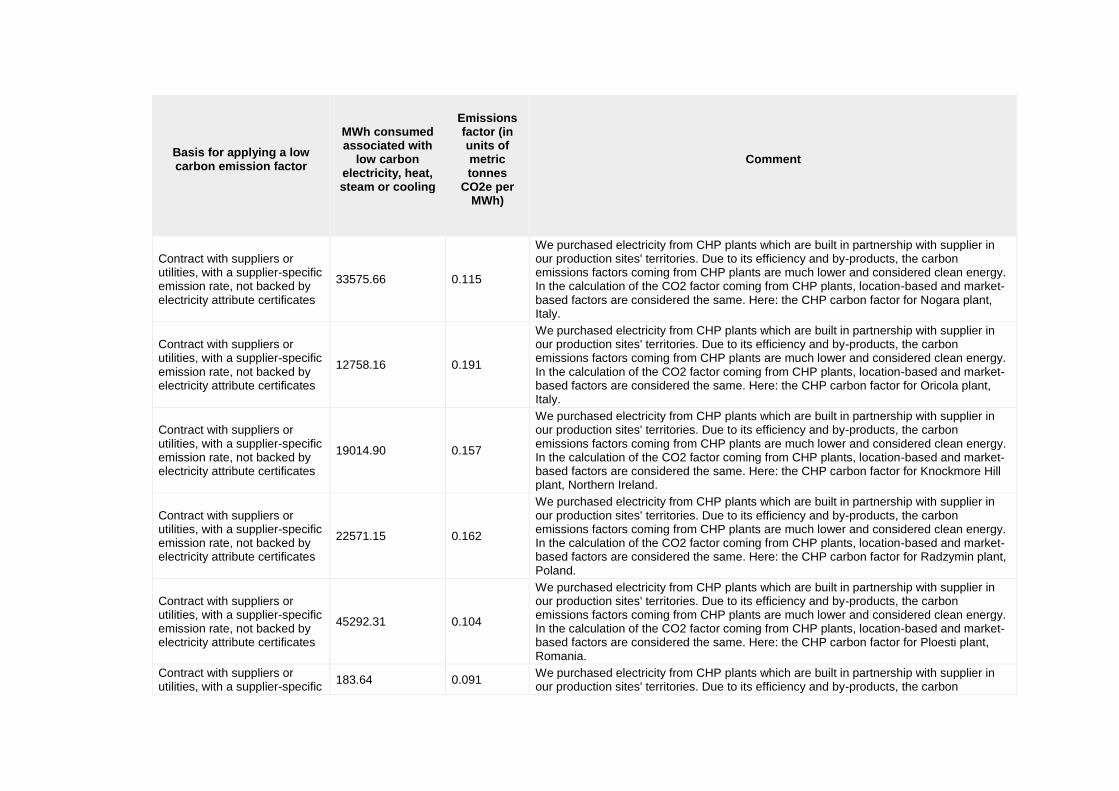
Basis for applying a low carbon emission factor
MWh consumed associated with
low carbon electricity, heat, steam or cooling
Emissions factor (in units of metric tonnes
CO2e per MWh)
Comment
Contract with suppliers or utilities, with a supplier-specific emission rate, not backed by electricity attribute certificates
33575.66 0.115
We purchased electricity from CHP plants which are built in partnership with supplier in our production sites' territories. Due to its efficiency and by-products, the carbon emissions factors coming from CHP plants are much lower and considered clean energy. In the calculation of the CO2 factor coming from CHP plants, location-based and market-based factors are considered the same. Here: the CHP carbon factor for Nogara plant, Italy.
Contract with suppliers or utilities, with a supplier-specific emission rate, not backed by electricity attribute certificates
12758.16 0.191
We purchased electricity from CHP plants which are built in partnership with supplier in our production sites' territories. Due to its efficiency and by-products, the carbon emissions factors coming from CHP plants are much lower and considered clean energy. In the calculation of the CO2 factor coming from CHP plants, location-based and market-based factors are considered the same. Here: the CHP carbon factor for Oricola plant, Italy.
Contract with suppliers or utilities, with a supplier-specific emission rate, not backed by electricity attribute certificates
19014.90 0.157
We purchased electricity from CHP plants which are built in partnership with supplier in our production sites' territories. Due to its efficiency and by-products, the carbon emissions factors coming from CHP plants are much lower and considered clean energy. In the calculation of the CO2 factor coming from CHP plants, location-based and market-based factors are considered the same. Here: the CHP carbon factor for Knockmore Hill plant, Northern Ireland.
Contract with suppliers or utilities, with a supplier-specific emission rate, not backed by electricity attribute certificates
22571.15 0.162
We purchased electricity from CHP plants which are built in partnership with supplier in our production sites' territories. Due to its efficiency and by-products, the carbon emissions factors coming from CHP plants are much lower and considered clean energy. In the calculation of the CO2 factor coming from CHP plants, location-based and market-based factors are considered the same. Here: the CHP carbon factor for Radzymin plant, Poland.
Contract with suppliers or utilities, with a supplier-specific emission rate, not backed by electricity attribute certificates
45292.31 0.104
We purchased electricity from CHP plants which are built in partnership with supplier in our production sites' territories. Due to its efficiency and by-products, the carbon emissions factors coming from CHP plants are much lower and considered clean energy. In the calculation of the CO2 factor coming from CHP plants, location-based and market-based factors are considered the same. Here: the CHP carbon factor for Ploesti plant, Romania.
Contract with suppliers or utilities, with a supplier-specific
183.64 0.091 We purchased electricity from CHP plants which are built in partnership with supplier in our production sites' territories. Due to its efficiency and by-products, the carbon
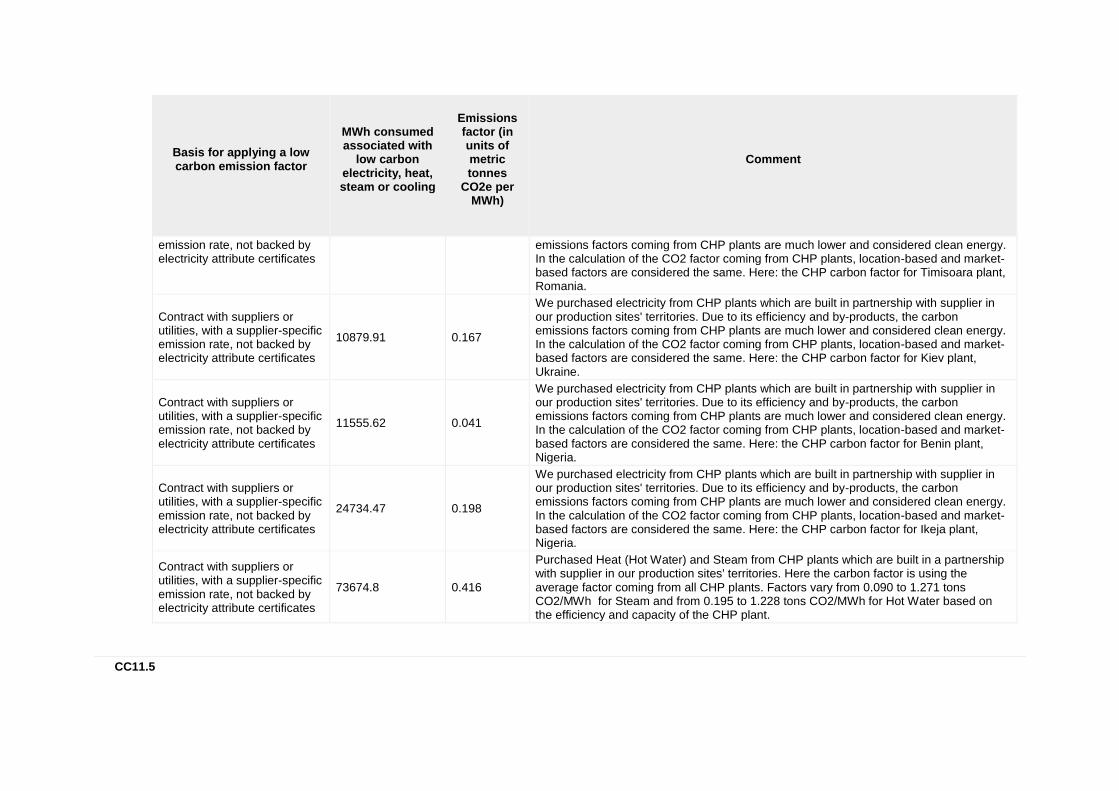
Basis for applying a low carbon emission factor
MWh consumed associated with
low carbon electricity, heat, steam or cooling
Emissions factor (in units of metric tonnes
CO2e per MWh)
Comment
emission rate, not backed by electricity attribute certificates
emissions factors coming from CHP plants are much lower and considered clean energy. In the calculation of the CO2 factor coming from CHP plants, location-based and market-based factors are considered the same. Here: the CHP carbon factor for Timisoara plant, Romania.
Contract with suppliers or utilities, with a supplier-specific emission rate, not backed by electricity attribute certificates
10879.91 0.167
We purchased electricity from CHP plants which are built in partnership with supplier in our production sites' territories. Due to its efficiency and by-products, the carbon emissions factors coming from CHP plants are much lower and considered clean energy. In the calculation of the CO2 factor coming from CHP plants, location-based and market-based factors are considered the same. Here: the CHP carbon factor for Kiev plant, Ukraine.
Contract with suppliers or utilities, with a supplier-specific emission rate, not backed by electricity attribute certificates
11555.62 0.041
We purchased electricity from CHP plants which are built in partnership with supplier in our production sites' territories. Due to its efficiency and by-products, the carbon emissions factors coming from CHP plants are much lower and considered clean energy. In the calculation of the CO2 factor coming from CHP plants, location-based and market-based factors are considered the same. Here: the CHP carbon factor for Benin plant, Nigeria.
Contract with suppliers or utilities, with a supplier-specific emission rate, not backed by electricity attribute certificates
24734.47 0.198
We purchased electricity from CHP plants which are built in partnership with supplier in our production sites' territories. Due to its efficiency and by-products, the carbon emissions factors coming from CHP plants are much lower and considered clean energy. In the calculation of the CO2 factor coming from CHP plants, location-based and market-based factors are considered the same. Here: the CHP carbon factor for Ikeja plant, Nigeria.
Contract with suppliers or utilities, with a supplier-specific emission rate, not backed by electricity attribute certificates
73674.8 0.416
Purchased Heat (Hot Water) and Steam from CHP plants which are built in a partnership with supplier in our production sites' territories. Here the carbon factor is using the average factor coming from all CHP plants. Factors vary from 0.090 to 1.271 tons CO2/MWh for Steam and from 0.195 to 1.228 tons CO2/MWh for Hot Water based on the efficiency and capacity of the CHP plant.
CC11.5
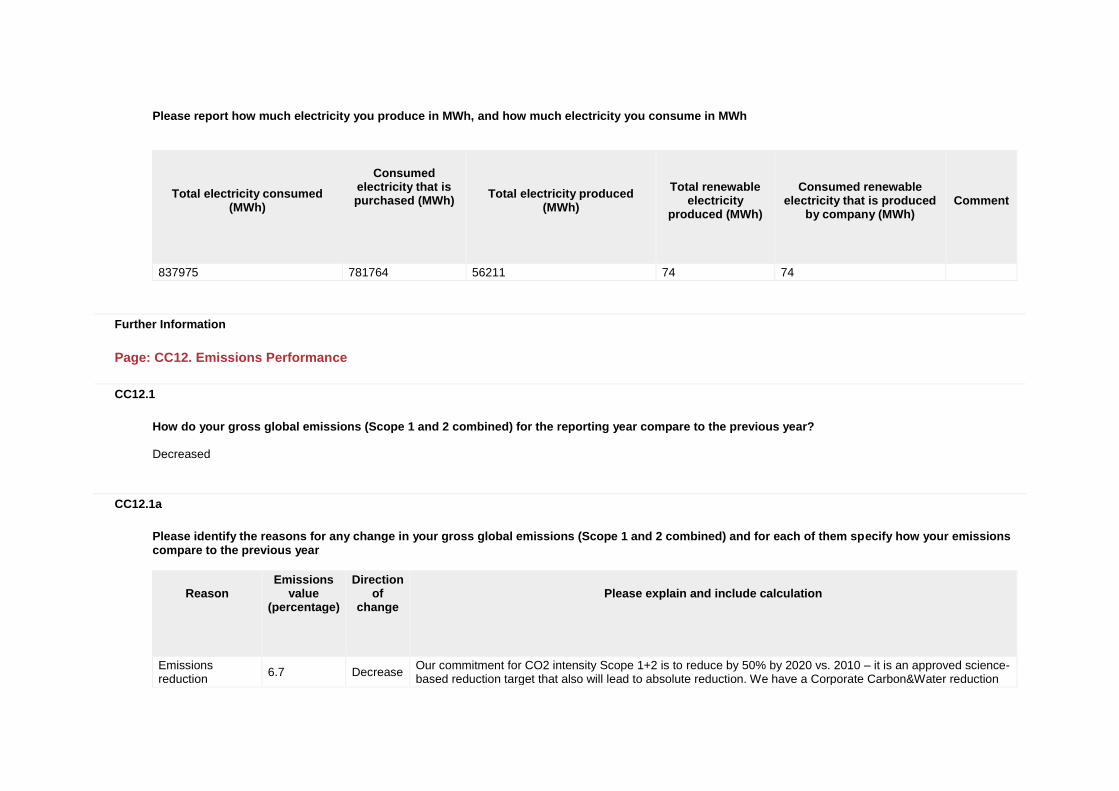
Please report how much electricity you produce in MWh, and how much electricity you consume in MWh
Total electricity consumed
(MWh)
Consumed
electricity that is purchased (MWh)
Total electricity produced
(MWh)
Total renewable
electricity produced (MWh)
Consumed renewable
electricity that is produced by company (MWh)
Comment
837975 781764 56211 74 74
Further Information
Page: CC12. Emissions Performance
CC12.1
How do your gross global emissions (Scope 1 and 2 combined) for the reporting year compare to the previous year? Decreased
CC12.1a
Please identify the reasons for any change in your gross global emissions (Scope 1 and 2 combined) and for each of them specify how your emissions compare to the previous year
Reason
Emissions value
(percentage)
Direction of
change
Please explain and include calculation
Emissions reduction
6.7 Decrease Our commitment for CO2 intensity Scope 1+2 is to reduce by 50% by 2020 vs. 2010 – it is an approved science-based reduction target that also will lead to absolute reduction. We have a Corporate Carbon&Water reduction
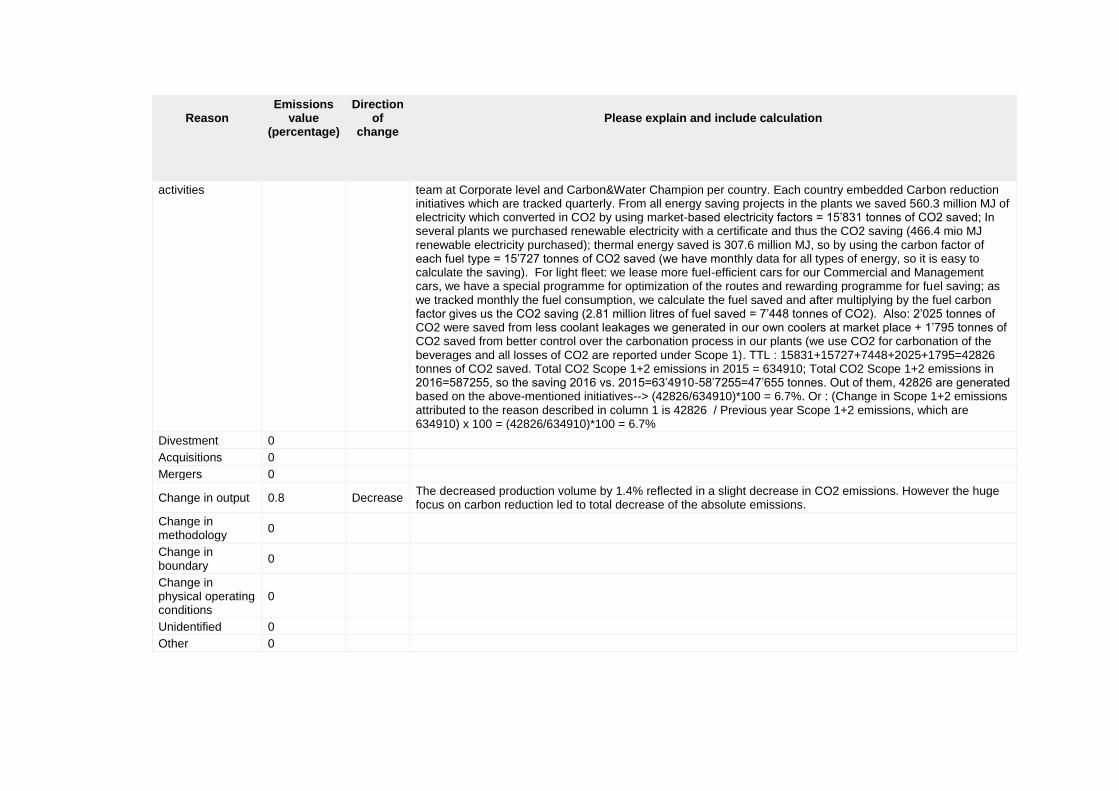
Reason
Emissions value
(percentage)
Direction of
change
Please explain and include calculation
activities team at Corporate level and Carbon&Water Champion per country. Each country embedded Carbon reduction initiatives which are tracked quarterly. From all energy saving projects in the plants we saved 560.3 million MJ of electricity which converted in CO2 by using market-based electricity factors = 15’831 tonnes of CO2 saved; In several plants we purchased renewable electricity with a certificate and thus the CO2 saving (466.4 mio MJ renewable electricity purchased); thermal energy saved is 307.6 million MJ, so by using the carbon factor of each fuel type = 15’727 tonnes of CO2 saved (we have monthly data for all types of energy, so it is easy to calculate the saving). For light fleet: we lease more fuel-efficient cars for our Commercial and Management cars, we have a special programme for optimization of the routes and rewarding programme for fuel saving; as we tracked monthly the fuel consumption, we calculate the fuel saved and after multiplying by the fuel carbon factor gives us the CO2 saving (2.81 million litres of fuel saved = 7’448 tonnes of CO2). Also: 2’025 tonnes of CO2 were saved from less coolant leakages we generated in our own coolers at market place + 1’795 tonnes of CO2 saved from better control over the carbonation process in our plants (we use CO2 for carbonation of the beverages and all losses of CO2 are reported under Scope 1). TTL : 15831+15727+7448+2025+1795=42826 tonnes of CO2 saved. Total CO2 Scope 1+2 emissions in 2015 = 634910; Total CO2 Scope 1+2 emissions in 2016=587255, so the saving 2016 vs. 2015=63’4910-58’7255=47’655 tonnes. Out of them, 42826 are generated based on the above-mentioned initiatives--> (42826/634910)*100 = 6.7%. Or : (Change in Scope 1+2 emissions attributed to the reason described in column 1 is 42826 / Previous year Scope 1+2 emissions, which are 634910) x 100 = (42826/634910)*100 = 6.7%
Divestment 0
Acquisitions 0
Mergers 0
Change in output 0.8 Decrease The decreased production volume by 1.4% reflected in a slight decrease in CO2 emissions. However the huge focus on carbon reduction led to total decrease of the absolute emissions.
Change in methodology
0
Change in boundary
0
Change in physical operating conditions
0
Unidentified 0
Other 0
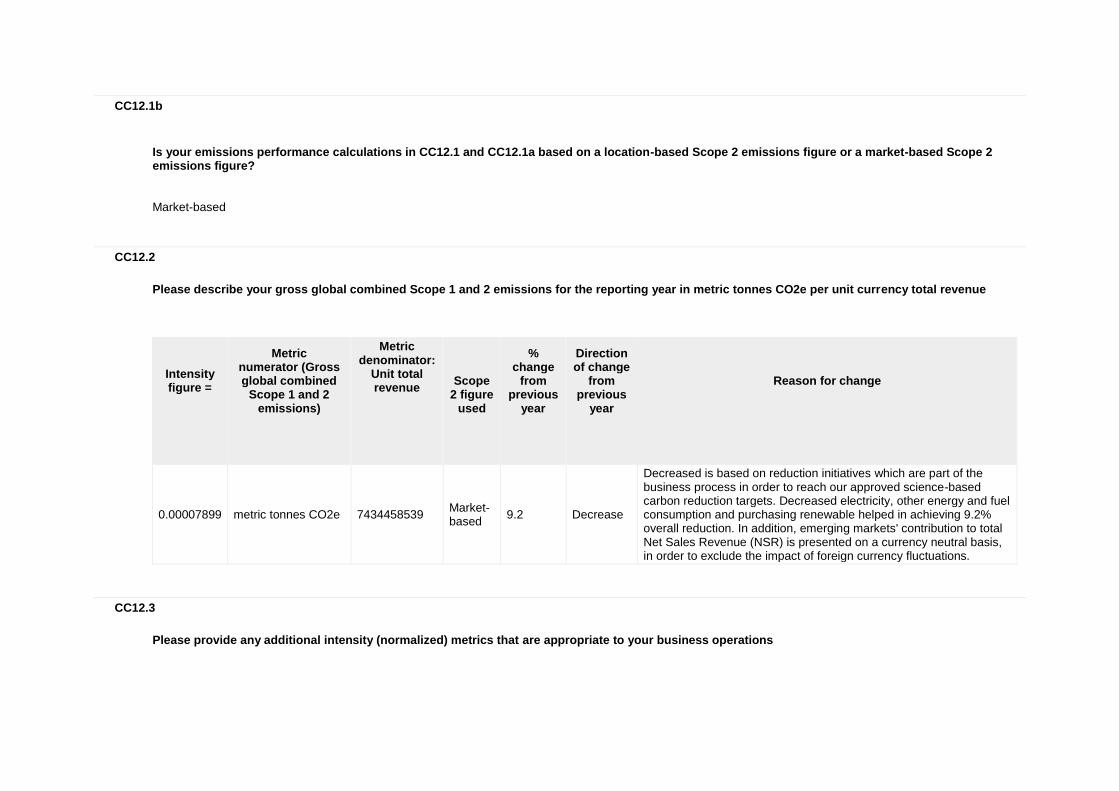
CC12.1b
Is your emissions performance calculations in CC12.1 and CC12.1a based on a location-based Scope 2 emissions figure or a market-based Scope 2 emissions figure? Market-based
CC12.2
Please describe your gross global combined Scope 1 and 2 emissions for the reporting year in metric tonnes CO2e per unit currency total revenue
Intensity figure =
Metric numerator (Gross global combined
Scope 1 and 2 emissions)
Metric denominator:
Unit total revenue
Scope
2 figure used
% change
from previous
year
Direction of change
from previous
year
Reason for change
0.00007899 metric tonnes CO2e 7434458539 Market-based
9.2 Decrease
Decreased is based on reduction initiatives which are part of the business process in order to reach our approved science-based carbon reduction targets. Decreased electricity, other energy and fuel consumption and purchasing renewable helped in achieving 9.2% overall reduction. In addition, emerging markets' contribution to total Net Sales Revenue (NSR) is presented on a currency neutral basis, in order to exclude the impact of foreign currency fluctuations.
CC12.3
Please provide any additional intensity (normalized) metrics that are appropriate to your business operations
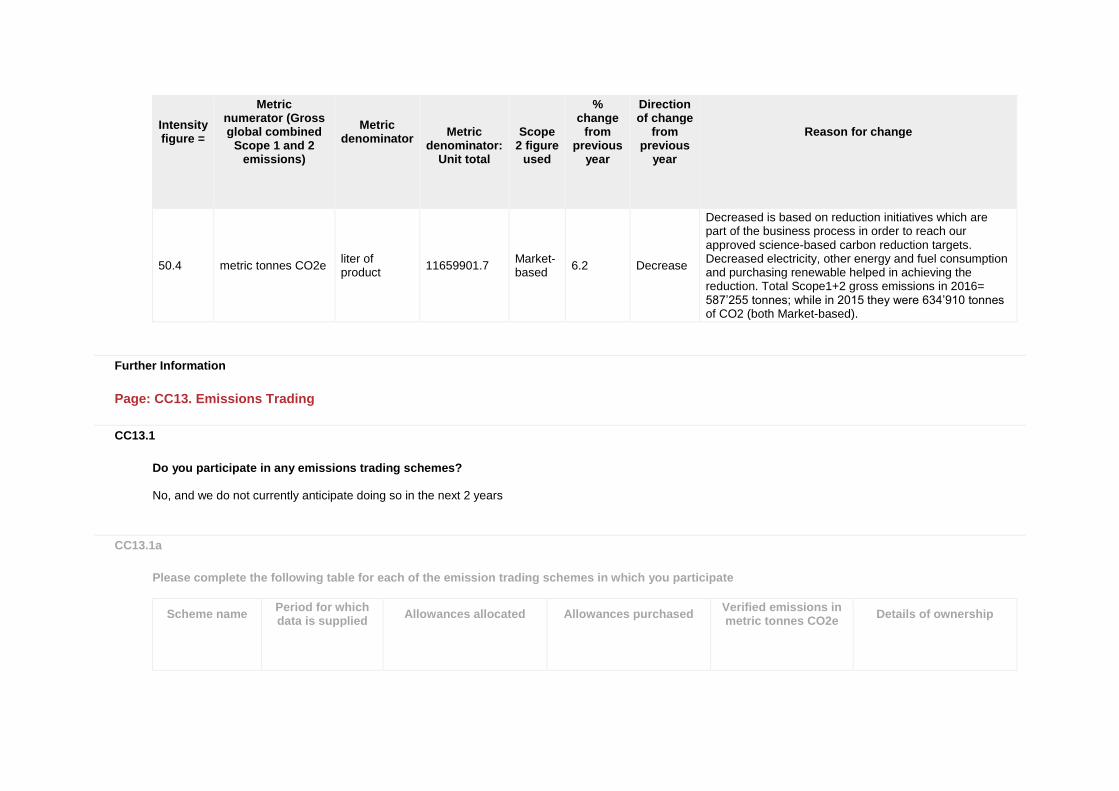
Intensity figure =
Metric numerator (Gross global combined
Scope 1 and 2 emissions)
Metric denominator
Metric
denominator: Unit total
Scope
2 figure used
% change
from previous
year
Direction of change
from previous
year
Reason for change
50.4 metric tonnes CO2e liter of product
11659901.7 Market-based
6.2 Decrease
Decreased is based on reduction initiatives which are part of the business process in order to reach our approved science-based carbon reduction targets. Decreased electricity, other energy and fuel consumption and purchasing renewable helped in achieving the reduction. Total Scope1+2 gross emissions in 2016= 587’255 tonnes; while in 2015 they were 634’910 tonnes of CO2 (both Market-based).
Further Information
Page: CC13. Emissions Trading
CC13.1
Do you participate in any emissions trading schemes? No, and we do not currently anticipate doing so in the next 2 years
CC13.1a
Please complete the following table for each of the emission trading schemes in which you participate
Scheme name
Period for which data is supplied
Allowances allocated
Allowances purchased
Verified emissions in metric tonnes CO2e
Details of ownership
CC13.1b
What is your strategy for complying with the schemes in which you participate or anticipate participating?
CC13.2
Has your organization originated any project-based carbon credits or purchased any within the reporting period? No
CC13.2a
Please provide details on the project-based carbon credits originated or purchased by your organization in the reporting period
Credit origination
or credit purchase
Project type
Project identification
Verified to which standard
Number of credits (metric
tonnes CO2e)
Number of credits (metric tonnes
CO2e): Risk adjusted volume
Credits canceled
Purpose, e.g. compliance
Further Information
Page: CC14. Scope 3 Emissions
CC14.1
Please account for your organization’s Scope 3 emissions, disclosing and explaining any exclusions
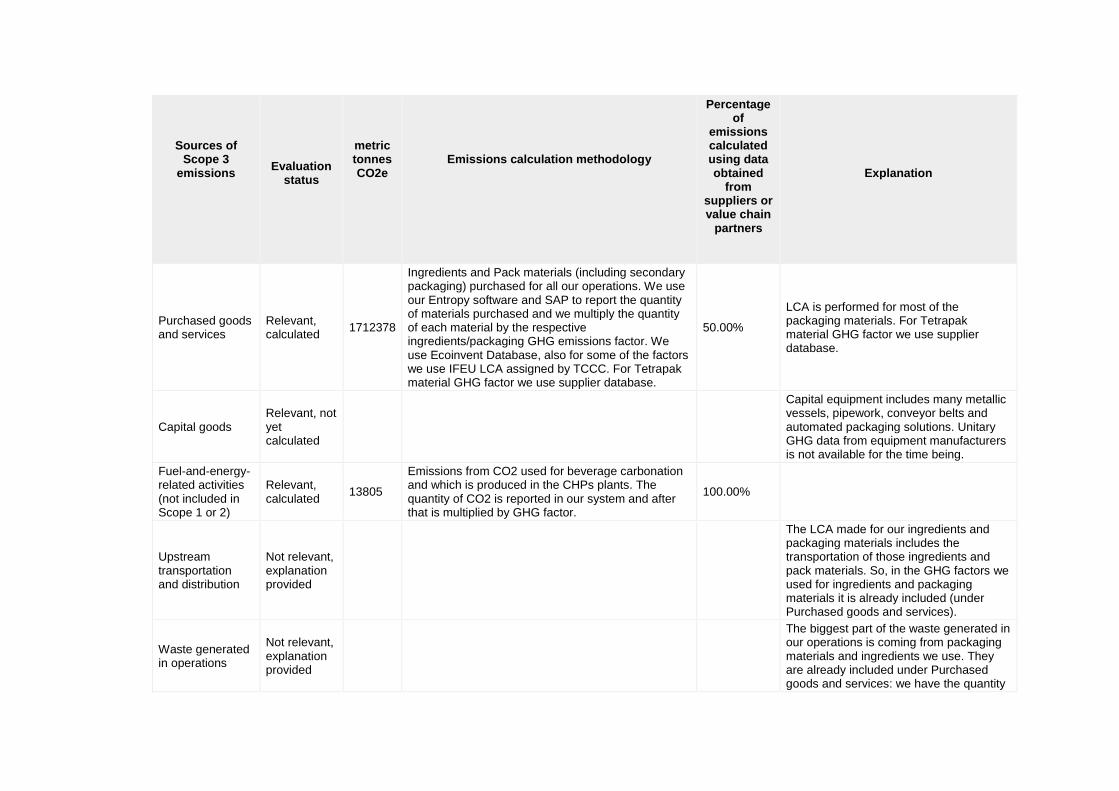
Sources of Scope 3
emissions
Evaluation status
metric tonnes CO2e
Emissions calculation methodology
Percentage of
emissions calculated using data obtained
from suppliers or value chain
partners
Explanation
Purchased goods and services
Relevant, calculated
1712378
Ingredients and Pack materials (including secondary packaging) purchased for all our operations. We use our Entropy software and SAP to report the quantity of materials purchased and we multiply the quantity of each material by the respective ingredients/packaging GHG emissions factor. We use Ecoinvent Database, also for some of the factors we use IFEU LCA assigned by TCCC. For Tetrapak material GHG factor we use supplier database.
50.00%
LCA is performed for most of the packaging materials. For Tetrapak material GHG factor we use supplier database.
Capital goods Relevant, not yet calculated
Capital equipment includes many metallic vessels, pipework, conveyor belts and automated packaging solutions. Unitary GHG data from equipment manufacturers is not available for the time being.
Fuel-and-energy-related activities (not included in Scope 1 or 2)
Relevant, calculated
13805
Emissions from CO2 used for beverage carbonation and which is produced in the CHPs plants. The quantity of CO2 is reported in our system and after that is multiplied by GHG factor.
100.00%
Upstream transportation and distribution
Not relevant, explanation provided
The LCA made for our ingredients and packaging materials includes the transportation of those ingredients and pack materials. So, in the GHG factors we used for ingredients and packaging materials it is already included (under Purchased goods and services).
Waste generated in operations
Not relevant, explanation provided
The biggest part of the waste generated in our operations is coming from packaging materials and ingredients we use. They are already included under Purchased goods and services: we have the quantity
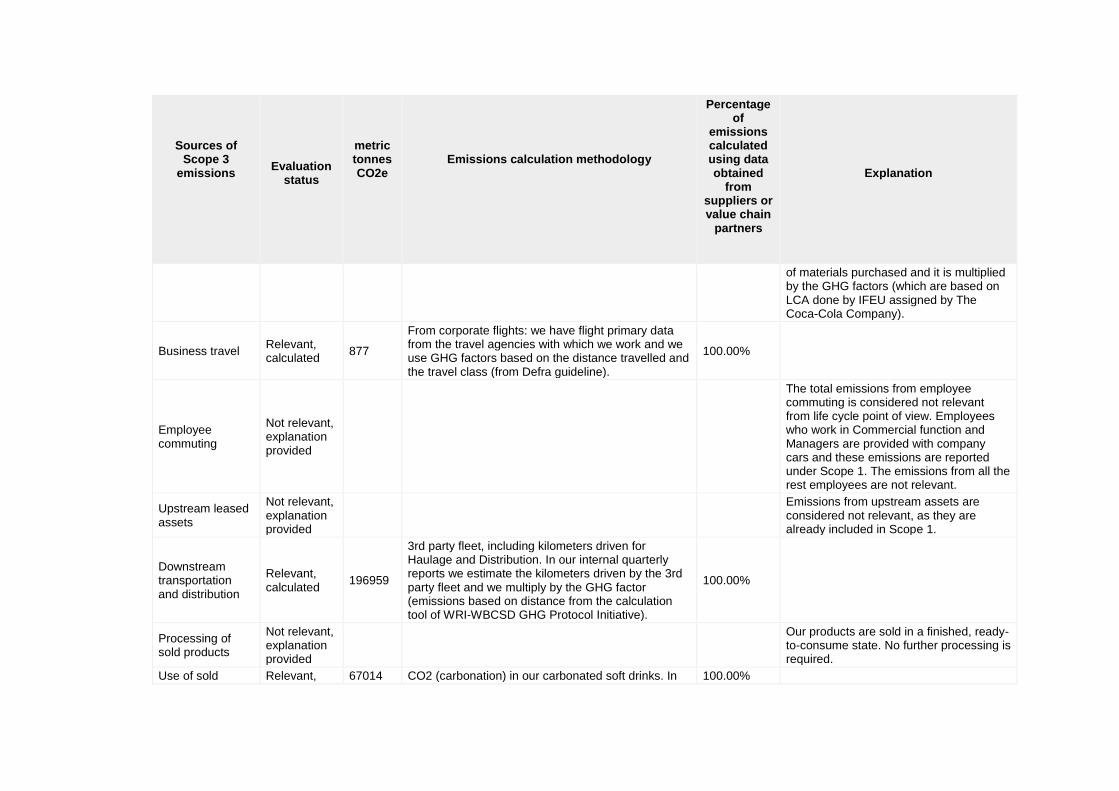
Sources of Scope 3
emissions
Evaluation status
metric tonnes CO2e
Emissions calculation methodology
Percentage of
emissions calculated using data obtained
from suppliers or value chain
partners
Explanation
of materials purchased and it is multiplied by the GHG factors (which are based on LCA done by IFEU assigned by The Coca-Cola Company).
Business travel Relevant, calculated
877
From corporate flights: we have flight primary data from the travel agencies with which we work and we use GHG factors based on the distance travelled and the travel class (from Defra guideline).
100.00%
Employee commuting
Not relevant, explanation provided
The total emissions from employee commuting is considered not relevant from life cycle point of view. Employees who work in Commercial function and Managers are provided with company cars and these emissions are reported under Scope 1. The emissions from all the rest employees are not relevant.
Upstream leased assets
Not relevant, explanation provided
Emissions from upstream assets are considered not relevant, as they are already included in Scope 1.
Downstream transportation and distribution
Relevant, calculated
196959
3rd party fleet, including kilometers driven for Haulage and Distribution. In our internal quarterly reports we estimate the kilometers driven by the 3rd party fleet and we multiply by the GHG factor (emissions based on distance from the calculation tool of WRI-WBCSD GHG Protocol Initiative).
100.00%
Processing of sold products
Not relevant, explanation provided
Our products are sold in a finished, ready-to-consume state. No further processing is required.
Use of sold Relevant, 67014 CO2 (carbonation) in our carbonated soft drinks. In 100.00%
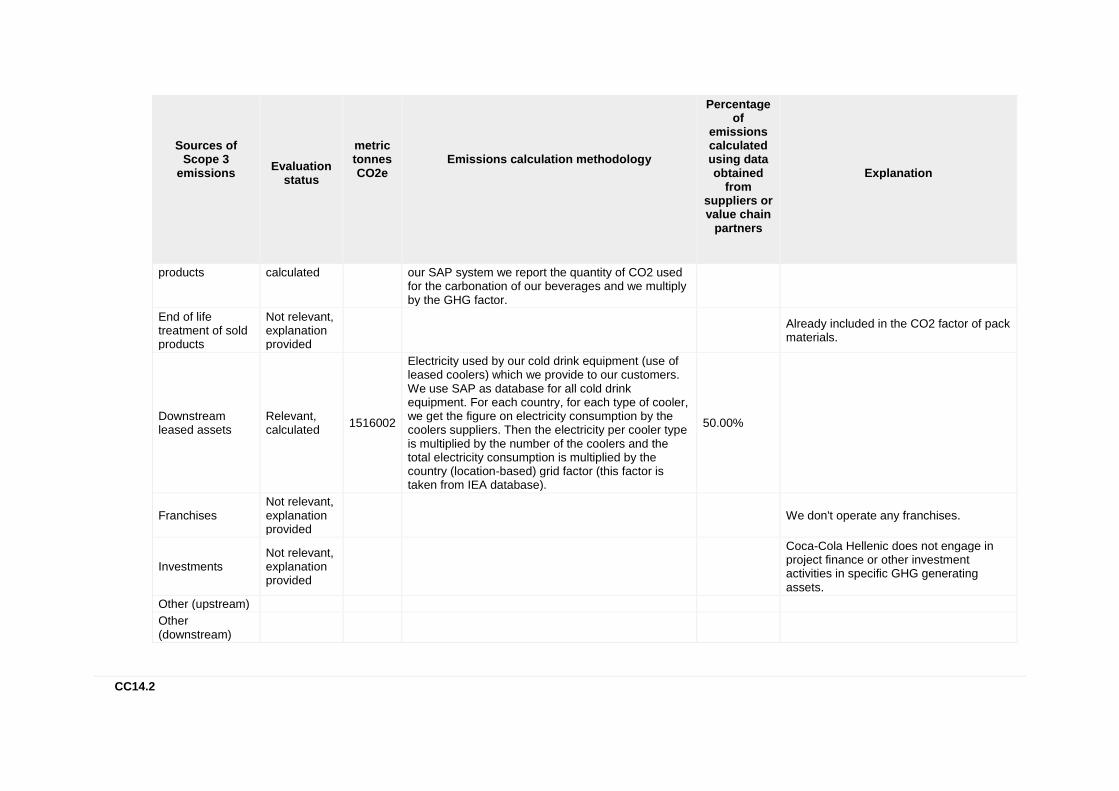
Sources of Scope 3
emissions
Evaluation status
metric tonnes CO2e
Emissions calculation methodology
Percentage of
emissions calculated using data obtained
from suppliers or value chain
partners
Explanation
products calculated our SAP system we report the quantity of CO2 used for the carbonation of our beverages and we multiply by the GHG factor.
End of life treatment of sold products
Not relevant, explanation provided
Already included in the CO2 factor of pack materials.
Downstream leased assets
Relevant, calculated
1516002
Electricity used by our cold drink equipment (use of leased coolers) which we provide to our customers. We use SAP as database for all cold drink equipment. For each country, for each type of cooler, we get the figure on electricity consumption by the coolers suppliers. Then the electricity per cooler type is multiplied by the number of the coolers and the total electricity consumption is multiplied by the country (location-based) grid factor (this factor is taken from IEA database).
50.00%
Franchises Not relevant, explanation provided
We don't operate any franchises.
Investments Not relevant, explanation provided
Coca-Cola Hellenic does not engage in project finance or other investment activities in specific GHG generating assets.
Other (upstream)
Other (downstream)
CC14.2
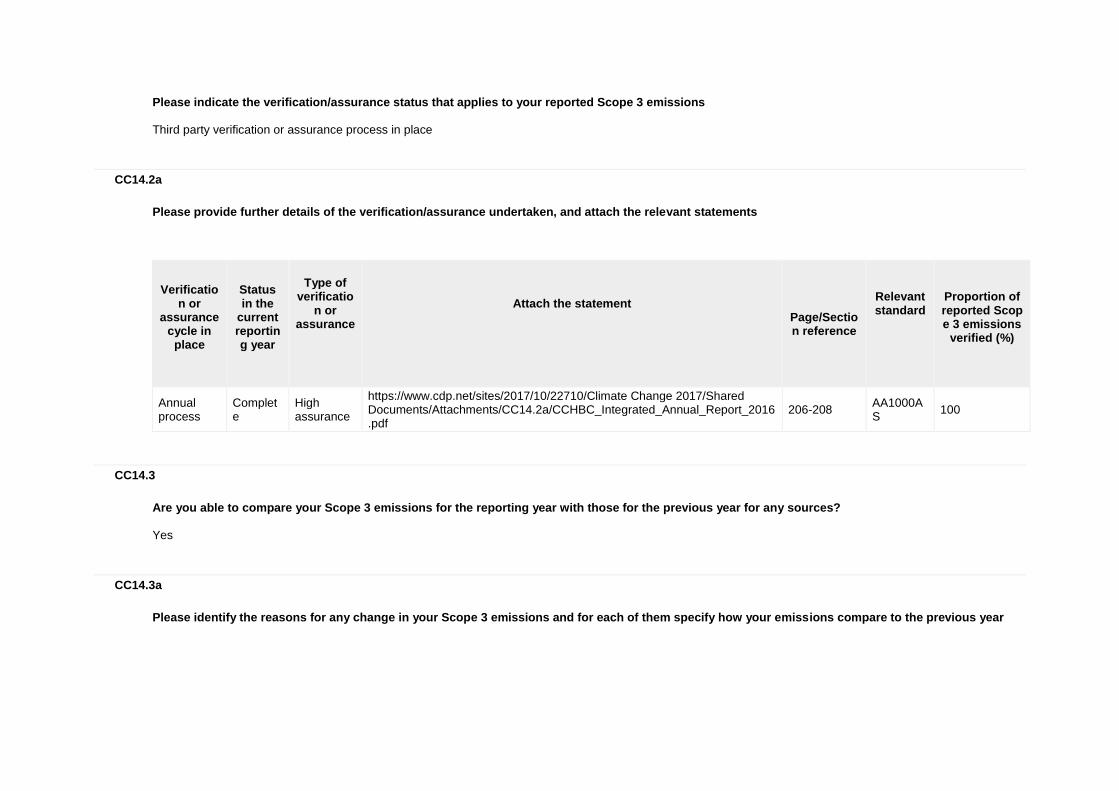
Please indicate the verification/assurance status that applies to your reported Scope 3 emissions Third party verification or assurance process in place
CC14.2a
Please provide further details of the verification/assurance undertaken, and attach the relevant statements
Verificatio
n or assurance
cycle in place
Status in the
current reporting year
Type of
verification or
assurance
Attach the statement
Page/Section reference
Relevant standard
Proportion of reported Scope 3 emissions
verified (%)
Annual process
Complete
High assurance
https://www.cdp.net/sites/2017/10/22710/Climate Change 2017/Shared Documents/Attachments/CC14.2a/CCHBC_Integrated_Annual_Report_2016.pdf
206-208 AA1000AS
100
CC14.3
Are you able to compare your Scope 3 emissions for the reporting year with those for the previous year for any sources? Yes
CC14.3a
Please identify the reasons for any change in your Scope 3 emissions and for each of them specify how your emissions compare to the previous year
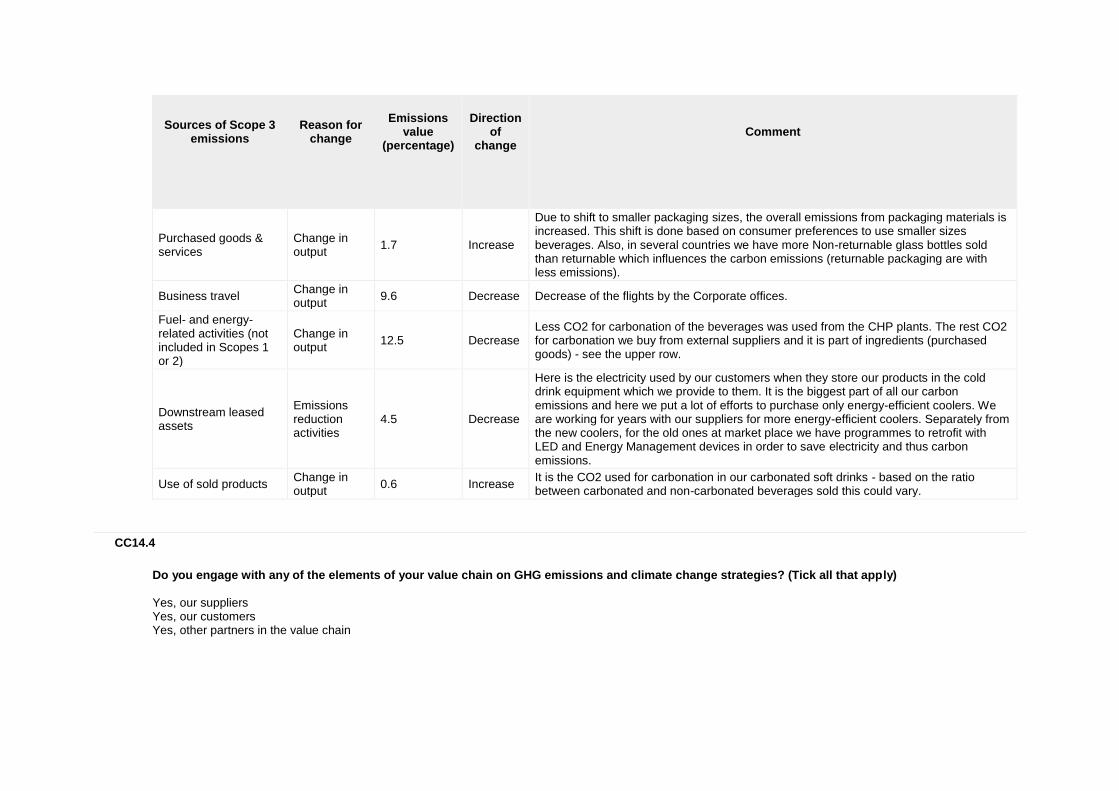
Sources of Scope 3
emissions
Reason for
change
Emissions
value (percentage)
Direction
of change
Comment
Purchased goods & services
Change in output
1.7 Increase
Due to shift to smaller packaging sizes, the overall emissions from packaging materials is increased. This shift is done based on consumer preferences to use smaller sizes beverages. Also, in several countries we have more Non-returnable glass bottles sold than returnable which influences the carbon emissions (returnable packaging are with less emissions).
Business travel Change in output
9.6 Decrease Decrease of the flights by the Corporate offices.
Fuel- and energy-related activities (not included in Scopes 1 or 2)
Change in output
12.5 Decrease Less CO2 for carbonation of the beverages was used from the CHP plants. The rest CO2 for carbonation we buy from external suppliers and it is part of ingredients (purchased goods) - see the upper row.
Downstream leased assets
Emissions reduction activities
4.5 Decrease
Here is the electricity used by our customers when they store our products in the cold drink equipment which we provide to them. It is the biggest part of all our carbon emissions and here we put a lot of efforts to purchase only energy-efficient coolers. We are working for years with our suppliers for more energy-efficient coolers. Separately from the new coolers, for the old ones at market place we have programmes to retrofit with LED and Energy Management devices in order to save electricity and thus carbon emissions.
Use of sold products Change in output
0.6 Increase It is the CO2 used for carbonation in our carbonated soft drinks - based on the ratio between carbonated and non-carbonated beverages sold this could vary.
CC14.4
Do you engage with any of the elements of your value chain on GHG emissions and climate change strategies? (Tick all that apply) Yes, our suppliers Yes, our customers Yes, other partners in the value chain
CC14.4a
Please give details of methods of engagement, your strategy for prioritizing engagements and measures of success 1.Suppliers: i) We require all suppliers to adhere to the ethical standards, human rights practices, environmental& work safety requirements prescribed in our Supplier Guiding Principles (SGP). In 2016 more than 90% of our spend was from suppliers who have accepted our SGP. A prerequisite to become listed as our supplier is to commit to SGP. Sustainable Agriculture Guiding Principles (SAGP) expand on the SGPs and provide guidance to our suppliers of agricultural ingredients. In 2016 we issued publicly our commitment to certify over 95% of our key agricultural ingredients against the Coca Cola Sustainable Agricultural Guiding Principles which include the following requirements: water management, energy management&climate protection, conservation of natural habitats& ecosystems, soil management, crop protection, responsible agrochemical use, biodiversity, harvest&post-harvest handling, reproductive material identity, selection&handling, management systems, transparency, business integrity. ii) We prioritize buying local foodstuffs. We source juice from farms in Greece, Poland, Serbia, Italy, Russia, Hungary, Cyprus, Ukraine; we source locally sugar from our EU countries, Switzerland, Serbia, Russia, Belarus, Ukraine. In Russia, in addition to sugar which in 2016 was 100% sourced from locally grown beet we also focus on local sourcing of fruits for our juice business. In 2016 we started to develop our cooperation with Sucden for growing local tomatoes for tomato juice. Sucden committed to test the project in 2017 on limited volume and to take a decision about growing and processing production volumes in RU after getting test results. Another example is Fanta Orange in Greece which is produced using 100% Greek oranges sourced from the Peloponnese. Other priority for engagement is if the supplier is among the critical suppliers, with significant volume and with big contribution to our procurement spend. iii) We recognize supplier certifications as per international standards (ISO9001,14001,50001, FSSC2200 &OHSAS18001). For agricultural commodities we work with suppliers to achieve international certification (Rain Forrest Alliance, Fair Trade, BonSucro& Sustainable Agriculture Initiative Platform). It is valid for our Group Critical Suppliers. We worked together with suppliers to invest over $100million to increase local production of high-quality beet sugar and in 2016 Russian beet sugar comprised 100% our supply. Locally sourcing is also cornerstone of our JVC programme with one of the EU sugar suppliers, in 2015 we reached 100% local sourcing in Poland & Lithuania. Situation with fresh apples for production in Russia gets better from year to year along with Sveji Veter capabilities development as a producer and it enabled us to develop our cooperation further increasing local apple puree share to 38% of total apple puree demand. Examples of suppliers actions in environmental area: of the total energy consumed by Orange juice supplier Citrosuco during 2016, 51% was derived from renewable energy sources including ethanol, biodiesel, biomass and the renewable portion of purchased electricity. During the 2016 Citrosuco's total volume of water consumed decreased by 17%. In Sweeteners 48% of all raw material used by Tereos, one of our group critical suppliers, are certified as sustainable. 2. Customers: We train our sales force to raise awareness among our customers on the use of our coolers in order to save energy and carbon. Customers are prioritised based on their volume and contribution to NSR. We work with GfK to track the satisfaction levels of our customers and each year we perform customer satisfaction survey, which includes sustainability questions. The sample size in the 2016 GfK was 13'922 of our customers and 1'554 managers in 819 key accounts to give us a benchmark against other FMCG companies. We measure the % of customers who rate us as good and excellent. In the outlet survey of non-alcoholic ready-to-drink suppliers, 19 of our 27 surveyed countries achieved the position of number 1 supplier with the number 1 relationship. In a separate survey for key accounts, GfK reports in 22 countries: we are the number 1 supplier with the number 1 relationship, in 16 countries. 3. Other partners in the value chain: Consumers: We help consumers make informed choices through credible communication. We use relevant contact points such as digital, packaging and point-of-sale to inform consumers of action they can take when using our products and handling used packaging. The metric used is CORA (corporate acceptance). It is measured as part of a consumer survey every month in every country. The CORA score is a direct representation of how consumers& shoppers view The Coca-Cola System on a variety of sub-metrics, such as "Is a company I trust" related to product quality, environmental responsibility& consumer well-being. CORA is reviewed regularly and actions are put in place to address reputation related risks.
CC14.4b
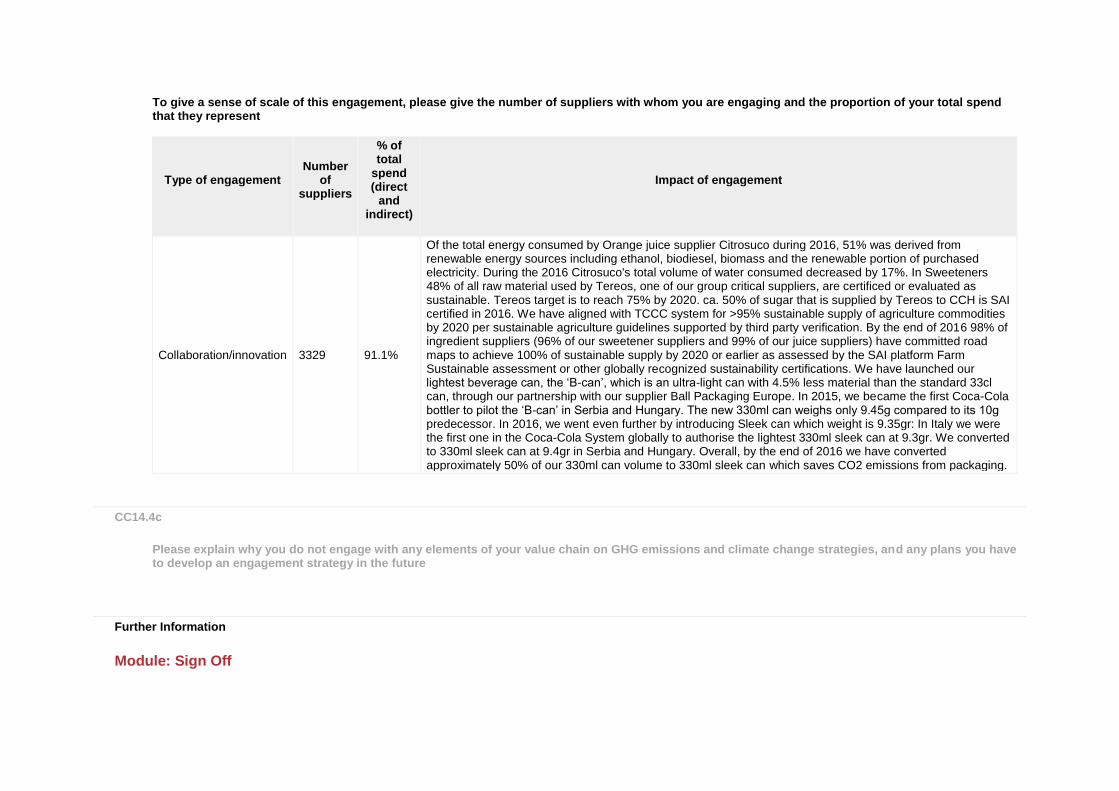
To give a sense of scale of this engagement, please give the number of suppliers with whom you are engaging and the proportion of your total spend that they represent
Type of engagement
Number of
suppliers
% of total
spend (direct
and indirect)
Impact of engagement
Collaboration/innovation 3329 91.1%
Of the total energy consumed by Orange juice supplier Citrosuco during 2016, 51% was derived from renewable energy sources including ethanol, biodiesel, biomass and the renewable portion of purchased electricity. During the 2016 Citrosuco's total volume of water consumed decreased by 17%. In Sweeteners 48% of all raw material used by Tereos, one of our group critical suppliers, are certificed or evaluated as sustainable. Tereos target is to reach 75% by 2020. ca. 50% of sugar that is supplied by Tereos to CCH is SAI certified in 2016. We have aligned with TCCC system for >95% sustainable supply of agriculture commodities by 2020 per sustainable agriculture guidelines supported by third party verification. By the end of 2016 98% of ingredient suppliers (96% of our sweetener suppliers and 99% of our juice suppliers) have committed road maps to achieve 100% of sustainable supply by 2020 or earlier as assessed by the SAI platform Farm Sustainable assessment or other globally recognized sustainability certifications. We have launched our lightest beverage can, the ʻB-canʼ, which is an ultra-light can with 4.5% less material than the standard 33cl can, through our partnership with our supplier Ball Packaging Europe. In 2015, we became the first Coca-Cola bottler to pilot the ʻB-canʼ in Serbia and Hungary. The new 330ml can weighs only 9.45g compared to its 10g predecessor. In 2016, we went even further by introducing Sleek can which weight is 9.35gr: In Italy we were the first one in the Coca-Cola System globally to authorise the lightest 330ml sleek can at 9.3gr. We converted to 330ml sleek can at 9.4gr in Serbia and Hungary. Overall, by the end of 2016 we have converted approximately 50% of our 330ml can volume to 330ml sleek can which saves CO2 emissions from packaging.
CC14.4c
Please explain why you do not engage with any elements of your value chain on GHG emissions and climate change strategies, and any plans you have to develop an engagement strategy in the future
Further Information
Module: Sign Off
Page: CC15. Sign Off
CC15.1
Please provide the following information for the person that has signed off (approved) your CDP climate change response
Name
Job title
Corresponding job category
Michalis Imellos CFO of Coca-Cola HBC AG Chief Financial Officer (CFO)
Further Information
Module: FBT
Page: FBT1. Agriculture
FBT1.1
Are agricultural activities, whether in your direct operations or elsewhere in your value chain, relevant to your climate change disclosure? Yes
FBT1.1a
Please explain why agricultural activities are not relevant to your climate change disclosure
FBT1.2
Are the agricultural activities that you have identified as relevant undertaken on your own farm(s), elsewhere in your value chain, or both? Elsewhere in value chain
FBT1.2a
Please explain why agricultural emissions from your own farms are not relevant We buy from our suppliers the ingredients needed for our production: sugar, sweeteners, juice concentrates. We don't have our own farms and we don’t use anything directly from the farms.
FBT1.3
Do you account for greenhouse gas emissions from agricultural activities undertaken on your own farm(s) as part of the global gross Scope 1 emissions figure reported in CC8.2, and/or the Scope 2 figure reported in CC8.3a of the core climate change questionnaire?
FBT1.3a
Please select the form(s) in which you wish to report the greenhouse gas emissions produced by agricultural activities (agricultural emissions) undertaken on your own farm(s)
FBT1.3b
Please report your total agricultural emissions produced on your own farm(s) and identify any exclusions in the table below
Scope
Agricultural emissions (metric
tonnes CO2e)
Methodology
Exclusions
Explanation
Comment
FBT1.3c
Please report your agricultural emissions produced on your own farm(s), disaggregated by category, and identify any exclusions in the table below
Emissions category
Agricultural
emissions (metric tonnes CO2e)
Methodology
Exclusions
Explanation
Comment
FBT1.3d
Please explain why you do not account for greenhouse gas emissions from agricultural activities undertaken on your own farm(s), and describe any plans for the collection of this data in the future
FBT1.4
Do you implement agricultural management practices on your own farm(s) with a climate change mitigation and/or adaptation benefit?
FBT1.4a
Please identify agricultural management practices undertaken on your own farm(s) with a climate change mitigation and/or adaptation benefit. Complete the table
Activity ID
Agricultural
management practice
Description of agricultural management practice
Climate change related benefit
Comment
FBT1.4b
Does your implementation of these agricultural management practices have other impacts? Complete the table
Activity ID
Impact on yield
Impact on cost
Impact on soil quality
Impact on biodiversity
Impact on water
Other impact
Description of impacts
Comment
FBT1.4c
Do you have any plans to implement agricultural management practices in the future?
FBT1.4d
Please detail your plans to implement agricultural management practices in the future
FBT1.5
Is biogenic carbon pertaining to your own farm(s) relevant to your climate change disclosure?
FBT1.5a
Please report biogenic carbon data pertaining to your own farm(s) in the table below
CO2 flux
Emissions/
Removals (metric tonnes CO2e)
Methodology
Exclusions
Explanation
Comment
FBT1.6
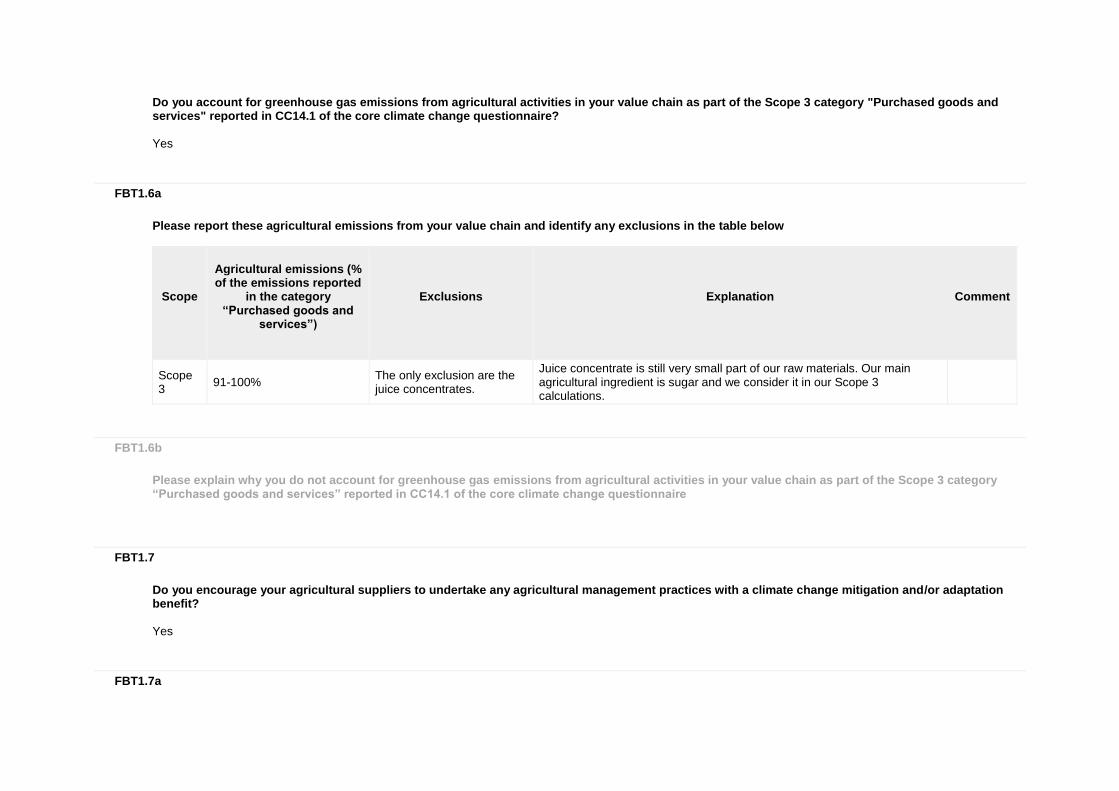
Do you account for greenhouse gas emissions from agricultural activities in your value chain as part of the Scope 3 category "Purchased goods and services" reported in CC14.1 of the core climate change questionnaire? Yes
FBT1.6a
Please report these agricultural emissions from your value chain and identify any exclusions in the table below
Scope
Agricultural emissions (% of the emissions reported
in the category “Purchased goods and
services”)
Exclusions
Explanation
Comment
Scope 3
91-100% The only exclusion are the juice concentrates.
Juice concentrate is still very small part of our raw materials. Our main agricultural ingredient is sugar and we consider it in our Scope 3 calculations.
FBT1.6b
Please explain why you do not account for greenhouse gas emissions from agricultural activities in your value chain as part of the Scope 3 category “Purchased goods and services” reported in CC14.1 of the core climate change questionnaire
FBT1.7
Do you encourage your agricultural suppliers to undertake any agricultural management practices with a climate change mitigation and/or adaptation benefit? Yes
FBT1.7a
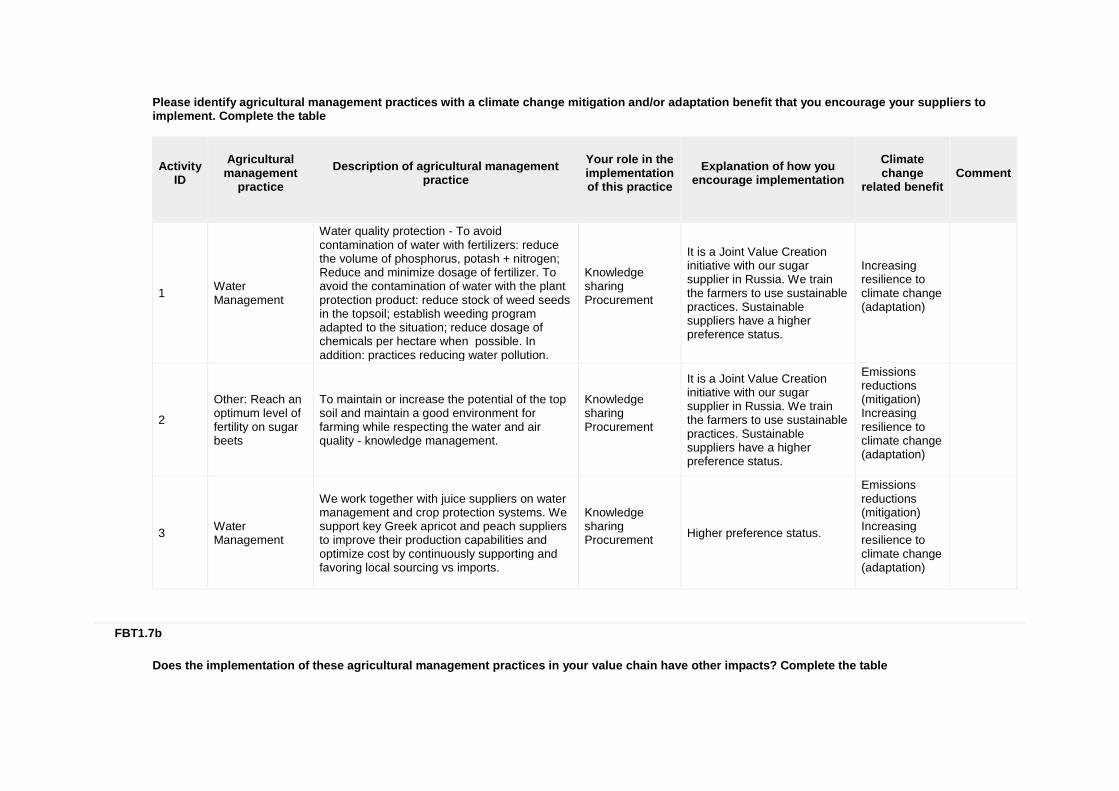
Please identify agricultural management practices with a climate change mitigation and/or adaptation benefit that you encourage your suppliers to implement. Complete the table
Activity ID
Agricultural
management practice
Description of agricultural management practice
Your role in the implementation of this practice
Explanation of how you encourage implementation
Climate change
related benefit
Comment
1 Water Management
Water quality protection - To avoid contamination of water with fertilizers: reduce the volume of phosphorus, potash + nitrogen; Reduce and minimize dosage of fertilizer. To avoid the contamination of water with the plant protection product: reduce stock of weed seeds in the topsoil; establish weeding program adapted to the situation; reduce dosage of chemicals per hectare when possible. In addition: practices reducing water pollution.
Knowledge sharing Procurement
It is a Joint Value Creation initiative with our sugar supplier in Russia. We train the farmers to use sustainable practices. Sustainable suppliers have a higher preference status.
Increasing resilience to climate change (adaptation)
2
Other: Reach an optimum level of fertility on sugar beets
To maintain or increase the potential of the top soil and maintain a good environment for farming while respecting the water and air quality - knowledge management.
Knowledge sharing Procurement
It is a Joint Value Creation initiative with our sugar supplier in Russia. We train the farmers to use sustainable practices. Sustainable suppliers have a higher preference status.
Emissions reductions (mitigation) Increasing resilience to climate change (adaptation)
3 Water Management
We work together with juice suppliers on water management and crop protection systems. We support key Greek apricot and peach suppliers to improve their production capabilities and optimize cost by continuously supporting and favoring local sourcing vs imports.
Knowledge sharing Procurement
Higher preference status.
Emissions reductions (mitigation) Increasing resilience to climate change (adaptation)
FBT1.7b
Does the implementation of these agricultural management practices in your value chain have other impacts? Complete the table
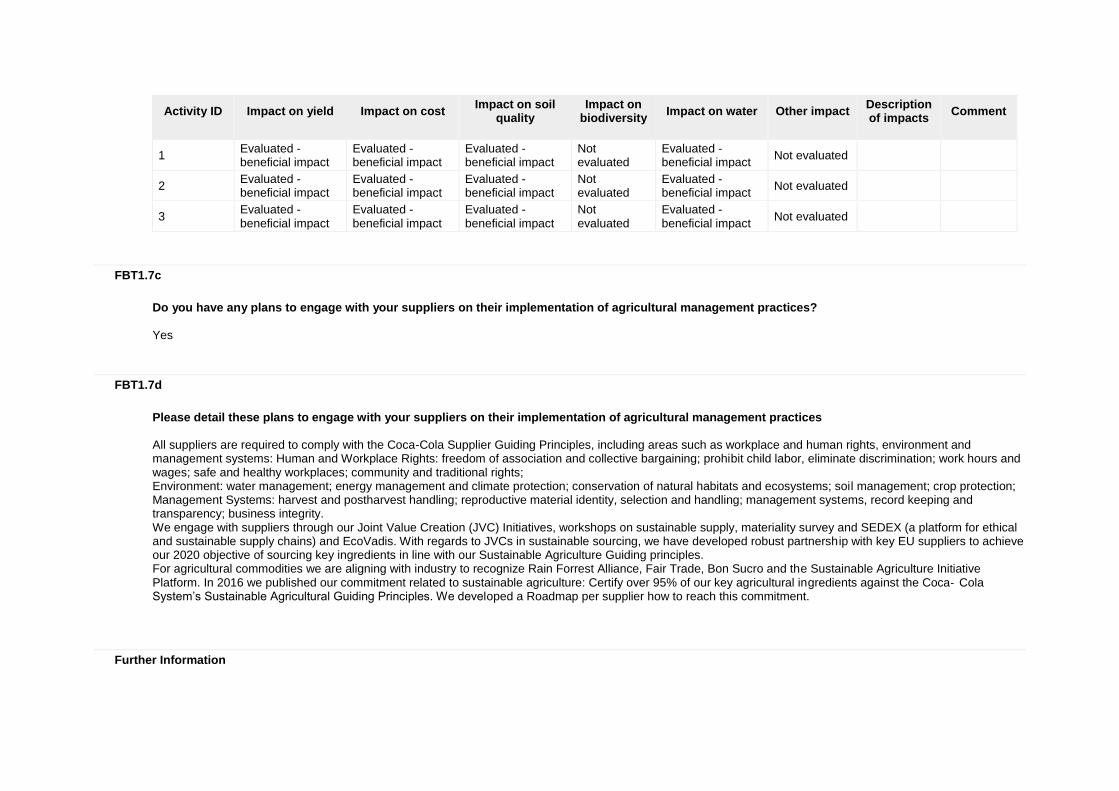
Activity ID
Impact on yield
Impact on cost
Impact on soil quality
Impact on biodiversity
Impact on water
Other impact
Description of impacts
Comment
1 Evaluated - beneficial impact
Evaluated - beneficial impact
Evaluated - beneficial impact
Not evaluated
Evaluated - beneficial impact
Not evaluated
2 Evaluated - beneficial impact
Evaluated - beneficial impact
Evaluated - beneficial impact
Not evaluated
Evaluated - beneficial impact
Not evaluated
3 Evaluated - beneficial impact
Evaluated - beneficial impact
Evaluated - beneficial impact
Not evaluated
Evaluated - beneficial impact
Not evaluated
FBT1.7c
Do you have any plans to engage with your suppliers on their implementation of agricultural management practices? Yes
FBT1.7d
Please detail these plans to engage with your suppliers on their implementation of agricultural management practices All suppliers are required to comply with the Coca-Cola Supplier Guiding Principles, including areas such as workplace and human rights, environment and management systems: Human and Workplace Rights: freedom of association and collective bargaining; prohibit child labor, eliminate discrimination; work hours and wages; safe and healthy workplaces; community and traditional rights; Environment: water management; energy management and climate protection; conservation of natural habitats and ecosystems; soil management; crop protection; Management Systems: harvest and postharvest handling; reproductive material identity, selection and handling; management systems, record keeping and transparency; business integrity. We engage with suppliers through our Joint Value Creation (JVC) Initiatives, workshops on sustainable supply, materiality survey and SEDEX (a platform for ethical and sustainable supply chains) and EcoVadis. With regards to JVCs in sustainable sourcing, we have developed robust partnership with key EU suppliers to achieve our 2020 objective of sourcing key ingredients in line with our Sustainable Agriculture Guiding principles. For agricultural commodities we are aligning with industry to recognize Rain Forrest Alliance, Fair Trade, Bon Sucro and the Sustainable Agriculture Initiative Platform. In 2016 we published our commitment related to sustainable agriculture: Certify over 95% of our key agricultural ingredients against the Coca‑ Cola System’s Sustainable Agricultural Guiding Principles. We developed a Roadmap per supplier how to reach this commitment.
Further Information
Page: FBT2. Processing
FBT2.1
Are processing activities, whether in your direct operations or elsewhere in your value chain, relevant to your climate change disclosure? No
FBT2.1a
Please explain why processing activities are not relevant to your climate change disclosure We do not transform raw agricultural inputs into final products ready for human consumption. The emissions from processing activities are not in our direct operations and account for scope 3 emissions in our carbon footprint (coming from ingredients: sugar, juice concentrate, sweeteners and from Tetrapak packaging material for our juice beverages).
FBT2.2
Are the processing activities that you have identified as relevant undertaken in your direct operations, elsewhere in your value chain, or both?
FBT2.2a
Please explain why emissions from processing activities in your direct operations are not relevant
FBT2.3
Do you account for emissions from processing activities in your direct operations as part of the global gross Scope 1 emissions figure reported in CC8.2 and/or the Scope 2 figure reported in CC8.3a of the core climate change questionnaire?
FBT2.3a
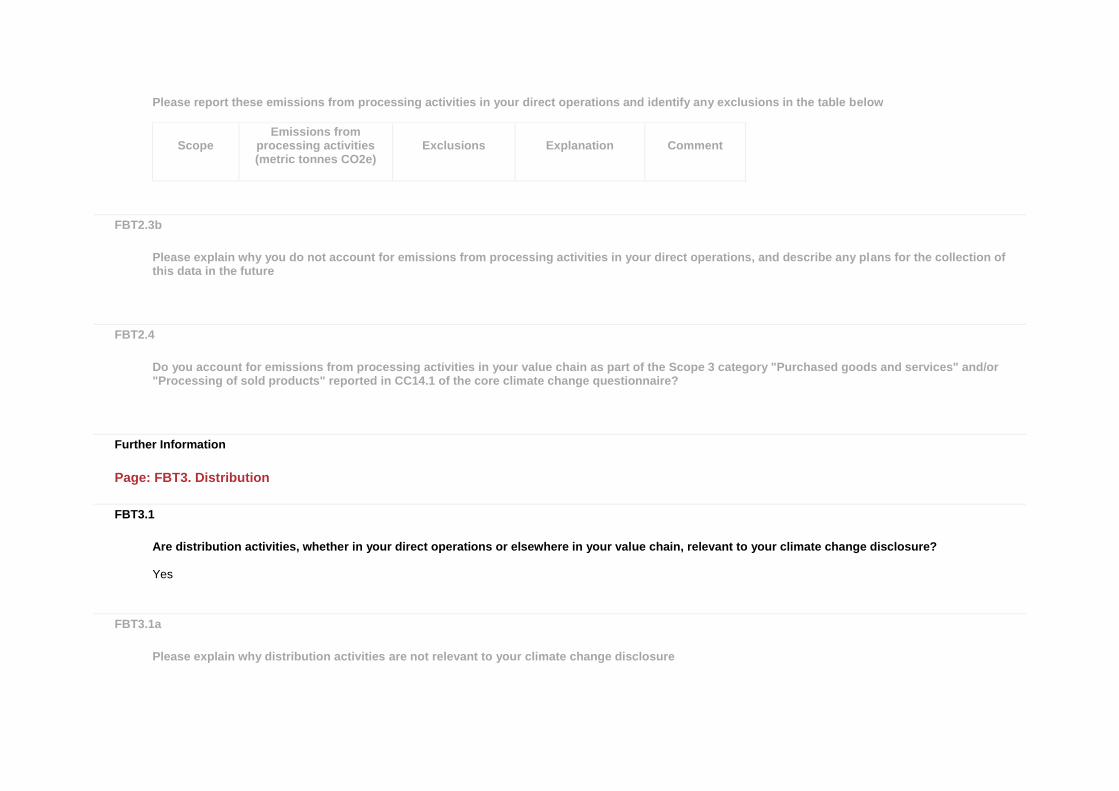
Please report these emissions from processing activities in your direct operations and identify any exclusions in the table below
Scope
Emissions from processing activities (metric tonnes CO2e)
Exclusions
Explanation
Comment
FBT2.3b
Please explain why you do not account for emissions from processing activities in your direct operations, and describe any plans for the collection of this data in the future
FBT2.4
Do you account for emissions from processing activities in your value chain as part of the Scope 3 category "Purchased goods and services" and/or "Processing of sold products" reported in CC14.1 of the core climate change questionnaire?
Further Information
Page: FBT3. Distribution
FBT3.1
Are distribution activities, whether in your direct operations or elsewhere in your value chain, relevant to your climate change disclosure? Yes
FBT3.1a
Please explain why distribution activities are not relevant to your climate change disclosure
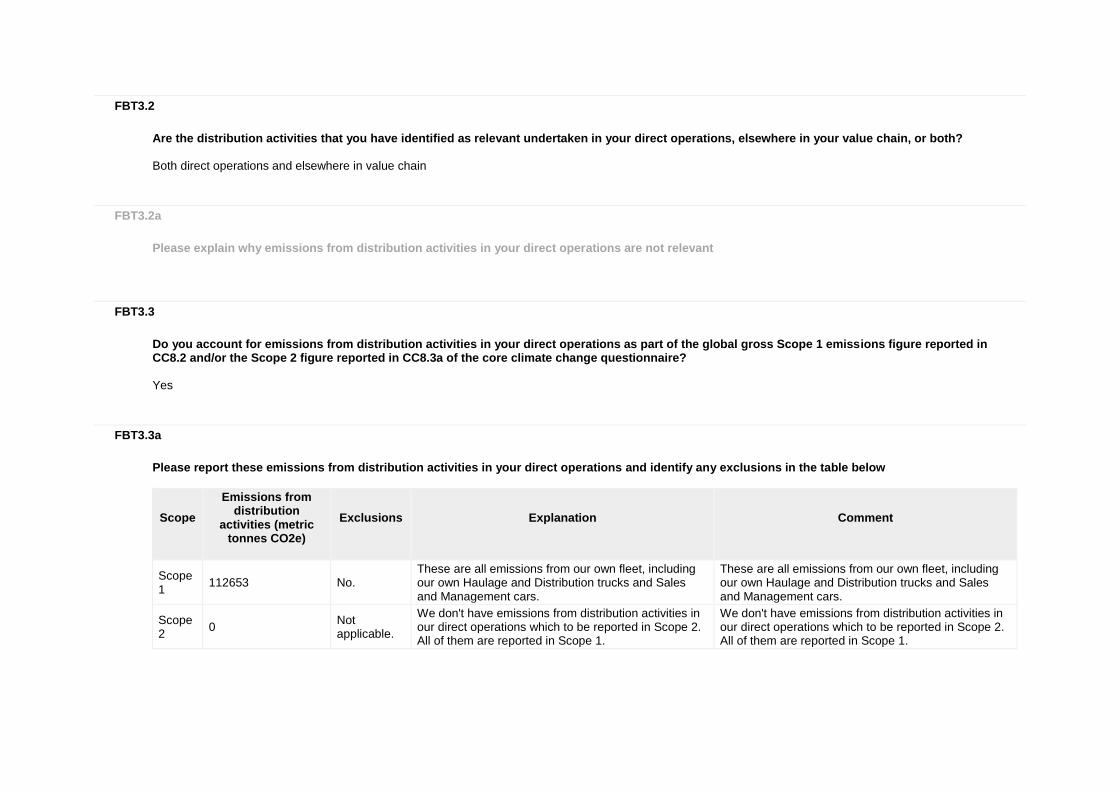
FBT3.2
Are the distribution activities that you have identified as relevant undertaken in your direct operations, elsewhere in your value chain, or both? Both direct operations and elsewhere in value chain
FBT3.2a
Please explain why emissions from distribution activities in your direct operations are not relevant
FBT3.3
Do you account for emissions from distribution activities in your direct operations as part of the global gross Scope 1 emissions figure reported in CC8.2 and/or the Scope 2 figure reported in CC8.3a of the core climate change questionnaire? Yes
FBT3.3a
Please report these emissions from distribution activities in your direct operations and identify any exclusions in the table below
Scope
Emissions from distribution
activities (metric tonnes CO2e)
Exclusions
Explanation
Comment
Scope 1
112653 No. These are all emissions from our own fleet, including our own Haulage and Distribution trucks and Sales and Management cars.
These are all emissions from our own fleet, including our own Haulage and Distribution trucks and Sales and Management cars.
Scope 2
0 Not applicable.
We don't have emissions from distribution activities in our direct operations which to be reported in Scope 2. All of them are reported in Scope 1.
We don't have emissions from distribution activities in our direct operations which to be reported in Scope 2. All of them are reported in Scope 1.
FBT3.3b
Please explain why you do not account for emissions from distribution activities in your direct operations, and describe any plans for the collection of this data in the future
FBT3.4
Do you account for emissions from distribution activities in your value chain as part of the Scope 3 category "Upstream transportation and distribution" and/or "Downstream transportation and distribution" in CC14.1 of the core climate change questionnaire? Yes
Further Information
Third party Fleet that we use for transport and distribution of our products to the customers is in Scope 3 emissions and for 2016 those emissions are 196'959 tonnes of CO2.
Page: FBT4. Consumption
FBT4.1
Are emissions from the consumption of your products relevant to your climate change disclosure? Yes
FBT4.1b
Please explain why emissions from the consumption of your products are not relevant to your climate change disclosure
FBT4.1a
Do you account for emissions from the consumption of your products as part of the Scope 3 category "Use of sold products" and/or "End of life treatment of sold products" in CC14.1 of the core climate change questionnaire? Yes
Further Information
Use of sold products: CO2 that we use for carbonation in our carbonated soft drinks. For 2016 these emissions are 67'014 tonnes CO2. CDP 2017 Climate Change 2017 Information Request