Embed Size (px)
Citation preview
NN.. CCHHRRYYSSSSOOCCHHOOIIDDIISS SSTTOOCCKK BBRROOKKEERRAAGGEE IINNVVEESSTTMMEENNTT SSEERRVVIICCEESS SS..AA..
Equity Research Department
EQU
ITY
RES
EAR
CH
(FU
ND
AM
ENTA
LS)
COCA COLA HBC
Outlook:
We upgrade our Coca Cola HBC Fair
Estimated price to 22,00Euros/Share on the
back of the published FY16 results.
FY16 results showed that the company
succeeded in obtaining an important total
revenue growth -excluding FX fluctuations-
while generating substantial operating
earnings confirming its efforts towards
operating efficiency, a fact that further
enhanced net profitability.
We retain our investment thesis as FV as
we incorporate the evidenced efforts
towards operating efficiency, the organic
growth in terms of revenues excluding FX
fluctuations and the company’s ability to
generate and sustain a solid FCFF.
Date: 21/02/17
FAIR ESTIMATED PRICE: 22.00Euros/Share
Investment Thesis: FV
Key Statistics:
Valuation Date 21/02/17
Share Price 23,01
Price High 52 week 23,09
Price Low 52 week 16,79
Current num. of shares 116.915.862
P/E (E) 25
Market Cap. 2.690.233.985
EPS (E) 0,93
DPS(E) 0,44
*Closing Price as 20/02/2017
Analyst: Dimitrios Villiotis Tel: +30 210 3213913 mail: [email protected] web: www.chryssochoidis.gr
COCA COLA HBC-GROWTH AND OPERATING EFFICIENCY
Coca Cola HBC’s FY16 results were characterized by the growth in total revenues
excluding FX impact, the sharp reduction of operating expenses reaching an eight year
low level and the FX volatility that affects the overall results.
Specifically, the unit cases volumes for the Emerging and Developing markets sector
increased with a more favorable package mix as evidenced by the increase in revenue
per case (excluding FX) but the substantial volatility of currency led to lower revenue
per case and decreased y-o-y revenues. In the Established market sector the unit cases
sold were 2.43% lower than the previous year reflecting the weaker sales in Water and
Sparkling Beverages. Despite that, the sector’s revenues per case were impacted from
the volatility of GBP during the period. In terms of operating performance the company
reaps the profits of the efforts towards operating efficiency as the company had the
lower operating expenses since FY08, a fact that enhances the FCFF and the
fundamental value of the company in combination with the Net profitability.
In our valuation model we apply a more normalized projected revenue growth (1% from
2% previously) as we take into consideration both the substantial impact of the
currencies and the macro environment of the regions that contribute to the overall
revenues and facing several challenges (Russia, Nigeria) and the evidenced softer
revenues in the Established markets region. We also incorporate the more efficient
operating performance which is the single most important factor for the generation of a
c.450mn. FCFF per annum especially in the case of a weaker overall revenues
environment.
In closing remarks we consider Coca Cola HBC’s as the most valuable pick among the
Hellenic Equities universe, we are satisfied from the share’s operating performance and
we consider it as an attractive investment case among its European peers as it is traded
10.35x in EV/EBITDA terms below the European average of 12.15x and 1.18x in
Price/Sales ratio vs the European Price/Sales average ratio of 2.63x.
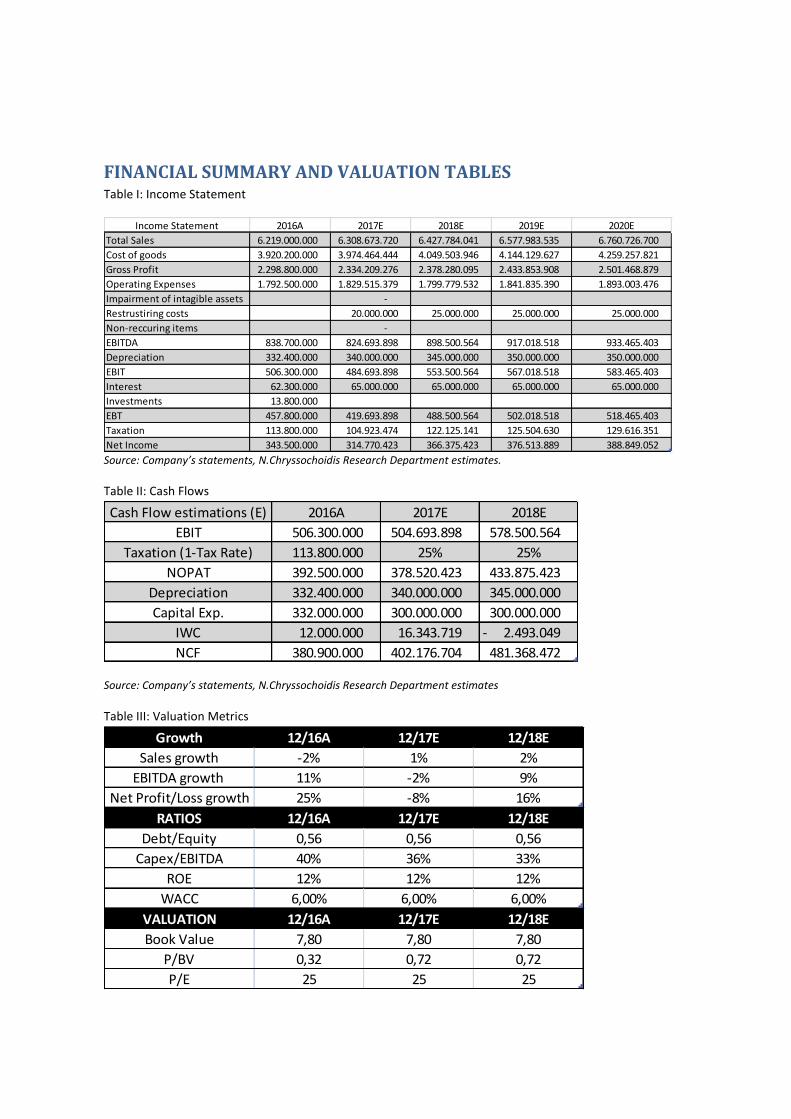
FINANCIAL SUMMARY AND VALUATION TABLES Table I: Income Statement
Income Statement 2016A 2017E 2018E 2019E 2020E
Total Sales 6.219.000.000 6.308.673.720 6.427.784.041 6.577.983.535 6.760.726.700
Cost of goods 3.920.200.000 3.974.464.444 4.049.503.946 4.144.129.627 4.259.257.821
Gross Profit 2.298.800.000 2.334.209.276 2.378.280.095 2.433.853.908 2.501.468.879
Operating Expenses 1.792.500.000 1.829.515.379 1.799.779.532 1.841.835.390 1.893.003.476
Impairment of intagible assets -
Restrustiring costs 20.000.000 25.000.000 25.000.000 25.000.000
Non-reccuring items -
EBITDA 838.700.000 824.693.898 898.500.564 917.018.518 933.465.403
Depreciation 332.400.000 340.000.000 345.000.000 350.000.000 350.000.000
EBIT 506.300.000 484.693.898 553.500.564 567.018.518 583.465.403
Interest 62.300.000 65.000.000 65.000.000 65.000.000 65.000.000
Investments 13.800.000
EBT 457.800.000 419.693.898 488.500.564 502.018.518 518.465.403
Taxation 113.800.000 104.923.474 122.125.141 125.504.630 129.616.351
Net Income 343.500.000 314.770.423 366.375.423 376.513.889 388.849.052
Source: Company’s statements, N.Chryssochoidis Research Department estimates.
Table II: Cash Flows
Cash Flow estimations (Ε) 2016A 2017E 2018E
EBIT 506.300.000 504.693.898 578.500.564
Taxation (1-Tax Rate) 113.800.000 25% 25%
NOPAT 392.500.000 378.520.423 433.875.423
Depreciation 332.400.000 340.000.000 345.000.000
Capital Exp. 332.000.000 300.000.000 300.000.000
IWC 12.000.000 16.343.719 2.493.049 -
NCF 380.900.000 402.176.704 481.368.472
Source: Company’s statements, N.Chryssochoidis Research Department estimates
Table III: Valuation Metrics
Growth 12/16A 12/17E 12/18E
Sales growth -2% 1% 2%
EBITDA growth 11% -2% 9%
Net Profit/Loss growth 25% -8% 16%
RATIOS 12/16A 12/17E 12/18Ε
Debt/Equity 0,56 0,56 0,56
Capex/EBITDA 40% 36% 33%
ROE 12% 12% 12%
WACC 6,00% 6,00% 6,00%
VALUATION 12/16A 12/17E 12/18Ε
Book Value 7,80 7,80 7,80
P/BV 0,32 0,72 0,72
P/E 25 25 25
Ρήηπα Πεπιοπιζμού Εςθύνηρ: Απαγνξεύεηαη ε αλαδεκνζίεπζε ηνπ παξόληνο ρσξίο ηελ άδεηα ηεο Ν. ΥΡΤΟΥΟΪΔΗ ΥΡΗΜΑΣΙΣΗΡΙΑΚΗ Α.Ε.Π.Ε.Τ. Οη απόςεηο πνπ πεξηέρνληαη βαζίδνληαη ζε πεγέο πνπ ζεσξνύληαη αμηόπηζηεο, σζηόζν ε Ν. ΥΡΤΟΥΟΪΔΗ ΥΡΗΜΑΣΙΣΗΡΙΑΚΗ Α.Ε.Π.Ε.Τ. δελ επζύλεηαη γηα ηελ εγθπξόηεηα, νξζόηεηα ή αμηνπηζηία ηνπο θαη δηαηεξεί ην δηθαίσκα αιιαγήο ηνπο ρσξίο πξόηεξε εηδνπνίεζε. Σόζν ε Ν. ΥΡΤΟΥΟΪΔΗ ΥΡΗΜΑΣΙΣΗΡΙΑΚΗ Α.Ε.Π.Ε.Τ. όζν θαη νη δηεπζύλνληεο θαη ππάιιεινη ηεο δελ θέξνπλ νπδεκία επζύλε γηα νπνηαδήπνηε ζπλέπεηα ησλ πιεξνθνξηώλ απηώλ. Το παπόν δεν αποηελεί πποζθοπά, πποηποπή ή επενδςηική ππόηαζη για αγοπά ή πώληζη μεηοσών ή άλλων κινηηών αξιών. Οι επενδύζειρ πος αναθέπονηαι ενδέσεηαι να µην είναι οι ενδεδειγμένερ για οπιζμένοςρ επενδςηέρ.
Disclaimer: This report has been issued by N. CHRYSSOCHOIDIS STOCK BROKERAGE I.S.S.A., a member of the Athens Stock Exchange, and may not be reproduced in any manner or provided to any other persons. Each person that receives a copy by
acceptance thereof represents and agrees that it will not distribute or provide it to any other person. The information contained herein has been obtained from sources believed to be reliable but has not been verified by N. CHRYSSOCHOIDIS
STOCK BROKERAGE I.S.S.A. The opinions expressed herein may not necessarily coincide with those of any member of N. CHRYSSOCHOIDIS STOCK BROKERAGE I.S.S.A. No representation or warranty (express or implied) is made as to
the accuracy, completeness, correctness, timeliness or fairness of the information or opinions herein, all of which are subject to change without notice. No responsibility of liability whatsoever or howsoever arising is accepted in relation to the
contents hereof by N. CHRYSSOCHOIDIS STOCK BROKERAGE I.S.S.A. or any of its directors, officers or employees. This report is not an offer to buy or sell or a solicitation of an offer to buy or sell securities mentioned herein. N.
CHRYSSOCHOIDIS STOCK BROKERAGE I.S.S.A. may effect transactions in or perform or seek to perform brokerage services for companies covered. The investments discussed in this report may be unsuitable for investors, depending on their
specific investment objectives and financial position.
Σημειώζεις/Notes Οδηγός Συζηάζεων/Ratings P: Τρέτοσζα Τιμή Market Price
MCAP: Κεθαλαιοποίηζη Capitalization UV Φαμηλή Αποηίμηζη/ Φαμηλός Κίνδσνος Underpriced/ Small Risk
EPS: Καθαρά Κέρδη Ανά Μεηοτή Earnings per Share
UV1
Φαμηλή Αποηίμηζη/ Κίνδσνος
Stock Price < 20% of Fair
Underpriced/ Risk
Stock Price < 10% of Fair
P/E: Λόγος Τιμής προς Κέρδη Price/Earnings Ratio FV Σωζηή Αποηίμηζη/ Φαμηλός Κίνδσνος Fairly Priced/ Small Risk
10%<Stock Price<10%
P/S: Λόγος Τιμής προς Πωλήζεις Price/Sales Ratio OV1 Σωζηή Αποηίμηζη/ Κίνδσνος Fairly Priced/ Risk
Stock Price >10% of Fair
D/A: Σσνολικός Δανειζμός προς Παθηηικό Total Debt/Assets
Ratio OV Υπερηιμημένη Μεηοτή Overvalued
Stock Price >20% of Fair
DY: Απόδοζη Μερίζμαηος Dividend Yield N/R Μη Αποηιμημένη Μεηοτή Not Rated
ROE: Απόδοζη Ιδίων Κεθαλαίων Return on Equity
FV: Τιμή Σωζηής Αποηίμηζης Fair Value Price