Embed Size (px)
Citation preview
Coca-Cola HBC 2013 Global Reporting Initiative Communication on Progress (GRI COP) Report
2013 This report complements the Coca-Cola HBC 2013 Annual Integrated Report and provides more detail to internal and external stakeholders on the sustainability-related policies relevant programmes and overall performance of the company in the area of sustainable development. The report follows the guidance of the Global Reporting Initiative (GRI) 3.1 guidelines. Together with the Annual Integrated Report, this report also serves as our Communication on Progress (COP) to the United Nations Global Compact. For an overview of our financial and non-financial performance, please read the 2013 Annual Integrated Report.
For detailed financial information, please refer to the Financial Statement and the Annual Report on Form 20-F.
All of these reports are publicly available at our corporate website: http://www.coca-colahellenic.com/investorrelations/annualreports
1
CONTENTS SECTION A ______________________________________________________________________ 5
Profile and Reporting _____________________________________________________________ 5
1. Strategy and Analysis _______________________________________________________ 5
1.1 Statement from the most senior decision-makers _____________________________ 5
1.2 Description of key impacts, risks and opportunities ____________________________ 5
2. Organisational profile ______________________________________________________ 6
2.1 Name of the organisation ________________________________________________ 6
2.2 Primary brands, products and services ______________________________________ 6
2.3 Operational structure of the organisation ___________________________________ 6
2.4 Location of organisation’s headquarters ____________________________________ 7
2.5 Geographical reach _____________________________________________________ 7
2.6 Nature of ownership and legal form ________________________________________ 7
2.7 Markets served (including geographic breakdown, sectors served, and types of customers/beneficiaries) ________________________________________________ 7
2.8 Scale of the reporting organisation ________________________________________ 8
2.9 Significant changes during reporting period regarding size, structure or ownership including location of or changes in operations, facility openings, closings and expansions __________________________________________________________ 10
2.10 Awards received in the reporting period ___________________________________ 10
3. Report parameters ________________________________________________________ 10
3.1 Reporting period for information provided _________________________________ 10
3.2 & 3.3 Previous reports and reporting cycles _________________________________ 10
3.3 Contact point for questions regarding the report or its contents_________________ 10
3.4 Process for defining report content _______________________________________ 10
3.5 Boundary of the report _________________________________________________ 11
3.6 State any specific limitations on the scope or boundary of the report_____________ 11
3.7 Basis for reporting on joint ventures, subsidiaries, leased facilities, outsourced operations, and other entities that can significantly affect comparability from period to period and/or between organisations _____________________________________ 11
3.8 Data measurement techniques and the bases of calculations, including assumptions and techniques underlying estimations applied to the compilation of the Indicators and other information in the report __________________________________________ 11
3.9 Explanation of the effect of any re-statements of information provided in earlier reports and reasons for re-statement (e.g. mergers/ acquisitions, change of base years/periods, nature of business, measurement methods) ________________________________ 12
2
3.10 Significant changes from previous reporting periods in the scope, boundary, or measurement methods applied in the report ________________________________ 12
3.11 Content Index ________________________________________________________ 12
3.12 Assurance ___________________________________________________________ 12
4. Governance, Commitments and Engagement __________________________________ 12
4.1 - 4.10 Governance _____________________________________________________ 12
4.2 Explanation of whether and how the precautionary approach or principle is addressed by the organisation. ___________________________________________________ 13
4.3 Externally developed economic, environmental, and social charters, principles, or other initiatives to which the organisation subscribes or endorses. ___________________ 13
4.4 Memberships in associations (such as industry associations) and/or national/international advocacy organisations in which the organisation: _________ 13
4.5 List of stakeholder groups engaged by the organisation. _______________________ 13
4.6 Basis for identification and selection of stakeholders with whom to engage. _______ 14
4.7 Approaches to stakeholder engagement, including frequency of engagement by type and by stakeholder group. ______________________________________________ 14
4.8 Key topics and concerns raised through stakeholder engagement, and how the organisation has responded to those topics and concerns, including through its reporting. ___________________________________________________________ 14
4.9 Disclosures of Management Approach _____________________________________ 14
5. ECONOMIC ASPECTS _______________________________________________________ 15
6. ENVIRONMENTAL ASPECTS _________________________________________________ 16
6.1 Environmental Management ____________________________________________ 16
6.2 Top material issues: Key strategies, procedures and successes __________________ 17
6.2.1 WATER __________________________________________________________ 17
6.2.2 ENERGY AND CLIMATE _____________________________________________ 19
6.2.3 PACKAGING ______________________________________________________ 21
7. SOCIAL ASPECTS __________________________________________________________ 23
7.1 Labour Practices & Decent Work _________________________________________ 23
7.2 Human Rights ________________________________________________________ 24
7.3 Society ______________________________________________________________ 25
7.4 Product Responsibility _________________________________________________ 26
7.5 Sourcing ____________________________________________________________ 27
7.6 Animal Welfare _______________________________________________________ 29
8. GRI INDICATORS __________________________________________________________ 30
8.1 GRI Standard Disclosures _______________________________________________ 30
8.2 Environmental Data Table _______________________________________________ 38
3
8.3 Social Data Table ______________________________________________________ 41
SECTION B _____________________________________________________________________ 42
9. UN Global Compact - Communicating our Progress ______________________________ 42
9.1 GC Advanced Level ____________________________________________________ 42
9.1.1 Mainstreaming into corporate functions and business units ________________ 42
9.1.2 Value chain implementation _________________________________________ 42
9.1.3 Robust commitments, strategies or policies in the area of human rights ______ 42
9.1.4 Effective management systems to integrate the human rights principles ______ 42
9.1.5 Effective monitoring and evaluation mechanisms of human rights integration _ 42
9.1.6 Robust commitments, strategies or policies in the area of labour ___________ 43
9.1.7 Effective management systems to integrate the labour principles ___________ 43
9.1.8 Effective monitoring and evaluation mechanisms of labour principles integration 43
9.1.9 Robust commitments, strategies or policies in the area of environmental stewardship ______________________________________________________ 43
9.1.10 Effective management systems to integrate the environmental principles ____ 43
9.1.11 Effective monitoring & evaluation mechanisms for environmental stewardship 43
9.1.12 Robust commitments, strategies or policies in the area of anti-corruption ____ 44
9.1.13 Effective management systems to integrate the anti-corruption principle _____ 44
9.1.14 Effective monitoring and evaluation mechanisms for the integration of anti-corruption ________________________________________________________ 44
9.1.15 Core business contributions to UN goals and issues ______________________ 44
9.1.16 Strategic social investments and philanthropy ___________________________ 44
9.1.17 Advocacy and public policy engagement _______________________________ 45
9.1.18 Partnerships and collective action ____________________________________ 45
9.1.19 CEO commitment and leadership _____________________________________ 45
9.1.20 Board adoption and oversight _______________________________________ 45
9.1.21 Stakeholder engagement ___________________________________________ 45
9.2 CEO Water Mandate __________________________________________________ 46
9.3 Caring for Climate _____________________________________________________ 47
APPENDIX _____________________________________________________________________ 49
10. Materiality Matrix ________________________________________________________ 49
11. LBG Report ______________________________________________________________ 51
12. Code of Business Conduct – report on breaches by violation type __________________ 52
4
SECTION A Profile and Reporting 1. Strategy and Analysis
1.1 Statement from the most senior decision-makers Please see the letters from our Chairman and CEO in the 2013 Integrated Report (pages 6 and 8 respectively; report available on our corporate website: http://www.coca-colahellenic.com/investorrelations/annualreports).
1.2 Description of key impacts, risks and opportunities Given the scale and footprint of our business, we have considerable impacts - social, economic and environmental - and these reach far into our value chain. We endeavour to show these in our business model in the Annual Integrated Report. Material issues are the economic, environmental and social issues which could affect our ability to create value over the short, medium and long term and are discussed in the Risks and Opportunities section in the Annual Integrated Report (AIR). We prioritise issues based on their relative importance and magnitude to our business and society at large. This systematic materiality process helps us to determine on what issues to focus our resources - as well as the issues and information to include in our reporting. Our materiality matrix for 2013 can be found in the Appendix section of this report. Coca-Cola HBC has adopted a strategic Enterprise Wide Risk Management (EWRM) approach, which provides a fully integrated common risk management framework for the identification, assessment, management and escalation of risks and opportunities. The primary aims of this framework are to minimise our exposure to unforeseen events and to provide certainty to management of identified risks, creating a stable environment within which we can deliver our objectives. Outputs from this process are embedded in business-planning activities. In 2013, Coca-Cola HBC re-assessed its risk profile in the context of the Company’s incorporation in Switzerland and premium listing on the London Stock Exchange. We considered the possible impact to enhance community trust and to address concerns about obesity and the risks the possible impact of regulatory and rule changes in both jurisdictions. In addition, we continued to monitor developments in tax increases because of the potential impact on both the cost of our products and disposable incomes. We also introduced a specific cross-functional inter-Company programme to further enhance community trust as well as a means of addressing rising concerns about obesity and the risks this poses to the overall NARTD category. Macroeconomic risks relate to the external environment and the markets in which we operate and over which we have little control. Our three most significant risks in 2013 were the continuing decline in consumer confidence and disposable incomes as well as foreign exchange volatility -- specific risks included taxation, consumer health and climate change. Operational risks relate specifically to how we run our business and the decisions we take to respond to conditions in our markets. These include safety, people, quality and supply chain.
5
2. Organisational profile 2.1 Name of the organisation Previously Coca-Cola Hellenic Bottling Company S.A., our Company is now known as Coca-Cola Hellenic Bottling Company or Coca-Cola HBC AG. 2.2 Primary brands, products and services We offer a wide range of non-alcoholic beverages: natural mineral waters, juices and juice drinks, ready- to-drink coffees and ice teas, sports and energy drinks in addition to our core sparkling soft drinks. Our core brands include the best known beverage brands in the world: Coca-Cola, Coca-Cola Light (diet Coke), Coca-Cola Zero, Fanta and Sprite. This portfolio of global brands is complemented by leading national brands designed to meet local tastes. We are the world's second largest bottler of products of The Coca-Cola Company. We also manufacture and distribute our own water and juice brands, including Amita, Avra, Deep RiverRock and Fruice, as well as distributing licensed iced tea and energy brands, such as Nestea and Monster. We are the leader in volume share in sparkling beverages in 23 out of our 24 markets as measured by global market research firm Nielsen. In 2013, we gained or maintained volume and value share in sparkling beverages in 20 out these 24 markets. 2.3 Operational structure of the organisation Coca-Cola HBC is part of The Coca-Cola System, the most extensive beverage distribution system in the world. Together with The Coca-Cola Company, this system includes more than 300 bottlers -- including CCHBC -- and serves more than 200 countries around the world. The Coca-Cola Company owns the brands and manufactures and sells concentrates, beverage bases and syrups to Coca-Cola HBC and other bottling partners. In turn, we manufacture, package, merchandise and distribute the finished beverages to customers. Coca-Cola HBC operates across 28 countries with diverse cultures and geographies and serves a population of approximately 585 million people. The Company owns and operates 68 bottling plants as well as 263 warehouses and distribution centres.
6
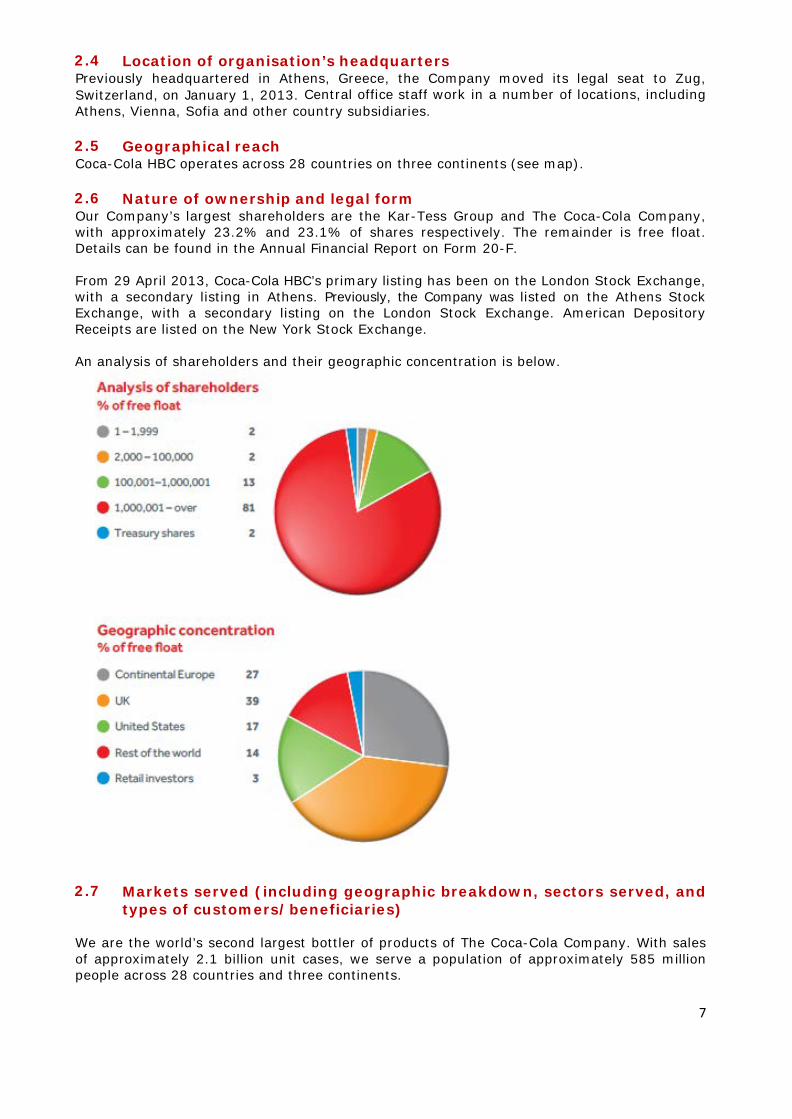
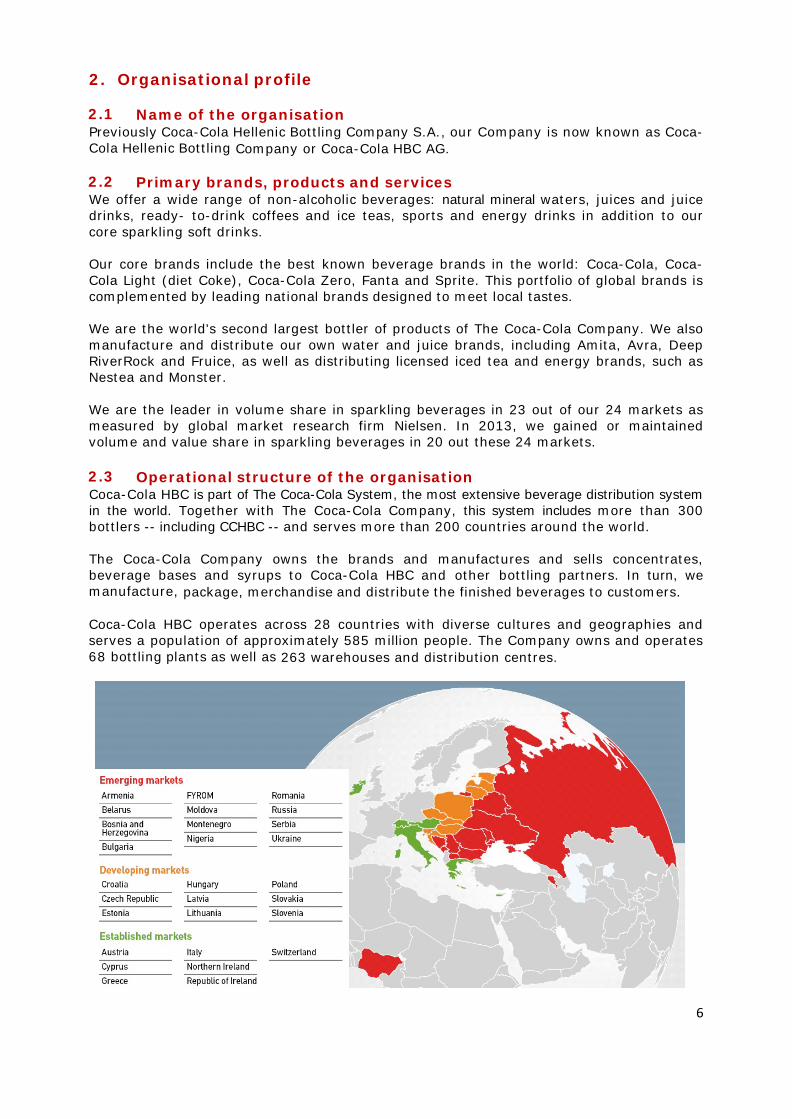
2.4 Location of organisation’s headquarters Previously headquartered in Athens, Greece, the Company moved its legal seat to Zug, Switzerland, on January 1, 2013. Central office staff work in a number of locations, including Athens, Vienna, Sofia and other country subsidiaries. 2.5 Geographical reach Coca-Cola HBC operates across 28 countries on three continents (see map). 2.6 Nature of ownership and legal form Our Company’s largest shareholders are the Kar-Tess Group and The Coca-Cola Company, with approximately 23.2% and 23.1% of shares respectively. The remainder is free float. Details can be found in the Annual Financial Report on Form 20-F. From 29 April 2013, Coca-Cola HBC’s primary listing has been on the London Stock Exchange, with a secondary listing in Athens. Previously, the Company was listed on the Athens Stock Exchange, with a secondary listing on the London Stock Exchange. American Depository Receipts are listed on the New York Stock Exchange. An analysis of shareholders and their geographic concentration is below.
2.7 Markets served (including geographic breakdown, sectors served, and
types of customers/beneficiaries) We are the world’s second largest bottler of products of The Coca-Cola Company. With sales of approximately 2.1 billion unit cases, we serve a population of approximately 585 million people across 28 countries and three continents.
7
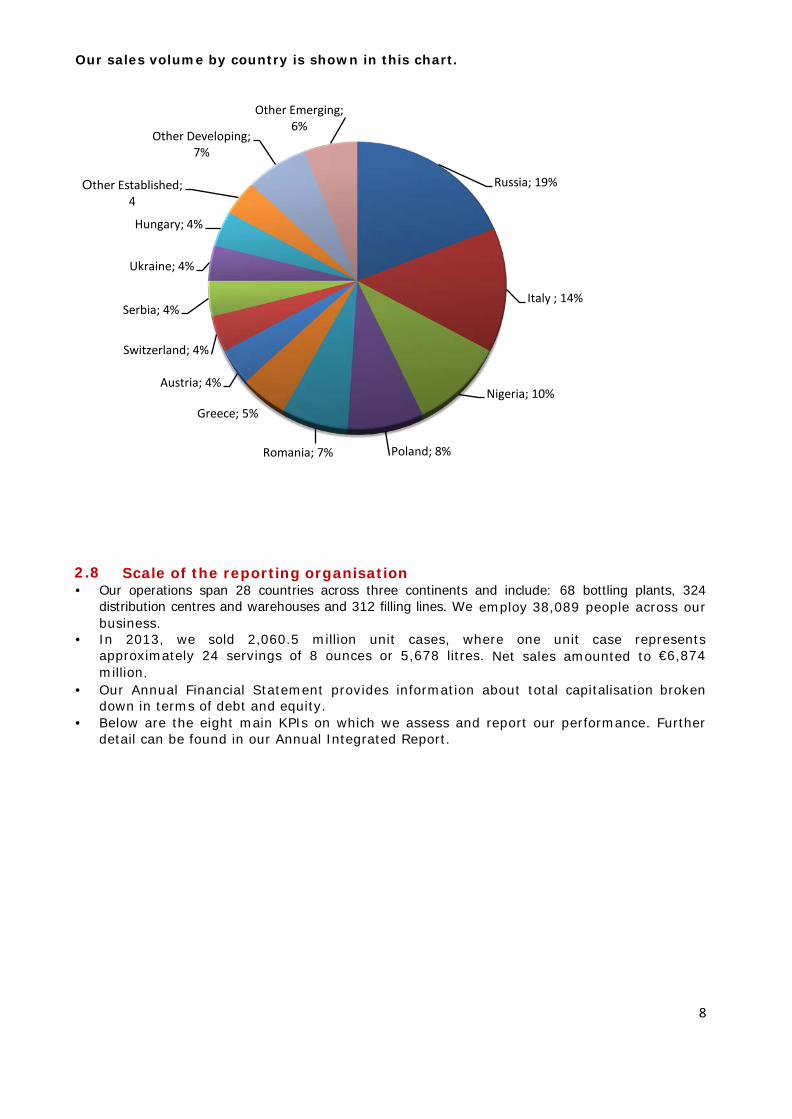
Our sales volume by country is shown in this chart.
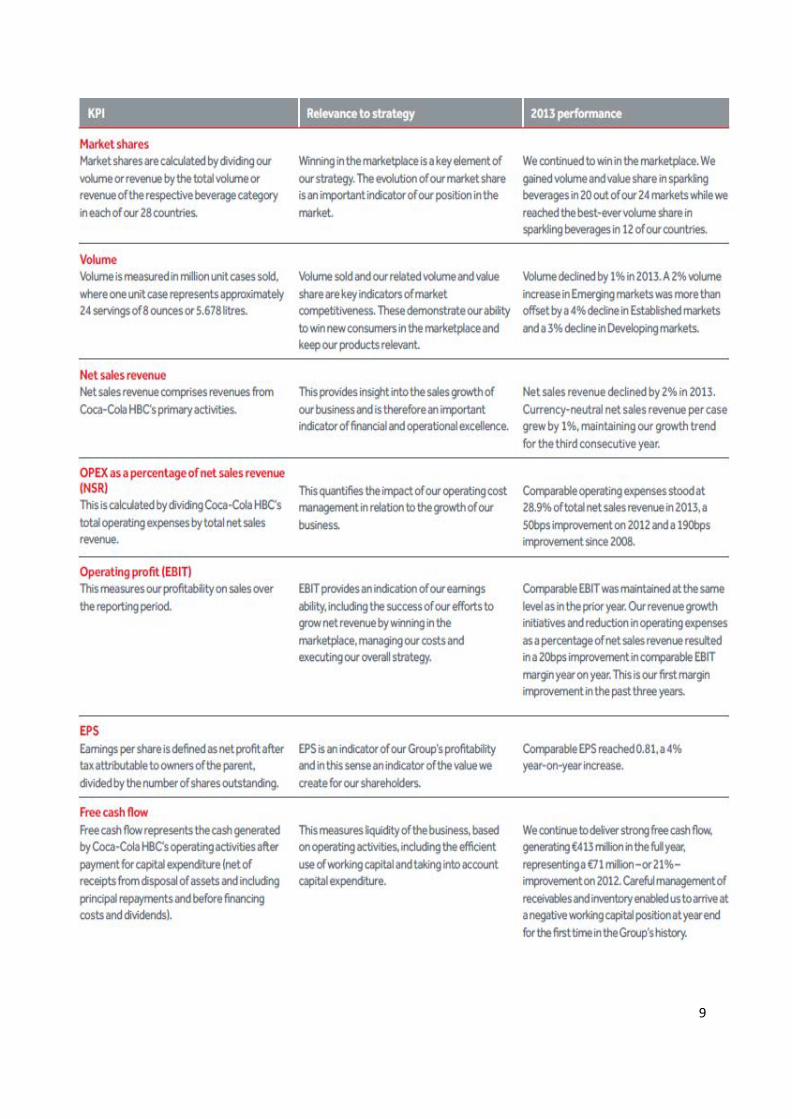
2.8 Scale of the reporting organisation • Our operations span 28 countries across three continents and include: 68 bottling plants, 324
distribution centres and warehouses and 312 filling lines. We employ 38,089 people across our business.
• In 2013, we sold 2,060.5 million unit cases, where one unit case represents approximately 24 servings of 8 ounces or 5,678 litres. Net sales amounted to €6,874 million.
• Our Annual Financial Statement provides information about total capitalisation broken down in terms of debt and equity.
• Below are the eight main KPIs on which we assess and report our performance. Further detail can be found in our Annual Integrated Report.
Russia; 19%
Italy ; 14%
Nigeria; 10%
Poland; 8%Romania; 7%
Greece; 5%
Austria; 4%
Switzerland; 4%
Serbia; 4%
Ukraine; 4%
Hungary; 4%
Other Established; 4
Other Developing; 7%
Other Emerging; 6%
8
9
2.9 Significant changes during reporting period regarding size,
structure or ownership including location of or changes in operations, facility openings, closings and expansions
Since 2008, we have reduced the number of manufacturing plants in Established and Developing Markets by 32%, our distribution centres by 16% and our warehouses by 9% in our total footprint. We have also invested in new state-of-the-art facilities, with an emphasis on cross-border consolidation. In 2013, for example, we opened an innovative juice drink production facility in Romania to service our operations in Bosnia & Herzegovina, Bulgaria, Croatia, Czech Republic, Hungary, Romania and Slovakia. For example: • In Romania, our cold drink equipment department cut the number of warehouses by
streamlining processes and reallocating resources based on geographical location. • In the Czech Republic and Slovakia, replacing an outdated warehouse and distribution
centre in the Moravian region led to a 35% reduction in costs. The benefits of this lean distribution model included improved truck utilisation and enhanced inventory.
Please see the Annual Integrated Report, Financial Statement and 20-F for a full description of the domicile change, delisting from the Athens Stock Exchange and listing on the premium segment of the London Stock Exchange. 2.10 Awards received in the reporting period In 2013 Coca-Cola HBC received a large number of awards, including: • 18 Employer of Choice awards • 7 awards for water stewardship and other environmental programmes (including the
European CSR Award for our programme Mission Water in Greece) • 10 awards for community investment programmes • 24 awards for brand and marketing programmes • 20 awards for overall sustainability 3. Report parameters
3.1 Reporting period for information provided This report covers the calendar year January 1, 2013 to December 31, 2013. 3.2 & 3.3 Previous reports and reporting cycles Since 2004, Coca-Cola HBC has reported on its non-financial performance, the first beverage company to produce a GRI report. Until 2012, the Company published this separately from its financial performance, issuing both an Annual Report and a CSR report. As the next step in our quest to embed sustainability into our business, we have now integrated our reporting, producing a single Annual Integrated Report since the 2012 reporting cycle (published in 2013). To supplement this, we publish this separate GRI COP Report to provide more detailed data on our sustainability performance. Detailed financial information is still published separately and available online. 3.3 Contact point for questions regarding the report or its contents • For non-financial information: [email protected] • For financial information: [email protected] 3.4 Process for defining report content We follow GRI guidance in determining the content of our reporting, including: • Determining materiality Coca-Cola HBC focuses its sustainability strategy and reporting on the most important issues to internal and external stakeholders. To identify issues, we rely on three main sources of information: • Ongoing analysis of trends – from media coverage, research and other sources
10
• Interviews with decision-makers across our Company and business system • Engagement with external stakeholders - including our Stakeholder Panel (see p. 11), as well as surveys and direct interviews. We prioritise these issues using a materiality assessment process developed in line with GRI guidance to identify which sustainability topics are of greatest concern to our business and our stakeholders. The Group Sustainability Council regularly reviews these priorities in light of changing issues and expectations. • Prioritising topics within the report We define the priority topics of our Annual Integrated Report based on our material issues (see above). We also follow guidance from the International Integrated Reporting Council (IIRC) on integrated reporting. • Identifying stakeholders the organisation expects to use the report Many investors, not just those interested in socially responsible investment (SRI), are increasingly interested in environmental, social and governance issues and they are the primary audience for this report. Other key stakeholders are interested in our performance and we have addressed the issues we believe are material to them. We structure the narrative around our business model in order to discuss our impacts across the value chain. 3.5 Boundary of the report This publication covers calendar year 2013 and its focus is on the core business of non-alcoholic ready-to-drink beverages across the 28 countries in which we operate. 3.6 State any specific limitations on the scope or boundary of the report This report includes data relating to our bottling, distribution and sales activities across the 28 countries in which we operate. The following investments are not considered here: our brewing interests in the Former Yugoslav Republic of Macedonia (FYROM) and Bulgaria, Greek snacks company Tsakiris, vending businesses in Hungary, the Czech Republic and Ireland, and the distribution of a selected number of third-party premium spirit brands in certain countries of operation. None of these represent more than 1% of volume. In our environmental reporting, we do not include offices and warehouses where they are independent from a production facility. 3.7 Basis for reporting on joint ventures, subsidiaries, leased facilities,
outsourced operations, and other entities that can significantly affect comparability from period to period and/or between organisations
Since 2003, we have reported on the same basis. We consider our entire bottling business, including 100% of assets and impacts of joint ventures over which we have operational control. As described in 3.7, the following investments are not considered: our brewing interests in FYROM, Greek snacks company Tsakiris, vending businesses in Hungary, the Czech Republic and Ireland and the distribution of a selected number of third-party premium spirit brands in certain countries of operation. None of these represents more than 1% of volume. 3.8 Data measurement techniques and the bases of calculations,
including assumptions and techniques underlying estimations applied to the compilation of the Indicators and other information in the report
The following standards were used in reporting our CSR performance: GRI G3.0, the Greenhouse Gas (GHG) Protocol, the Water Footprint calculation standard of the Water Footprint Network and LBG (London Benchmarking Group). The guidelines of BIER (the Beverage Industry Environmental Roundtable) are also integrated into The Coca-Cola System’s guidance, which we follow so that The Coca-Cola Company can report on global impacts, including those of its bottlers.
11
3.9 Explanation of the effect of any re-statements of information
provided in earlier reports and reasons for re-statement (e.g. mergers/ acquisitions, change of base years/periods, nature of business, measurement methods)
Re-statements occur due to two different and unrelated situations: • Following an acquisition, the previous impacts of the acquired business are added to
our previous impacts, in order to be able to demonstrate full impacts and the effect of our subsequent improvement activities.
• Following the publication of country electricity grid factors, which occurs after publication of the GRI COP report, we correct the past factors with their correct value.
3.10 Significant changes from previous reporting periods in the scope,
boundary, or measurement methods applied in the report In our quest for continuous improvement and transparency, we recalculated and amended our carbon footprint (Scope 1 &2 emissions) for 2012, following the discovery of inaccuracies in certain country data. Similarly, average sickness days per full time equivalent (FTE) were also recalculated. 3.11 Content Index • Table identifying the location of the Standard Disclosures: see 8.1 • Strategy and Analysis: see Annual Integrated Report • Organisational Profile: see 2.1-2.10 • Report Parameters: see 3.1-3.13 • Governance, Commitments, and Engagement: see 4.1-4.17 • Disclosures of Management Approach: see 5-7.6 • Core Performance Indicators: see 8.1 • Additional GRI Indicators included: see 8.1 • Sector Supplement Indicators included: see 8.1 3.12 Assurance Policy and practice with regard to seeking external assurance for the report In preparing our reporting, we are guided by the three principles of the AA 1000 Assurance Standard: materiality, inclusiveness and responsiveness. We measure and report our performance using leading standards and methodologies. These include the Global Reporting Initiative (GRI 3.0), Greenhouse Gas Protocol, Global Water Footprint Standard, Eco-Indicator 99 and LBG Model. Our reporting is independently audited; the validation statement can be found at the end of the Annual Integrated Report. Our reporting was independently assessed to meet GRI Application Level A+. This report also serves as our Communication on Progress (COP) to the United Nations Global Compact (UNGC) and we deem it to meet the criteria for GC Advanced Level. Our self-assessment is available on the Global Compact website. In addition, environmental, quality, health and safety management systems and data are audited annually by third-parties at all bottling plants. Both suppliers and Company-owned operations are subject to independent assessments of workplace conditions. Community investment data are submitted to London Benchmarking Group (LBG). Our compliance with industry codes on responsible sales and marketing is also independently audited. 4. Governance, Commitments and Engagement 4.1 - 4.10 Governance In preparation for listing on the Premium segment of the London Stock Exchange, we reviewed and refreshed our approach to corporate governance. Please see the Annual Integrated Report for a complete section on Governance. The following documents are available online: • Compliance with Chapters 4,5 and 6 of the UK Financial Conduct Authority’s Disclosure
and Transparency
12
• Organisational Regulations of Coca-Cola HBC AG • Charter for the Committees of the Board of Directors • Code of Business Conduct • Share Dealing Code • Board of Directors • Operating Committee 4.2 Explanation of whether and how the precautionary approach or
principle is addressed by the organisation. Please see our discussion of risk management in the Annual Integrated Report. 4.3 Externally developed economic, environmental, and social charters,
principles, or other initiatives to which the organisation subscribes or endorses.
• UN Global Compact & local networks • CEO Water Mandate • Caring for Climate • World Business Council for Sustainable Development (WBCSD) • Resolution on deforestation - Consumer Goods Forum • Resolution on HFC-free refrigeration - Consumer Goods Forum • LBG (London Benchmarking Group) • Carbon Disclosure Project • Dow Jones Sustainability Index • FTSE4Good • Vigeo 4.4 Memberships in associations (such as industry associations) and/or
national/international advocacy organisations in which the organisation:
• Has positions in governance bodies; • Participates in projects or committees; • Provides substantive funding beyond routine membership dues; or • Views membership as strategic. • UNESDA (European Union of Beverages Associations) • Food Drink Europe (FDE) via national federations • European Bottled Water Federation (EBWF) via national associations • CSR Europe • LBG (London Benchmarking Group) • SEDEX (Supplier Ethical Data Exchange) • EUROPEN (The European Organization for Packaging and the Environment) • Green Danube initiative with the International Commission for the Protection of the
Danube River (ICPDR)
In addition to these Group-level memberships, we belong to many similar organisations at national level. The Coca-Cola Company also represents CCHBC and the broader Coca-Cola System in other associations, including those related to marketing and advertising. 4.5 List of stakeholder groups engaged by the organisation. • Consumers • Customers • Suppliers • Employees, works councils, trade unions • Communities and community groups • Shareholders and providers of capital • NGOs, IGOs, civil society • Governments and government agencies • Media
13
4.6 Basis for identification and selection of stakeholders with whom to
engage. We engage with those stakeholders who have the greatest potential impact on our business and on whom we have the greatest potential impact. These include stakeholders in communities where our plants are located and at national and international level. 4.7 Approaches to stakeholder engagement, including frequency of
engagement by type and by stakeholder group. Our key approaches to engagement are listed below, by group. Some forms of engagement are regular while others are ad hoc. In addition, our Stakeholder Advisory Panel meets once a year to review our performance and guide our strategy and reporting.
• Shareholders and analysts: Shareholders’ Annual General Meetings, quarterly roadshows and results briefings, webcasts with shareholder and analyst participation, ongoing dialogue with analysts
• Employees: engagement and values index surveys, quarterly CEO business updates, Annual Leadership Conference; employee communications, development plans, health and safety programme, community and active lifestyle projects, Employee Works Council, whistleblower hotline
• Customers: regular visits, dedicated account teams, joint business planning, joint value creation initiatives, customer care centres, surveys
• Consumers: consumer hotlines, local websites, plant tours, research, surveys, focus groups
• Suppliers: joint value creation initiatives, annual supplier conference, sustainable sourcing, packaging associations
• Governments and regulatory authorities: discussions, recycling and recovery initiatives, EU Platform for Action on Diet, Physical Activity and Health, foreign investment advisory councils, chambers of commerce
• Non-governmental and intergovernmental organisations (NGOs and IGOs): discussions, partnerships on common issues, memberships of business and industry associations
• Communities: plant visits, community meetings, partnerships on common issues, sponsorship activities, lectures at universities
• The Coca-Cola Company: day-to-day interaction as business partners, joint projects, joint business planning, functional groups on strategic issues, Top-to-Top senior management forum
4.8 Key topics and concerns raised through stakeholder engagement,
and how the organisation has responded to those topics and concerns, including through its reporting.
Since 2008, our Stakeholder Advisory Panel has met once a year to review our sustainability performance and provide guidance for our future strategy and reporting. Comprising academics, NGOs, industry and other technical experts, the Panel helped to shape our approach over time. Past advice which we have since implemented has included setting longer-term performance targets, prioritising the issue of consumer health, focusing more on our supply chain and food security, seeking external assurance of our reporting and, most recently, integrating our sustainability and financial reports.
4.9 Disclosures of Management Approach Below are disclosures of our management approach to key aspects of sustainability, as required by the Global Reporting Initiative (GRI). Here, we outline the policies and commitments that guide Coca-Cola HBC’s approach; the way that performance is managed, monitored where accountability lies. Year-on-year targets and actual performance are also reported in our Annual Integrated Report, using GRI indicators. Our policies are periodically reviewed and updated. The following sustainability policies are available online: • Code of business conduct
14
• Anti-bribery policy and Compliance handbook • Equality of opportunity policy • Environmental policy • Quality and food safety policy • Health and wellness policy • Genetically modified organism (GMO) position statement • HIV/AIDS policy • Human rights policy • Occupational health and safety policy • Packaging waste and recycling policy • Supplier guiding principles policy • Climate change policy • Union of European Beverages Associations (UNESDA) commitments • Fleet safety policy • Water stewardship policy
5. ECONOMIC ASPECTS • Economic Performance • Market Presence • Indirect Economic Impacts Goals Coca-Cola HBC aims to support its local communities through both core business activities and community investment programmes. We bring benefit by: • Leveraging core business activities that generate local economic benefit • Developing community programmes that tackle locally relevant issues • Working in long-term partnerships that deliver measurable results • Encouraging the participation of employees, communities and others Policies • Our corporate mission is to refresh our consumers, partner with our customers, reward
our stakeholders and enrich the lives of our local communities. • The Company’s set of core values further underline the importance of creating shared
value – for employees, customers, consumers and communities. • Our Code of Business Conduct (available online) defines how business activities and
relationships should be conducted. • We are committed to competing vigorously but fairly. • Wherever possible, we source goods, ingredients and services locally. • We are a longstanding participant in the UN Global Compact. Additional Information • Since our manufacturing and distribution is largely local, we generate significant
employment in our territories. More than three-quarters of our workforce are from emerging and developing economies. In the EU, the Coca-Cola System supports almost 600,000 jobs, directly and indirectly, in our value chain.
• We are committed to developing local leaders, focusing on training and development. Most of our country leadership positions are filled by people of local origin.
• The Coca-Cola business system periodically commissions studies of the economic impact of our business. Past economic impact studies have shown that each job in the Coca-Cola business supports a further 10 jobs in our value chain, including suppliers, distributors and customers.
• A 2013 study in Switzerland showed that 90% of beverages sold by CCHBC in the country were manufactured locally and 95% of ingredients were sourced locally. Our business was found to support 16,500 jobs and generate CHF 1.2 billion to the local economy.
• Close to 90% of our supplier base is local – within our countries of operation or within the EU. We also help to develop local suppliers, from supporting local sugar production
15
and new inward investments by multinational suppliers to our business. In addition to international chains of retailers and restaurants, we also help small, independent stores to grow their business.
• In addition to core business activities, we support community investment projects to help improve the quality of life in our communities. Using the widely recognised LBG methodology, we calculated our contributions in 2013 to exceed €9.5 million, over 2% of pre-tax profits. Contributions are split between cash, time and in-kind. We also categorise programmes by motivation - charitable gifts, community investment and commercial initiative in the community. Certain programmes provide infrastructure, such as improved access to safe water and sanitation, or sports and playgrounds.
• We have a diversified shareholder structure (see Annual Integrated Report and 20-F for breakdown). Our largest shareholders are The Coca-Cola Company and Kar-Tess Holding S.A.
• We aim to compete vigorously but fairly and train our employees appropriately. All employees and directors are trained in our Code of Business Conduct, while commercial employees are also trained in competition law.
6. ENVIRONMENTAL ASPECTS 6.1 Environmental Management Goals Coca-Cola HBC aims to: • Continuously reduce the key environmental impacts of our business. We address both
our direct impacts – those of our operations - as well as our indirect impacts on which we collaborate with suppliers and other partners
• We monitor and disclose our performance against both annual targets and long-term goals in our Annual Integrated Report (previously CSR report).
Policies Coca-Cola HBC environmental policies include the following (see appendix 10): • Environment Policy • Packaging and Packaging Waste Policy • Climate Change Policy • Water Stewardship Policy Coca-Cola HBC has also signed external initiatives, e.g. • CEO Water Mandate - UN Global Compact (COP-Water: see 9.2) • Caring for Climate - UN Global Compact (COP-Climate: see 9.3) • Resolution on deforestation - Consumer Goods Forum • Resolution on HFC-free refrigeration - Consumer Goods Forum • We are a longstanding participant in the UN Global Compact. By the end of 2013, ISO 14001-certified plants accounted for 99% of our produced volume. Organisational Responsibility Responsibility for environmental performance lies with the Group Director, Operational Sustainability and Primary Packaging. In this capacity, the Director is supported by others, including the Group Environment Manager, Water Resources and Technologies Manager, Energy Projects Manager, Group Packaging Manager and Resource Recovery Director. Training & Awareness Plant personnel in bottling operations are trained and kept up-to-date on environmental management. In 2013, we conducted quarterly WebEx conferences on sustainability, quality, environment, health and safety issues to share knowledge and best practice. The Top 10 Water Savers programme is mandatory in every bottling plant and in 2014 we are launching a new awareness and education campaign called Passion for the Environment. We maintain a database of successful practices around the Group and a Supply Chain
16
intranet portal. All drivers are trained in our Safe & Eco-Driving programme. At Group level, we hold an annual one-week training course on environmental issues. Monitoring & Follow-Up • We set short and medium-term targets for improvement. • Annual targets are set at plant, country and Group level. • Progress is reviewed monthly, quarterly and annually. • Water, energy, packaging and waste are monitored quarterly by the Group
Sustainability Council. Results are reported to the Board Social Responsibility Committee.
• Targets are included in performance objectives of managers and employees, according to function. Performance affects variable compensation and career development.
• Independent audits are conducted each year as part of ISO 14001. • Compliance with environmental laws and regulations is monitored and reported. • We publish our performance against these goals. 6.2 Top material issues: Key strategies, procedures and successes 6.2.1 WATER
Continuing to mitigate the risk of water issues resulting from climate change requires meaningful participation by all stakeholders. Coca-Cola HBC is committed to playing its part. Our approach Since water stewardship is critical to our ability to grow, we have a comprehensive strategy which focuses on: • Ensuring the sustainability of our water extraction • Source water protection • Minimising our water use • Ensuring 100% of our wastewater is treated to levels that support aquatic life • Addressing water use in our supply chain by working with our partners • Protecting the local watersheds in which we operate • Promoting awareness of water issues in our communities • Partnering with NGOs and IGOs (e.g. WWF and ICPDR) to implement these strategies By 2020, we will reduce our relative water consumption by 40% compared to 2004 and strive to replenish 100% of water used. We are also working to raise awareness of water sustainability, tackle water use in our supply chain and protect our watersheds. In 2011, we reached a major milestone: 100% of our wastewater across all 28 countries of operation is now treated to levels that support aquatic life. In 2013, European Water Stewardship Gold Level certification was awarded to Coca-Cola HBC’s Romanian plant in the district of Ploeisti just outside of Bucharest following formal audits in 2012. Our Company was one of the first to gain certification and we have piloted further audits against this new European standard since then. Our strategy is underpinned by the CEO Water Mandate, of which we are a founding member. In addition, ISO 14001-certified bottling plants accounted for 99% of our beverage production in 2013. Understanding water risks Since water is an inherently local issue, all bottling plants monitor the availability and quality of supplies. We recognise that water is a human right and commit not to negatively impact the water available to meet the basic needs of local communities. Although most plants operate in water-abundant river basins, seven are in areas that face baseline water stress, mainly in Nigeria and the eastern Mediterranean. Water stress is likely to worsen in southern and eastern regions as climate change takes hold.
17
All of our bottling plants have completed an in-depth assessment of source vulnerability, analysing risks to supplies; plant use vis-à-vis other users; and engagement on water issues. Based on these assessments, each plant has developed comprehensive source water protection plans and is working to implement the action points. Improving our efficiency Water is not only a key beverage ingredient; it is also used in cleaning and other manufacturing processes. On average, we use about 2.2 litres to produce one litre of beverage, while the water used in manufacturing and cleaning processes is cleaned and returned safely to the environment. We have committed to reduce our relative water consumption by 40% by 2020. Since 2004, we have reduced relative water consumption by 23%. Nevertheless, we narrowly missed our target for relative water use in 2013. Although this was due in part to lower than expected production volumes, we will launch an internal campaign called ‘Passion for the Environment’ in 2014 to increase awareness and focus on this critical issue. In addition, we have made our Top 10 Water Savers programme mandatory for all plants. We also work with suppliers and other partners to reduce our indirect water use. For example, we are partnering with the Russian sugar industry to replace the imported cane sugar we use with local beet sugar. One of the advantages of local beet sugar is that it has a lower water footprint than cane sugar. Since 2011, we have worked with suppliers to invest over $100 million to increase local production. In 2013, Russian beet sugar comprised 50% of our sugar use and we aim to grow this to 82% in 2014, reaching 100% by 2015. Our water footprint Although our business will continue to grow, we must ensure that our absolute water use does not. We use the Water Footprint Network (WFN) methodology to calculate the water footprint (grey, blue and green water) of our own operations and our supply chain. Our operational water footprint was 19.6 billion litres in 2013, 2% below 2012 and 62% less than in 2004. Our total water footprint, which includes freshwater used in our operations and throughout our supply chain, amounted to 941 billion litres - 3% less than in 2012. By 2020, we have committed to reduce the water footprint of our operations by 75% compared to 2004. Treating 100% of wastewater Since 2011, 100% of our wastewater has been treated to a level that supports aquatic life. This is the result of a major investment programme to build 44 on-site wastewater treatment plants in municipalities which did not treat effluent to meet our standards. Our wastewater treatment plants in FYROM and Armenia were the first such systems in the country. To promote wastewater management, we demonstrate the technology to local businesses, government and others. Levels of chemical oxygen demand (COD) indicate the quality of our wastewater. The COD load of our wastewater is now 79% lower than in 2003, due to the efficiency of our on-site wastewater treatment units. With improved water efficiency, less wastewater and with a lower COD load, our water footprint has shrunk by 62% since 2004. Promoting sustainable watersheds Our water stewardship activities extend well beyond our operations and value chain. In 26 countries, we have built long-term partnerships with NGOs, government and UN agencies to benefit local eco-systems and communities. Since 2005, we have partnered with the International Commission for the Protection of the Danube River (ICPDR), conducting conservation, advocacy, awareness and education in 11 countries. We now have partnerships to conserve and promote the following rivers, water bodies and watersheds: Danube Basin, Danube River, Tisza River, Vistula River, Volga
18
River, Sava River, Vrbas River, Yelnya Bog, Lake Baikal, in addition to beaches and sea shores in Greece, Ireland and the Baltics. 6.2.2 ENERGY AND CLIMATE
With business making up 70% of greenhouse gas emissions, effective action on climate change must involve the private sector. Through collaboration, innovation and leadership, business can help drive the transition to a low-carbon economy. Our approach Climate change represents significant potential risks to Coca-Cola HBC, including increased energy costs, water and stable availability of agricultural raw materials such as sugar and fruit. We are taking decisive action to address the risks and opportunities presented by climate change. We aim to take a leadership role, particularly in developing and emerging markets. Our strategy focuses on: • Increasing the energy efficiency of our operations • Switching to cleaner energy sources • Reducing emissions in our value chain • Championing low-carbon technologies • Promoting awareness and action • Adapting to climate change In addition to climate-proofing our business, these initiatives are yielding short-term cost-savings, too. Energy-savings projects in our plants yielded savings of €1,000,000 during 2013. By 2020, we aim to reduce relative emissions from operations by 40%. Since absolute reductions matter most, we have set a 20% reduction target for absolute emissions. To achieve this, we must continue to decouple business growth from an associated rise in emissions. Our next challenge is to tackle emissions throughout our value chain. By 2020, we aim to reduce the total carbon footprint per litre of produced beverage, including ingredients, packaging, manufacturing and cooling, by 25% compared to 2010. By the end of 2013, we had achieved a reduction of 9.8%. Our submission to the Carbon Disclosure Project provides more detail. Reducing our emissions Our operational carbon emissions (from production and transport) amounted to 741,684 tonnes in 2013 (3% below 2012 levels). The global carbon footprint of our products, including indirect emissions in the supply chain and for cooling amounted to 4.682 million tonnes of CO2 (4.945 million tonnes in 2012). Since 2004, we have reduced relative emissions from fleet and bottling plants by 29%. Consequently, we are on track to achieve our 2020 reduction targets. The game-changer behind our progress is our major quad-generation CHP construction programme.
19
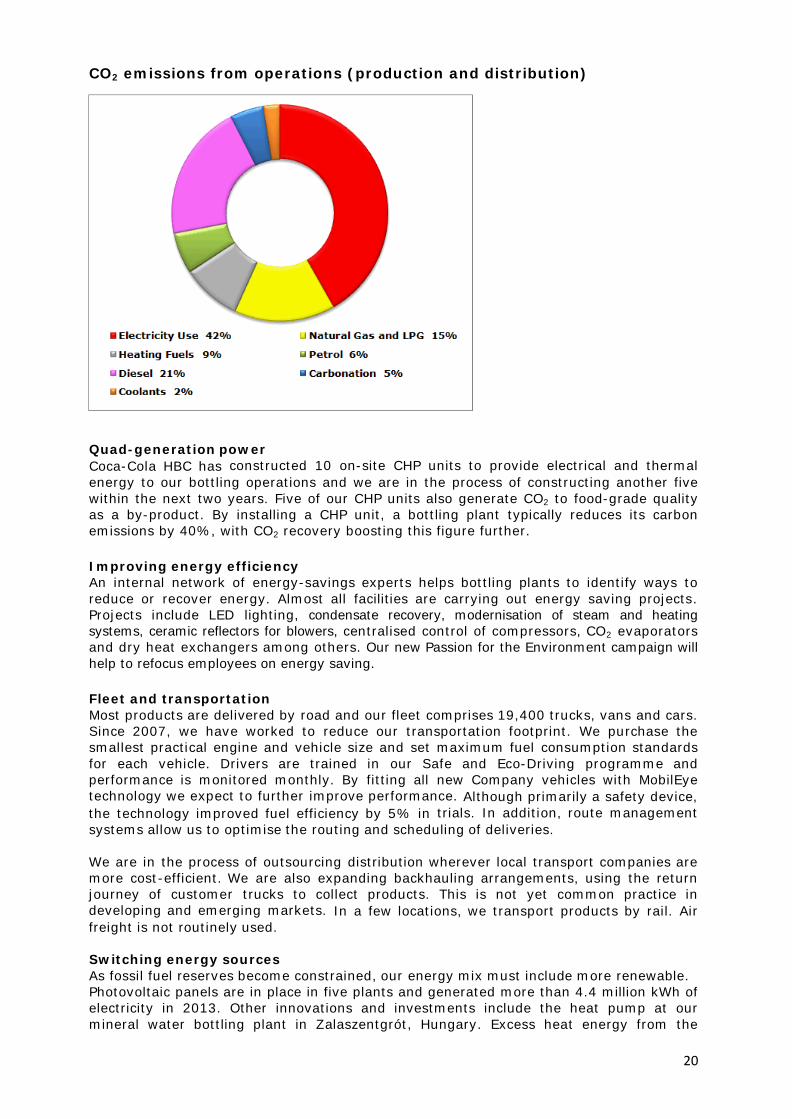
CO2 emissions from operations (production and distribution)
Quad-generation power Coca-Cola HBC has constructed 10 on-site CHP units to provide electrical and thermal energy to our bottling operations and we are in the process of constructing another five within the next two years. Five of our CHP units also generate CO2 to food-grade quality as a by-product. By installing a CHP unit, a bottling plant typically reduces its carbon emissions by 40%, with CO2 recovery boosting this figure further. Improving energy efficiency An internal network of energy-savings experts helps bottling plants to identify ways to reduce or recover energy. Almost all facilities are carrying out energy saving projects. Projects include LED lighting, condensate recovery, modernisation of steam and heating systems, ceramic reflectors for blowers, centralised control of compressors, CO2 evaporators and dry heat exchangers among others. Our new Passion for the Environment campaign will help to refocus employees on energy saving. Fleet and transportation Most products are delivered by road and our fleet comprises 19,400 trucks, vans and cars. Since 2007, we have worked to reduce our transportation footprint. We purchase the smallest practical engine and vehicle size and set maximum fuel consumption standards for each vehicle. Drivers are trained in our Safe and Eco-Driving programme and performance is monitored monthly. By fitting all new Company vehicles with MobilEye technology we expect to further improve performance. Although primarily a safety device, the technology improved fuel efficiency by 5% in trials. In addition, route management systems allow us to optimise the routing and scheduling of deliveries. We are in the process of outsourcing distribution wherever local transport companies are more cost-efficient. We are also expanding backhauling arrangements, using the return journey of customer trucks to collect products. This is not yet common practice in developing and emerging markets. In a few locations, we transport products by rail. Air freight is not routinely used. Switching energy sources As fossil fuel reserves become constrained, our energy mix must include more renewable. Photovoltaic panels are in place in five plants and generated more than 4.4 million kWh of electricity in 2013. Other innovations and investments include the heat pump at our mineral water bottling plant in Zalaszentgrót, Hungary. Excess heat energy from the
20
aquifer is used to heat our bottling plant, as well as thermal baths in the community. This project avoids 500 tonnes of CO2 emissions and 300,000 cubic meters of gas each year. Renewable energy accounted for 11% of electricity and 5.5% of energy use in 2013. Reducing indirect emissions Since cold drink equipment and beverage packaging represent approximately two-thirds of indirect emissions, these are another important element in our climate strategy. To reduce the impact of our 1.5 million coolers, we have led the development of cold drink equipment that is free of hydro-fluorocarbons (HFCs). Our new coolers are up to 63% more energy-efficient than in 2004 due also to improved insulation, LED lighting and energy management devices. In 2013, HFC-free models accounted for almost two-thirds (64%) of coolers purchased, while 85% were equipped with an energy management device. We are on track to meet our target that all new equipment will be HFC-free by 2015. In addition, we are retrofitting energy-saving devices in existing coolers in the marketplace. To reduce the climate impact of our packaging, we minimise material use and include recycled content. We also invest significantly in collection, recovery and recycling. In 2013, our packaging reduction initiatives avoided 29,500 tonnes of carbon emissions. We have now begun to assess the sustainability performance of packaging suppliers, including carbon foot printing and energy management. Promoting climate action We promote climate action, showcasing our low-carbon technologies with customers, governments, employees and others. During EU Sustainable Energy Week, we hold events across our operations or communicate with consumers about climate change. Coca-Cola HBC has been active on the international stage, too, and is a founding signatory of the Global Compact’s Caring for Climate initiative. Supporting adaptation We must adapt to the changing climate, building resilience to the likely impacts on our business and communities. Water stewardship is our main approach to date since this represents the most immediate impact. Given the increased likelihood of extreme weather events, we are also creating joint disaster preparedness plans with the International Federation of the Red Cross and Red Crescent Societies (IFRC). 6.2.3 PACKAGING
The fundamental role of packaging is to allow our beverages to be delivered safely from production line to consumer without spoilage or contamination. By helping to reduce food waste, packaging has a key role in helping society live more sustainably. Typically, ten times more energy and resources go into producing food and goods than their packaging. Nevertheless, packaging itself incurs environmental impacts from manufacturing to recycling and disposal Our approach As our packaging evolves to meet changing consumer and customer needs, we also address environmental impacts at every stage of its lifecycle. We do so by: • Optimising the packaging we use • Increasing recycled and renewable content • Promoting recycling and recovery • Minimising waste in our own facilities We close the loop by recovering and recycling packaging materials. Each year, the PET recycling plant that we co-own in Austria recycles around 20,000 tonnes of PET (polyethylene terephthalate) bottles into secondary raw materials for new bottles. Given our geographic reach, progress in packaging waste management varies significantly from country to country. We therefore continue to work closely with governments,
21
recyclers, suppliers and others to advance technological solutions and develop economically sustainable collection and recovery systems. We are also deepening our approach to address the embedded carbon of packaging throughout our value chain. By 2020, we aim to reduce the carbon footprint of the product in our consumer’s hand by 25% compared to 2010. Optimising packaging Since 2004, we have worked continuously to optimise the amount of packaging we use. Optimisation does not simply mean using the lightest possible packaging. Instead, we balance material reduction with other vital considerations, such as maintaining safety and quality standards or meeting the needs of customers and consumers. For example, our PET packages now contain more than 20% less material than in 2004, thereby avoiding 125,000 tonnes of CO2 each year. During 2013, we developed the lightest and most environmentally friendly can in the world through partnership with Ball Packaging Europe. The new 330ml can weighs only 9.45g compared to its 9.9g predecessor. If we switched our can usage entirely to this ultra lightweight can, some 850 metric tonnes of aluminium would be avoided each year, around 2.5% of our annual usage. In addition, PET lightweighting initiatives in 2013 alone avoided 1,963 tonnes of material, around 1% of our annual usage. We also work with customers to reduce shrink wrap, stretch film and other secondary packaging. Innovative solutions include pre-merchandised products that can be rolled straight onto the shop floor. Coca-Cola HBC used 606,613 tonnes of packaging in 2013. This includes beverage containers as well as the packaging used to deliver them. Recycled and renewable content A further way we reduce the impact of our packaging is to include recycled or renewable content. Using recycled instead of virgin material is much less energy-intensive, 85% less for PET and 95% for aluminium. Recycling of metal and glass is already well-established, with recycled content accounting for around half of the material in our cans and bottles. We therefore focus on the recycled content of our PET bottles. In 2013, our use of recycled PET (rPET) rose by a further 23% to 10,092 tonnes. Since demand for rPET continues to grow, we must further expand the collection and recycling of PET bottles. By improving the availability and affordability of rPET, we can increase the amount we use. We also continued to roll out Plantbottle™, the first fully recyclable PET bottle to use renewable plant-based content. The package was developed by The Coca-Cola Company and includes up to 30% plant-based material. We have now introduced the package for mineral waters in Serbia and Bulgaria and plan to extend its use in 2014 and beyond. Promoting recycling Collection, recovery and recycling of our packages are also key areas of focus. To date, we have worked with industry and government to set up 19 recovery organisations. As a result, more than 133 million people across 18,500 municipalities now have access to collection and recycling infrastructure - in some countries, this marks the first residential collection of any waste stream in rural communities. In 2013, these organisations recycled or recovered the equivalent of 73% of our beverage packaging. All legal recovery and recycling targets are being met or exceeded in EU member state territories. Nevertheless, some of our highest-volume emerging markets are not yet included. In such markets as Russia, Ukraine and Nigeria, we are working to establish packaging collection schemes to divert packaging from landfill. In 2013, we contributed €27.5 million in collection and recovery fees, totalling €40.8 million including taxes and deposits. Mobilising consumers Consumer participation is vital to closing the recycling loop. If people do not place their empty cans and bottles into collection systems, these packages become landfill or litter,
22
rather than feedstock for recycling. We conduct education campaigns on the importance of recycling and how to separate waste. In 2013, these activities reached close to three million people. Through on-pack communication, we use our brands to encourage consumers to recycle and in certain countries we partner with retail customers to do the same. Supporting anti-littering If packaging waste is discarded irresponsibly, it can result in litter - waste in the wrong place – and can pose environmental hazards. Since 2009, we have partnered with the ICPDR to address plastic pollution of the Tisza River. Together with environment ministries in the five basin countries, we cleared litter and set up mechanisms to prevent a recurrence. During 2013, we supported more than 20 clean-up initiatives in 16 countries, encouraging employees and communities to take part. 7. SOCIAL ASPECTS 7.1 Labour Practices & Decent Work
• Employment • Labour/Management Relations • Occupational Health and Safety • Training & Education • Diversity & Equal Opportunity Goals Coca-Cola HBC aims to: • Care for our people, engaging with them (and their representatives) openly, honestly
and with respect • Help our people to achieve their full potential and develop a strong leadership pipeline • Build a world-class safety culture and promote employee health and well-being • Offer a workplace that is fair, ethical and inclusive Policies Our core values include: Caring for Our People and Training. In addition, internal standards include: • Human Rights Policy • Occupational Health & Safety Policy • Equal Opportunities Policy We also have a commitment to social dialogue. Our policies uphold the UN Universal Declaration of Human Rights and its Protocols; the ILO tripartite declaration concerning multinational enterprises and social policy, especially the ILO’s eight core conventions; and the OECD Guidelines for Multinational Enterprises. Coca-Cola HBC is a longstanding participant in the UN Global Compact. Organisational Responsibility • Our Group Director, Human Resources is responsible for our workforce and our
workplace, while developing our leadership and culture and ensuring compliance with employment and labour laws
• Our Group Health and Safety Manager leads a multi-disciplinary team at Group level. • In addition, a member of our Operating Committee (OpCo) is a designated champion
for occupational health and safety. Training & Awareness • Our Learning Centre of Excellence, AGORA, offers a wide range of accredited training
programmes to employees, managerial and non-managerial alike. • Coca-Cola HBC has developed a matrix that defines the skills, experience and
knowledge required at every stage of leadership. This comprehensive and transparent
23
approach forms the basis of all people processes: recruitment; performance management system; training and development; assessment and rewards.
• We are developing a coaching culture, encouraging a coaching style of leadership and the development of externally certified coaches.
• Our drive to build a world-class safety culture involves comprehensive training and communications programmes to ensure that all employees can meet their safety responsibilities.
Monitoring & Follow-Up • Independent audits of bottling plants and supplier sites assess workplace conditions. • Each operation conducts an annual self-assessment of compliance with legal
requirements and Company policies. • Each employee from team leader upwards is responsible for creating a personal
development plan. • Annual People Development Forums take place in each country. • Our whistle-blower hotline allows employees to raise grievances, questions and
concerns confidentially, even anonymously. We also promote our open door policy. • All concerns are investigated at the appropriate management level, with findings
reported to the Audit Committee of the Board. Please also see section 12 of the appendix for a report on the Code of Business Conduct breaches by violation type.
• By 2013, 67 bottling plants were certified against OHSAS 18001, accounting for 99% of volume produced. Safety is on the agenda of every OpCo meeting. Safety also forms part of agreements with trade unions. In 2013, we achieved a lost-time incident rate of 0.57, a 12% improvement over 2012 and the fifth consecutive year of double-digit improvement.
• To ensure regular and open dialogue and consultation, Coca-Cola HBC has formal communications protocols with all trade unions and works councils. During 2013, CCHBC undertook 96 consultations with unions on organisational changes. In countries where unions and works councils do not exist, we consult with employees directly and recommend the establishment of alternative bodies to represent employees.
7.2 Human Rights
• Investment and Procurement Practices • Non-discrimination • Freedom of Association & Collective Bargaining • Abolition of Child Labour • Prevention of Forced & Compulsory Labour • Complaints & Grievance Practices • Security Practices • Indigenous Rights Goal Coca-Cola HBC aims to: Protect and promote human rights within our operations, as well as our supplier operations and local communities Policies Our internal standards that protect and promote human rights include: • Human Rights Policy • Equality Policy • Supplier Guiding Principles • Code of Business Conduct
In 2014, we will implement a new and comprehensive Workplace Rights Policy, after which we will conduct a first assessment into the implications of the UN Framework and Guiding Principles on Business and Human Rights (the Ruggie framework). Coca-Cola HBC is a longstanding participant in the UN Global Compact. Our policies uphold the UN Universal Declaration of Human Rights and its Protocols; the ILO tripartite
24
declaration concerning multinational enterprises and social policy, especially the ILO’s eight core conventions; and the OECD Guidelines for Multinational Enterprises. Organisational Responsibility • Our Group Director, Human Resources is responsible for protecting and promoting
human rights in our workforce. • Our Chief Procurement Officer and Director, Operational Sustainability is responsible
for human rights in our supply chain.
Training & Awareness Human rights and our approach have been integrated into leadership development courses and management systems. Confidential and anonymous reporting mechanisms include a telephone hotline and email system. We also promote an open door policy. Monitoring & Follow-Up • We investigate all concerns raised through our hotline and other reporting at the
appropriate management level. Results are reported to the Audit Committee of the Board. This system is independently audited each year.
• Bottling plants and supplier sites are subject to independent audits of labour conditions. Any sites that fail must implement corrective actions and be re-audited. Repeated failures to pass or egregious violations of our SGPs will lead to termination.
7.3 Society
• Community • Corruption • Public Policy • Anti-Competitive Behaviour • Compliance Goals Coca-Cola HBC aims to: • Contribute to the quality of life in our local communities, supporting socio-economic
development and environmental protection • Contribute to public policy development transparently and in ways that to support
environmental protection, community development and business growth. • Support efforts to address corruption, where appropriate • Compete fairly yet vigorously in the marketplace • Comply with all relevant laws and regulations • Abide by our own Code of Business Conduct at all times Policies • Coca-Cola HBC’s corporate mission requires that we conduct our business in a way that
benefits our communities. • Our Code of Business Conduct defines how all employees and directors must behave. • Directors are additionally subject to Code of Ethics and Code of Dealing in Shares. This
Code describes our zero-tolerance approach to corruption. It also makes clear our prohibition on political contributions.
• We engage in public policy development on issues that concern our business and our stakeholders. We aim to do so in a manner that is transparent and consistent with our Code of Business Conduct.
• We are a longstanding participant in the UN Global Compact.
Organisational Responsibility • Corruption-related risks are the responsibility of the Director of Internal Audit, who
reports directly to the Audit Committee. • Compliance with all applicable laws and regulations is the responsibility of our Chief • Compliance Officer and Deputy General Counsel.
25
• Ensuring that we engage with and support our local communities is the responsibility of our Group Director, Public Affairs and Communications.
Training & Awareness • Training in our Code of Business Conduct is mandatory for all employees. • Suppliers are made aware that they must abide by our Code of Conduct. • In addition, our Supplier Guiding Principles are included in all new supplier contracts. • Commercial employees are trained in competition law. • Public affairs and communications teams are trained in community engagement and
investment, as well as responsible lobbying. Monitoring & Follow-Up • All operations are assessed for corruption risks every two to three years, with those in
higher-risk countries audited more frequently. • Concerns and grievances can be reported through our whistleblower hotline and email
system confidentially, even anonymously. All concerns are investigated at the appropriate level with findings reported to the Audit Committee. The whistleblower system is subject to independent audits each year. Please also see a report on Code of Business Conduct breaches by violation type in section 12. of the appendix.
• Suppliers are subject to independent audits against our Supplier Guiding Principles. • Community investment data is submitted to the LBG for verification.
Additional Information The Coca-Cola Company participates in the AIM-PROGRESS programme on behalf of the Coca-Cola business system. As part of a mutual recognition scheme, we accept audits undertaken on behalf of other AIM-PROGRESS members. In 2014, Coca-Cola HBC joined SEDEX.
7.4 Product Responsibility
• Consumer Health and Safety • Product and Service Labelling • Marketing Communications • Consumer Privacy • Compliance Goals Coca-Cola HBC aims to: • Offer a wide range of high-quality beverages that meet evolving consumer
expectations • Meet and exceed legal requirements for food safety and integrity • Provide clear and useful nutritional information, including front-of-pack calorie • content across our business • Conduct marketing responsibly and in compliance with voluntary industry codes • Support multi-stakeholder initiatives that aim to address obesity, with a particular
focus on promoting nutrition education and physical activity. Policies We have adopted internationally recognised food safety management systems standards FSSC 22000 and ISO 22000. Internal standards which underpin our commitment to product responsibility include: • Our Quality Policy • Our Consumer Health strategy • GMO position statement
26
• The Coca-Cola Company’s global commitments to 2020 on consumer health and wellness
We also help to develop and implement voluntary industry codes of conduct. These include: • UNESDA commitments to the EU Platform on Diet, Physical Activity & Health • EU Pledge on advertising to children • Global Guidelines on Marketing to Children - International Council of Beverage
Associations The premise of these various codes is not to target marketing at children under 12 years old. The UNESDA commitments also include digital marketing communications. Codes have been implemented throughout our business and industry compliance is independently verified by third party audits.
Organisational Responsibility • The Group Director, Operational Sustainability and Primary Packaging is responsible for
product quality and integrity. • The Group Director, Public Affairs and Communications is responsible for stakeholder
engagement on consumer health, as well as active lifestyle programmes. • As owner of most brands that we produce, The Coca-Cola Company is responsible for
product development, labelling and consumer marketing. Training & Awareness All salespeople are trained in UNESDA responsible marketing commitments and applicable competition law. Monitoring & Follow-Up • By 2013, 67 bottling plants were certified against FSSC 22000 and ISO 22000,
representing 99% of production volume. We monitor compliance performance with laws and regulations on product quality and safety.
Independent audits assess our industry’s compliance with the EU Pledge, UNESDA and ICBA commitments. Additional Information Coca-Cola HBC has voluntarily implemented front-of-pack labelling of energy (calorie) content across all territories. Additionally, we have rolled out front-of-pack labelling of Guidelines Daily Amounts (GDAs) in all EU territories. In every country of operation, dedicated call centres respond to queries or complaints from customers and consumers. All consumer complaints are recorded monthly by category (both product and package issues) and reported in terms of number of complaints per million physical containers sold. In 2013, the consumer complaint rate was 0.22 per million containers (cmp) sold, slightly above the target for the year of 0.20 cmp. This information received forms an important part of our management systems and consumer complaint rates are disclosed in the Annual Integrated Report. 7.5 Sourcing Social • Labour • Human Rights • Fair Compensation for Labour • Fair Trade • Society • Product Responsibility • Traceability
27
• Genetically Modified Organisms Environment • Environment • Protecting Natural Resources • Minimising Toxicity • Biofuels • Animal Welfare Goals – Ensure that all goods and services purchased by Coca-Cola HBC are fully compliant with all environmental and social legislation Policy - Overall commitment to the six G3 (i.e. economic, environment, labour, etc.) and eight FPSS Aspects (i.e. fair trade, GMOs, etc.) listed above. • Supplier Guiding Principles • Code of Business Conduct Wherever possible, we source goods, ingredients and services locally. Performance The Company’s activities and performance are fully described and updated annually in the COP and Integrated reports. Purchasing Decision-Making Sustainability considerations are integrated into purchasing criteria. In addition to including SGPs in all supplier contracts, we require tier 1 suppliers to gain certification to the following standards: ISO 9001 (quality), ISO 14001 (environment) and OHSAS 18001 (health and safety). Ingredient and packaging suppliers must also achieve certification to FSSC 22000 certification for food safety and the Global Food Safety Initiative (GFSI). In 2013, we worked with suppliers to review the external standards for social and environmental performance towards which our suppliers are working. Starting in early 2014, we implemented consistent measurement and reporting of performance for sugar and other key suppliers. As we enhance our approach, we will focus further upstream to tier 2 suppliers. In our supplier assessment scorecard, sustainability performance accounts for 15% of total supplier score. Management Responsibility The Chief Procurement Officer is responsible for sourcing. Training and Awareness In 2013, we held further workshops with key suppliers to improve the sustainability of our agricultural supply chain. Building on our responsible sourcing guidelines for sugar, we reviewed the various external standards for social and environmental performance towards which our suppliers are working. Starting in early 2014, we implemented consistent measurement and reporting of performance for sugar and other key suppliers. As we enhance our approach, we will focus further upstream to tier 2 suppliers. Monitoring and Follow-Up Independent audits assess how well our suppliers comply with the Supplier Guiding Principles. • Protecting Natural Resources – We have adopted purchasing criteria to minimise
impact on natural resources. Such criteria have been developed for all goods that have significant environmental impacts, including: packaging, cold drink equipment, IT equipment and vehicles.
28
• Minimising Toxicity – As part of our ISO14001 management system, we ensure that no toxic substance is discharged from our bottling operations. Cleaning and disinfecting agents are all compliant with food safety requirements and are biodegraded in the wastewater treatment process.
• Fair Trade – We do not currently market products from certified fair trade suppliers. • Fair Compensation for Labour – Fair compensation is included in our Supplier
Guiding Principles. Suppliers are subject to audit and results are disclosed in our COP and Integrated reports
• Traceability – Traceability is an integral part of food safety management system
standards. By 2013, 67 bottling plants accounting for 99% of produced volume were certified against ISO 22000 and FSSC 22000 standards.
• Genetically Modified Organisms -- Given continued concern among consumers in
our territories, we do not use ingredients that are genetically modified or derived from GMOs.
• Animal Welfare -- Coca-Cola HBC does not conduct nor request animal testing in
order to substantiate the safety or efficacy of any of its products or raw ingredients • Biofuels – We do not encourage the use of biofuels when and where their production
competes with the production of food. We are looking into projects which could use biogas produced from waste in order to power our bottling operations.
7.6 Animal Welfare • Breeding and Genetics – Not applicable to Coca-Cola HBC • Animal Husbandry – Not applicable to Coca-Cola HBC • Transportation, Handling, and Slaughter – Not applicable to Coca-Cola HBC * * *
29
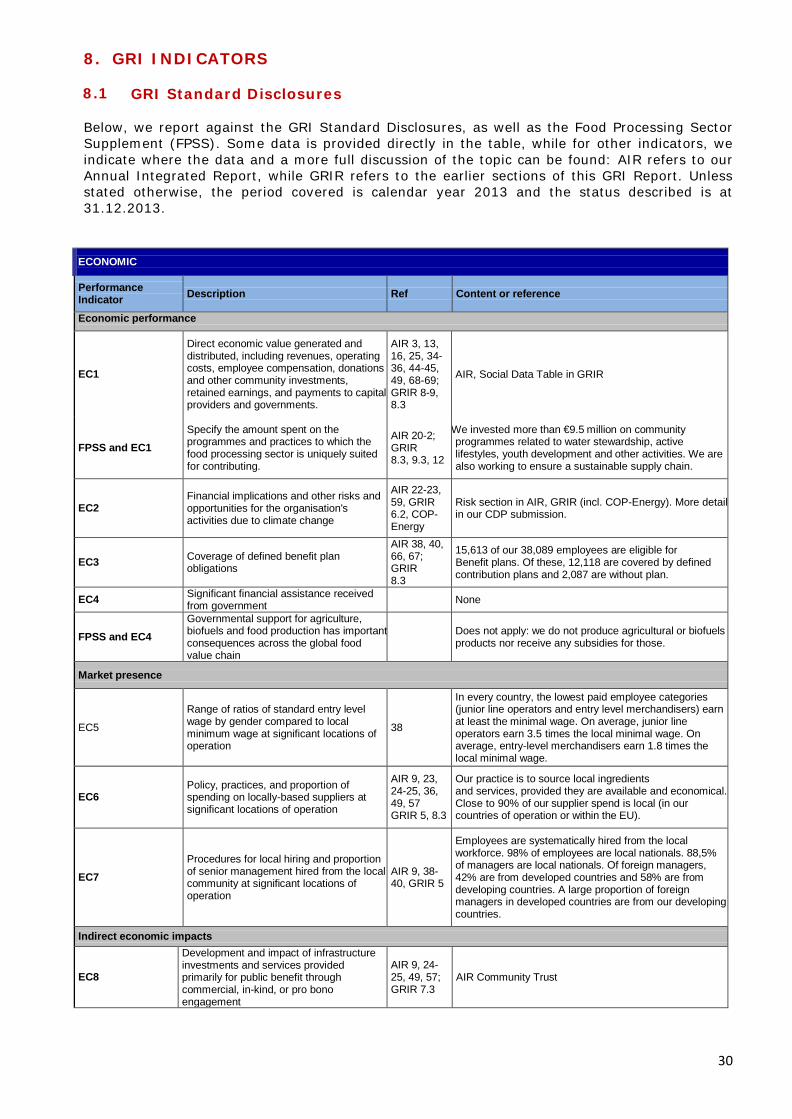
8. GRI INDICATORS 8.1 GRI Standard Disclosures Below, we report against the GRI Standard Disclosures, as well as the Food Processing Sector Supplement (FPSS). Some data is provided directly in the table, while for other indicators, we indicate where the data and a more full discussion of the topic can be found: AIR refers to our Annual Integrated Report, while GRIR refers to the earlier sections of this GRI Report. Unless stated otherwise, the period covered is calendar year 2013 and the status described is at 31.12.2013.
ECONOMIC
Performance Indicator Description Ref Content or reference
Economic performance
EC1
Direct economic value generated and distributed, including revenues, operating costs, employee compensation, donations and other community investments, retained earnings, and payments to capital providers and governments.
AIR 3, 13, 16, 25, 34-36, 44-45, 49, 68-69; GRIR 8-9, 8.3
AIR, Social Data Table in GRIR
FPSS and EC1
Specify the amount spent on the programmes and practices to which the food processing sector is uniquely suited for contributing.
AIR 20-2; GRIR 8.3, 9.3, 12
We invested more than €9.5 million on community programmes related to water stewardship, active lifestyles, youth development and other activities. We are also working to ensure a sustainable supply chain.
EC2 Financial implications and other risks and opportunities for the organisation's activities due to climate change
AIR 22-23, 59, GRIR 6.2, COP-Energy
Risk section in AIR, GRIR (incl. COP-Energy). More detail in our CDP submission.
EC3 Coverage of defined benefit plan obligations
AIR 38, 40, 66, 67; GRIR 8.3
15,613 of our 38,089 employees are eligible for Benefit plans. Of these, 12,118 are covered by defined contribution plans and 2,087 are without plan.
EC4 Significant financial assistance received from government None
FPSS and EC4
Governmental support for agriculture, biofuels and food production has important consequences across the global food value chain
Does not apply: we do not produce agricultural or biofuels products nor receive any subsidies for those.
Market presence
EC5
Range of ratios of standard entry level wage by gender compared to local minimum wage at significant locations of operation
38
In every country, the lowest paid employee categories (junior line operators and entry level merchandisers) earn at least the minimal wage. On average, junior line operators earn 3.5 times the local minimal wage. On average, entry-level merchandisers earn 1.8 times the local minimal wage.
EC6 Policy, practices, and proportion of spending on locally-based suppliers at significant locations of operation
AIR 9, 23, 24-25, 36, 49, 57 GRIR 5, 8.3
Our practice is to source local ingredients and services, provided they are available and economical. Close to 90% of our supplier spend is local (in our countries of operation or within the EU).
EC7
Procedures for local hiring and proportion of senior management hired from the local community at significant locations of operation
AIR 9, 38-40, GRIR 5
Employees are systematically hired from the local workforce. 98% of employees are local nationals. 88,5% of managers are local nationals. Of foreign managers, 42% are from developed countries and 58% are from developing countries. A large proportion of foreign managers in developed countries are from our developing countries.
Indirect economic impacts
EC8
Development and impact of infrastructure investments and services provided primarily for public benefit through commercial, in-kind, or pro bono engagement
AIR 9, 24-25, 49, 57; GRIR 7.3
AIR Community Trust
30
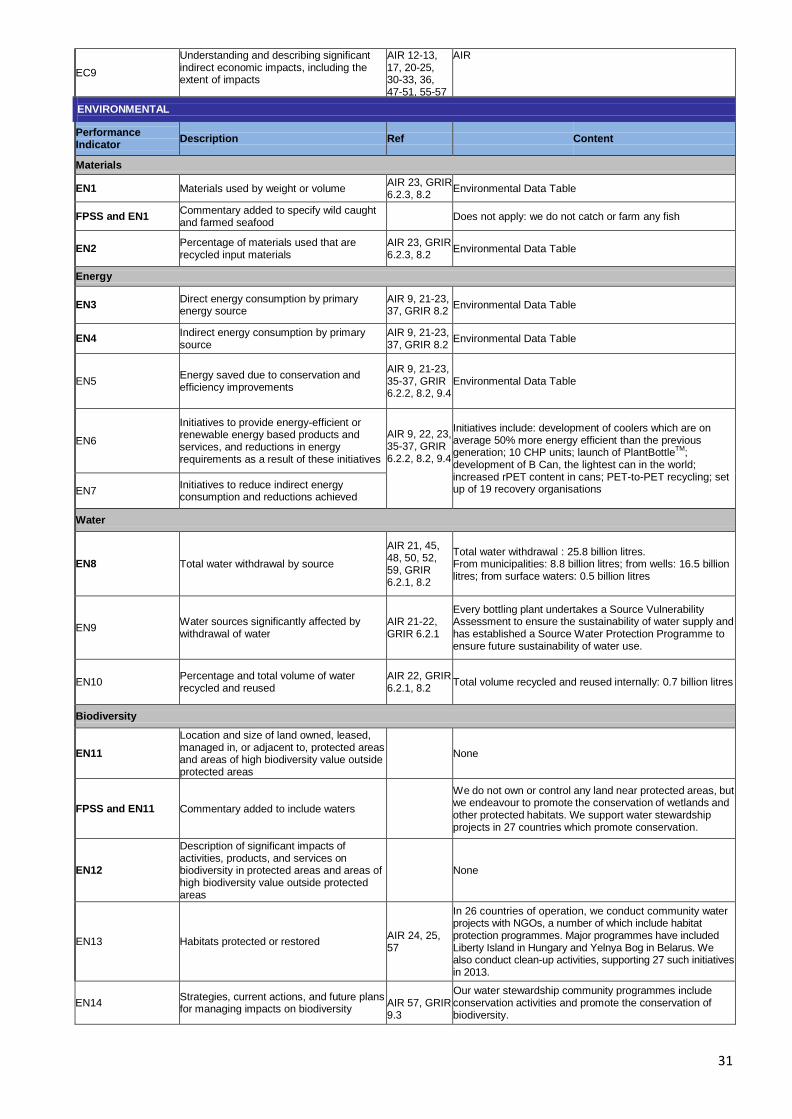
EC9 Understanding and describing significant indirect economic impacts, including the extent of impacts
AIR 12-13, 17, 20-25, 30-33, 36, 47-51, 55-57
AIR
ENVIRONMENTAL
Performance Indicator Description Ref Content
Materials
EN1 Materials used by weight or volume AIR 23, GRIR 6.2.3, 8.2 Environmental Data Table
FPSS and EN1 Commentary added to specify wild caught and farmed seafood
Does not apply: we do not catch or farm any fish
EN2 Percentage of materials used that are recycled input materials
AIR 23, GRIR 6.2.3, 8.2 Environmental Data Table
Energy
EN3 Direct energy consumption by primary energy source
AIR 9, 21-23, 37, GRIR 8.2 Environmental Data Table
EN4 Indirect energy consumption by primary source
AIR 9, 21-23, 37, GRIR 8.2 Environmental Data Table
EN5 Energy saved due to conservation and efficiency improvements
AIR 9, 21-23, 35-37, GRIR 6.2.2, 8.2, 9.4
Environmental Data Table
EN6
Initiatives to provide energy-efficient or renewable energy based products and services, and reductions in energy requirements as a result of these initiatives
AIR 9, 22, 23, 35-37, GRIR 6.2.2, 8.2, 9.4
Initiatives include: development of coolers which are on average 50% more energy efficient than the previous generation; 10 CHP units; launch of PlantBottleTM; development of B Can, the lightest can in the world; increased rPET content in cans; PET-to-PET recycling; set up of 19 recovery organisations EN7 Initiatives to reduce indirect energy
consumption and reductions achieved
Water
EN8 Total water withdrawal by source
AIR 21, 45, 48, 50, 52, 59, GRIR 6.2.1, 8.2
Total water withdrawal : 25.8 billion litres. From municipalities: 8.8 billion litres; from wells: 16.5 billion litres; from surface waters: 0.5 billion litres
EN9 Water sources significantly affected by withdrawal of water
AIR 21-22, GRIR 6.2.1
Every bottling plant undertakes a Source Vulnerability Assessment to ensure the sustainability of water supply and has established a Source Water Protection Programme to ensure future sustainability of water use.
EN10 Percentage and total volume of water recycled and reused
AIR 22, GRIR 6.2.1, 8.2 Total volume recycled and reused internally: 0.7 billion litres
Biodiversity
EN11
Location and size of land owned, leased, managed in, or adjacent to, protected areas and areas of high biodiversity value outside protected areas
None
FPSS and EN11 Commentary added to include waters
We do not own or control any land near protected areas, but we endeavour to promote the conservation of wetlands and other protected habitats. We support water stewardship projects in 27 countries which promote conservation.
EN12
Description of significant impacts of activities, products, and services on biodiversity in protected areas and areas of high biodiversity value outside protected areas
None
EN13 Habitats protected or restored AIR 24, 25, 57
In 26 countries of operation, we conduct community water projects with NGOs, a number of which include habitat protection programmes. Major programmes have included Liberty Island in Hungary and Yelnya Bog in Belarus. We also conduct clean-up activities, supporting 27 such initiatives in 2013.
EN14 Strategies, current actions, and future plans for managing impacts on biodiversity
AIR 57, GRIR 9.3
Our water stewardship community programmes include conservation activities and promote the conservation of biodiversity.
31
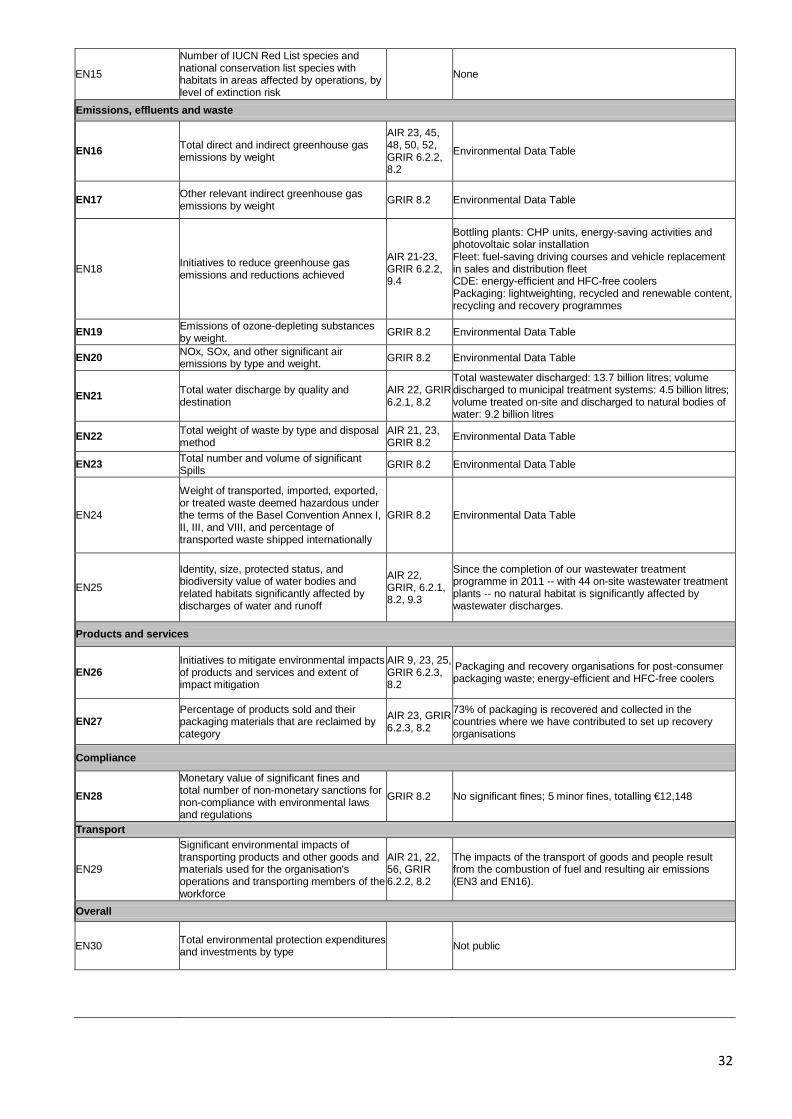
EN15
Number of IUCN Red List species and national conservation list species with habitats in areas affected by operations, by level of extinction risk
None
Emissions, effluents and waste
EN16 Total direct and indirect greenhouse gas emissions by weight
AIR 23, 45, 48, 50, 52, GRIR 6.2.2, 8.2
Environmental Data Table
EN17 Other relevant indirect greenhouse gas emissions by weight GRIR 8.2 Environmental Data Table
EN18 Initiatives to reduce greenhouse gas emissions and reductions achieved
AIR 21-23, GRIR 6.2.2, 9.4
Bottling plants: CHP units, energy-saving activities and photovoltaic solar installation Fleet: fuel-saving driving courses and vehicle replacement in sales and distribution fleet CDE: energy-efficient and HFC-free coolers Packaging: lightweighting, recycled and renewable content, recycling and recovery programmes
EN19 Emissions of ozone-depleting substances by weight. GRIR 8.2 Environmental Data Table
EN20 NOx, SOx, and other significant air emissions by type and weight. GRIR 8.2 Environmental Data Table
EN21 Total water discharge by quality and destination
AIR 22, GRIR 6.2.1, 8.2
Total wastewater discharged: 13.7 billion litres; volume discharged to municipal treatment systems: 4.5 billion litres; volume treated on-site and discharged to natural bodies of water: 9.2 billion litres
EN22 Total weight of waste by type and disposal method
AIR 21, 23, GRIR 8.2 Environmental Data Table
EN23 Total number and volume of significant Spills GRIR 8.2 Environmental Data Table
EN24
Weight of transported, imported, exported, or treated waste deemed hazardous under the terms of the Basel Convention Annex I, II, III, and VIII, and percentage of transported waste shipped internationally
GRIR 8.2 Environmental Data Table
EN25
Identity, size, protected status, and biodiversity value of water bodies and related habitats significantly affected by discharges of water and runoff
AIR 22, GRIR, 6.2.1, 8.2, 9.3
Since the completion of our wastewater treatment programme in 2011 -- with 44 on-site wastewater treatment plants -- no natural habitat is significantly affected by wastewater discharges.
Products and services
EN26 Initiatives to mitigate environmental impacts of products and services and extent of impact mitigation
AIR 9, 23, 25, GRIR 6.2.3, 8.2
Packaging and recovery organisations for post-consumer packaging waste; energy-efficient and HFC-free coolers
EN27 Percentage of products sold and their packaging materials that are reclaimed by category
AIR 23, GRIR 6.2.3, 8.2
73% of packaging is recovered and collected in the countries where we have contributed to set up recovery organisations
Compliance
EN28
Monetary value of significant fines and total number of non-monetary sanctions for non-compliance with environmental laws and regulations
GRIR 8.2 No significant fines; 5 minor fines, totalling €12,148
Transport
EN29
Significant environmental impacts of transporting products and other goods and materials used for the organisation's operations and transporting members of the workforce
AIR 21, 22, 56, GRIR 6.2.2, 8.2
The impacts of the transport of goods and people result from the combustion of fuel and resulting air emissions (EN3 and EN16).
Overall
EN30 Total environmental protection expenditures and investments by type Not public
32
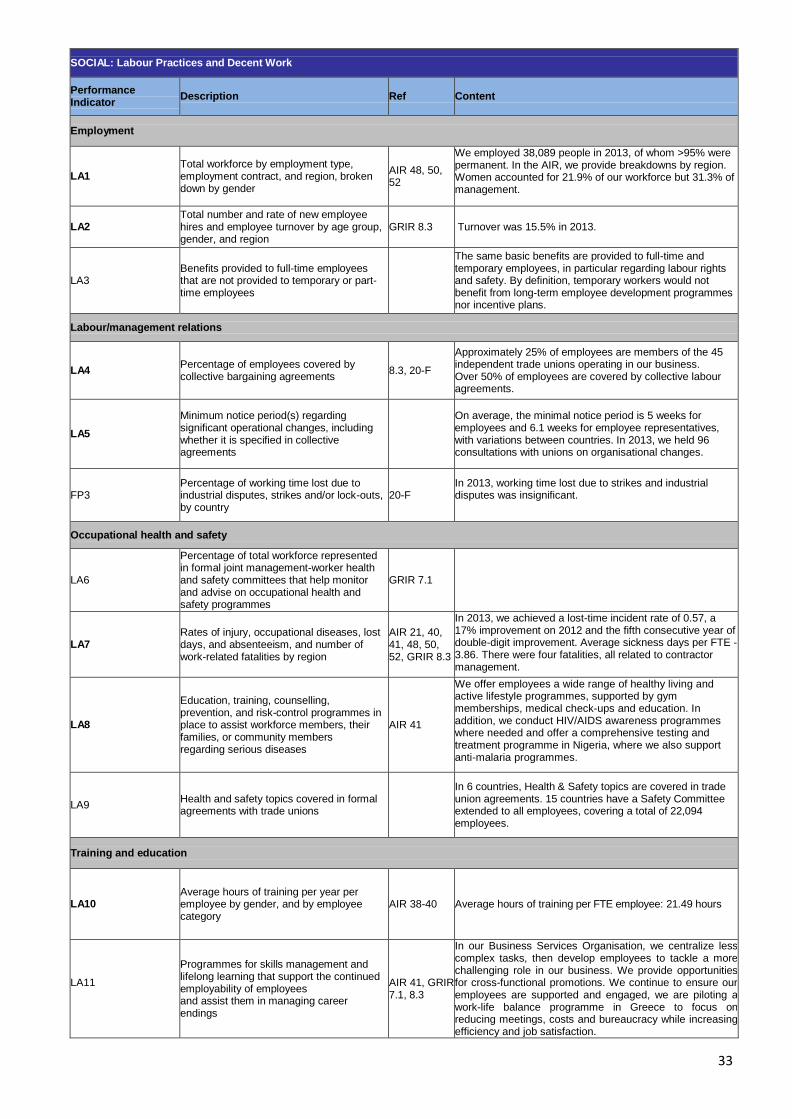
SOCIAL: Labour Practices and Decent Work
Performance Indicator Description Ref Content
Employment
LA1 Total workforce by employment type, employment contract, and region, broken down by gender
AIR 48, 50, 52
We employed 38,089 people in 2013, of whom >95% were permanent. In the AIR, we provide breakdowns by region. Women accounted for 21.9% of our workforce but 31.3% of management.
LA2 Total number and rate of new employee hires and employee turnover by age group, gender, and region
GRIR 8.3 Turnover was 15.5% in 2013.
LA3 Benefits provided to full-time employees that are not provided to temporary or part-time employees
The same basic benefits are provided to full-time and temporary employees, in particular regarding labour rights and safety. By definition, temporary workers would not benefit from long-term employee development programmes nor incentive plans.
Labour/management relations
LA4 Percentage of employees covered by collective bargaining agreements 8.3, 20-F
Approximately 25% of employees are members of the 45 independent trade unions operating in our business. Over 50% of employees are covered by collective labour agreements.
LA5
Minimum notice period(s) regarding significant operational changes, including whether it is specified in collective agreements
On average, the minimal notice period is 5 weeks for employees and 6.1 weeks for employee representatives, with variations between countries. In 2013, we held 96 consultations with unions on organisational changes.
FP3 Percentage of working time lost due to industrial disputes, strikes and/or lock-outs, by country
20-F In 2013, working time lost due to strikes and industrial disputes was insignificant.
Occupational health and safety
LA6
Percentage of total workforce represented in formal joint management-worker health and safety committees that help monitor and advise on occupational health and safety programmes
GRIR 7.1
LA7 Rates of injury, occupational diseases, lost days, and absenteeism, and number of work-related fatalities by region
AIR 21, 40, 41, 48, 50, 52, GRIR 8.3
In 2013, we achieved a lost-time incident rate of 0.57, a 17% improvement on 2012 and the fifth consecutive year of double-digit improvement. Average sickness days per FTE - 3.86. There were four fatalities, all related to contractor management.
LA8
Education, training, counselling, prevention, and risk-control programmes in place to assist workforce members, their families, or community members regarding serious diseases
AIR 41
We offer employees a wide range of healthy living and active lifestyle programmes, supported by gym memberships, medical check-ups and education. In addition, we conduct HIV/AIDS awareness programmes where needed and offer a comprehensive testing and treatment programme in Nigeria, where we also support anti-malaria programmes.
LA9 Health and safety topics covered in formal agreements with trade unions
In 6 countries, Health & Safety topics are covered in trade union agreements. 15 countries have a Safety Committee extended to all employees, covering a total of 22,094 employees.
Training and education
LA10 Average hours of training per year per employee by gender, and by employee category
AIR 38-40 Average hours of training per FTE employee: 21.49 hours
LA11
Programmes for skills management and lifelong learning that support the continued employability of employees and assist them in managing career endings
AIR 41, GRIR 7.1, 8.3
In our Business Services Organisation, we centralize less complex tasks, then develop employees to tackle a more challenging role in our business. We provide opportunities for cross-functional promotions. We continue to ensure our employees are supported and engaged, we are piloting a work-life balance programme in Greece to focus on reducing meetings, costs and bureaucracy while increasing efficiency and job satisfaction.
33
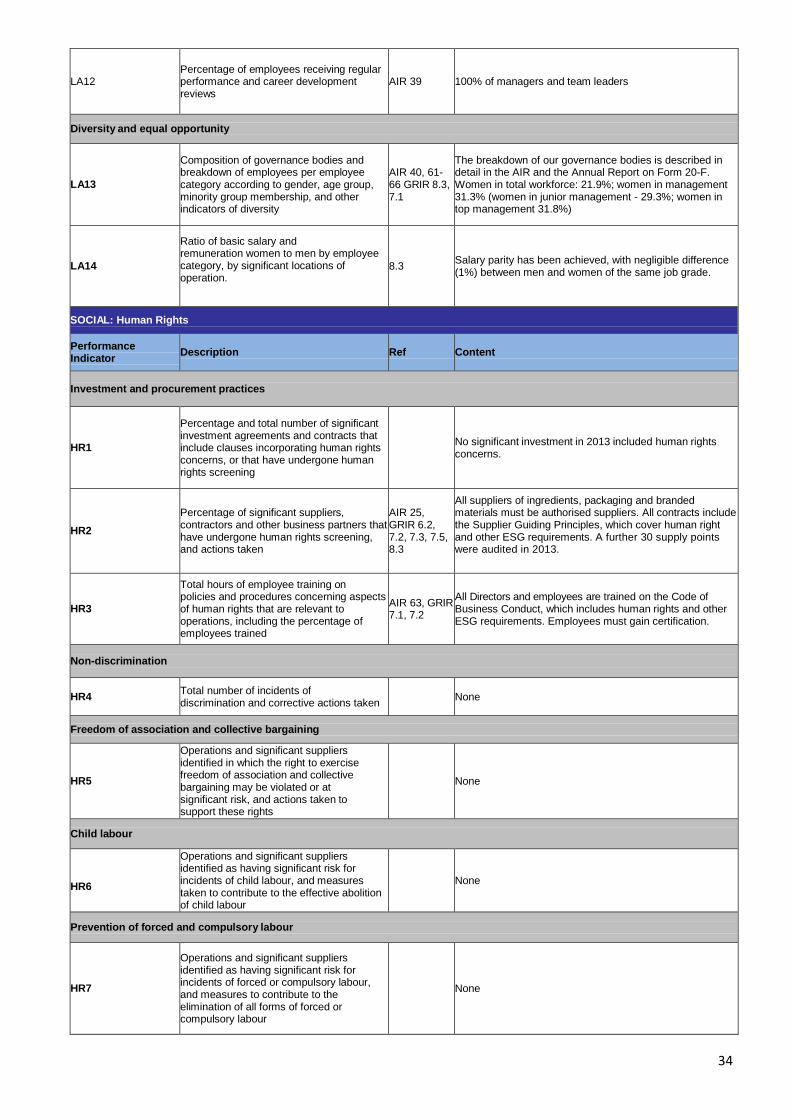
LA12 Percentage of employees receiving regular performance and career development reviews
AIR 39 100% of managers and team leaders
Diversity and equal opportunity
LA13
Composition of governance bodies and breakdown of employees per employee category according to gender, age group, minority group membership, and other indicators of diversity
AIR 40, 61-66 GRIR 8.3, 7.1
The breakdown of our governance bodies is described in detail in the AIR and the Annual Report on Form 20-F. Women in total workforce: 21.9%; women in management 31.3% (women in junior management - 29.3%; women in top management 31.8%)
LA14
Ratio of basic salary and remuneration women to men by employee category, by significant locations of operation.
8.3 Salary parity has been achieved, with negligible difference (1%) between men and women of the same job grade.
SOCIAL: Human Rights
Performance Indicator Description Ref Content
Investment and procurement practices
HR1
Percentage and total number of significant investment agreements and contracts that include clauses incorporating human rights concerns, or that have undergone human rights screening
No significant investment in 2013 included human rights concerns.
HR2
Percentage of significant suppliers, contractors and other business partners that have undergone human rights screening, and actions taken
AIR 25, GRIR 6.2, 7.2, 7.3, 7.5, 8.3
All suppliers of ingredients, packaging and branded materials must be authorised suppliers. All contracts include the Supplier Guiding Principles, which cover human right and other ESG requirements. A further 30 supply points were audited in 2013.
HR3
Total hours of employee training on policies and procedures concerning aspects of human rights that are relevant to operations, including the percentage of employees trained
AIR 63, GRIR 7.1, 7.2
All Directors and employees are trained on the Code of Business Conduct, which includes human rights and other ESG requirements. Employees must gain certification.
Non-discrimination
HR4 Total number of incidents of discrimination and corrective actions taken None
Freedom of association and collective bargaining
HR5
Operations and significant suppliers identified in which the right to exercise freedom of association and collective bargaining may be violated or at significant risk, and actions taken to support these rights
None
Child labour
HR6
Operations and significant suppliers identified as having significant risk for incidents of child labour, and measures taken to contribute to the effective abolition of child labour
None
Prevention of forced and compulsory labour
HR7
Operations and significant suppliers identified as having significant risk for incidents of forced or compulsory labour, and measures to contribute to the elimination of all forms of forced or compulsory labour
None
34
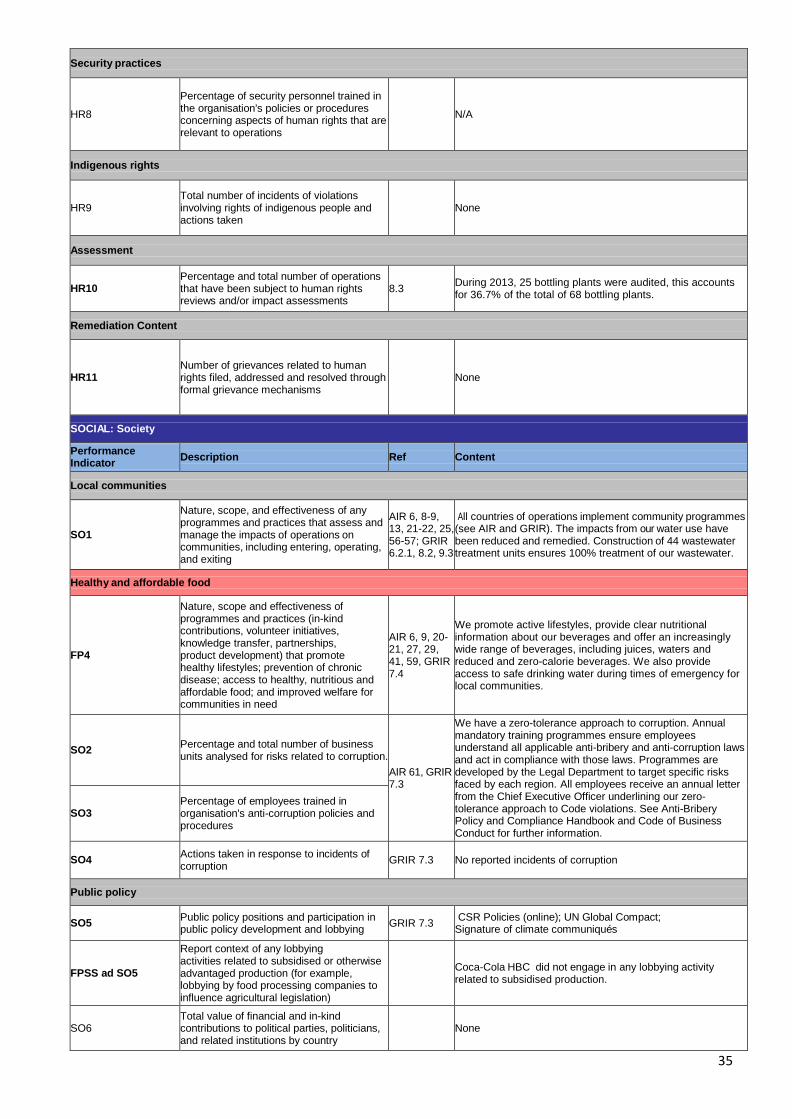
Security practices
HR8
Percentage of security personnel trained in the organisation's policies or procedures concerning aspects of human rights that are relevant to operations
N/A
Indigenous rights
HR9 Total number of incidents of violations involving rights of indigenous people and actions taken
None
Assessment
HR10 Percentage and total number of operations that have been subject to human rights reviews and/or impact assessments
8.3 During 2013, 25 bottling plants were audited, this accounts for 36.7% of the total of 68 bottling plants.
Remediation Content
HR11 Number of grievances related to human rights filed, addressed and resolved through formal grievance mechanisms
None
SOCIAL: Society
Performance Indicator Description Ref Content
Local communities
SO1
Nature, scope, and effectiveness of any programmes and practices that assess and manage the impacts of operations on communities, including entering, operating, and exiting
AIR 6, 8-9, 13, 21-22, 25, 56-57; GRIR 6.2.1, 8.2, 9.3
All countries of operations implement community programmes (see AIR and GRIR). The impacts from our water use have been reduced and remedied. Construction of 44 wastewater treatment units ensures 100% treatment of our wastewater.
Healthy and affordable food
FP4
Nature, scope and effectiveness of programmes and practices (in-kind contributions, volunteer initiatives, knowledge transfer, partnerships, product development) that promote healthy lifestyles; prevention of chronic disease; access to healthy, nutritious and affordable food; and improved welfare for communities in need
AIR 6, 9, 20-21, 27, 29, 41, 59, GRIR 7.4
We promote active lifestyles, provide clear nutritional information about our beverages and offer an increasingly wide range of beverages, including juices, waters and reduced and zero-calorie beverages. We also provide access to safe drinking water during times of emergency for local communities.
SO2 Percentage and total number of business units analysed for risks related to corruption.
AIR 61, GRIR 7.3
We have a zero-tolerance approach to corruption. Annual mandatory training programmes ensure employees understand all applicable anti-bribery and anti-corruption laws and act in compliance with those laws. Programmes are developed by the Legal Department to target specific risks faced by each region. All employees receive an annual letter from the Chief Executive Officer underlining our zero-tolerance approach to Code violations. See Anti-Bribery Policy and Compliance Handbook and Code of Business Conduct for further information.
SO3 Percentage of employees trained in organisation's anti-corruption policies and procedures
SO4 Actions taken in response to incidents of corruption GRIR 7.3 No reported incidents of corruption
Public policy
SO5 Public policy positions and participation in public policy development and lobbying GRIR 7.3 CSR Policies (online); UN Global Compact;
Signature of climate communiqués
FPSS ad SO5
Report context of any lobbying activities related to subsidised or otherwise advantaged production (for example, lobbying by food processing companies to influence agricultural legislation)
Coca-Cola HBC did not engage in any lobbying activity related to subsidised production.
SO6 Total value of financial and in-kind contributions to political parties, politicians, and related institutions by country
None
35
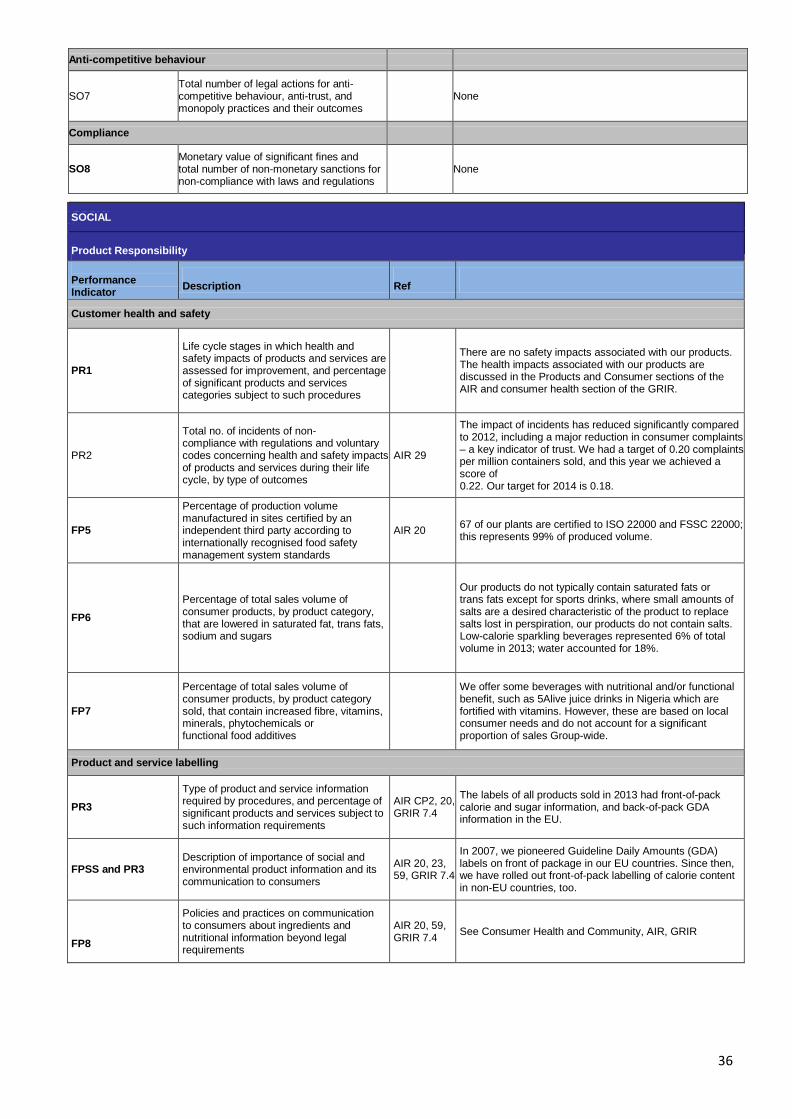
Anti-competitive behaviour
SO7 Total number of legal actions for anti- competitive behaviour, anti-trust, and monopoly practices and their outcomes
None
Compliance
SO8 Monetary value of significant fines and total number of non-monetary sanctions for non-compliance with laws and regulations
None
SOCIAL
SOCIAL
Product Responsibility Performance Indicator
Description
Ref
Customer health and safety
PR1
Life cycle stages in which health and safety impacts of products and services are assessed for improvement, and percentage of significant products and services categories subject to such procedures
There are no safety impacts associated with our products. The health impacts associated with our products are discussed in the Products and Consumer sections of the AIR and consumer health section of the GRIR.
PR2
Total no. of incidents of non- compliance with regulations and voluntary codes concerning health and safety impacts of products and services during their life cycle, by type of outcomes
AIR 29
The impact of incidents has reduced significantly compared to 2012, including a major reduction in consumer complaints – a key indicator of trust. We had a target of 0.20 complaints per million containers sold, and this year we achieved a score of 0.22. Our target for 2014 is 0.18.
FP5
Percentage of production volume manufactured in sites certified by an independent third party according to internationally recognised food safety management system standards
AIR 20 67 of our plants are certified to ISO 22000 and FSSC 22000; this represents 99% of produced volume.
FP6
Percentage of total sales volume of consumer products, by product category, that are lowered in saturated fat, trans fats, sodium and sugars
Our products do not typically contain saturated fats or trans fats except for sports drinks, where small amounts of salts are a desired characteristic of the product to replace salts lost in perspiration, our products do not contain salts. Low-calorie sparkling beverages represented 6% of total volume in 2013; water accounted for 18%.
FP7
Percentage of total sales volume of consumer products, by product category sold, that contain increased fibre, vitamins, minerals, phytochemicals or functional food additives
We offer some beverages with nutritional and/or functional benefit, such as 5Alive juice drinks in Nigeria which are fortified with vitamins. However, these are based on local consumer needs and do not account for a significant proportion of sales Group-wide.
Product and service labelling
PR3
Type of product and service information required by procedures, and percentage of significant products and services subject to such information requirements
AIR CP2, 20, GRIR 7.4
The labels of all products sold in 2013 had front-of-pack calorie and sugar information, and back-of-pack GDA information in the EU.
FPSS and PR3 Description of importance of social and environmental product information and its communication to consumers
AIR 20, 23, 59, GRIR 7.4
In 2007, we pioneered Guideline Daily Amounts (GDA) labels on front of package in our EU countries. Since then, we have rolled out front-of-pack labelling of calorie content in non-EU countries, too.
FP8
Policies and practices on communication to consumers about ingredients and nutritional information beyond legal requirements
AIR 20, 59, GRIR 7.4 See Consumer Health and Community, AIR, GRIR
36
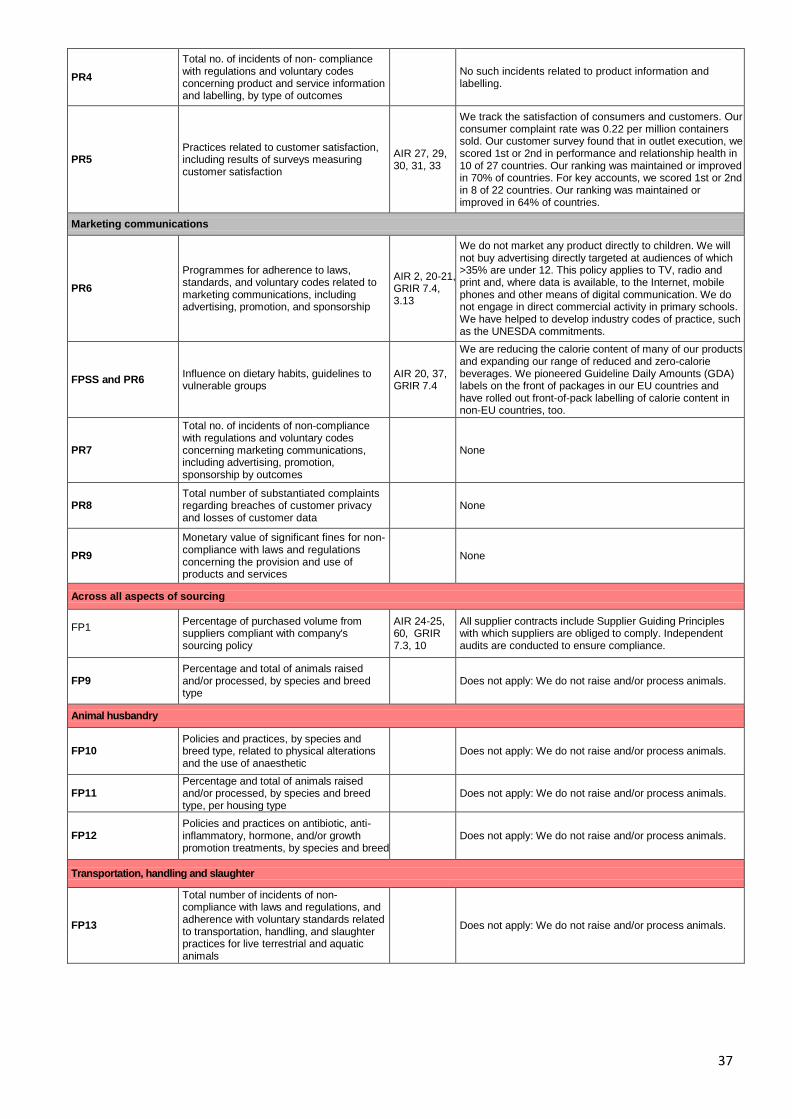
PR4 Total no. of incidents of non- compliance with regulations and voluntary codes concerning product and service information and labelling, by type of outcomes
No such incidents related to product information and labelling.
PR5 Practices related to customer satisfaction, including results of surveys measuring customer satisfaction
AIR 27, 29, 30, 31, 33
We track the satisfaction of consumers and customers. Our consumer complaint rate was 0.22 per million containers sold. Our customer survey found that in outlet execution, we scored 1st or 2nd in performance and relationship health in 10 of 27 countries. Our ranking was maintained or improved in 70% of countries. For key accounts, we scored 1st or 2nd in 8 of 22 countries. Our ranking was maintained or improved in 64% of countries.
Marketing communications
PR6
Programmes for adherence to laws, standards, and voluntary codes related to marketing communications, including advertising, promotion, and sponsorship
AIR 2, 20-21, GRIR 7.4, 3.13
We do not market any product directly to children. We will not buy advertising directly targeted at audiences of which >35% are under 12. This policy applies to TV, radio and print and, where data is available, to the Internet, mobile phones and other means of digital communication. We do not engage in direct commercial activity in primary schools. We have helped to develop industry codes of practice, such as the UNESDA commitments.
FPSS and PR6 Influence on dietary habits, guidelines to vulnerable groups
AIR 20, 37, GRIR 7.4
We are reducing the calorie content of many of our products and expanding our range of reduced and zero-calorie beverages. We pioneered Guideline Daily Amounts (GDA) labels on the front of packages in our EU countries and have rolled out front-of-pack labelling of calorie content in non-EU countries, too.
PR7
Total no. of incidents of non-compliance with regulations and voluntary codes concerning marketing communications, including advertising, promotion, sponsorship by outcomes
None
PR8 Total number of substantiated complaints regarding breaches of customer privacy and losses of customer data
None
PR9 Monetary value of significant fines for non-compliance with laws and regulations concerning the provision and use of products and services
None
Across all aspects of sourcing
FP1 FP1
Percentage of purchased volume from suppliers compliant with company's sourcing policy
AIR 24-25, 60, GRIR 7.3, 10
All supplier contracts include Supplier Guiding Principles with which suppliers are obliged to comply. Independent audits are conducted to ensure compliance.
FP9 Percentage and total of animals raised and/or processed, by species and breed type
Does not apply: We do not raise and/or process animals.
Animal husbandry
FP10 Policies and practices, by species and breed type, related to physical alterations and the use of anaesthetic
Does not apply: We do not raise and/or process animals.
FP11 Percentage and total of animals raised and/or processed, by species and breed type, per housing type
Does not apply: We do not raise and/or process animals.
FP12 Policies and practices on antibiotic, anti-inflammatory, hormone, and/or growth promotion treatments, by species and breed
Does not apply: We do not raise and/or process animals.
Transportation, handling and slaughter
FP13
Total number of incidents of non-compliance with laws and regulations, and adherence with voluntary standards related to transportation, handling, and slaughter practices for live terrestrial and aquatic animals
Does not apply: We do not raise and/or process animals.
37
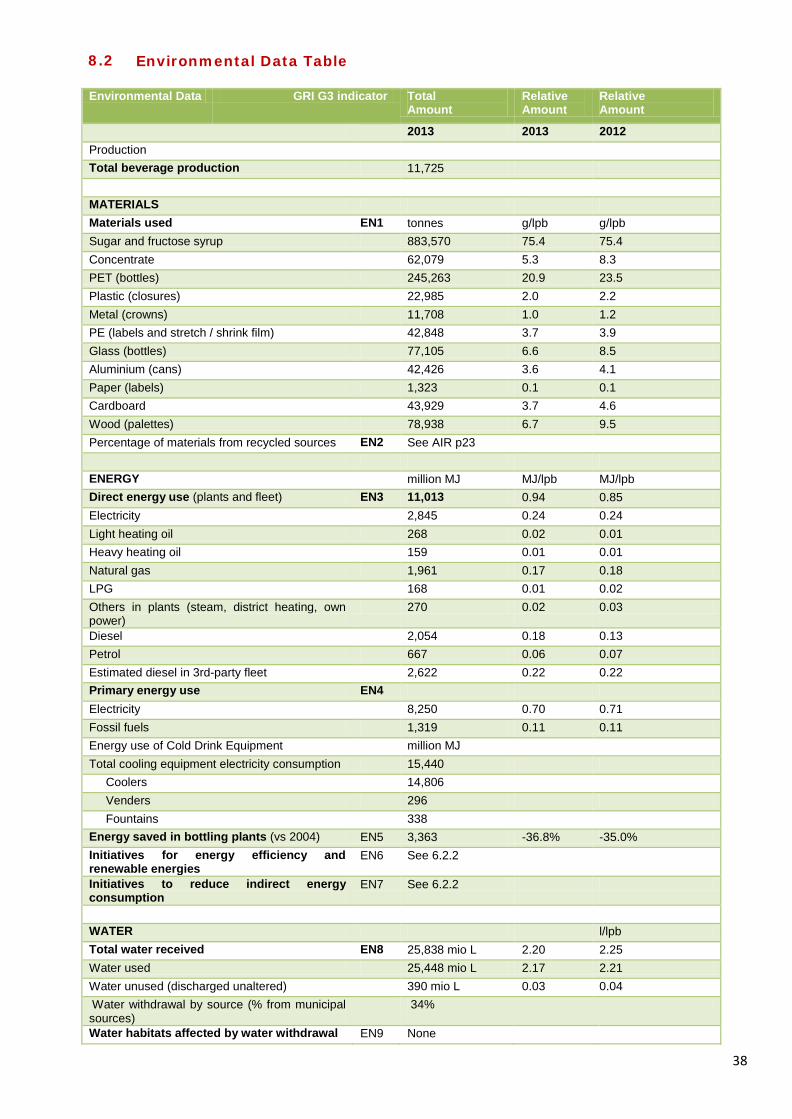
8.2 Environmental Data Table
Environmental Data GRI G3 indicator Total Amount
Relative Amount
Relative Amount
2013 2013 2012 Production Total beverage production 11,725 MATERIALS Materials used EN1 tonnes g/lpb g/lpb Sugar and fructose syrup 883,570 75.4 75.4 Concentrate 62,079 5.3 8.3 PET (bottles) 245,263 20.9 23.5 Plastic (closures) 22,985 2.0 2.2 Metal (crowns) 11,708 1.0 1.2 PE (labels and stretch / shrink film) 42,848 3.7 3.9 Glass (bottles) 77,105 6.6 8.5 Aluminium (cans) 42,426 3.6 4.1 Paper (labels) 1,323 0.1 0.1 Cardboard 43,929 3.7 4.6 Wood (palettes) 78,938 6.7 9.5 Percentage of materials from recycled sources EN2 See AIR p23 ENERGY million MJ MJ/lpb MJ/lpb Direct energy use (plants and fleet) EN3 11,013 0.94 0.85 Electricity 2,845 0.24 0.24 Light heating oil 268 0.02 0.01 Heavy heating oil 159 0.01 0.01 Natural gas 1,961 0.17 0.18 LPG 168 0.01 0.02 Others in plants (steam, district heating, own power)
270 0.02 0.03
Diesel 2,054 0.18 0.13 Petrol 667 0.06 0.07 Estimated diesel in 3rd-party fleet 2,622 0.22 0.22 Primary energy use EN4 Electricity 8,250 0.70 0.71 Fossil fuels 1,319 0.11 0.11 Energy use of Cold Drink Equipment million MJ Total cooling equipment electricity consumption 15,440 Coolers 14,806 Venders 296 Fountains 338 Energy saved in bottling plants (vs 2004) EN5 3,363 -36.8% -35.0% Initiatives for energy efficiency and renewable energies
EN6 See 6.2.2
Initiatives to reduce indirect energy consumption
EN7 See 6.2.2
WATER l/lpb Total water received EN8 25,838 mio L 2.20 2.25 Water used 25,448 mio L 2.17 2.21 Water unused (discharged unaltered) 390 mio L 0.03 0.04 Water withdrawal by source (% from municipal sources)
34%
Water habitats affected by water withdrawal EN9 None
38
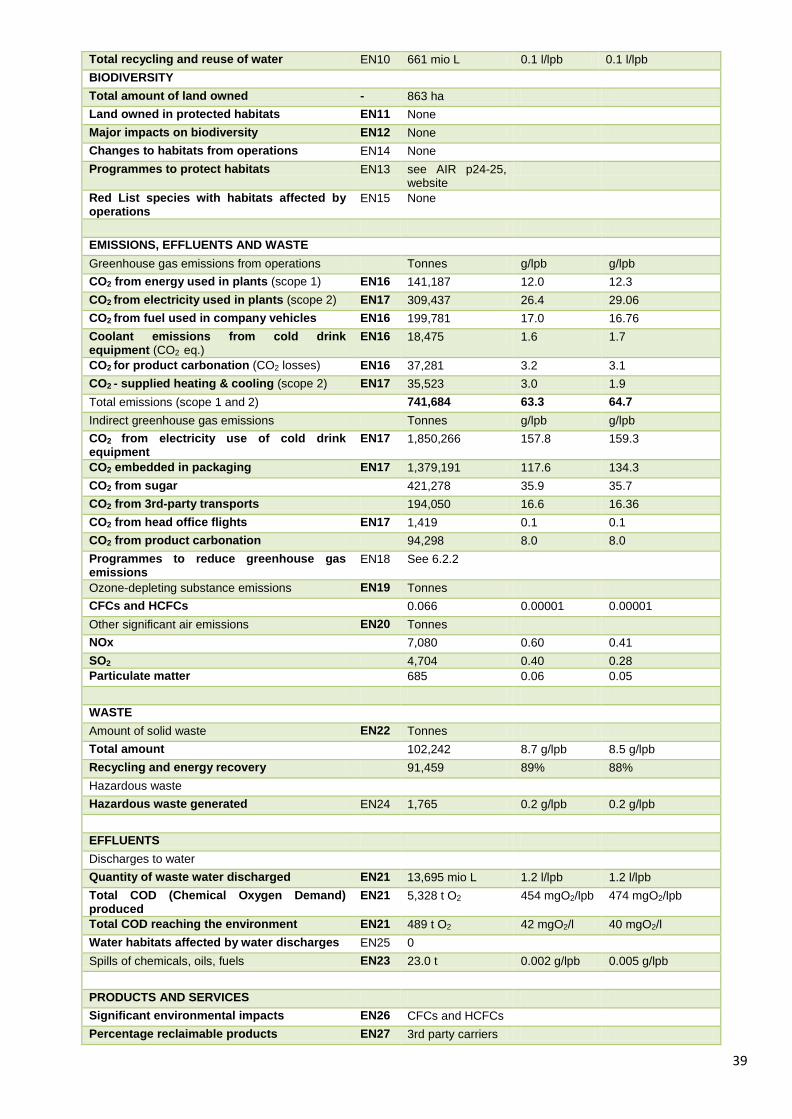
Total recycling and reuse of water EN10 661 mio L 0.1 l/lpb 0.1 l/lpb BIODIVERSITY Total amount of land owned - 863 ha Land owned in protected habitats EN11 None Major impacts on biodiversity EN12 None Changes to habitats from operations EN14 None Programmes to protect habitats EN13 see AIR p24-25,
website
Red List species with habitats affected by operations
EN15 None
EMISSIONS, EFFLUENTS AND WASTE Greenhouse gas emissions from operations Tonnes g/lpb g/lpb CO2 from energy used in plants (scope 1) EN16 141,187 12.0 12.3 CO2 from electricity used in plants (scope 2) EN17 309,437 26.4 29.06 CO2 from fuel used in company vehicles EN16 199,781 17.0 16.76 Coolant emissions from cold drink equipment (CO2 eq.)
EN16 18,475 1.6 1.7
CO2 for product carbonation (CO2 losses) EN16 37,281 3.2 3.1 CO2 - supplied heating & cooling (scope 2) EN17 35,523 3.0 1.9 Total emissions (scope 1 and 2) 741,684 63.3 64.7 Indirect greenhouse gas emissions Tonnes g/lpb g/lpb CO2 from electricity use of cold drink equipment
EN17 1,850,266 157.8 159.3
CO2 embedded in packaging EN17 1,379,191 117.6 134.3 CO2 from sugar 421,278 35.9 35.7 CO2 from 3rd-party transports 194,050 16.6 16.36 CO2 from head office flights EN17 1,419 0.1 0.1 CO2 from product carbonation 94,298 8.0 8.0 Programmes to reduce greenhouse gas emissions
EN18 See 6.2.2
Ozone-depleting substance emissions EN19 Tonnes CFCs and HCFCs 0.066 0.00001 0.00001 Other significant air emissions EN20 Tonnes NOx 7,080 0.60 0.41 SO2 4,704 0.40 0.28 Particulate matter 685 0.06 0.05 WASTE Amount of solid waste EN22 Tonnes Total amount 102,242 8.7 g/lpb 8.5 g/lpb Recycling and energy recovery 91,459 89% 88% Hazardous waste Hazardous waste generated EN24 1,765 0.2 g/lpb 0.2 g/lpb EFFLUENTS Discharges to water Quantity of waste water discharged EN21 13,695 mio L 1.2 l/lpb 1.2 l/lpb Total COD (Chemical Oxygen Demand) produced
EN21 5,328 t O2 454 mgO2/lpb 474 mgO2/lpb
Total COD reaching the environment EN21 489 t O2 42 mgO2/l 40 mgO2/l Water habitats affected by water discharges EN25 0 Spills of chemicals, oils, fuels EN23 23.0 t 0.002 g/lpb 0.005 g/lpb PRODUCTS AND SERVICES Significant environmental impacts EN26 CFCs and HCFCs Percentage reclaimable products EN27 3rd party carriers
39
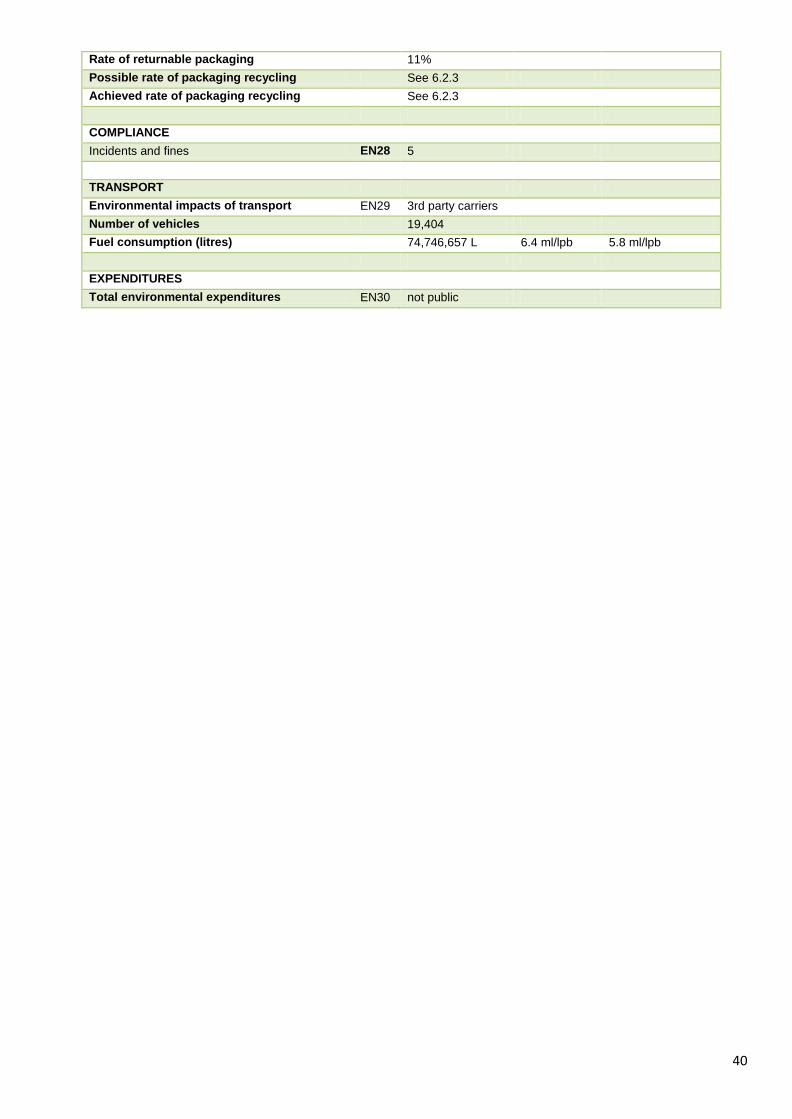
Rate of returnable packaging 11% Possible rate of packaging recycling See 6.2.3 Achieved rate of packaging recycling See 6.2.3 COMPLIANCE Incidents and fines EN28 5 TRANSPORT Environmental impacts of transport EN29 3rd party carriers Number of vehicles 19,404 Fuel consumption (litres) 74,746,657 L 6.4 ml/lpb 5.8 ml/lpb EXPENDITURES Total environmental expenditures EN30 not public
40
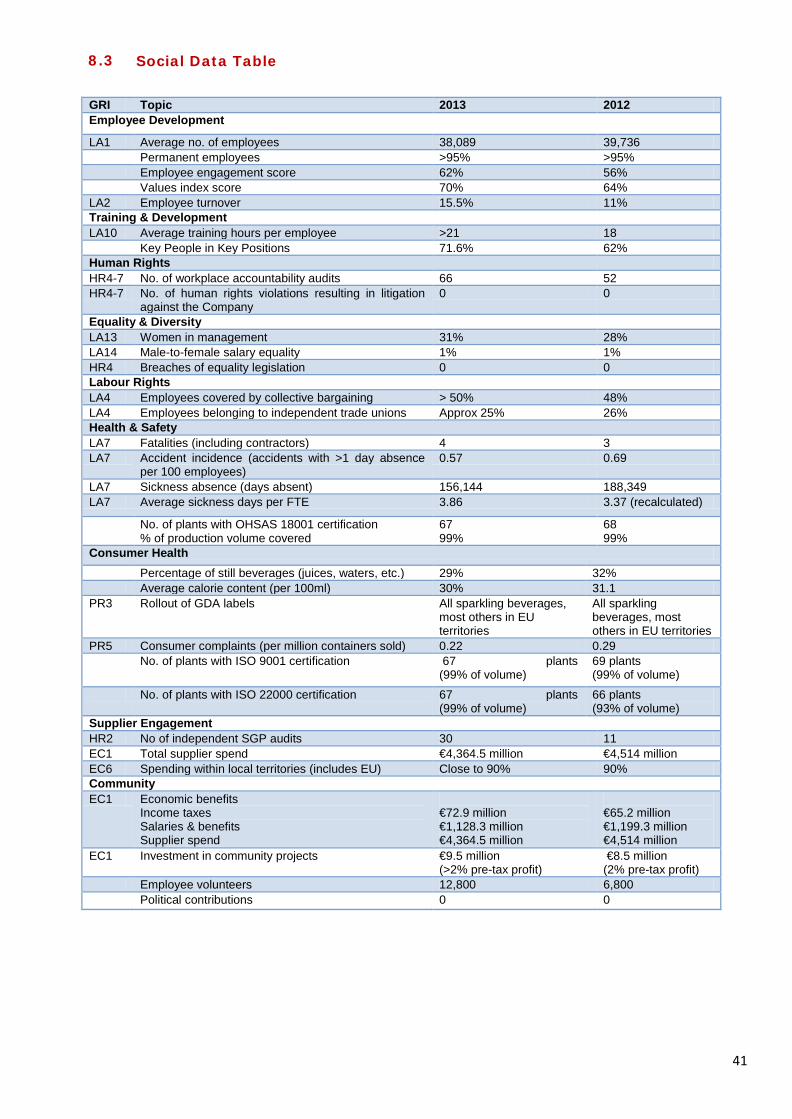
8.3 Social Data Table
GRI Topic 2013 2012 Employee Development
LA1 Average no. of employees 38,089 39,736 Permanent employees >95% >95% Employee engagement score 62% 56% Values index score 70% 64% LA2 Employee turnover 15.5% 11% Training & Development LA10 Average training hours per employee >21 18 Key People in Key Positions 71.6% 62% Human Rights HR4-7 No. of workplace accountability audits 66 52 HR4-7 No. of human rights violations resulting in litigation
against the Company 0 0
Equality & Diversity LA13 Women in management 31% 28% LA14 Male-to-female salary equality 1% 1% HR4 Breaches of equality legislation 0 0 Labour Rights LA4 Employees covered by collective bargaining > 50% 48% LA4 Employees belonging to independent trade unions Approx 25% 26% Health & Safety LA7 Fatalities (including contractors) 4 3 LA7 Accident incidence (accidents with >1 day absence
per 100 employees) 0.57 0.69
LA7 Sickness absence (days absent) 156,144 188,349 LA7 Average sickness days per FTE 3.86 3.37 (recalculated)
No. of plants with OHSAS 18001 certification % of production volume covered
67 99%
68 99%
Consumer Health Percentage of still beverages (juices, waters, etc.) 29% 32% Average calorie content (per 100ml) 30% 31.1 PR3 Rollout of GDA labels All sparkling beverages,
most others in EU territories
All sparkling beverages, most others in EU territories
PR5 Consumer complaints (per million containers sold) 0.22 0.29 No. of plants with ISO 9001 certification 67 plants
(99% of volume) 69 plants (99% of volume)
No. of plants with ISO 22000 certification 67 plants (99% of volume)
66 plants (93% of volume)
Supplier Engagement HR2 No of independent SGP audits 30 11 EC1 Total supplier spend €4,364.5 million €4,514 million EC6 Spending within local territories (includes EU) Close to 90% 90% Community EC1 Economic benefits
Income taxes Salaries & benefits Supplier spend
€72.9 million €1,128.3 million €4,364.5 million
€65.2 million €1,199.3 million €4,514 million
EC1 Investment in community projects €9.5 million (>2% pre-tax profit)
€8.5 million (2% pre-tax profit)
Employee volunteers 12,800 6,800 Political contributions 0 0
41
SECTION B 9. UN Global Compact - Communicating our Progress Coca-Cola HBC has participated in the UN Global Compact since 2005 and has worked to implement and promote the 10 principles in support of human rights, labour rights, environment and anti-corruption. We fulfill our commitments to the UN Global Compact: • Implementing the 10 Principles into Company operations and strategy • Working to make our supply chain more sustainable • Promoting development of Local Networks • Supporting the Compact’s global platforms • Contributing to broad UN development goals • Reporting transparently 9.1 GC Advanced Level Our Annual Integrated Report and this report serve as our Communication on Progress (COP) to the Global Compact. To achieve Advanced Level status requires that we meet the 21 criteria of the COP Differentiation programme. Below is a summary of these criteria and how we meet each one. 9.1.1 Mainstreaming into corporate functions and business units
We have integrated sustainability into the way we run our business. We identified material issues to our business and stakeholders and developed ambitious strategies, demanding targets, rigorous governance and integrated reporting. We have also implemented internationally recognised management systems. Almost all (99%) of our production volume now comes from plants that are certified for quality (ISO 9000), environment (ISO 14001), health and safety (OHSAS 18001) and food safety (ISO 22000 and FSSC 22000). 9.1.2 Value chain implementation
The greatest impacts of our business lie in our supply chain. We work with suppliers and others to address such issues as water use in our agricultural supply chain. We have also begun collaborative work with customers on joint sustainability initiatives. Together with The Coca-Cola Company, we are setting long-term sustainability targets for our business that include our supply chain in a lifecycle approach. Robust Human Rights Management Policies & Procedures 9.1.3 Robust commitments, strategies or policies in the area of human rights • Relevant policies include: Human Rights Policy, Equal Opportunities Policy, Supplier Guiding
Principles, Occupational Health and Safety Policy, HIV-AIDS policy. In addition, the human right to water is included in our Water Policy.
• In 2014, we will implement a new and comprehensive Workplace Rights Policy, after which we will conduct a first assessment into the implications of the UN Framework and Guiding Principles on Business and Human Rights (the Ruggie framework).
• We support the 5by20 programme of The Coca-Cola Company to empower 5 million women entrepreneurs by 2020. In Nigeria, 32,000 of our outlets are now managed by female entrepreneurs.
9.1.4 Effective management systems to integrate the human rights principles • Our commitments are integrated into management systems and training. • By 2013, 67 plants were certified to OHSAS 18001 -- 99% of production volume. • High-profile health and safety campaigns and gender diversity initiatives are among the
programmes which bring our commitments to life. 9.1.5 Effective monitoring and evaluation mechanisms of human rights integration • Regular reviews check that we adhere to all applicable laws and regulations, our Code of
Business Conduct and internal standards. 42
• Annual certification confirms that we are in legal compliance, processes are well implemented, targets are set and reached and reporting is timely and accurate.
• Both suppliers and Company-owned operations are subject to independent assessments of workplace conditions.
• We have a well-publicised whistleblower system, with all contacts investigated and reported to the Board.
• Coca-Cola Hellenic received no significant fines for non-compliance with human rights-related laws and regulations in 2013.
Robust Labour Management Policies & Procedures 9.1.6 Robust commitments, strategies or policies in the area of labour • Relevant policies include our Human Rights Policy and Supplier Guiding Principles. • We also have a commitment to engage in social dialogue. 9.1.7 Effective management systems to integrate the labour principles • These commitments are integrated into our management systems and training programmes. • We have independent unions and/or works councils as well as formal communications
protocol in 23 countries. During 2013, we conducted 96 consultations with unions on organisational changes.
• Comprehensive people development initiatives endeavour to ensure all employees achieve their potential.
• Salary parity has been achieved, with negligible difference (1%) between male and female employees of the same grade.
• Pay for entry-level positions is significantly above local minimum wage where one exists. • We conduct gender diversity programmes in our own operations. • In Nigeria, we work with the global Coca-Cola 5by20 programme which has earmarked $22
million financing to women micro-distributors in Nigeria. • We work to improve working conditions in informal packaging collection systems. • We participate in industry initiatives, e.g. AIM-Progress, SEDEX. 9.1.8 Effective monitoring and evaluation mechanisms of labour principles integration • Regular reviews check that we adhere to all applicable labour laws and regulations and
internal standards. • Independent audits are undertaken of both Company and supplier workplaces. • We have a well-publicised whistleblower system, with all contacts investigated and reported
to the Board. • Coca-Cola Hellenic received no significant fines for non-compliance with labour laws and
regulations in 2013. Robust Environmental Management Policies & Procedures 9.1.9 Robust commitments, strategies or policies in the area of environmental
stewardship • We have publicly available policies on water stewardship, climate change, packaging and
recycling. • Environmental targets to 2020 and performance are publicly reported. • Since 2011, 100% of wastewater is treated to a level that supports aquatic life. • We develop energy-efficient HFC-free refrigeration with suppliers - up to 63% more energy-
efficient than 2004 models. • We have committed to build 15 CHP units and have built 10 to date; another five in the next
two years. These reduce emissions from the bottling plant by at least 40%. 9.1.10 Effective management systems to integrate the environmental principles • By the end of 2013, 67 bottling plants had achieved ISO 14001 certification, accounting for
99% of our production volume. 9.1.11 Effective monitoring and evaluation mechanisms for environmental
stewardship • Regular reviews check that we adhere to all applicable environmental laws and regulations
and internal standards. 43
• Environmental management systems and data are audited annually by third-parties at all bottling plants.
• Compliance and continuous improvement are integral to our management systems. Annual targets are set and progress monitored by the Board and reported publicly.
• Coca-Cola Hellenic received no significant fines for non-compliance with environmental laws and regulations in 2013.
Robust Anti-Corruption Management Policies & Procedures 9.1.12 Robust commitments, strategies or policies in the area of anti-corruption • Coca-Cola HBC's zero-tolerance approach to corruption is made clear to employees, suppliers,
governments and others. • Our Code of Business Conduct defines how employees are expected to do business. In
addition to mandatory training, each employee receives an annual letter from our CEO underlining our zero-tolerance approach to corruption.
• Our Supplier Guiding Principles make clear the values and behaviour we expect in our value chain and are audited against.
• We have worked with Global Compact Local Networks and others to conduct anti-corruption initiatives.
9.1.13 Effective management systems to integrate the anti-corruption principle • All employees undergo mandatory training and certification in the Code. • All employees receive an annual letter from the Chief Executive Officer underlining our zero-
tolerance approach to violations of the Code. • Employees can raise concerns about conduct and compliance through various mechanisms,
including our confidential whistleblower hotline and email system. We also have an open door policy.
• We commit to protecting those who raise concerns in good faith from retaliation. 9.1.14 Effective monitoring and evaluation mechanisms for the integration of anti-
corruption • All contacts are investigated and results are reported to the Audit Committee. • All violations of our Code result in disciplinary action, even dismissal. • Our whistleblower system is independently audited each year. • Independent audits of supplier sites are conducted. In 2013, 30 audits took place. Action in Support of Broader UN Goals and Issues 9.1.15 Core business contributions to UN goals and issues • Coca-Cola Hellenic’s primary contribution is through core business activities. We have 68
bottling plants, 324 distribution centres and warehouses and employ 38,089 employees. As a result, salaries, supplier payments and government taxes are among the ways that we generate local economic benefit.
• Our business also brings indirect benefits, such as technical expertise or inward investment – particularly important in developing or transitional economies. We are helping to develop the Russian sugar beet industry, for example, bringing in technical expertise and funding, so as to stop importing foreign cane sugar.
• As a founding member of the CEO Water Mandate and Caring for Climate initiatives, Coca-Cola Hellenic has committed to address water conservation and CO2 emissions in our operations, supply chain and beyond.
• We also support entrepreneurs in our value chain. In Nigeria, we are helping women micro-distributors as part of the global Coca-Cola programme to empower five million female entrepreneurs by 2020.
9.1.16 Strategic social investments and philanthropy • Our four strategic focus areas are: youth/education, sport/active lifestyles,
water/environment protection and emergency relief. Most of our community funding (73%) was channelled into these four areas in 2013.
• We engage with UNDP, UNEP, UNESCO and other agencies to address broader UN goals. Partnerships focus on such issues as: access to water and watershed conservation; youth
44
development and education; entrepreneurship and job creation; HIV/AIDS and malaria; disaster relief and rehabilitation.
• In 2013, we channelled more than €9.5 million -- more than 2% of pre-tax profit -- into community investment programmes. We submit this data to the London Benchmarking Group (LBG) for verification.
9.1.17 Advocacy and public policy engagement • We work with industry associations to inform public policy on sustainability challenges,
sharing our experience and advancing practical solutions. Since 2005, our Green Danube partnership has conducted advocacy in 11 countries.
• We aim to be transparent about our positions - calling for urgent action on climate change, for example. We oppose measures that single out products or industries, such as soft drink taxes. We also challenge proposals that focus more on short-term financial gain than long-term sustainability.
9.1.18 Partnerships and collective action • Multi-stakeholder partnerships are critical to solving many sustainability challenges. We
participate in many such initiatives, even setting them up where none exist. • We have supported development of Local Networks and were actively involved in nine such
networks in 2013. • Since 2005, our Green Danube partnership with the ICPDR has been active in conservation,
awareness-raising, education and advocacy in 11 countries. In total, we conduct community water partnerships in 26 countries.
• Underpinned by a global agreement between the Coca-Cola System and the International Federation of Red Cross and Red Crescent societies, we work with national Red Cross societies on emergency relief and other locally relevant issues.
• We have led the set-up of recovery organisations in 19 countries, which collect, recycle or recover beverage packaging. We also supported the establishment in Austria of the first PET-to-PET recycling plant, closing the recycling loop.
• Active lifestyles and youth development are other key areas in which we work together with NGOs, government agencies and other technical experts.
Corporate Sustainability Governance and Leadership 9.1.19 CEO commitment and leadership • The CEO and Management of CCHBC support the UN Global Compact and oversee our work in
the areas of human rights, labour rights, environment and anti-corruption. • The CEO is actively involved in our sustainability agenda and normally attends quarterly
meetings of the Board's Social Responsibility Committee. • The CEO also participates in Top-to-Top meetings with The Coca-Cola Company and other
bottlers to ensure alignment on sustainability issues, strategies and targets. 9.1.20 Board adoption and oversight • The Board of Directors strongly supports the UN Global Compact and our work in the local
networks, as seen by the Chairman’s letter in the Annual Integrated Report. • The Social Responsibility Committee of our Board of Directors meets quarterly to review and
guide our sustainability performance. The chairman is Sir Michael Llewellyn, the senior independent director on our Board.
9.1.21 Stakeholder engagement • The importance of creating value for stakeholders is enshrined in CCHBC's Mission and
Values. Similarly, Community Trust is one of our four key business strategies. • We engage with a wide range of stakeholders on our sustainability strategy: employees,
consumers, customers and suppliers, as well as non-governmental organisations (NGOs), governments and communities in which we operate.
• Our annual Stakeholder Panel comprises academics, government, industry and other technical experts.
• We also participate in multi-stakeholder partnerships to address issues that are material to our business and our communities.
45
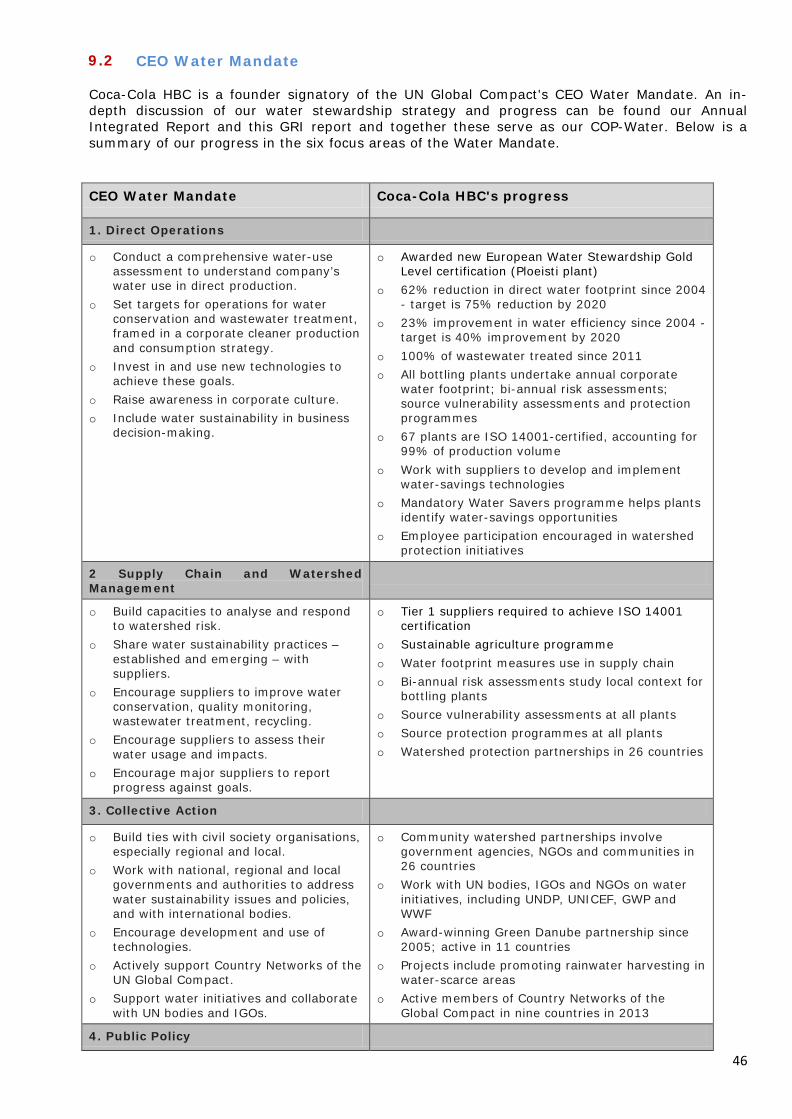
9.2 CEO Water Mandate Coca-Cola HBC is a founder signatory of the UN Global Compact's CEO Water Mandate. An in-depth discussion of our water stewardship strategy and progress can be found our Annual Integrated Report and this GRI report and together these serve as our COP-Water. Below is a summary of our progress in the six focus areas of the Water Mandate.
CEO Water Mandate Coca-Cola HBC's progress
1. Direct Operations
o Conduct a comprehensive water-use assessment to understand company’s water use in direct production.
o Set targets for operations for water conservation and wastewater treatment, framed in a corporate cleaner production and consumption strategy.
o Invest in and use new technologies to achieve these goals.
o Raise awareness in corporate culture. o Include water sustainability in business
decision-making.
o Awarded new European Water Stewardship Gold Level certification (Ploeisti plant)
o 62% reduction in direct water footprint since 2004 - target is 75% reduction by 2020
o 23% improvement in water efficiency since 2004 - target is 40% improvement by 2020
o 100% of wastewater treated since 2011 o All bottling plants undertake annual corporate
water footprint; bi-annual risk assessments; source vulnerability assessments and protection programmes
o 67 plants are ISO 14001-certified, accounting for 99% of production volume
o Work with suppliers to develop and implement water-savings technologies
o Mandatory Water Savers programme helps plants identify water-savings opportunities
o Employee participation encouraged in watershed protection initiatives
2 Supply Chain and Watershed Management
o Build capacities to analyse and respond to watershed risk.
o Share water sustainability practices – established and emerging – with suppliers.
o Encourage suppliers to improve water conservation, quality monitoring, wastewater treatment, recycling.
o Encourage suppliers to assess their water usage and impacts.
o Encourage major suppliers to report progress against goals.
o Tier 1 suppliers required to achieve ISO 14001 certification
o Sustainable agriculture programme o Water footprint measures use in supply chain o Bi-annual risk assessments study local context for
bottling plants o Source vulnerability assessments at all plants o Source protection programmes at all plants o Watershed protection partnerships in 26 countries
3. Collective Action
o Build ties with civil society organisations, especially regional and local.
o Work with national, regional and local governments and authorities to address water sustainability issues and policies, and with international bodies.
o Encourage development and use of technologies.
o Actively support Country Networks of the UN Global Compact.
o Support water initiatives and collaborate with UN bodies and IGOs.
o Community watershed partnerships involve government agencies, NGOs and communities in 26 countries
o Work with UN bodies, IGOs and NGOs on water initiatives, including UNDP, UNICEF, GWP and WWF
o Award-winning Green Danube partnership since 2005; active in 11 countries
o Projects include promoting rainwater harvesting in water-scarce areas
o Active members of Country Networks of the Global Compact in nine countries in 2013
4. Public Policy
46
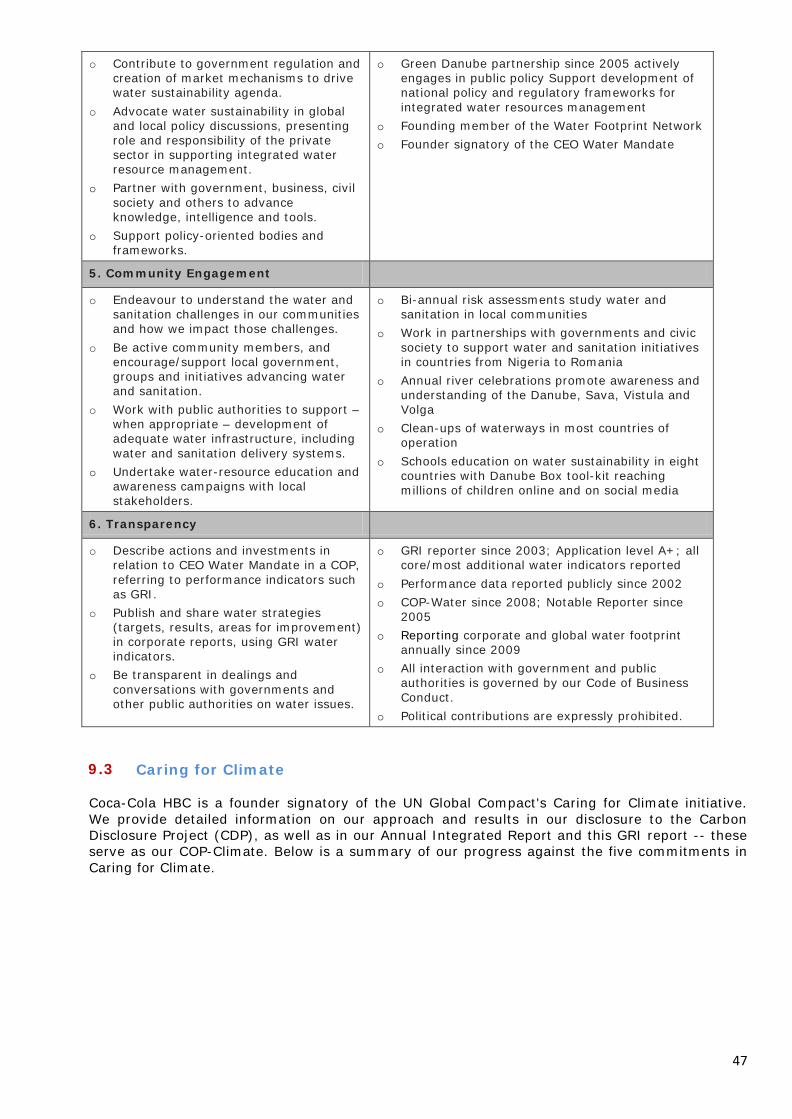
o Contribute to government regulation and creation of market mechanisms to drive water sustainability agenda.
o Advocate water sustainability in global and local policy discussions, presenting role and responsibility of the private sector in supporting integrated water resource management.
o Partner with government, business, civil society and others to advance knowledge, intelligence and tools.
o Support policy-oriented bodies and frameworks.
o Green Danube partnership since 2005 actively engages in public policy Support development of national policy and regulatory frameworks for integrated water resources management
o Founding member of the Water Footprint Network o Founder signatory of the CEO Water Mandate
5. Community Engagement
o Endeavour to understand the water and sanitation challenges in our communities and how we impact those challenges.
o Be active community members, and encourage/support local government, groups and initiatives advancing water and sanitation.
o Work with public authorities to support – when appropriate – development of adequate water infrastructure, including water and sanitation delivery systems.
o Undertake water-resource education and awareness campaigns with local stakeholders.
o Bi-annual risk assessments study water and sanitation in local communities
o Work in partnerships with governments and civic society to support water and sanitation initiatives in countries from Nigeria to Romania
o Annual river celebrations promote awareness and understanding of the Danube, Sava, Vistula and Volga
o Clean-ups of waterways in most countries of operation
o Schools education on water sustainability in eight countries with Danube Box tool-kit reaching millions of children online and on social media
6. Transparency
o Describe actions and investments in relation to CEO Water Mandate in a COP, referring to performance indicators such as GRI.
o Publish and share water strategies (targets, results, areas for improvement) in corporate reports, using GRI water indicators.
o Be transparent in dealings and conversations with governments and other public authorities on water issues.
o GRI reporter since 2003; Application level A+; all core/most additional water indicators reported
o Performance data reported publicly since 2002 o COP-Water since 2008; Notable Reporter since
2005 o Reporting corporate and global water footprint
annually since 2009 o All interaction with government and public
authorities is governed by our Code of Business Conduct.
o Political contributions are expressly prohibited.
9.3 Caring for Climate
Coca-Cola HBC is a founder signatory of the UN Global Compact's Caring for Climate initiative. We provide detailed information on our approach and results in our disclosure to the Carbon Disclosure Project (CDP), as well as in our Annual Integrated Report and this GRI report -- these serve as our COP-Climate. Below is a summary of our progress against the five commitments in Caring for Climate.
47
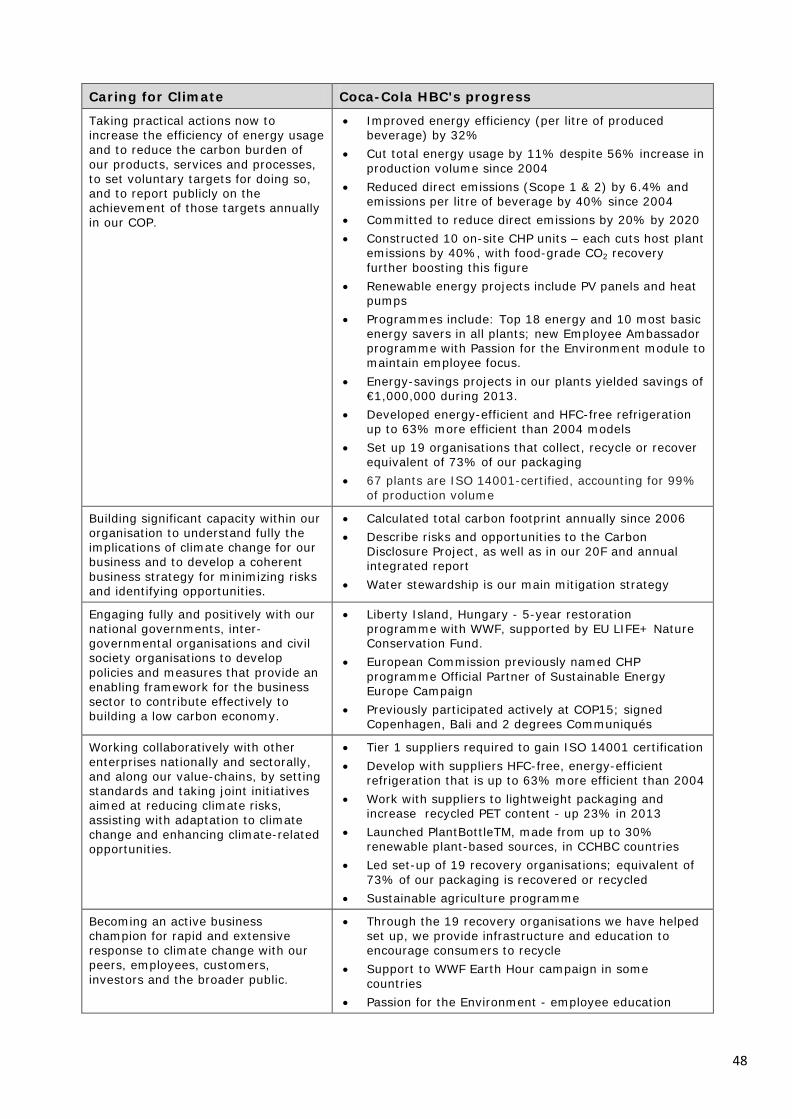
Caring for Climate Coca-Cola HBC's progress
Taking practical actions now to increase the efficiency of energy usage and to reduce the carbon burden of our products, services and processes, to set voluntary targets for doing so, and to report publicly on the achievement of those targets annually in our COP.
• Improved energy efficiency (per litre of produced beverage) by 32%
• Cut total energy usage by 11% despite 56% increase in production volume since 2004
• Reduced direct emissions (Scope 1 & 2) by 6.4% and emissions per litre of beverage by 40% since 2004
• Committed to reduce direct emissions by 20% by 2020 • Constructed 10 on-site CHP units – each cuts host plant
emissions by 40%, with food-grade CO2 recovery further boosting this figure
• Renewable energy projects include PV panels and heat pumps
• Programmes include: Top 18 energy and 10 most basic energy savers in all plants; new Employee Ambassador programme with Passion for the Environment module to maintain employee focus.
• Energy-savings projects in our plants yielded savings of €1,000,000 during 2013.
• Developed energy-efficient and HFC-free refrigeration up to 63% more efficient than 2004 models
• Set up 19 organisations that collect, recycle or recover equivalent of 73% of our packaging
• 67 plants are ISO 14001-certified, accounting for 99% of production volume
Building significant capacity within our organisation to understand fully the implications of climate change for our business and to develop a coherent business strategy for minimizing risks and identifying opportunities.
• Calculated total carbon footprint annually since 2006 • Describe risks and opportunities to the Carbon
Disclosure Project, as well as in our 20F and annual integrated report
• Water stewardship is our main mitigation strategy
Engaging fully and positively with our national governments, inter-governmental organisations and civil society organisations to develop policies and measures that provide an enabling framework for the business sector to contribute effectively to building a low carbon economy.
• Liberty Island, Hungary - 5-year restoration programme with WWF, supported by EU LIFE+ Nature Conservation Fund.
• European Commission previously named CHP programme Official Partner of Sustainable Energy Europe Campaign
• Previously participated actively at COP15; signed Copenhagen, Bali and 2 degrees Communiqués
Working collaboratively with other enterprises nationally and sectorally, and along our value-chains, by setting standards and taking joint initiatives aimed at reducing climate risks, assisting with adaptation to climate change and enhancing climate-related opportunities.
• Tier 1 suppliers required to gain ISO 14001 certification • Develop with suppliers HFC-free, energy-efficient
refrigeration that is up to 63% more efficient than 2004 • Work with suppliers to lightweight packaging and
increase recycled PET content - up 23% in 2013 • Launched PlantBottleTM, made from up to 30%
renewable plant-based sources, in CCHBC countries • Led set-up of 19 recovery organisations; equivalent of
73% of our packaging is recovered or recycled • Sustainable agriculture programme
Becoming an active business champion for rapid and extensive response to climate change with our peers, employees, customers, investors and the broader public.
• Through the 19 recovery organisations we have helped set up, we provide infrastructure and education to encourage consumers to recycle
• Support to WWF Earth Hour campaign in some countries
• Passion for the Environment - employee education
48
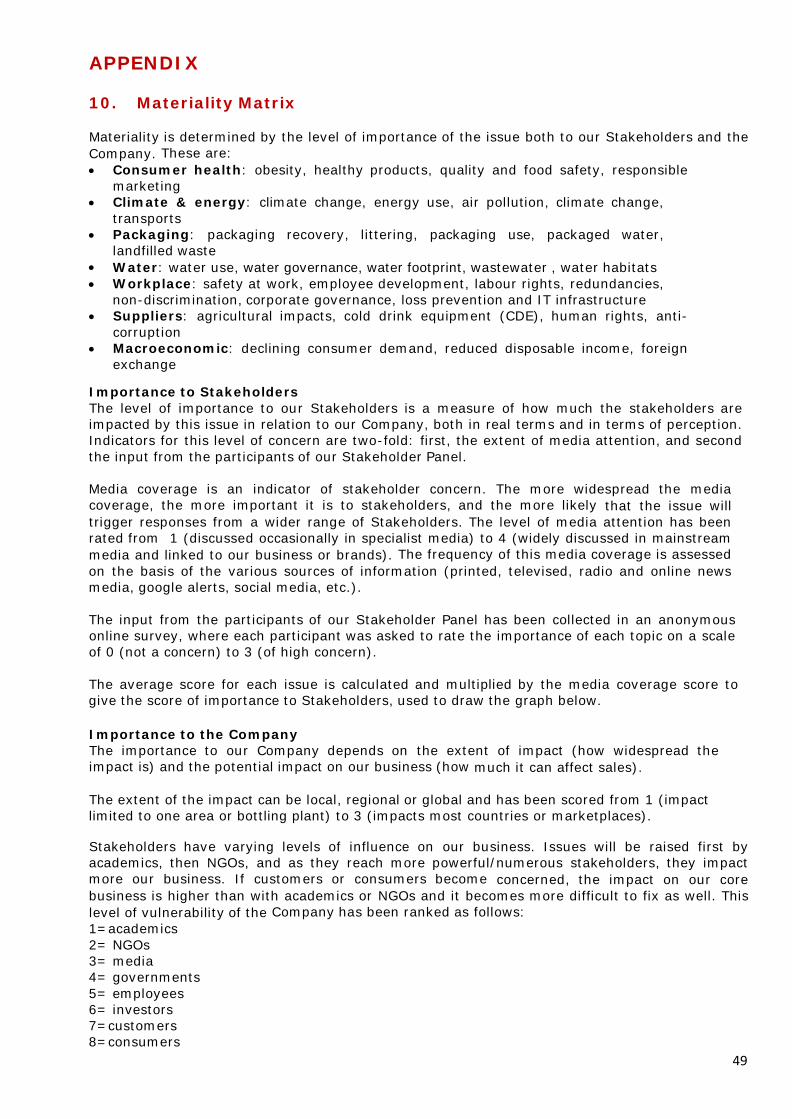
APPENDIX
10. Materiality Matrix Materiality is determined by the level of importance of the issue both to our Stakeholders and the Company. These are: • Consumer health: obesity, healthy products, quality and food safety, responsible
marketing • Climate & energy: climate change, energy use, air pollution, climate change,
transports • Packaging: packaging recovery, littering, packaging use, packaged water,
landfilled waste • Water: water use, water governance, water footprint, wastewater , water habitats • Workplace: safety at work, employee development, labour rights, redundancies,
non-discrimination, corporate governance, loss prevention and IT infrastructure • Suppliers: agricultural impacts, cold drink equipment (CDE), human rights, anti-
corruption • Macroeconomic: declining consumer demand, reduced disposable income, foreign
exchange Importance to Stakeholders The level of importance to our Stakeholders is a measure of how much the stakeholders are impacted by this issue in relation to our Company, both in real terms and in terms of perception. Indicators for this level of concern are two-fold: first, the extent of media attention, and second the input from the participants of our Stakeholder Panel. Media coverage is an indicator of stakeholder concern. The more widespread the media coverage, the more important it is to stakeholders, and the more likely that the issue will trigger responses from a wider range of Stakeholders. The level of media attention has been rated from 1 (discussed occasionally in specialist media) to 4 (widely discussed in mainstream media and linked to our business or brands). The frequency of this media coverage is assessed on the basis of the various sources of information (printed, televised, radio and online news media, google alerts, social media, etc.). The input from the participants of our Stakeholder Panel has been collected in an anonymous online survey, where each participant was asked to rate the importance of each topic on a scale of 0 (not a concern) to 3 (of high concern). The average score for each issue is calculated and multiplied by the media coverage score to give the score of importance to Stakeholders, used to draw the graph below. Importance to the Company The importance to our Company depends on the extent of impact (how widespread the impact is) and the potential impact on our business (how much it can affect sales). The extent of the impact can be local, regional or global and has been scored from 1 (impact limited to one area or bottling plant) to 3 (impacts most countries or marketplaces). Stakeholders have varying levels of influence on our business. Issues will be raised first by academics, then NGOs, and as they reach more powerful/numerous stakeholders, they impact more our business. If customers or consumers become concerned, the impact on our core business is higher than with academics or NGOs and it becomes more difficult to fix as well. This level of vulnerability of the Company has been ranked as follows: 1=academics 2= NGOs 3= media 4= governments 5= employees 6= investors 7=customers 8=consumers
49
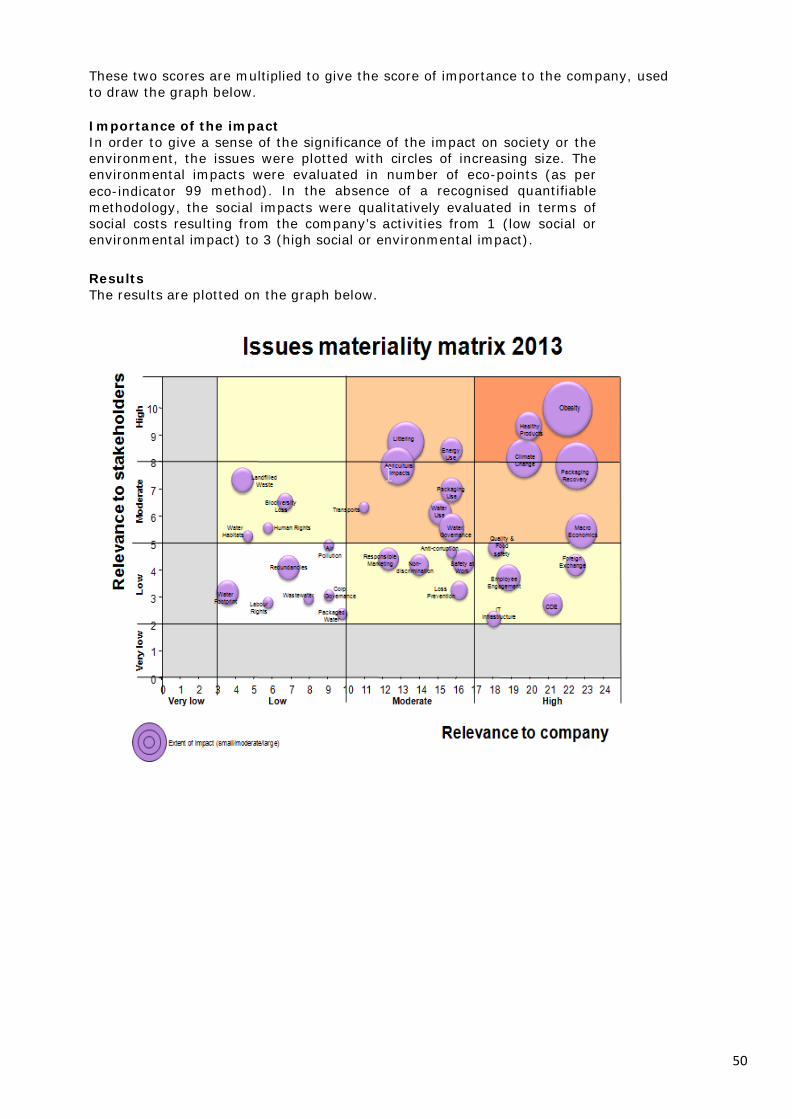
These two scores are multiplied to give the score of importance to the company, used to draw the graph below. Importance of the impact In order to give a sense of the significance of the impact on society or the environment, the issues were plotted with circles of increasing size. The environmental impacts were evaluated in number of eco-points (as per eco-indicator 99 method). In the absence of a recognised quantifiable methodology, the social impacts were qualitatively evaluated in terms of social costs resulting from the company’s activities from 1 (low social or environmental impact) to 3 (high social or environmental impact). Results The results are plotted on the graph below.
50
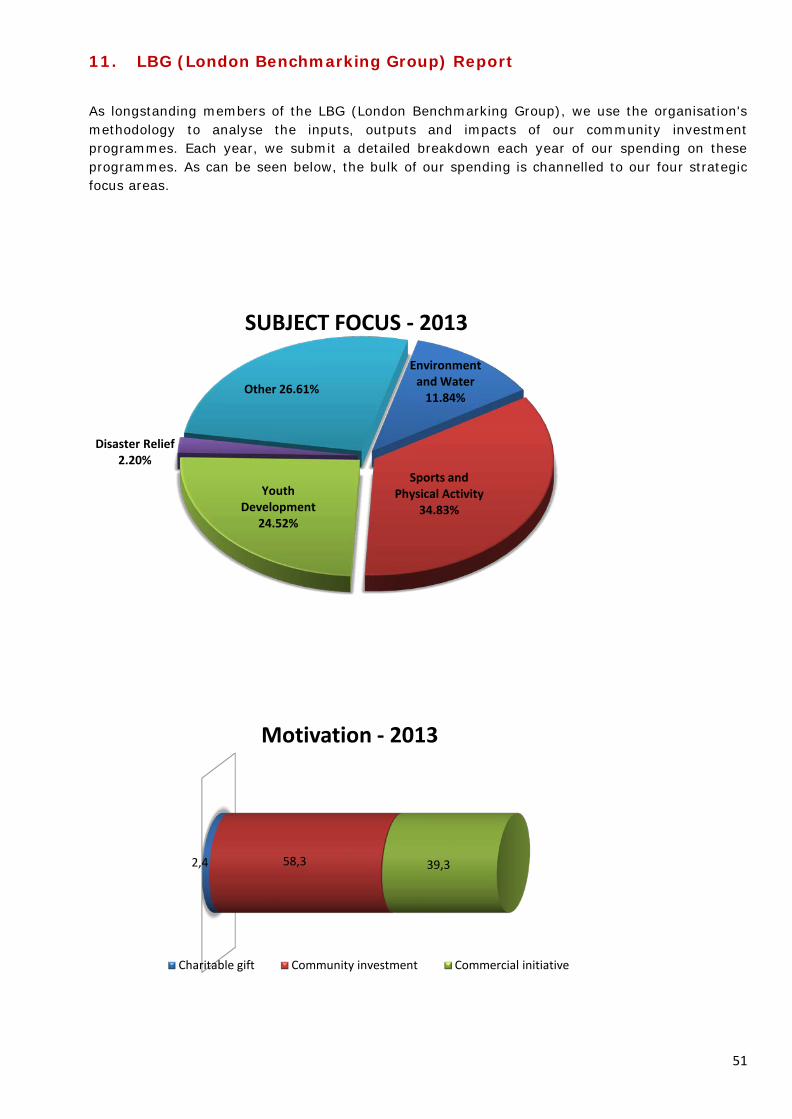
11. LBG (London Benchmarking Group) Report
As longstanding members of the LBG (London Benchmarking Group), we use the organisation's methodology to analyse the inputs, outputs and impacts of our community investment programmes. Each year, we submit a detailed breakdown each year of our spending on these programmes. As can be seen below, the bulk of our spending is channelled to our four strategic focus areas.
Environment and Water
11.84%
Sports and Physical Activity
34.83%
Youth Development
24.52%
Disaster Relief 2.20%
Other 26.61%
SUBJECT FOCUS - 2013
2,4 58,3 39,3
Motivation - 2013
Charitable gift Community investment Commercial initiative
51
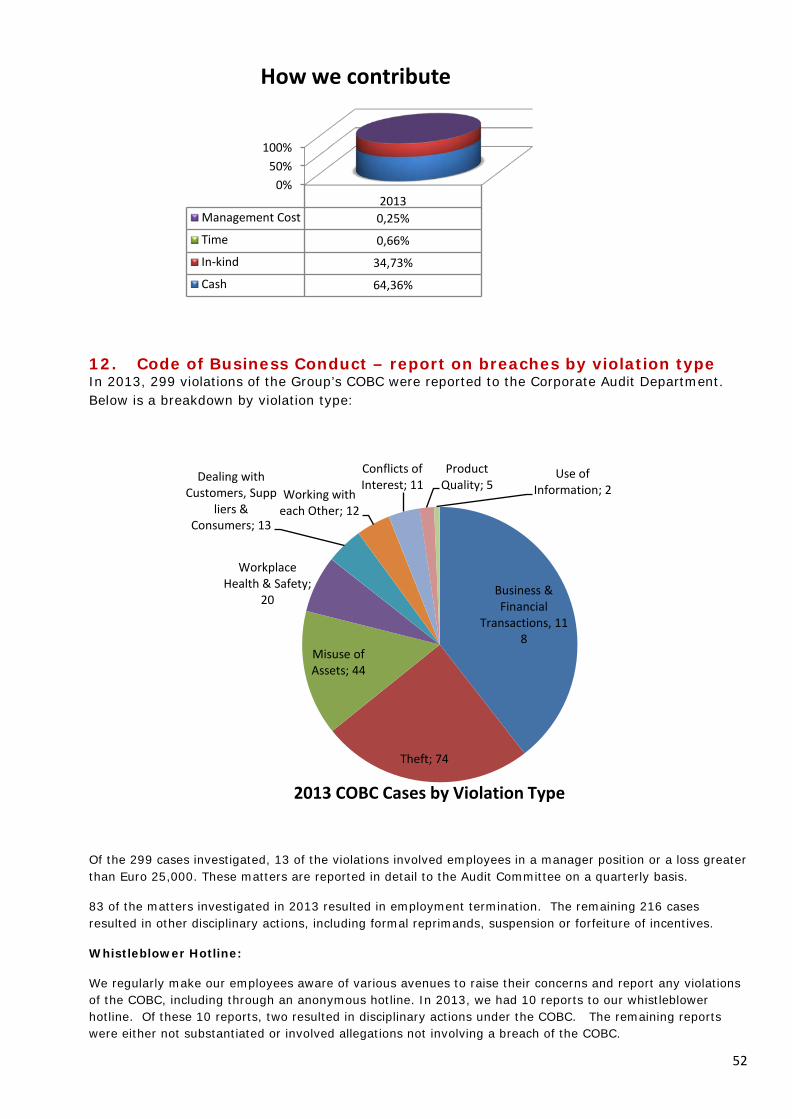
12. Code of Business Conduct – report on breaches by violation type In 2013, 299 violations of the Group’s COBC were reported to the Corporate Audit Department. Below is a breakdown by violation type:
Of the 299 cases investigated, 13 of the violations involved employees in a manager position or a loss greater than Euro 25,000. These matters are reported in detail to the Audit Committee on a quarterly basis.
83 of the matters investigated in 2013 resulted in employment termination. The remaining 216 cases resulted in other disciplinary actions, including formal reprimands, suspension or forfeiture of incentives.
Whistleblower Hotline:
We regularly make our employees aware of various avenues to raise their concerns and report any violations of the COBC, including through an anonymous hotline. In 2013, we had 10 reports to our whistleblower hotline. Of these 10 reports, two resulted in disciplinary actions under the COBC. The remaining reports were either not substantiated or involved allegations not involving a breach of the COBC.
0%50%
100%
2013Management Cost 0,25%
Time 0,66%
In-kind 34,73%
Cash 64,36%
How we contribute
Business & Financial
Transactions, 118
Theft; 74
Misuse of Assets; 44
Workplace Health & Safety;
20
Dealing with Customers, Supp
liers & Consumers; 13
Working with each Other; 12
Conflicts of Interest; 11
Product Quality; 5
Use of Information; 2
2013 COBC Cases by Violation Type
52