Embed Size (px)
Citation preview
Britishlournal ofOphthalmology, 1990,74,712-716
Peripheral contrast sensitivity in glaucoma andocular hypertension
Fernando Falcao-Reis, Eamonn O'Donoghue, Rosaria Buceti, Roger A Hitchings,Geoffrey B Arden
AbstractContrast sensitivity has been measured inpatients with glaucoma and ocular hyperten-sion, the latter graded into high, medium, andlow risk clinical groups. Measurements weremade centrally and peripherally at 100, 150, 200,and 250 off-axis at each of the four meridians450, 1350, 2250, and 3150. A sine wave grating of1*9 cycles/degree, reversing at 1 Hz was used.It was displayed on a 100-Hz refresh ratemonitor. Normal values were established tocompare those from 41 eyes from patients witheither primary open angle glaucoma (POAG)with minimal field loss detectable on aHumphrey perimeter, or raised IOP and/ordisc changes but no field loss (OH). Those withPOAG had normal central contrast sensitivity,but at 200 and 250 eccentricity the values were>2 standard deviations above the normalmean. This was also the case for high riskOH, but not for low risk patients. AU the highrisk patients except one who had abnormalperipheral contrast sensitivity had possiblefield defects (threshold elevation at one ormore points more than 5 but less than 10 dBabove normal mean). Only one of those withnormal peripheral contrast sensitivity had such'suspect points'. The results are assessed interms of screening of glucoma suspects.
Department of ClinicalOphthalmology, Instituteof Ophthalmology andElectrodiagnostic Clinic,Moorfields Eye Hospital,London ECIE O'DonoghueR A HitchingsG B Arden
Department ofOphthalmology, OportoMedical School, Oporto,PortugalF Falcio-Reis
Institute ofOphthalmology,Policlinico Universitariode Messina, Gazzi, ItalyR BucetiCorrespondence to:Professor G B Arden,Electrodiagnostic Clinic,Moorfields Eye Hospital, CityRoad, London EC1V 2PD.
Accepted for publication14 June 1990
Primary open angle glaucoma (POAG) is diag-nosed when a patient has demonstrable visualfield defect and either a raised intraocularpressure (IOP) or clinical signs, such as discchanges, which are consistent with a raised IOP,and no other complicating causes for the raisedpressure. There are several tests which aiddiagnosis. Perimetric loss defines the condition,'but its sensitivity is not great enough to detectthe earliest pathological changes: 40% of opticnerve axons are lost before any visual defect isapparent.2 Increases in pressure occur longbefore field is lost, and the degree of increasein IOP gives an indication of the probabilitythat the patient will subsequently develop acharacteristic field loss.3 However, it is imposs-ible to screen for glaucoma on the basis of ocularpressure measurement only. No level ofIOP canbe found at which the percentage of 'falsepositives' and 'false negatives' is acceptable.4Examination of the optic nerve head, especiallywith stereoscopic viewing, is an efficient andeffective method ofdetecting damage to the opticnerve, but it requires expert judgment.5 Afurther limitation derives from the fact thatpatients who do not have any pathological pro-cess may have discs which seem abnormal.6
Another problem in treating glaucoma is to
decide when to begin. It is often considered tobe too late to wait until a frank field defect isfound79 and so one should treat patients withraised IOP and/or disc changes but no field loss(OH) in whom the condition is progressing.Estimates from the measurement of IOP are oflimited use in deciding when to treat, as is a slightincrease in a high cup/disc ratio. Thereforevarious subclassifications of OH have beendevised in an attempt to quantify the risk thatfield loss may develop, and only patients in highrisk groups are treated.10 This limits the costof treatment and minimises the possibility ofadverse reactions. To a considerable extentrisk classification rests on clinical judgment.Recently some other diagnostic methods havebeen used to detect and grade the small degree ofdamage to the optic nerve which occurs in OH -for example, colour discrimination measuredwith desaturated colours" or colour contrastsensitivity. 12 The pattern electroretinogram'3especially has been found abnormal in ocularhypertension and appears to be more successfulthan the psychophysical techniques in detectingabnormality in glaucoma and high risk OH,possibly because a large retinal region is tested,while psychophysical methods measure onlymacular or even foveal function.Another method claimed to detect visual
changes in glaucoma and OH is the measurementof contrast sensitivity. Several techniques havebeen used,'"'7 and testing is as fast, easy toperform, and inexpensive as is required forscreening. Unfortunately, early hopes of sensi-tivity and specificity of that method were notrealised."1 Although losses in contrast sensitivityat low spatial frequency occur in patients suffer-ing from glaucoma and OH, there is an unaccept-able overlap with normals, even when the gratingpattern is modulated as a function of time (whichimproves detection of early losses'9). Anotherunexploited value of temporally modulatedgratings is that with them the Troxler effect isabsent, and it is thus possible to measure contrastsensitivity in untrained subjects as far peripher-ally as 25-30° from the fovea. There have been noprevious reports of such measurements in OHpatients, but since the first field loss occursperipherally it seems likely that the first losses ofcontrast sensitivity will occur in such regions.We have accordingly measured peripheral con-trast sensitivity in eyes with early glaucoma andocular hypertension at different risks of conver-sion ofglaucoma. By the time glaucomatous eyesshow the earliest evidence of visual field defect,that is, one spot of 10 dB loss, contrast sensitivityis greatly reduced when measured in theperiphery. Determination of contrast sensitivityin four quadrants at 200 or 250 (four points)
712
on 15 July 2018 by guest. Protected by copyright.
http://bjo.bmj.com
/B
r J Ophthalm
ol: first published as 10.1136/bjo.74.12.712 on 1 Decem
ber 1990. Dow
nloaded from
Peripheral contrast sensitivity inglaucoma and ocular hypertension
served to separate all eyes with glaucoma fromnormal eyes, while testing at the macula was
totally ineffective. Furthermore, in 50% of eyeswith high risk ocular hypertension there are
definite losses of contrast sensitivity at an
eccentricity of 200 and 25°.
Material and methodsA TV monitor controlled by a T221 gratinggenerator (Faulkner-West Associates) was usedto present a vertical sinusoidal grating in a
pattern reversing mode. The refresh rate was 100Hz. Thus there was no 'TV flicker' even forperipheral viewing. Contrasts as low as 0-1%could be generated. The TV screen was sur-
rounded by a white card of 80x80 cm, on whichsmall fixation spots were affixed at appropriatelocations. Most of the TV screen was alsocovered by the card except for an 8 cm round area
in the middle. In this hole 6 cycles of the gratingcould be seen. Patients sat in a chair at 1-2 mfrom the screen. At this distance stimulus andsurround subtended 3.80 and 330 respectively.Spatial frequency was 1-9 cycles/degree. Anabrupt reversal (square wave) with a temporalfrequency of 1 Hz was used. Both remainedunchanged during testing. The mean luminanceoftheTV screen was 80 cd/m2. Daily calibrationsofcontrast and luminance were carried out with a
Tektronix J16 photometer. Room illuminationwas 10 cd/M2n. The operator sat at the side of themonitor, facing the patient, to check fixation.Threshold was determined by the method ofascending limits. Contrast, defined in the usualmanner, was increased slowly and smoothly bythe manual operation of a 10-turn calibratedpotentiometer either from zero or from a variablesubthreshold value. Patients were instructed torespond as soon as they could detect motion ofthe pattern. At least three measurements were
averaged to determine a threshold at each locus.In a few cases the stimulus lay on a scotomatousregion of retina, so no meaningful measurementcould be made. In such cases the thresholdcontrast was arbitrarily given a value of30%. Pupil diameter was not measured, butnone of the patients was treated withmiotics.
Patients and subjects wore spectacles whenappropriate. Tests were carried out mono-
cularly. The grating had an unchangeable spatialfrequency, so no pattern preview was given. Notime limit was imposed. Contrast threshold weremeasured at 100, 150, 20°, and 250 eccentricity atthe 450, 135°, 2250, and 3150 meridians: thesewere chosen so that the blind spot was avoided.In addition the threshold was measured withfoveal viewing. A full examination - 17 loci each
Table I Classification criteria
Normal Low risk Medium risk High risk Glaucoma
IOP (mmHg) <21 ¢21, <26 ¢26 :26 Anyand or and
CID ratio <0-6 <0-6 0-6 :0-6 a0-6Visual field Normal Normal or suspect Normal or suspect Normal or suspect Abnormal
Suspect: one or more spots 5 dB S 10 dB.Abnormal: one or more spots > 10 dB plus 1 spot -5 dB.
eye - took about 45 minutes. All contrast sensi-tivity determinations were carried out by thesame operator, who was not aware ofthe patients'condition.
Forty-one eyes (mean age of patients 57(SD 8) years, 27% female, 73% male) withglaucoma or hypertension recruited from aglaucoma clinic and 11 eyes (mean age ofsubjects 49 (SD 12) years, 36% female, 64%male) with normal eyes were examined. Hos-pital staff members with no ocular or systemicdiseases volunteered as controls.The doctors who carried out the contrast
sensitivity test did not recruit the patients anddid not carry out any clinical examinations, andwere not aware of the field test results.The patients' eyes were examined by bio-
microscopy, fundoscopy, disc photography,applanation tonometry, and Humphrey com-puterised static perimetry, and were classifiedby the usual criteria as suffering from eitherglaucoma or ocular hypertension (Table 1).Glaucomatous eyes had a reproducible visualfield defect defined as one or more spots ofsensitivity loss of 10 dB or greater at least in twodifferent occasions plus one adjacent spot of5 dB. Hypertensive eyes were further classifiedinto three groups.20 The low risk group had anintraocular pressure below 26 mmHg and avertical cup to disc (C/D) ratio less than 0-6. Eyeswith either an intraocular pressure equal to orgreater than 26 mmHg or a C/D ratio equal to orgreater than 0-6 were classified as medium risk.The high risk group included eyes with intra-ocular pressure greater than 26 mmHg and C/Dratio greater than 0 6. Additionally eyes with OHwere classified as 'suspects' when loci in the sitestested by the Humphrey 30-2 program had asensitivity loss greater than 5 dB but less than10dB.
Exclusions. Patients and normal subjects had avisual acuity of6/6 or better and no ocular diseaseparticularly cataract or corneal opacities. Nonehad systemic hypertension, diabetes, or otherdisease.
Results
CENTRAL RETINAL CONTRAST SENSITIVITYEach patient or observer was asked to lookdirectly at the grating, and contrast sensitivitywas measured. The mean value of the macularregion in normal control eyes was 0-91% (SD0-13). This was not significantly less than thecontrast sensitivity of low and medium risk OHgroups.The difference between the normals and the
high risk group was greater, though the signific-ance was only 0 1>p>0 05. Glaucomatouseyes showed a significant loss of sensitivity(p>0-001). Of greater interest is the distributionof contrast sensitivity in the population. This'is shown in Fig 1. For central viewing, in twoout of eight cases of glaucoma the thresholdswere just below the upper limit of normal.This sort of overlap has previously beenreported and explains why central contrastsensitivity (CS) is not an adequate screeningtechnique.
713
on 15 July 2018 by guest. Protected by copyright.
http://bjo.bmj.com
/B
r J Ophthalm
ol: first published as 10.1136/bjo.74.12.712 on 1 Decem
ber 1990. Dow
nloaded from
Falcdo-Reis, O'Donoghue, Buceti, Hitchings, Arden
20
10
0.50 10 15 20 25
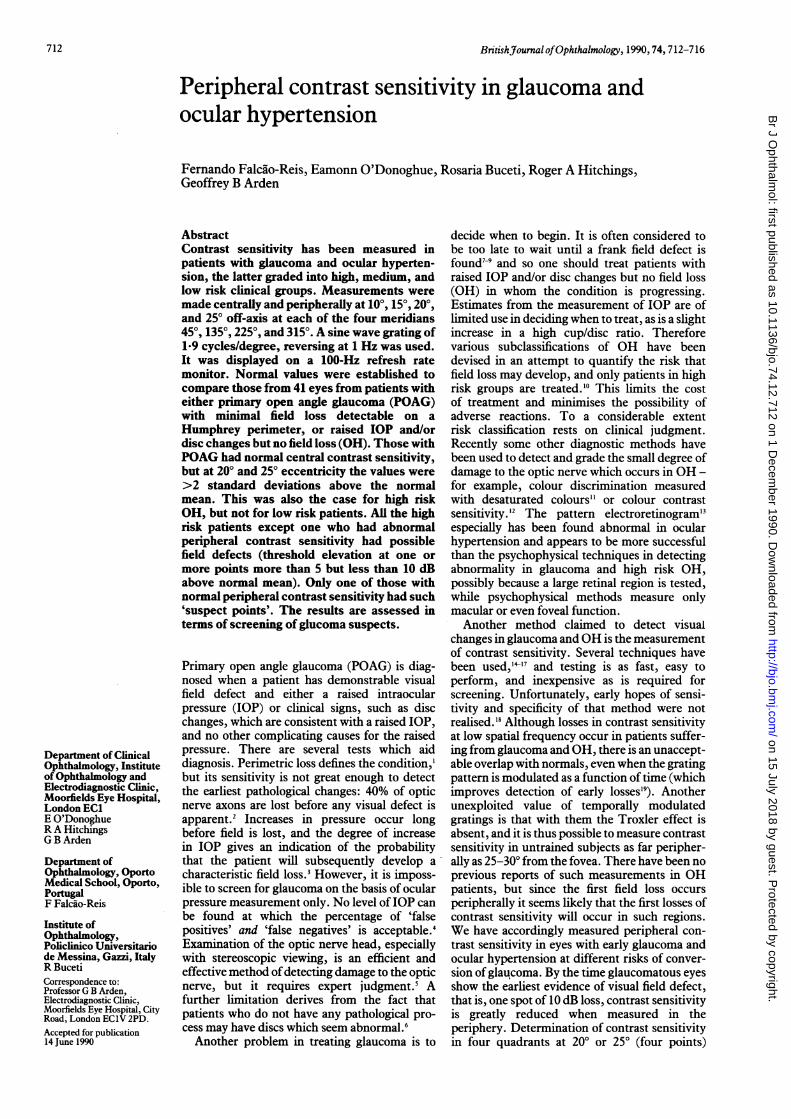
Eccentricity (degrees)Figure) Distribution ofmean contrast sensitivity as function ofretinal eccentricity. Allindividual results shown. Each symbol represents (exceptfor central viewing) the average ofresultsfromfour loci, one in each quadrant. The different symbols refer to the patients'diagnoses. The dotted line represents the upper limit ofnormal (mean+2 SD). It can be seen thatcontrast sensitivity decreasesfrom the centre to the periphery. Note that two glaucomatous eyesgive results within the 5% confidence limitforfoveal testing. However, for peripheral viewingthe distinction between the results in glaucoma and the upper limit ofnormal is much moreevident. For patients with high risk OH the proportion with reduced contrast sensitivity alsoincreasesfrom centre to periphery and reaches 50% at 250.
PERIPHERAL CONTRAST SENSITIVITY
NormalsMean values for measurements in all fourquadrants and the SD are shown in Table 2.Contrast sensitivity at most eccentric positionswas considerably less than with central fixation,and decreased with eccentricity. The upper
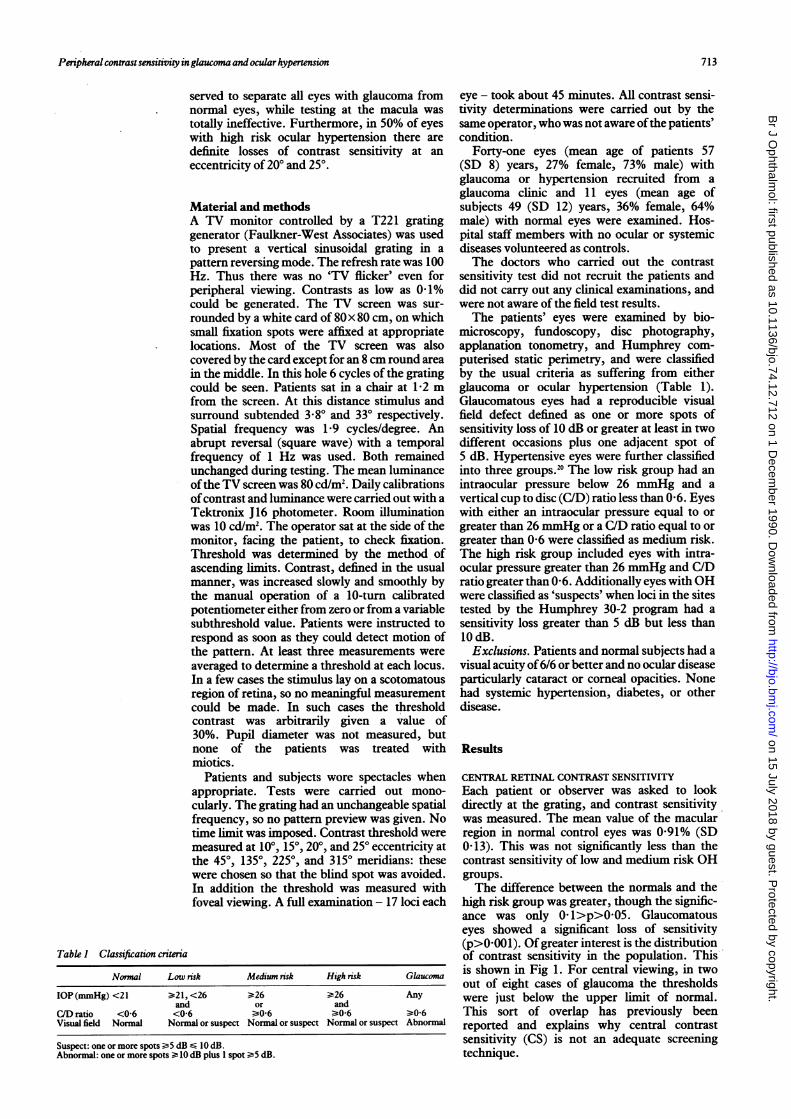
Figure 2 Contrast limits of normal (mean+2 SD) are representedsensitivity at eccentric loci in by the horizontal dotted lines on the graph of Figglaucomatous eyes. Results 1. These results are consistent with previousare compared with upper findings. 15 is 19limit ofnormal (mean+2SD). Each symbol representsthe mean ofthresholds ofallglaucomatous eyes at a given Glaucomalocus. Difference between The distribution of individual results is shownnormals and glaucomatouseyes is evident at all loci in for peripheral CS in Fig 1. Fig 2 shows thethe lowerfield and at'20( and average contrast thresholds at each retinalquadrants. Loss ofsensitivity position. Note that for normals the symbols arein glaucomatous eyes is less at the mean plus 2 SD. In the superior quadrantspronounced in the superiornasal quadrant.
threshold (%)20 F
superior nasal
5[.
10 V
E .
1 10
Z U26 2
5
is
U15
10U
5
10
15
Inferior nasal
20
superior temporal
U
.
El10
10Li
1IElU
20 25
El
Table 2 Mean contrast sensitivity offour quadrants
Category ofpatientRetinal Low risk Medium High riskposition Normal OH risk OH OH Glaucoma
CentralMean 0-91 093 093 1-03 1-25SD 0-13 0-23 0-22 0-17 0-14Significance* NS NS <0-1 <0-001100Mean 1-57 1-51 1-54 1-89 4-34SD 0-20 0 33 0-21 0-46 4-78Significance* NS NS <0 05 <0 05150Mean 2-01 2-03 2-27 2-59 5 00SD 0 30 0-43 1-01 1-0 4-54Significance* NS NS <0-1 <0 05200Mean 2 56 2-76 2-69 4 50 7-58SD 0-31 054 0-66 300 400Significance* NS NS <0105 <0-001250Mean 3-63 3 90 3-76 6-47 13-30SD 047 0-62 074 430 5-19Significance* NS NS <0 05 <0-001
*t Test ofnormal against each class of patient: figure is probabilitythat the result could be obtained by chance. NS=not significant.
of the visual field the difference between glauco-matous eyes and controls at 10° and 15° is small,but in the lower quadrants it is quite evident. Inthe two most peripheral loci (200 and 25°) thedifference between the two groups is clear in allquadrants. For glaucomatous patients, contrastsensitivity, averaged over the four quadrants(Fig 5) is significantly lower than for the normals(the p values range from <0005 to <0-001depending on eccentricity). Note that the differ-ence between normal and glaucomatous eyes isless in the superior nasal quadrant, where thescotomata are less frequent.Not only are the differences between means
significant, but the discrimination betweenaffected and normal is nearly complete if theresults from each of the four quadrants areaveraged as in Fig 1.There is only one false negative at 10° and none
at 15°, 200, and 250. It might be considered thatthis averaging biased the result, since contrastsensitivity would be zero over a scotoma. Con-trast sensitivity is not directly related to lumin-ance incremental threshold (which is measuredby perimetry, but evidently when incrementthreshold is infinity (that is, the stimulus lies onan absolute scotoma) the contrast threshold mustalso be immeasurably high. Only five eyes had athreshold higher than 30%. Among these oneglaucomatous eye had a threshold higher than30% at four retinal loci in one quadrant. Thesewere scored as 30% (see 'Methods' section).Thus the results given in the figures under-represent the difference between normal andglaucomatous eyes.
degrees
upper limit ]of normal
Inferior temporal glaucomaglucm
OCULAR HYPERTENSION
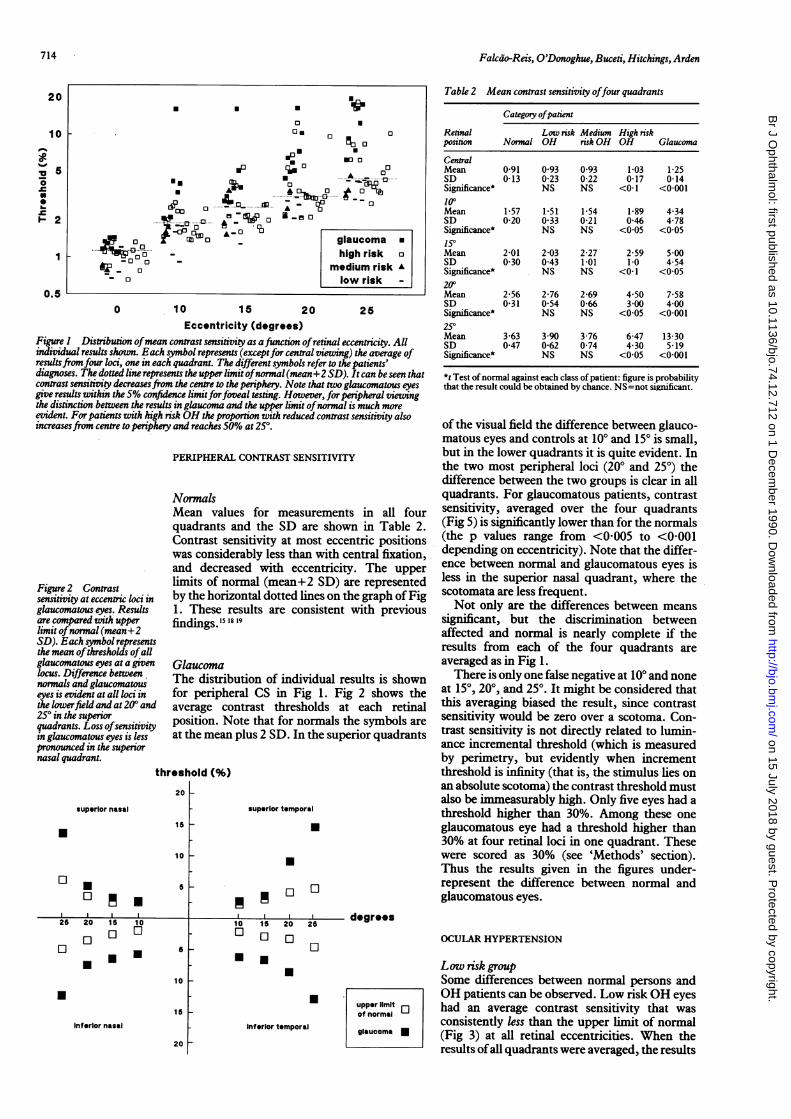
Low risk groupSome differences between normal persons andOH patients can be observed. Low risk OH eyeshad an average contrast sensitivity that wasconsistently less than the upper limit of normal(Fig 3) at all retinal eccentricities. When theresults of all quadrants were averaged, the results
714
on 15 July 2018 by guest. Protected by copyright.
http://bjo.bmj.com
/B
r J Ophthalm
ol: first published as 10.1136/bjo.74.12.712 on 1 Decem
ber 1990. Dow
nloaded from
Peripheral contrast sensitivity in glaucoma and ocular hypertension
superior nasal
threshold (%)
8aL
S
i4
25 20 15
* E* E
El 1:1
2
5
de02
4
6
Inferior nasal
Figure 3 Contrastsensitivity at eccentric loci inlow risk )hpertensive eyes.Results are compared withupper limit ofnormal(mean+2 SD). Each smnbolrepresents the mean ofthresholds ofall eyes at agiven lcus. Thresholds aresimilar in all quadrants.Mean contrast sensitivity isconsistently under the upperlimit ofnormal.
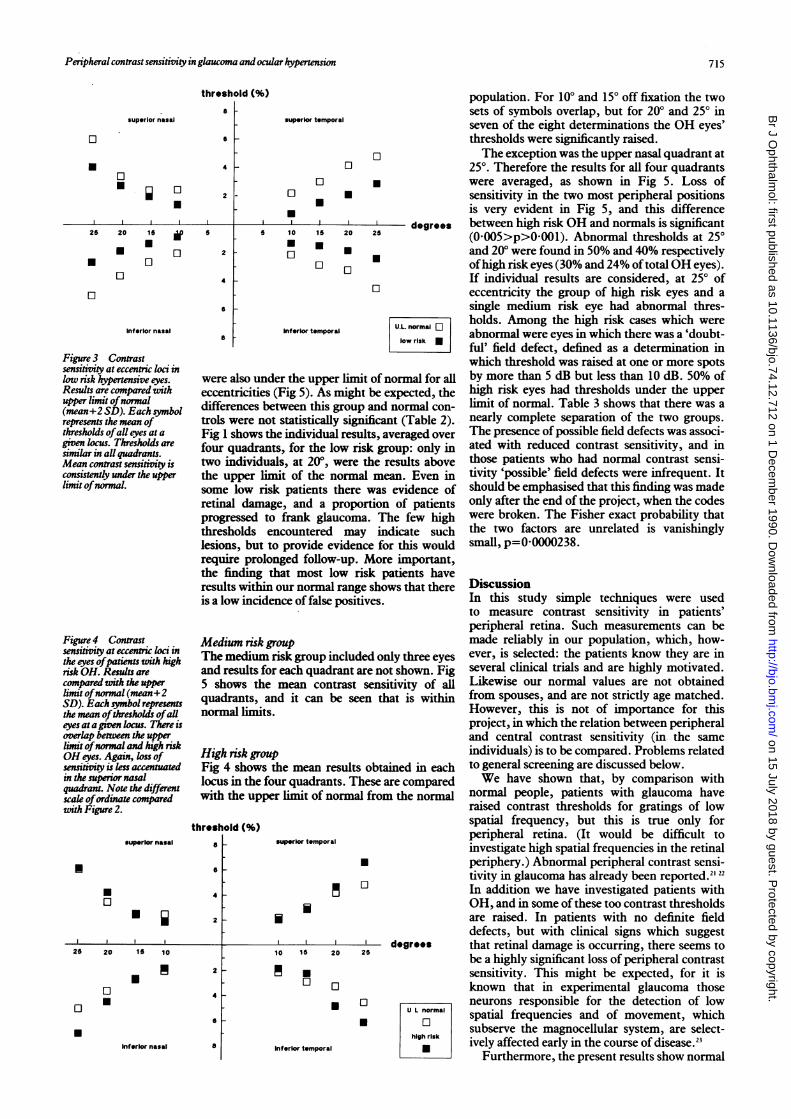
Figure 4 Contrastsensitive at eccentric loci inthe eyes ofpatients with highrisk OH. Results arecompared with the upperlimit ofnormal (mean+2SD). Each symbol representsthe mean ofthresholds ofalleyes at a given locus. There isoverlap between the upperlimit ofnormal and high riskOH eyes. Again, loss ofsensitivity is less accentuatedin the superior nasalquadrant. Note the differentscale ofordinate comparedwith Figure 2.
a
superior temporal
ElU
5 10
.El
ElU
15
U
El
Inferior temporal
were also under the upper limit of normal for alleccentricities (Fig 5). As might be expected, thedifferences between this group and normal con-trols were not statistically significant (Table 2).Fig 1 shows the individual results, averaged overfour quadrants, for the low risk group: only intwo individuals, at 200, were the results abovethe upper limit of the normal mean. Even insome low risk patients there was evidence ofretinal damage, and a proportion of patientsprogressed to frank glaucoma. The few highthresholds encountered may indicate suchlesions, but to provide evidence for this wouldrequire prolonged follow-up. More important,the finding that most low risk patients haveresults withinis a low incid
Medium risk gThe mediumand results fc5 shows thequadrants, anormal limits
High risk gronFig 4 showslocus in the fiwith the upp
threshold (%)superior nasal 5s
S
4U0
H i
25 20 15 10
*ElU
2
2
4
S
8
population. For 100 and 150 off fixation the twosets of symbols overlap, but for 200 and 250 inseven of the eight determinations the OH eyes'thresholds were significantly raised.The exception was the upper nasal quadrant at
250. Therefore the results for all four quadrantswere averaged, as shown in Fig 5. Loss ofsensitivity in the two most peripheral positionsis very evident in Fig 5, and this differencebetween high risk OH and normals is significant(0-005>p>0-001). Abnormal thresholds at 250and 20° were found in 50% and 40% respectivelyofhigh risk eyes (30% and 24% of total OH eyes).If individual results are considered, at 250 ofeccentricity the group of high risk eyes and asingle medium risk eye had abnormal thres-holds. Among the high risk cases which wereabnormal were eyes in which there was a 'doubt-ful' field defect, defined as a determination inwhich threshold was raised at one or more spotsby more than 5 dB but less than 10 dB. 50% ofhigh risk eyes had thresholds under the upperlimit of normal. Table 3 shows that there was anearly complete separation of the two groups.The presence of possible field defects was associ-ated with reduced contrast sensitivity, and inthose patients who had normal contrast sensi-tivity 'possible' field defects were infrequent. Itshould be emphasised that this finding was madeonly after the end of the project, when the codeswere broken. The Fisher exact probability thatthe two factors are unrelated is vanishinglysmall, p=00000238.
a our normalraneshows that there Discussionfence of false positives. In this study simple techniques were used
to measure contrast sensitivity in patients'peripheral retina. Such measurements can be
group made reliably in our population, which, how-Urisk group included only three eyes ever, is selected: the patients know they are in)r each quadrant are not shown. Fig several clinical trials and are highly motivated.mean contrast sensitivity of all Likewise our normal values are not obtainedendit can be seen that is within from spouses, and are not strictly age matched.
I. However, this is not of importance for thisproject, in which the relation between peripheraland central contrast sensitivity (in the same
4p individuals) is to be compared. Problems relatedthe mean results obtained in each to general screening are discussed below.bur quadrants. These are compared We have shown that, by comparison wither limit of normal from the normal normal people, patients with glaucoma have
raised contrast thresholds for gratings of lowspatial frequency, but this is true only for
superior temporal peripheral retina. (It would be difficult toinvestigate high spatial frequencies in the retinal
* periphery.) Abnormal peripheral contrast sensi-tivity in glaucoma has already been reported."22In addition we have investigated patients withOH, and in some of these too contrast thresholdsare raised. In patients with no definite fielddefects, but with clinical signs which suggest
I° I520 5 degrees that retinal damage is occurring, there seems tobe a highly significant loss of peripheral contrast
-* sensitivity. This might be expected, for it is° known that in experimental glaucoma those
L neurons responsible for the detection of low*ULnormal spatial frequencies and of movement, which* El subserve the magnocellular system, are select-high risk lively affected early in the course of disease.2
Inferlor temporal M Furthermore, the present results show normal
U
U
U
0
.Inferior nasal
715
k
on 15 July 2018 by guest. Protected by copyright.
http://bjo.bmj.com
/B
r J Ophthalm
ol: first published as 10.1136/bjo.74.12.712 on 1 Decem
ber 1990. Dow
nloaded from
Falcdo-Reis, O'Donoghue, Buceti, Hitchings, Arden
20
10
5
2
0.0
u normal
low risk
0medium risk
Elhigh risk
Aglaucoma
A
0 10 1 5 20 25
degrees of eccentricity
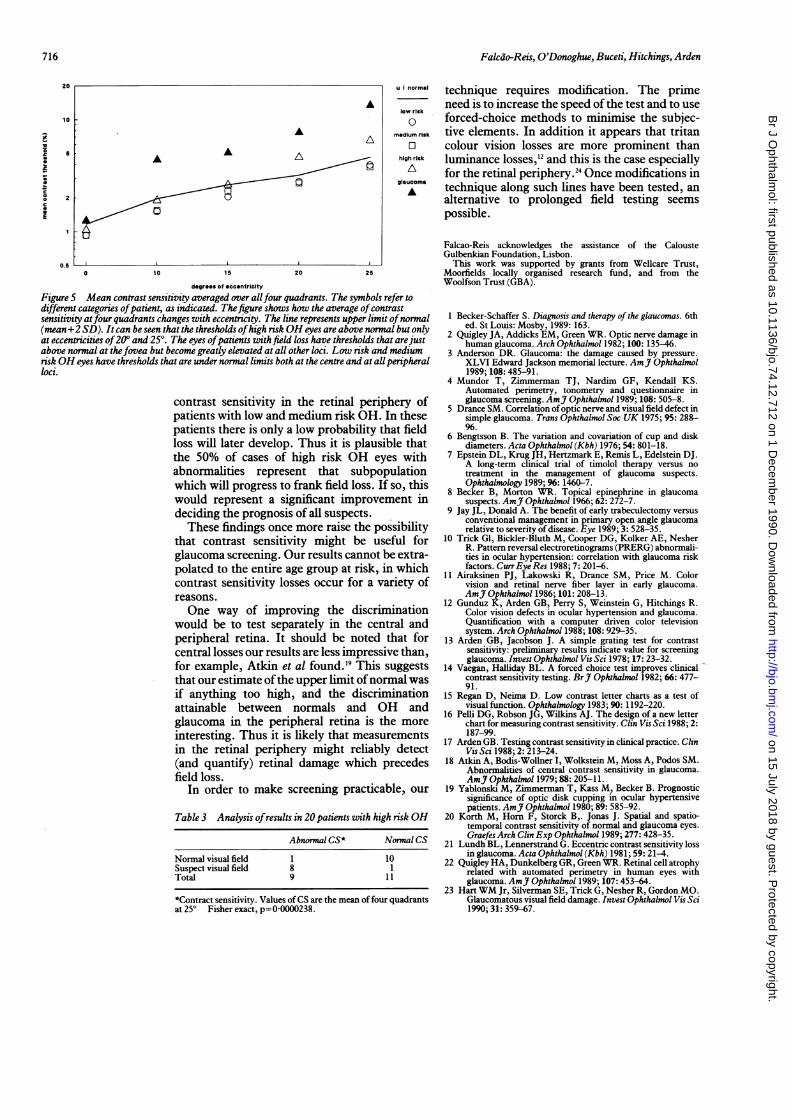
Figure 5 Mean contrast sensitivity averaged over allfour quadrants. The symbols refer todifferent categories ofpatient, as indicated. Thefigure shows how the average ofcontrastsensitivity atfour quadrants changes with eccentricity. The line represents upper limit ofnormal(mean+2 SD). It can be seen that the thresholds ofhigh risk OH eyes are above normal but onlyat eccentricities of20° and 250. The eyes ofpatients with field loss have thresholds that arejustabove normal at thefovea but become greatly elevated at all other loci. Low risk and mediumrisk OH eyes have thresholds that are under normal limits both at the centre and at all peripheralloci.
contrast sensitivity in the retinal periphery ofpatients with low and medium risk OH. In thesepatients there is only a low probability that fieldloss will later develop. Thus it is plausible thatthe 50% of cases of high risk OH eyes withabnormalities represent that subpopulationwhich will progress to frank field loss. If so, thiswould represent a significant improvement indeciding the prognosis of all suspects.
These findings once more raise the possibilitythat contrast sensitivity might be useful forglaucoma screening. Our results cannot be extra-polated to the entire age group at risk, in whichcontrast sensitivity losses occur for a variety ofreasons.One way of improving the discrimination
would be to test separately in the central andperipheral retina. It should be noted that forcentral losses our results are less impressive than,for example, Atkin et al found.'9 This suggeststhat our estimate ofthe upper limit ofnormal wasif anything too high, and the discriminationattainable between normals and OH andglaucoma in the peripheral retina is the moreinteresting. Thus it is likely that measurementsin the retinal periphery might reliably detect(and quantify) retinal damage which precedesfield loss.
In order to make screening practicable, our
Table 3 Analysis ofresults in 20 patients with high risk OH
Abnormal CS* Normal CS
Normal visual field 1 10Suspect visual field 8 1Total 9 11
*Contract sensitivity. Values ofCS are the mean of four quadrantsat 25° Fisher exact, p=0-0000238.
technique requires modification. The primeneed is to increase the speed of the test and to useforced-choice methods to minimise the subjec-tive elements. In addition it appears that tritancolour vision losses are more prominent thanluminance losses,' and this is the case especiallyfor the retinal periphery.24 Once modifications intechnique along such lines have been tested, analternative to prolonged field testing seemspossible.
Falcao-Reis acknowledges the assistance of the CalousteGulbenkian Foundation, Lisbon.
This work was supported by grants from Wellcare Trust,Moorfields locally organised research fund, and from theWoolfson Trust (GBA).
1 Becker-Schaffer S. Diagnosis and therapy of the glaucomas. 6thed. St Louis: Mosby, 1989: 163.
2 Quigley JA, Addicks EM, Green WR. Optic nerve damage inhuman glaucoma. Arch Ophthalmol 1982; 100: 135-46.
3 Anderson DR. Glaucoma: the damage caused by pressure.XLVI Edward Jackson memorial lecture. AmJ Ophthalmol1989; 108:485-91.
4 Mundor T, Zimmerman TJ, Nardim GF, Kendall KS.Automated perimetry, tonometry and questionnaire inglaucoma screening. AmJ Ophthalmol 1989; 108: 505-8.
5 Drance SM. Correlation ofoptic nerve and visual field defect insimple glaucoma. Trans Ophthalmol Soc UK 1975; 95: 288-
6 Bengtsson B. The variation and covariation of cup and diskdiameters. Acta Ophthalmol (Kbh) 1976; 54: 801-18.
7 Epstein DL, Krug JH, Hertzmark E, Remis L, Edelstein DJ.A long-term clinical trial of timolol therapy versus notreatment in the management of glaucoma suspects.Ophthalmology 1989; 96: 1460-7.
8 Becker B, Morton WR. Topical epinephrine in glaucomasuspects. AmJ Ophthalmol 1966; 62: 272-7.
9 Jay JL, Donald A. The benefit of early trabeculectomy versusconventional management in primary open angle glaucomarelative to severity of disease. Eye 1989; 3: 528-35.
10 Trick GI, Bickler-Bluth M, Cooper DG, Kolker AE, NesherR. Pattern reversal electroretinograms (PRERG) abnormali-ties in ocular hypertension: correlation with glaucoma riskfactors. Curr Eye Res 1988; 7: 201-6.
11 Airaksinen PJ, Lakowski R, Drance SM, Price M. Colorvision and retinal nerve fiber layer in early glaucoma.AmJ Ophthalmol 1986; 101: 208-13.
12 Gunduz K, Arden GB, Perry S, Weinstein G, Hitchings R.Color vision defects in ocular hypertension and glaucoma.Quantification with a computer driven color televisionsystem. Arch Ophthalmol 1988; 108: 929-35.
13 Arden GB, Jacobson J. A simple grating test for contrastsensitivity: preliminary results indicate value for screeningglaucoma. Invest Ophthalmol Vis Sci 1978; 17: 23-32.
14 Vaegan, Halliday BL. A forced choice test improves clinicalcontrast sensitivity testing. BrJ Ophthalmol 1982; 66: 477-91.
15 Regan D, Neima D. Low contrast letter charts as a test ofvisual function. Ophthalmology 1983; 90: 1192-220.
16 Pelli DG, Robson JG, Wilkins AJ. The design of a new letterchart for measuring contrast sensitivity. Clin Vis Sci 1988; 2:187-99.
17 Arden GB. Testing contrast sensitivity in clinical practice. ClinVisSci 1988; 2: 213-24.
18 Atkin A, Bodis-Wollner I, Wolkstein M, Moss A, Podos SM.Abnormalities of central contrast sensitivity in glaucoma.AmJ Ophthalmol 1979; 88: 205-11.
19 Yablonski M, Zimmerman T, Kass M, Becker B. Prognosticsignificance of optic disk cupping in ocular hypertensivepatients. AmJ Ophthalmol 1980; 89: 585-92.
20 Korth M, Horn F, Storck B,. Jonas J. Spatial and spatio-temporal contrast sensitivity of normal and glaucoma eyes.GraefesArch Clin Exp Ophthalmol 1989; 277: 428-35.
21 Lundh BL, Lennerstrand G. Eccentric contrast sensitivity lossin glaucoma. Acta Ophthalmol (Kbh) 1981; 59: 21-4.
22 Quigley HA, Dunkelberg GR, Green WR. Retinal cell atrophyrelated with automated perimetry in human eyes withglaucoma. AmJ Ophthalmol 1989; 107: 453-64.
23 Hart WM Jr, Silverman SE, Trick G, Nesher R, Gordon MO.Glaucomatous visual field damage. Invest Ophthalmol Vis Sci1990; 31: 359-67.
716
on 15 July 2018 by guest. Protected by copyright.
http://bjo.bmj.com
/B
r J Ophthalm
ol: first published as 10.1136/bjo.74.12.712 on 1 Decem
ber 1990. Dow
nloaded from