Embed Size (px)
Citation preview
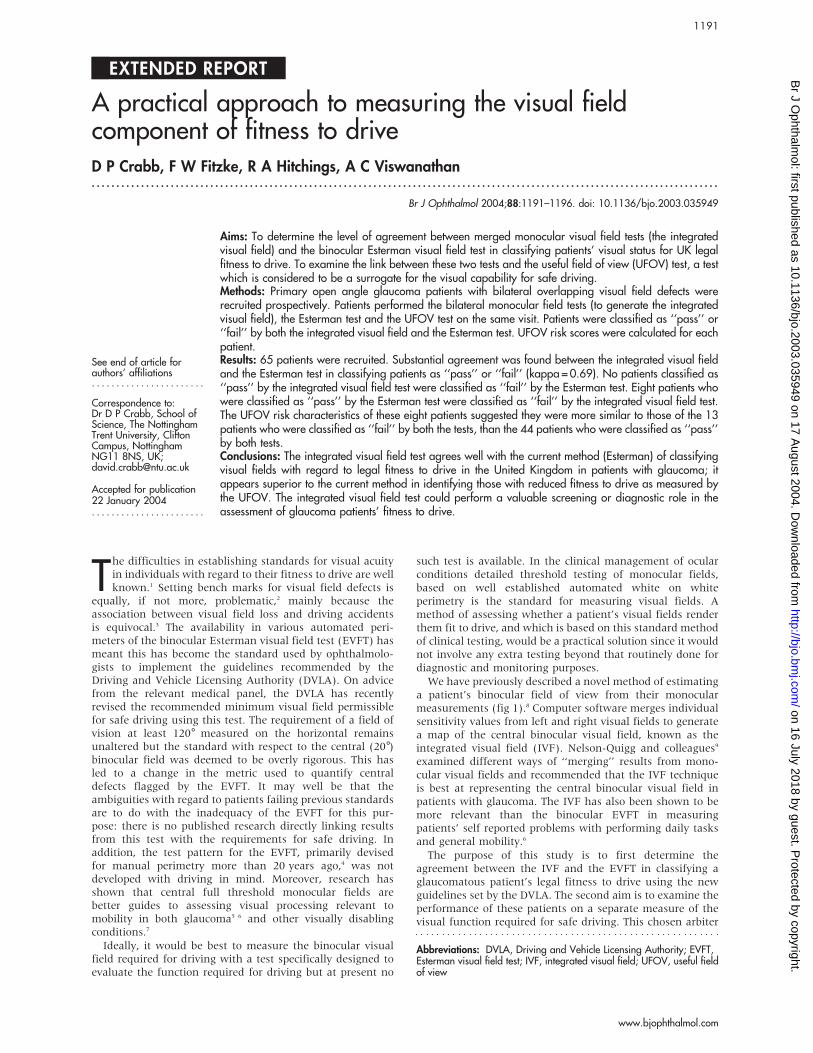
EXTENDED REPORT
A practical approach to measuring the visual fieldcomponent of fitness to driveD P Crabb, F W Fitzke, R A Hitchings, A C Viswanathan. . . . . . . . . . . . . . . . . . . . . . . . . . . . . . . . . . . . . . . . . . . . . . . . . . . . . . . . . . . . . . . . . . . . . . . . . . . . . . . . . . . . . . . . . . . . . . . . . . . . . . . . . . . . . . . . . . . . . . . . . . . . . . .
See end of article forauthors’ affiliations. . . . . . . . . . . . . . . . . . . . . . .
Correspondence to:Dr D P Crabb, School ofScience, The NottinghamTrent University, CliftonCampus, NottinghamNG11 8NS, UK;[email protected]
Accepted for publication22 January 2004. . . . . . . . . . . . . . . . . . . . . . .
Br J Ophthalmol 2004;88:1191–1196. doi: 10.1136/bjo.2003.035949
Aims: To determine the level of agreement between merged monocular visual field tests (the integratedvisual field) and the binocular Esterman visual field test in classifying patients’ visual status for UK legalfitness to drive. To examine the link between these two tests and the useful field of view (UFOV) test, a testwhich is considered to be a surrogate for the visual capability for safe driving.Methods: Primary open angle glaucoma patients with bilateral overlapping visual field defects wererecruited prospectively. Patients performed the bilateral monocular field tests (to generate the integratedvisual field), the Esterman test and the UFOV test on the same visit. Patients were classified as ‘‘pass’’ or‘‘fail’’ by both the integrated visual field and the Esterman test. UFOV risk scores were calculated for eachpatient.Results: 65 patients were recruited. Substantial agreement was found between the integrated visual fieldand the Esterman test in classifying patients as ‘‘pass’’ or ‘‘fail’’ (kappa=0.69). No patients classified as‘‘pass’’ by the integrated visual field test were classified as ‘‘fail’’ by the Esterman test. Eight patients whowere classified as ‘‘pass’’ by the Esterman test were classified as ‘‘fail’’ by the integrated visual field test.The UFOV risk characteristics of these eight patients suggested they were more similar to those of the 13patients who were classified as ‘‘fail’’ by both the tests, than the 44 patients who were classified as ‘‘pass’’by both tests.Conclusions: The integrated visual field test agrees well with the current method (Esterman) of classifyingvisual fields with regard to legal fitness to drive in the United Kingdom in patients with glaucoma; itappears superior to the current method in identifying those with reduced fitness to drive as measured bythe UFOV. The integrated visual field test could perform a valuable screening or diagnostic role in theassessment of glaucoma patients’ fitness to drive.
The difficulties in establishing standards for visual acuityin individuals with regard to their fitness to drive are wellknown.1 Setting bench marks for visual field defects is
equally, if not more, problematic,2 mainly because theassociation between visual field loss and driving accidentsis equivocal.3 The availability in various automated peri-meters of the binocular Esterman visual field test (EVFT) hasmeant this has become the standard used by ophthalmolo-gists to implement the guidelines recommended by theDriving and Vehicle Licensing Authority (DVLA). On advicefrom the relevant medical panel, the DVLA has recentlyrevised the recommended minimum visual field permissiblefor safe driving using this test. The requirement of a field ofvision at least 120˚ measured on the horizontal remainsunaltered but the standard with respect to the central (20 )binocular field was deemed to be overly rigorous. This hasled to a change in the metric used to quantify centraldefects flagged by the EVFT. It may well be that theambiguities with regard to patients failing previous standardsare to do with the inadequacy of the EVFT for this pur-pose: there is no published research directly linking resultsfrom this test with the requirements for safe driving. Inaddition, the test pattern for the EVFT, primarily devisedfor manual perimetry more than 20 years ago,4 was notdeveloped with driving in mind. Moreover, research hasshown that central full threshold monocular fields arebetter guides to assessing visual processing relevant tomobility in both glaucoma5 6 and other visually disablingconditions.7
Ideally, it would be best to measure the binocular visualfield required for driving with a test specifically designed toevaluate the function required for driving but at present no
such test is available. In the clinical management of ocularconditions detailed threshold testing of monocular fields,based on well established automated white on whiteperimetry is the standard for measuring visual fields. Amethod of assessing whether a patient’s visual fields renderthem fit to drive, and which is based on this standard methodof clinical testing, would be a practical solution since it wouldnot involve any extra testing beyond that routinely done fordiagnostic and monitoring purposes.We have previously described a novel method of estimating
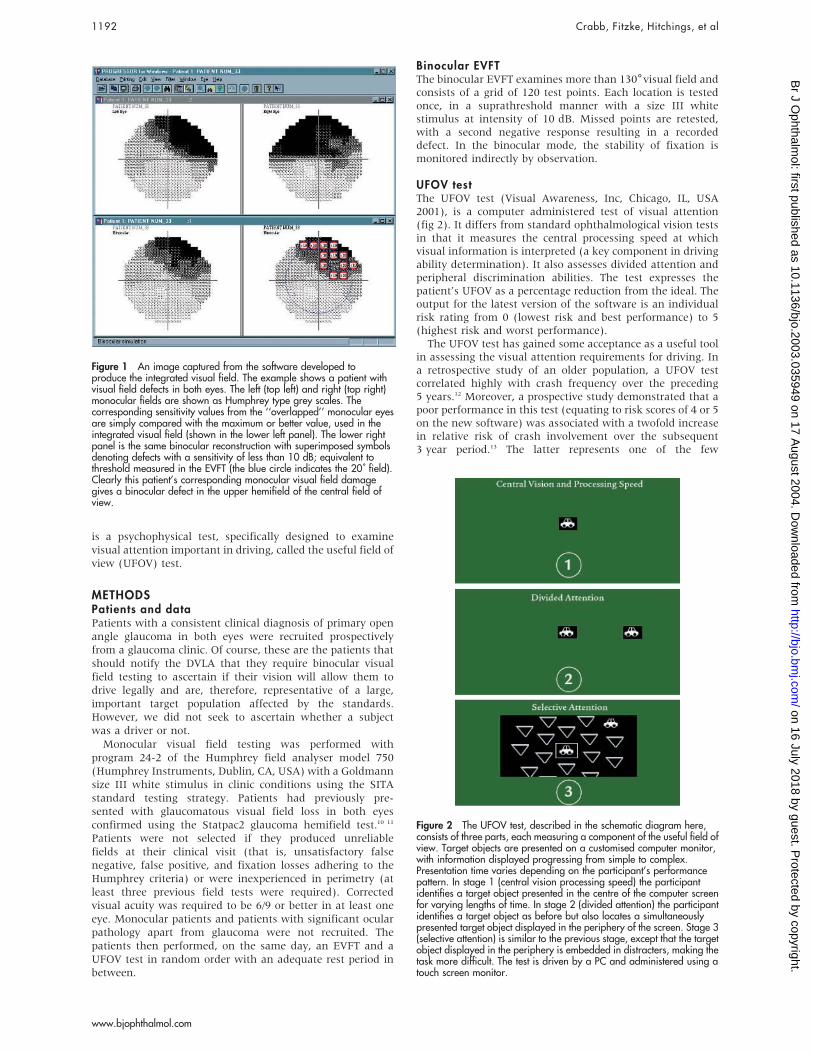
a patient’s binocular field of view from their monocularmeasurements (fig 1).8 Computer software merges individualsensitivity values from left and right visual fields to generatea map of the central binocular visual field, known as theintegrated visual field (IVF). Nelson-Quigg and colleagues9
examined different ways of ‘‘merging’’ results from mono-cular visual fields and recommended that the IVF techniqueis best at representing the central binocular visual field inpatients with glaucoma. The IVF has also been shown to bemore relevant than the binocular EVFT in measuringpatients’ self reported problems with performing daily tasksand general mobility.6
The purpose of this study is to first determine theagreement between the IVF and the EVFT in classifying aglaucomatous patient’s legal fitness to drive using the newguidelines set by the DVLA. The second aim is to examine theperformance of these patients on a separate measure of thevisual function required for safe driving. This chosen arbiter
Abbreviations: DVLA, Driving and Vehicle Licensing Authority; EVFT,Esterman visual field test; IVF, integrated visual field; UFOV, useful fieldof view
1191
www.bjophthalmol.com
on 16 July 2018 by guest. Protected by copyright.
http://bjo.bmj.com
/B
r J Ophthalm
ol: first published as 10.1136/bjo.2003.035949 on 17 August 2004. D
ownloaded from
is a psychophysical test, specifically designed to examinevisual attention important in driving, called the useful field ofview (UFOV) test.
METHODSPatients and dataPatients with a consistent clinical diagnosis of primary openangle glaucoma in both eyes were recruited prospectivelyfrom a glaucoma clinic. Of course, these are the patients thatshould notify the DVLA that they require binocular visualfield testing to ascertain if their vision will allow them todrive legally and are, therefore, representative of a large,important target population affected by the standards.However, we did not seek to ascertain whether a subjectwas a driver or not.Monocular visual field testing was performed with
program 24-2 of the Humphrey field analyser model 750(Humphrey Instruments, Dublin, CA, USA) with a Goldmannsize III white stimulus in clinic conditions using the SITAstandard testing strategy. Patients had previously pre-sented with glaucomatous visual field loss in both eyesconfirmed using the Statpac2 glaucoma hemifield test.10 11
Patients were not selected if they produced unreliablefields at their clinical visit (that is, unsatisfactory falsenegative, false positive, and fixation losses adhering to theHumphrey criteria) or were inexperienced in perimetry (atleast three previous field tests were required). Correctedvisual acuity was required to be 6/9 or better in at least oneeye. Monocular patients and patients with significant ocularpathology apart from glaucoma were not recruited. Thepatients then performed, on the same day, an EVFT and aUFOV test in random order with an adequate rest period inbetween.
Binocular EVFTThe binocular EVFT examines more than 130˚visual field andconsists of a grid of 120 test points. Each location is testedonce, in a suprathreshold manner with a size III whitestimulus at intensity of 10 dB. Missed points are retested,with a second negative response resulting in a recordeddefect. In the binocular mode, the stability of fixation ismonitored indirectly by observation.
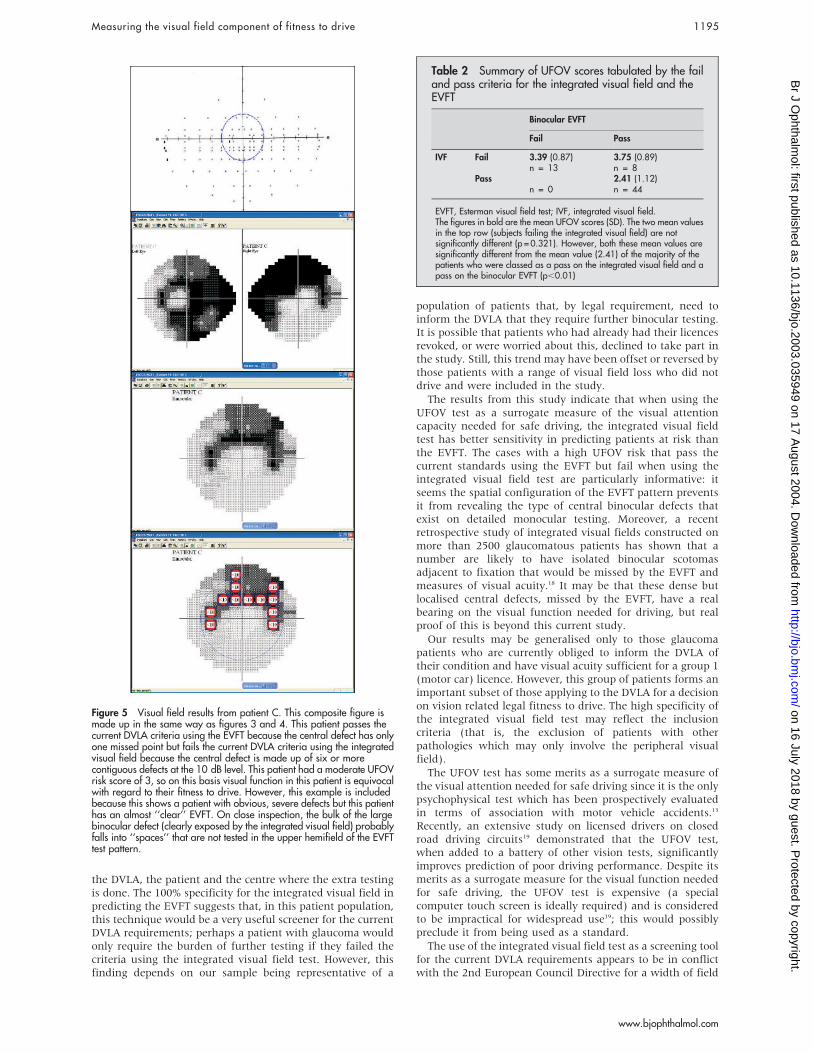
UFOV testThe UFOV test (Visual Awareness, Inc, Chicago, IL, USA2001), is a computer administered test of visual attention(fig 2). It differs from standard ophthalmological vision testsin that it measures the central processing speed at whichvisual information is interpreted (a key component in drivingability determination). It also assesses divided attention andperipheral discrimination abilities. The test expresses thepatient’s UFOV as a percentage reduction from the ideal. Theoutput for the latest version of the software is an individualrisk rating from 0 (lowest risk and best performance) to 5(highest risk and worst performance).The UFOV test has gained some acceptance as a useful tool
in assessing the visual attention requirements for driving. Ina retrospective study of an older population, a UFOV testcorrelated highly with crash frequency over the preceding5 years.12 Moreover, a prospective study demonstrated that apoor performance in this test (equating to risk scores of 4 or 5on the new software) was associated with a twofold increasein relative risk of crash involvement over the subsequent3 year period.13 The latter represents one of the few
Figure 1 An image captured from the software developed toproduce the integrated visual field. The example shows a patient withvisual field defects in both eyes. The left (top left) and right (top right)monocular fields are shown as Humphrey type grey scales. Thecorresponding sensitivity values from the ‘‘overlapped’’ monocular eyesare simply compared with the maximum or better value, used in theintegrated visual field (shown in the lower left panel). The lower rightpanel is the same binocular reconstruction with superimposed symbolsdenoting defects with a sensitivity of less than 10 dB; equivalent tothreshold measured in the EVFT (the blue circle indicates the 20˚ field).Clearly this patient’s corresponding monocular visual field damagegives a binocular defect in the upper hemifield of the central field ofview.
Figure 2 The UFOV test, described in the schematic diagram here,consists of three parts, each measuring a component of the useful field ofview. Target objects are presented on a customised computer monitor,with information displayed progressing from simple to complex.Presentation time varies depending on the participant’s performancepattern. In stage 1 (central vision processing speed) the participantidentifies a target object presented in the centre of the computer screenfor varying lengths of time. In stage 2 (divided attention) the participantidentifies a target object as before but also locates a simultaneouslypresented target object displayed in the periphery of the screen. Stage 3(selective attention) is similar to the previous stage, except that the targetobject displayed in the periphery is embedded in distracters, making thetask more difficult. The test is driven by a PC and administered using atouch screen monitor.
1192 Crabb, Fitzke, Hitchings, et al
www.bjophthalmol.com
on 16 July 2018 by guest. Protected by copyright.
http://bjo.bmj.com
/B
r J Ophthalm
ol: first published as 10.1136/bjo.2003.035949 on 17 August 2004. D
ownloaded from

prospective studies undertaken in the ‘‘methodologicallyhazardous’’ research area of vision and driving accidents.3
The UFOV test was administered to the patients in thisstudy according to the instructions in the UFOV User’s Guide(Visual Awareness, Inc, Chicago, IL, USA, 2001) followingthe standard verbal guidance and implementing the practicesessions. Viewing conditions and distances were kept asconsistent as possible following the guidelines.
Assessing the EVFT and integrated visual fieldsThe EVFT for each patient was classified as either a ‘‘pass’’ or‘‘fail’’ in relation to the current group 1 (ordinary licence)visual field standard for driving issued by the DVLA(www.dvla.gov.uk). In short, for retinal conditions such asglaucoma anything less than, or equal to, scattered singlemissed points or a single cluster of two or three contiguouspoints in the area within 20˚of fixation indicates a ‘‘pass.’’However, significant and therefore unacceptable centraldefects are a cluster of four or more contiguous points thatlie either wholly or partly within the central 20˚area, or lossconsisting of both a single cluster of three contiguous missedpoints up to and including 20˚ from fixation, and anyadditional separate missed point(s) within the central 20˚area, and this is classed as a ‘‘fail.’’ In addition, a patient was‘‘failed’’ if there was peripheral constriction of the binocularfield as set out in the guidelines.Integrated visual fields were constructed for each patient
using the Progressor software (Institute of Ophthalmology,University College London)8 14 15 with 10 dB sensitivitysymbols ‘‘equivalent’’ to a point missed on the EVFT. Theseintegrated visual fields were also classified as either ‘‘pass’’ or‘‘fail’’ in relation to the same DVLA standards, with somenotable corrections. The EVFT only tests 24 points whereasthe integrated visual field examines 32 points in the central20˚area; hence, the integrated visual field will be more likelyto flag a visual field as a ‘‘fail’’ by chance alone. So, for theintegrated visual field we adjusted the definition from abovesuch that six (32/2464 rounded to a whole figure) or morecontiguous points either wholly or partly within the central20˚ area, or a single cluster of four (32/2463) contiguouspoints with any additional separate points would constitute afail. While this takes account of the extra points ‘‘tested’’ itdoes not account for differences in the spatial test patternbetween the different measures, and this is where wehypothesised that the EVFT may lack sensitivity in detectingrelevant defects.Once the classification of the patients was complete, all the
data (including the UFOV risk scores) were transferred tostatistical software where frequency tables were constructedand data analysis carried out.
RESULTSSixty five POAG patients, satisfying all the methodologicalcriteria, took part in this prospective study. The mean age ofthe patients at examination was 69.3 years (range 30–85 years). Patients presented with a wide range of visualfield defects in both eyes. The sample mean Humphrey MD(mean deviation) was 211.8 dB (SD 6.0 dB; range 21.4 to227.5 dB) for the left eye and 211.7 dB (SD 5.3 dB; range21.4 to 221.9 dB) for the right eye.The simple frequency table shown in table 1 highlights
several interesting results. Firstly, the agreement between thetwo techniques in classifying a patient as passing or failingthe visual field component of fitness to drive is good (57, or88% exact agreements). The kappa value assesses theagreement beyond what would be expected by chancealone.16 In this case kappa=0.69 (SE 0.10), and such levelsof agreement are described as ‘‘substantial.’’17
Forty four (68%) patients passed the fitness to drive criteriain both tests. If we assume that our sample is representativeof a population of patients that, by legal requirement, need toinform the DVLA that they require further binocular testingbecause they have bilateral field defects, then it seems abouttwo thirds (95% confidence interval for this percentage, usingthe binomial distribution, is 55% to 79%) will actually go onto satisfy the requirements of both tests.No patients in this sample passed the requirement on the
integrated visual field test but failed using the current EVFTstandard. In fact, we have yet to find a single example of apatient in this category (59 patients were considered in ourprevious published study looking at the same patientpopulation). This 100% specificity for the integrated visualfield test in predicting the EVFT suggests that, in this patientpopulation, this technique would be a useful screener for theDVLA requirements as they stand. The absence of any casespassing with the integrated visual field test but failing withthe EVFT is also important for another reason: none of theglaucomatous patients representative of the target populationprospectively examined had a peripheral defect without acentral visual field defect. This suggests, certainly in patientswith glaucoma, that the central field is sufficient todistinguish ‘‘pass’’ from ‘‘fail.’’The next interesting feature in table 1 concerns the eight
cases where the techniques gave different classifications—that is, a patient failed the criteria using the integrated visualfield test but passed when using the binocular EVFT, andwould therefore be considered legally fit to drive. Four ofthese subjects had a UFOV risk rating of 4 or 5; a level ofperformance in UFOV which has been shown to equate withan increased risk of a car accident involvement.13 (The otherfour subjects all had a risk rating of 3, with none of the casesin the low or no risk category.) A selection of these eightcases is shown in figures 3–5. Some statistics, summarised intable 2, suggest that the integrated visual field is moresensitive than the EVFT at detecting a visual field required forsafe driving when using the UFOV as the arbiter: the meanUFOV risk score for the eight cases where the techniquesdisagree does not significantly differ from the mean UFOVrisk score for that group of patients where both techniquesfailed the patient (independent t test; p=0.371). Conversely,the mean UFOV values of these two individual groups dodiffer significantly from the mean UFOV value recorded forthe 44 patients who passed the criteria using both methods(independent t test; p=0.003 for fail/fail against pass/pass,and p=0.003 for fail/pass against pass/pass). (Since we weremaking multiple comparisons, the statistical significance ofthese individual comparisons were confirmed, using a oneway ANOVA with post hoc Tukey’s test for means at the 1%level of significance.) Therefore, these UFOV results indicatethat the eight cases are more likely to belong to thepopulation of patients at risk when driving because of theirvision, and are less likely to belong to the population not atrisk. In turn, this implies that the integrated visual field hasbetter sensitivity in detecting those at risk.
Table 1 Frequency table comparing the EVFTand the integrated visual field test in quantifyingwhether a patient would fail or pass the currentDVLA criteria
Binocular EVFT
Fail Pass
IVF Fail 13 8Pass 0 44
EVFT, Esterman visual field test; IVF, integrated visual field.
Measuring the visual field component of fitness to drive 1193
www.bjophthalmol.com
on 16 July 2018 by guest. Protected by copyright.
http://bjo.bmj.com
/B
r J Ophthalm
ol: first published as 10.1136/bjo.2003.035949 on 17 August 2004. D
ownloaded from

DISCUSSIONIt is not surprising that the integrated visual field and theEVFT had substantial agreement about whether patientswere in the ‘‘pass’’ or ‘‘fail’’ categories: previous work has
shown that the integrated visual field is a good predictor ofthe binocular field.8 9 This finding could equate to a massivesaving in resources since the integrated visual fields could berapidly and easily constructed during a routine visit.This study also suggests that around two thirds (and
almost certainly more than half) of glaucoma patients whoare subjected to the legal requirement of further visual fieldtesting because they have bilateral defects will actually go onto pass that extra test, and therefore be fit to drive. Thistesting must currently represent a burden on resources for
Figure 3 Visual field results from patient A. The top panel shows theEVFT (the superimposed blue line indicates the central 20˚ area). Thispatient passes the current DVLA criteria using the EVFT because thecentral defect is made up on only three missed points. The panel belowthe EVFT shows the monocular Humphrey grey scale for the same patientindicating the patient has bilateral visual field defects. The next panelshows the integrated visual field with the bottom panel showing the samereconstruction but with superimposed symbols denoting defects with asensitivity of less than 10 dB; equivalent to threshold measured in theEVFT (the blue circle indicates the 20˚ field). This patient fails the currentDVLA criteria using the integrated visual field because the central defectis made up of six or more contiguous defects at the 10 dB level. Thispatient had a high UFOV risk score of 4. This risk has been shown toequate with an increased risk of a car accident.14 This may suggest thatthis patient does not have a field of view compatible with safe driving,though according to the current standards this patient would be deemedfit to drive.
Figure 4 Visual field results from patient B. This composite figure ismade up in the same way as figure 3. This patient passes the currentDVLA criteria using the EVFT because the central defect is made up ononly two missed points but fails the current DVLA criteria using theintegrated visual field because the central defect is made up of six ormore contiguous defects at the 10 dB level. This patient had a very highUFOV risk score of 5. This risk has been shown to equate with anincreased risk of a car accident.14 This may suggest that this patient doesnot have a field of view compatible with safe driving, though accordingto the current EVFT standards this patient would be deemed fit to drive.
1194 Crabb, Fitzke, Hitchings, et al
www.bjophthalmol.com
on 16 July 2018 by guest. Protected by copyright.
http://bjo.bmj.com
/B
r J Ophthalm
ol: first published as 10.1136/bjo.2003.035949 on 17 August 2004. D
ownloaded from
the DVLA, the patient and the centre where the extra testingis done. The 100% specificity for the integrated visual field inpredicting the EVFT suggests that, in this patient population,this technique would be a very useful screener for the currentDVLA requirements; perhaps a patient with glaucoma wouldonly require the burden of further testing if they failed thecriteria using the integrated visual field test. However, thisfinding depends on our sample being representative of a
population of patients that, by legal requirement, need toinform the DVLA that they require further binocular testing.It is possible that patients who had already had their licencesrevoked, or were worried about this, declined to take part inthe study. Still, this trend may have been offset or reversed bythose patients with a range of visual field loss who did notdrive and were included in the study.The results from this study indicate that when using the
UFOV test as a surrogate measure of the visual attentioncapacity needed for safe driving, the integrated visual fieldtest has better sensitivity in predicting patients at risk thanthe EVFT. The cases with a high UFOV risk that pass thecurrent standards using the EVFT but fail when using theintegrated visual field test are particularly informative: itseems the spatial configuration of the EVFT pattern preventsit from revealing the type of central binocular defects thatexist on detailed monocular testing. Moreover, a recentretrospective study of integrated visual fields constructed onmore than 2500 glaucomatous patients has shown that anumber are likely to have isolated binocular scotomasadjacent to fixation that would be missed by the EVFT andmeasures of visual acuity.18 It may be that these dense butlocalised central defects, missed by the EVFT, have a realbearing on the visual function needed for driving, but realproof of this is beyond this current study.Our results may be generalised only to those glaucoma
patients who are currently obliged to inform the DVLA oftheir condition and have visual acuity sufficient for a group 1(motor car) licence. However, this group of patients forms animportant subset of those applying to the DVLA for a decisionon vision related legal fitness to drive. The high specificity ofthe integrated visual field test may reflect the inclusioncriteria (that is, the exclusion of patients with otherpathologies which may only involve the peripheral visualfield).The UFOV test has some merits as a surrogate measure of
the visual attention needed for safe driving since it is the onlypsychophysical test which has been prospectively evaluatedin terms of association with motor vehicle accidents.13
Recently, an extensive study on licensed drivers on closedroad driving circuits19 demonstrated that the UFOV test,when added to a battery of other vision tests, significantlyimproves prediction of poor driving performance. Despite itsmerits as a surrogate measure for the visual function neededfor safe driving, the UFOV test is expensive (a specialcomputer touch screen is ideally required) and is consideredto be impractical for widespread use19; this would possiblypreclude it from being used as a standard.The use of the integrated visual field test as a screening tool
for the current DVLA requirements appears to be in conflictwith the 2nd European Council Directive for a width of field
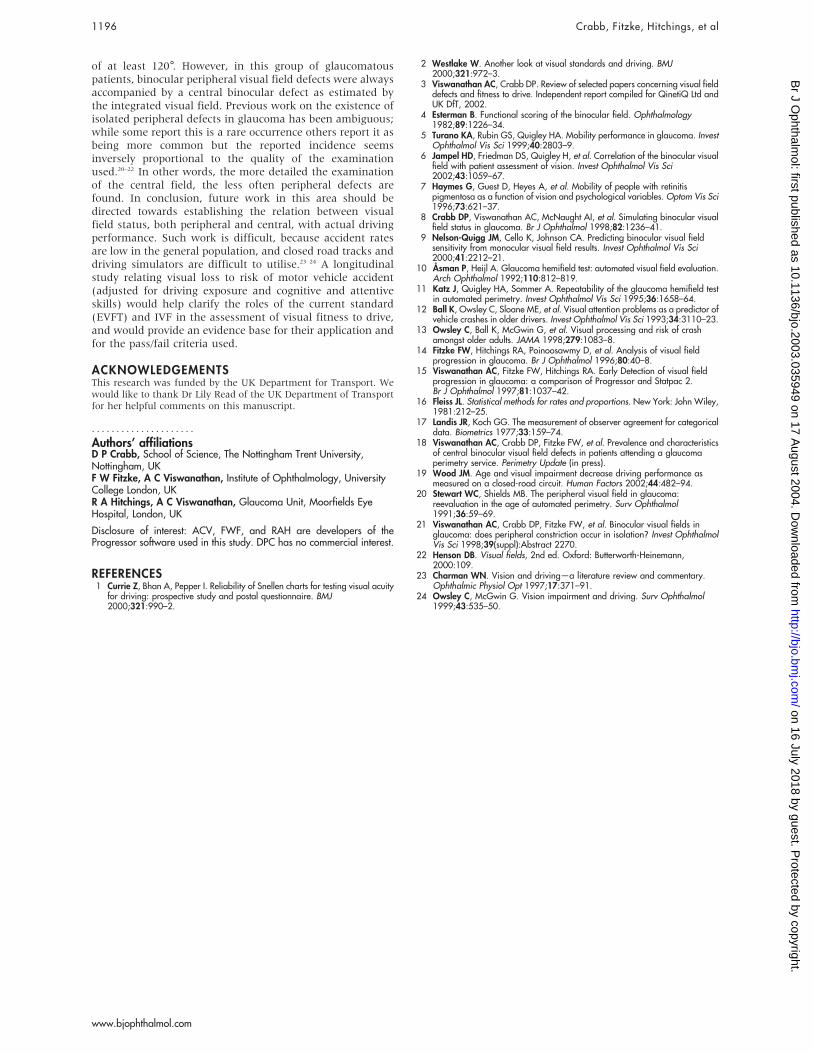
Figure 5 Visual field results from patient C. This composite figure ismade up in the same way as figures 3 and 4. This patient passes thecurrent DVLA criteria using the EVFT because the central defect has onlyone missed point but fails the current DVLA criteria using the integratedvisual field because the central defect is made up of six or morecontiguous defects at the 10 dB level. This patient had a moderate UFOVrisk score of 3, so on this basis visual function in this patient is equivocalwith regard to their fitness to drive. However, this example is includedbecause this shows a patient with obvious, severe defects but this patienthas an almost ‘‘clear’’ EVFT. On close inspection, the bulk of the largebinocular defect (clearly exposed by the integrated visual field) probablyfalls into ‘‘spaces’’ that are not tested in the upper hemifield of the EVFTtest pattern.
Table 2 Summary of UFOV scores tabulated by the failand pass criteria for the integrated visual field and theEVFT
Binocular EVFT
Fail Pass
IVF Fail 3.39 (0.87) 3.75 (0.89)n = 13 n = 8
Pass 2.41 (1.12)n = 0 n = 44
EVFT, Esterman visual field test; IVF, integrated visual field.The figures in bold are the mean UFOV scores (SD). The two mean valuesin the top row (subjects failing the integrated visual field) are notsignificantly different (p = 0.321). However, both these mean values aresignificantly different from the mean value (2.41) of the majority of thepatients who were classed as a pass on the integrated visual field and apass on the binocular EVFT (p,0.01)
Measuring the visual field component of fitness to drive 1195
www.bjophthalmol.com
on 16 July 2018 by guest. Protected by copyright.
http://bjo.bmj.com
/B
r J Ophthalm
ol: first published as 10.1136/bjo.2003.035949 on 17 August 2004. D
ownloaded from
of at least 120 . However, in this group of glaucomatouspatients, binocular peripheral visual field defects were alwaysaccompanied by a central binocular defect as estimated bythe integrated visual field. Previous work on the existence ofisolated peripheral defects in glaucoma has been ambiguous;while some report this is a rare occurrence others report it asbeing more common but the reported incidence seemsinversely proportional to the quality of the examinationused.20–22 In other words, the more detailed the examinationof the central field, the less often peripheral defects arefound. In conclusion, future work in this area should bedirected towards establishing the relation between visualfield status, both peripheral and central, with actual drivingperformance. Such work is difficult, because accident ratesare low in the general population, and closed road tracks anddriving simulators are difficult to utilise.23 24 A longitudinalstudy relating visual loss to risk of motor vehicle accident(adjusted for driving exposure and cognitive and attentiveskills) would help clarify the roles of the current standard(EVFT) and IVF in the assessment of visual fitness to drive,and would provide an evidence base for their application andfor the pass/fail criteria used.
ACKNOWLEDGEMENTSThis research was funded by the UK Department for Transport. Wewould like to thank Dr Lily Read of the UK Department of Transportfor her helpful comments on this manuscript.
Authors’ affiliations. . . . . . . . . . . . . . . . . . . . .
D P Crabb, School of Science, The Nottingham Trent University,Nottingham, UKF W Fitzke, A C Viswanathan, Institute of Ophthalmology, UniversityCollege London, UKR A Hitchings, A C Viswanathan, Glaucoma Unit, Moorfields EyeHospital, London, UK
Disclosure of interest: ACV, FWF, and RAH are developers of theProgressor software used in this study. DPC has no commercial interest.
REFERENCES1 Currie Z, Bhan A, Pepper I. Reliability of Snellen charts for testing visual acuity
for driving: prospective study and postal questionnaire. BMJ2000;321:990–2.
2 Westlake W. Another look at visual standards and driving. BMJ2000;321:972–3.
3 Viswanathan AC, Crabb DP. Review of selected papers concerning visual fielddefects and fitness to drive. Independent report compiled for QinetiQ Ltd andUK DfT, 2002.
4 Esterman B. Functional scoring of the binocular field. Ophthalmology1982;89:1226–34.
5 Turano KA, Rubin GS, Quigley HA. Mobility performance in glaucoma. InvestOphthalmol Vis Sci 1999;40:2803–9.
6 Jampel HD, Friedman DS, Quigley H, et al. Correlation of the binocular visualfield with patient assessment of vision. Invest Ophthalmol Vis Sci2002;43:1059–67.
7 Haymes G, Guest D, Heyes A, et al. Mobility of people with retinitispigmentosa as a function of vision and psychological variables. Optom Vis Sci1996;73:621–37.
8 Crabb DP, Viswanathan AC, McNaught AI, et al. Simulating binocular visualfield status in glaucoma. Br J Ophthalmol 1998;82:1236–41.
9 Nelson-Quigg JM, Cello K, Johnson CA. Predicting binocular visual fieldsensitivity from monocular visual field results. Invest Ophthalmol Vis Sci2000;41:2212–21.
10 Asman P, Heijl A. Glaucoma hemifield test: automated visual field evaluation.Arch Ophthalmol 1992;110:812–819.
11 Katz J, Quigley HA, Sommer A. Repeatability of the glaucoma hemifield testin automated perimetry. Invest Ophthalmol Vis Sci 1995;36:1658–64.
12 Ball K, Owsley C, Sloane ME, et al. Visual attention problems as a predictor ofvehicle crashes in older drivers. Invest Ophthalmol Vis Sci 1993;34:3110–23.
13 Owsley C, Ball K, McGwin G, et al. Visual processing and risk of crashamongst older adults. JAMA 1998;279:1083–8.
14 Fitzke FW, Hitchings RA, Poinoosawmy D, et al. Analysis of visual fieldprogression in glaucoma. Br J Ophthalmol 1996;80:40–8.
15 Viswanathan AC, Fitzke FW, Hitchings RA. Early Detection of visual fieldprogression in glaucoma: a comparison of Progressor and Statpac 2.Br J Ophthalmol 1997;81:1037–42.
16 Fleiss JL. Statistical methods for rates and proportions. New York: John Wiley,1981:212–25.
17 Landis JR, Koch GG. The measurement of observer agreement for categoricaldata. Biometrics 1977;33:159–74.
18 Viswanathan AC, Crabb DP, Fitzke FW, et al. Prevalence and characteristicsof central binocular visual field defects in patients attending a glaucomaperimetry service. Perimetry Update (in press).
19 Wood JM. Age and visual impairment decrease driving performance asmeasured on a closed-road circuit. Human Factors 2002;44:482–94.
20 Stewart WC, Shields MB. The peripheral visual field in glaucoma:reevaluation in the age of automated perimetry. Surv Ophthalmol1991;36:59–69.
21 Viswanathan AC, Crabb DP, Fitzke FW, et al. Binocular visual fields inglaucoma: does peripheral constriction occur in isolation? Invest OphthalmolVis Sci 1998;39(suppl):Abstract 2270.
22 Henson DB. Visual fields, 2nd ed. Oxford: Butterworth-Heinemann,2000:109.
23 Charman WN. Vision and driving—a literature review and commentary.Ophthalmic Physiol Opt 1997;17:371–91.
24 Owsley C, McGwin G. Vision impairment and driving. Surv Ophthalmol1999;43:535–50.
1196 Crabb, Fitzke, Hitchings, et al
www.bjophthalmol.com
on 16 July 2018 by guest. Protected by copyright.
http://bjo.bmj.com
/B
r J Ophthalm
ol: first published as 10.1136/bjo.2003.035949 on 17 August 2004. D
ownloaded from