Embed Size (px)
Citation preview

OmniUpdate, Inc.1320 Flynn Road, Suite 100
Camarillo, CA 93012
About Google AnalyticsOU Campus v10
OU Campus Page 2 of 38
OmniUpdate, Inc.1320 Flynn Road, Suite 100Camarillo, CA 93012800.362.2605805.484.9428 (fax)www.omniupdate.comCopyright ® 2014 OmniUpdate, Inc. All rights reserved.Document Number: b-017Publish Date: 8/5/2014
OmniUpdate® and OU Campus™ are trademarks or registered trademarks of OmniUpdate, Inc. Any othercompany and product names, and trademarks mentioned within are property of their respective owners.Content is subject to change without notice.
About OmniUpdate, Inc.OmniUpdate® is the leading web content management system (CMS) provider for higher education. Thecompany focuses on providing an exceptional product and customer experience to its OU Campus™ CMSusers who manage more than 700 web and mobile sites in the U.S. and around the world. OU Campus issecure and scalable, server and platform independent, and seamlessly integrates with other enterprise campussystems. It provides college and university web developers, administrators, and marketers with the user-friendly tools and deployment flexibility they need to achieve excellence. For more information, visit .
About This GuideThe All About Analytics booklet includes information for the setup and use of Google Analytics within OUCampus, including the related analytics gadgets. This includes the following Support Site version 10 topics:Google Analytics Overview, Google Analytics Views, Site Analytics Gadget, Page Analytics Gadget, and theAnalytics Data Groups topics.
OU Campus SupportThe Support site is available to everyone and users are encouraged to visit and browse the site for information.An institution's administrators are also available if the answer cannot be found on the Support site or furtherexplanation and clarification is needed. Administrators may contact the OmniUpdate Support Team. Ways toaccess the OU Campus support documentation include:
• Support site: http://support.omniupdate.com/• The help link in the main interface of OU Campus• The WYSIWYG Help link• Help links embedded in the system• Text instructions are provide onscreen for specific fields and functionality• OmniUpdate Community Network (OCN): http://ocn.omniupdate.com/
ConventionsShorthand for navigation through the OU Campus CMS is indicated with a greater-than sign and bolded: > Forexample, Setup > Sites. Code snippets use Courier New and a shaded background.
OU Campus Page 3 of 38
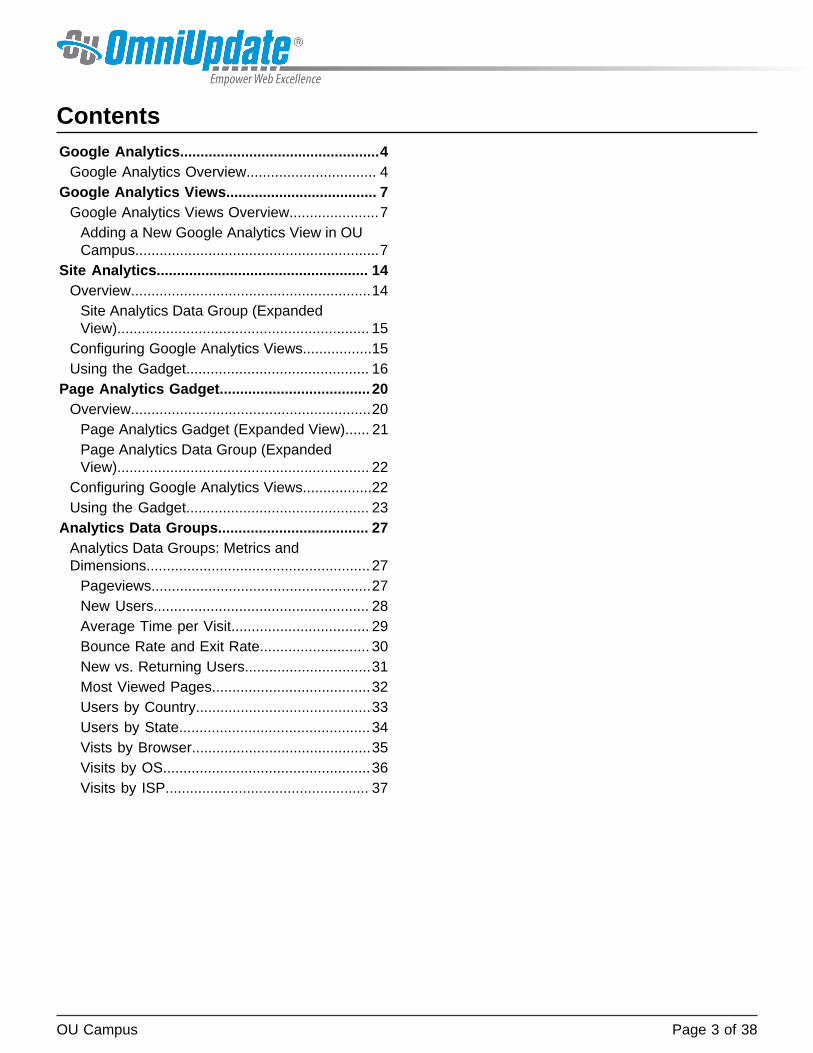
ContentsGoogle Analytics.................................................4
Google Analytics Overview................................ 4Google Analytics Views..................................... 7
Google Analytics Views Overview......................7Adding a New Google Analytics View in OUCampus............................................................7
Site Analytics.................................................... 14Overview...........................................................14
Site Analytics Data Group (ExpandedView).............................................................. 15
Configuring Google Analytics Views.................15Using the Gadget............................................. 16
Page Analytics Gadget..................................... 20Overview...........................................................20
Page Analytics Gadget (Expanded View)...... 21Page Analytics Data Group (ExpandedView).............................................................. 22
Configuring Google Analytics Views.................22Using the Gadget............................................. 23
Analytics Data Groups..................................... 27Analytics Data Groups: Metrics andDimensions....................................................... 27
Pageviews......................................................27New Users..................................................... 28Average Time per Visit.................................. 29Bounce Rate and Exit Rate........................... 30New vs. Returning Users...............................31Most Viewed Pages.......................................32Users by Country...........................................33Users by State...............................................34Vists by Browser............................................35Visits by OS...................................................36Visits by ISP.................................................. 37
OU Campus Google Analytics Page 4 of 38
Google AnalyticsGoogle Analytics OverviewThe Google Analytics feature allows administrators to add new views in OU Campus and configure themfor use with the Page Analytics Gadget and the Site Analytics Gadget. This allows for granular control ofview usage for the Page Analytics and the Site Analytics Gadgets. In addition to adding Google Analyticsprofiles and views to OU Campus, Gadgets Analytics setup includes the ability to assign an access groupand add a description to the view. Once a view has been configured, users with access can choose to showthe specific gadget and choose the view to display. Level 10 administrators have access to Setup > GoogleAnalytics. When adding a view, the admin must be at least a user of the Google Analytics account in whichthe view is contained. All available views in the account for the user are shown. Google Analytics users withat least "read and analyze" permission in the analytics account to a view can add the view in OU Campus(as a level 10 administrator in OU Campus).
Please note that this is the overview topic about Google Analytics within the context of OU Campus. Thereis an additional topic in this section entitled, Google Analytics Views, which describes the features andfunctionality of the screen of the same name. This includes the use of the the New button on the GoogleAnalytics screen by which one may add a new view to OU Campus.
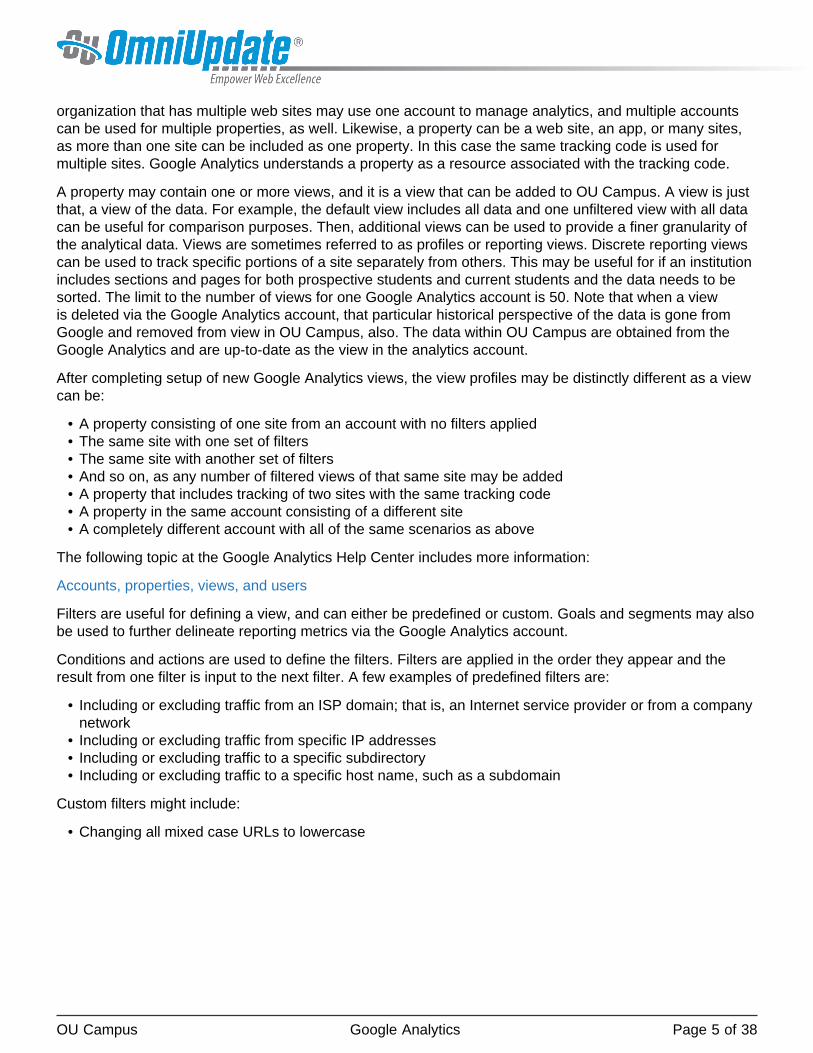
Examples of Google Account Hierarchy
Before the setup in OU Campus, the view must be configured within the Google Analytics account(which requires a Google account). A Google Analytics account can include one or more properties. An
OU Campus Google Analytics Page 5 of 38
organization that has multiple web sites may use one account to manage analytics, and multiple accountscan be used for multiple properties, as well. Likewise, a property can be a web site, an app, or many sites,as more than one site can be included as one property. In this case the same tracking code is used formultiple sites. Google Analytics understands a property as a resource associated with the tracking code.
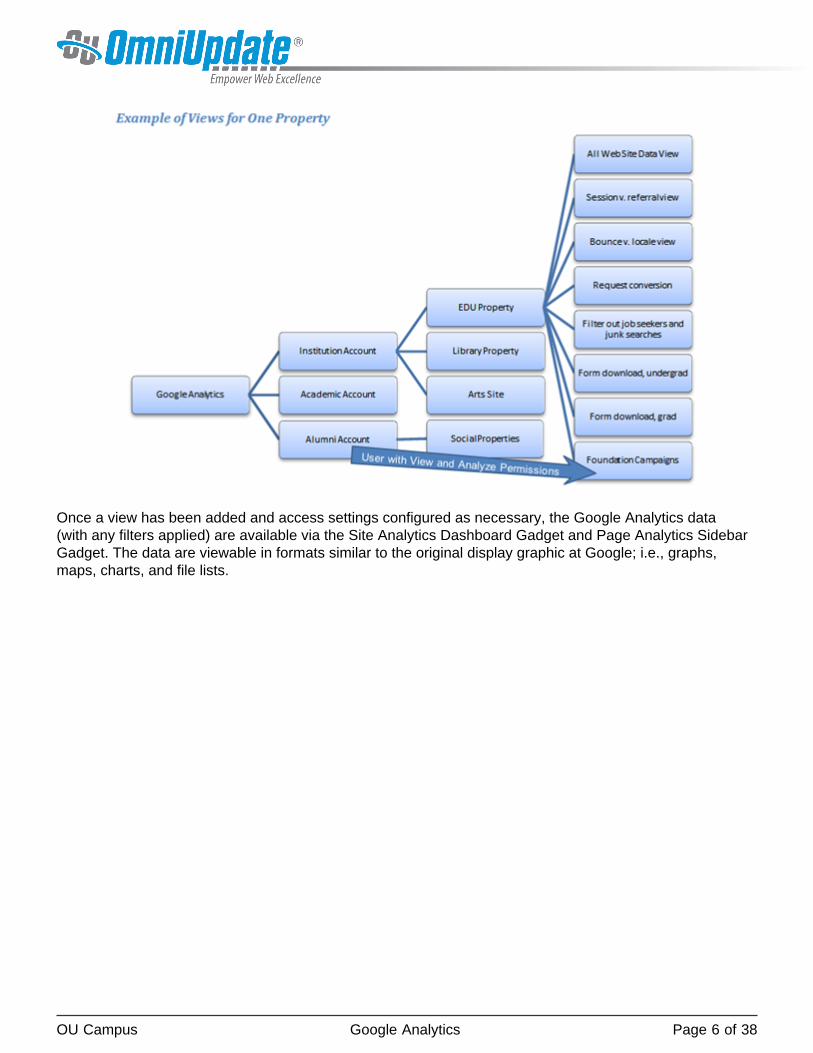
A property may contain one or more views, and it is a view that can be added to OU Campus. A view is justthat, a view of the data. For example, the default view includes all data and one unfiltered view with all datacan be useful for comparison purposes. Then, additional views can be used to provide a finer granularity ofthe analytical data. Views are sometimes referred to as profiles or reporting views. Discrete reporting viewscan be used to track specific portions of a site separately from others. This may be useful for if an institutionincludes sections and pages for both prospective students and current students and the data needs to besorted. The limit to the number of views for one Google Analytics account is 50. Note that when a viewis deleted via the Google Analytics account, that particular historical perspective of the data is gone fromGoogle and removed from view in OU Campus, also. The data within OU Campus are obtained from theGoogle Analytics and are up-to-date as the view in the analytics account.
After completing setup of new Google Analytics views, the view profiles may be distinctly different as a viewcan be:
• A property consisting of one site from an account with no filters applied• The same site with one set of filters• The same site with another set of filters• And so on, as any number of filtered views of that same site may be added• A property that includes tracking of two sites with the same tracking code• A property in the same account consisting of a different site• A completely different account with all of the same scenarios as above
The following topic at the Google Analytics Help Center includes more information:
Accounts, properties, views, and users
Filters are useful for defining a view, and can either be predefined or custom. Goals and segments may alsobe used to further delineate reporting metrics via the Google Analytics account.
Conditions and actions are used to define the filters. Filters are applied in the order they appear and theresult from one filter is input to the next filter. A few examples of predefined filters are:
• Including or excluding traffic from an ISP domain; that is, an Internet service provider or from a companynetwork
• Including or excluding traffic from specific IP addresses• Including or excluding traffic to a specific subdirectory• Including or excluding traffic to a specific host name, such as a subdomain
Custom filters might include:
• Changing all mixed case URLs to lowercase
OU Campus Google Analytics Page 6 of 38
Once a view has been added and access settings configured as necessary, the Google Analytics data(with any filters applied) are available via the Site Analytics Dashboard Gadget and Page Analytics SidebarGadget. The data are viewable in formats similar to the original display graphic at Google; i.e., graphs,maps, charts, and file lists.
OU Campus Google Analytics Views Page 7 of 38
Google Analytics ViewsGoogle Analytics Views OverviewAuthority Level: Level 10 administrator
Location: Setup > Google Analytics
The Google Analytics Views can be used to manage the addition, editing, and deletion of Google Analyticsviews in OU Campus. The base filtering from OU Campus is specific to the HTTP Root as set in the sitesettings. In other words, some institutions set up "sites" within a subdirectory of the main domain for theschool. If the main domain is gallena.edu, a site might be set up within the main account with the site name"alumni" and the HTTP Root as http://gallena.edu/alumni/. In this case, if the same default all data viewis used from the Google Analytics account, the analytics displayed within the main site (HTTP Root isgallena.edu) will also include the data for the site setup in the subdirectory. The Google Analytics Viewssetup in OU Campus is account-bound, but includes a filter for the HTTP Root setting. So when viewinganalytics via the alumni site, only the data relevant to the content subordinate to the site is shown, evenwhen using that same default all data view from Google Analytics. A new view could be created and a filteradded to exclude subdirectories with a specific string in order to exclude a subsite to the main domain.
The Google Analytics Views screen includes the following features and functionality:
• Lists the number of views that have been added to OU Campus• Filtering the list based on description• Adding new views• Sorting the views by the following columns: Available To and Description• The following options are also available for each view: Edit and Delete• One or more views can be selected for applying an action en masse. When more than one view is
selected, the items can be deleted.
The following step-by-step procedures are included on this page:
• Adding a New Google Analytics View in OU Campus• Basic Steps• Steps with Screenshots
• Adding a Description• Creating a New Property at Google Analytics• Adding Tracking Code to an XSL or as an Include• Creating a New Reporting View at Google Analytics
Adding a New Google Analytics View in OU CampusBasic Steps (without screenshots)
1. Log into an account if necessary and click Accept. Confirmation of authorization is provided.2. From the Add Google Analytics View (Profile) dialog, select one or more views to add.3. Use the Available To drop-down to assign an access group. The default is the (Administrators Only)
system group.4. Click Save.
Once a view has been added, users can view analytics data using the Page Analytics Gadget or the SiteAnalytics Gadget.
OU Campus Google Analytics Views Page 8 of 38
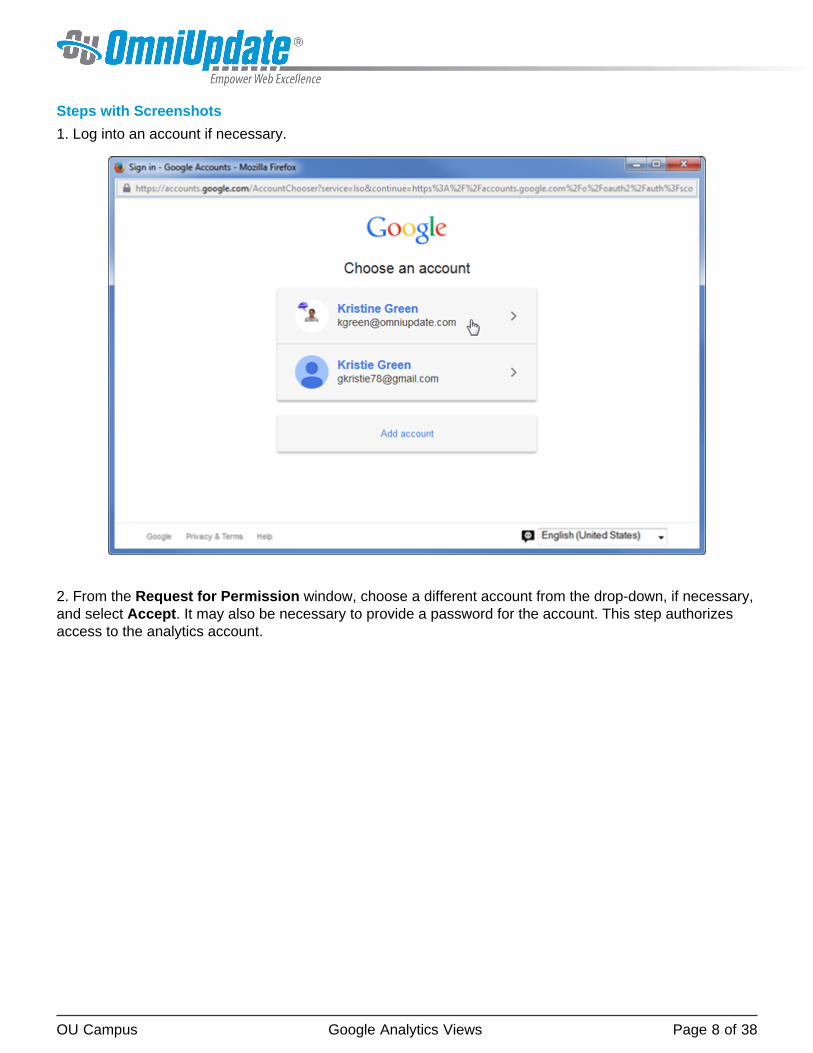
Steps with Screenshots
1. Log into an account if necessary.
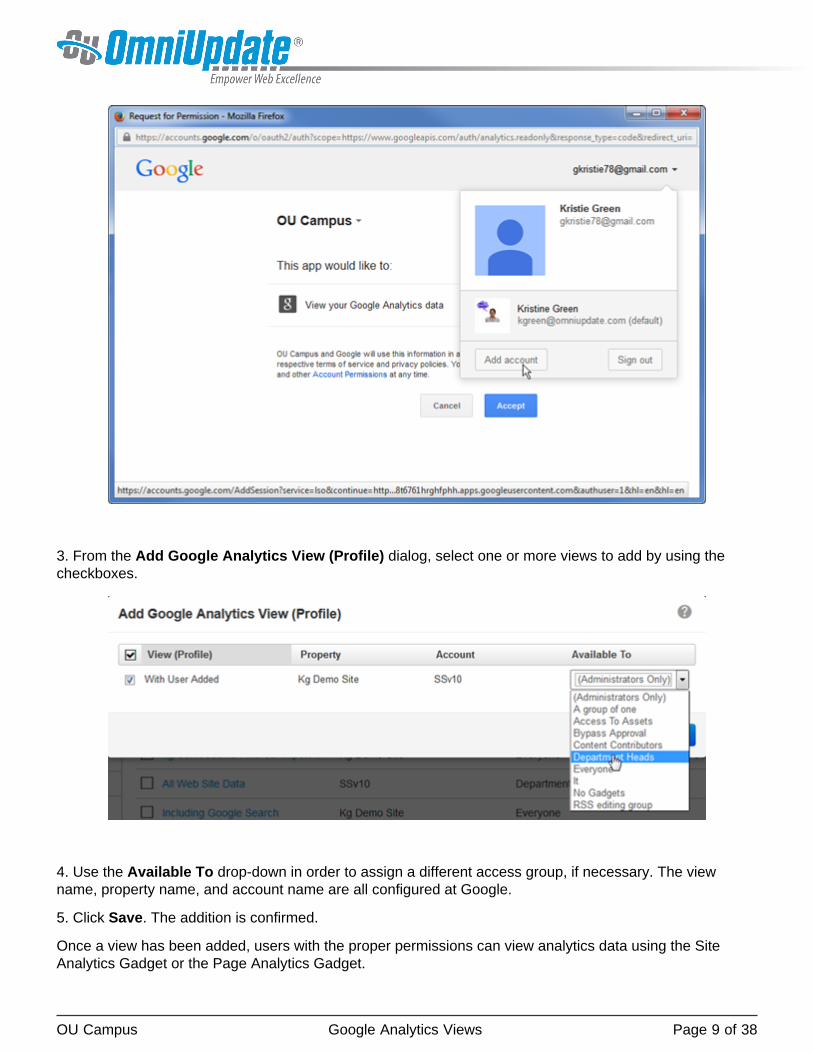
2. From the Request for Permission window, choose a different account from the drop-down, if necessary,and select Accept. It may also be necessary to provide a password for the account. This step authorizesaccess to the analytics account.
OU Campus Google Analytics Views Page 9 of 38
3. From the Add Google Analytics View (Profile) dialog, select one or more views to add by using thecheckboxes.
4. Use the Available To drop-down in order to assign a different access group, if necessary. The viewname, property name, and account name are all configured at Google.
5. Click Save. The addition is confirmed.
Once a view has been added, users with the proper permissions can view analytics data using the SiteAnalytics Gadget or the Page Analytics Gadget.
OU Campus Google Analytics Views Page 10 of 38
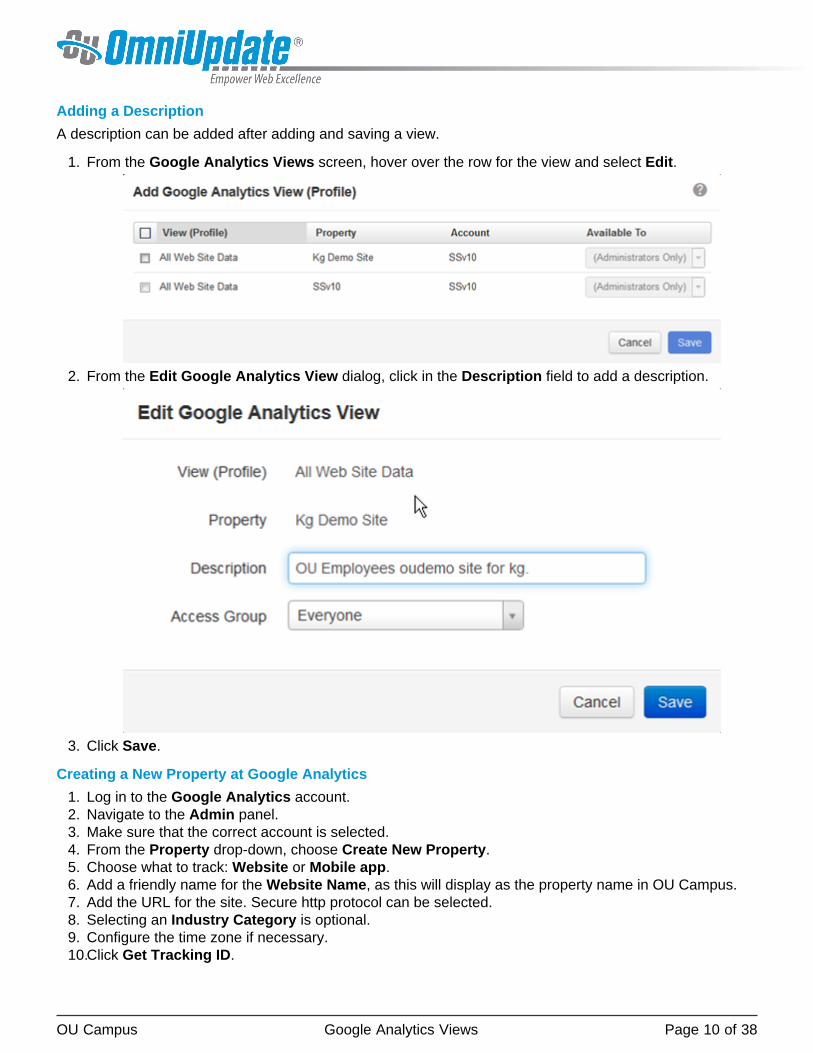
Adding a Description
A description can be added after adding and saving a view.
1. From the Google Analytics Views screen, hover over the row for the view and select Edit.
2. From the Edit Google Analytics View dialog, click in the Description field to add a description.
3. Click Save.
Creating a New Property at Google Analytics
1. Log in to the Google Analytics account.2. Navigate to the Admin panel.3. Make sure that the correct account is selected.4. From the Property drop-down, choose Create New Property.5. Choose what to track: Website or Mobile app.6. Add a friendly name for the Website Name, as this will display as the property name in OU Campus.7. Add the URL for the site. Secure http protocol can be selected.8. Selecting an Industry Category is optional.9. Configure the time zone if necessary.10.Click Get Tracking ID.
OU Campus Google Analytics Views Page 11 of 38
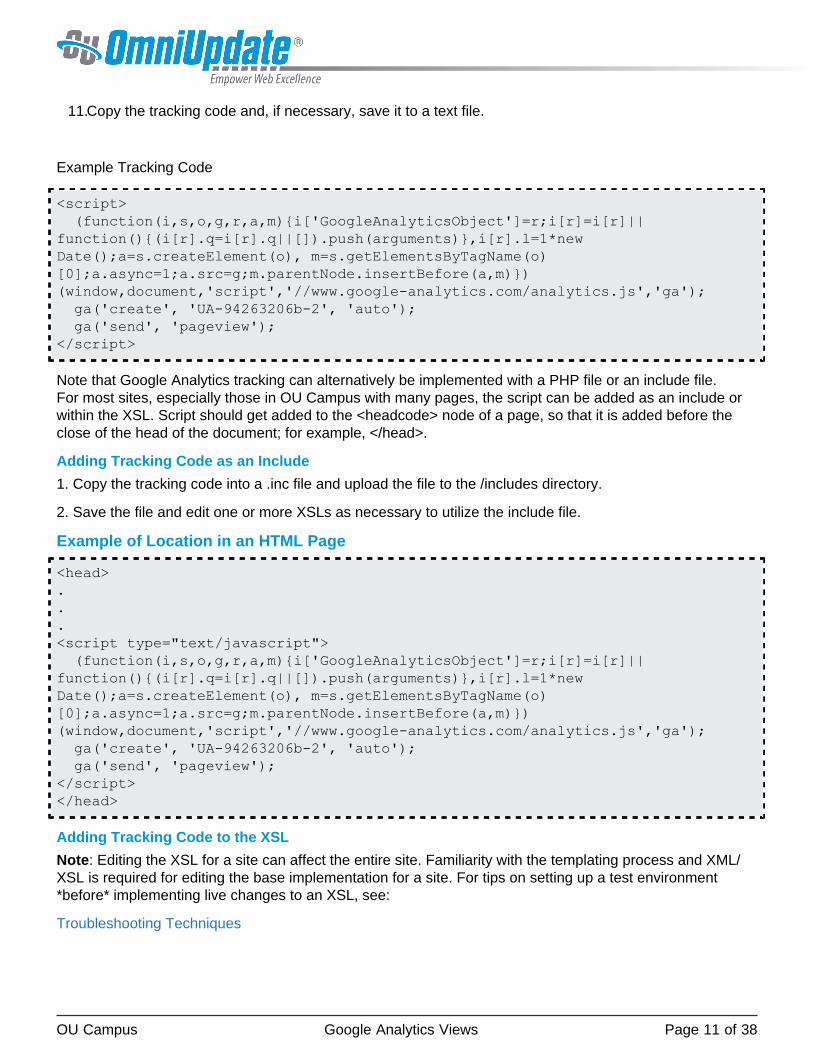
11.Copy the tracking code and, if necessary, save it to a text file.
Example Tracking Code
<script> (function(i,s,o,g,r,a,m){i['GoogleAnalyticsObject']=r;i[r]=i[r]||function(){(i[r].q=i[r].q||[]).push(arguments)},i[r].l=1*newDate();a=s.createElement(o), m=s.getElementsByTagName(o)[0];a.async=1;a.src=g;m.parentNode.insertBefore(a,m)})(window,document,'script','//www.google-analytics.com/analytics.js','ga'); ga('create', 'UA-94263206b-2', 'auto'); ga('send', 'pageview');</script>
Note that Google Analytics tracking can alternatively be implemented with a PHP file or an include file.For most sites, especially those in OU Campus with many pages, the script can be added as an include orwithin the XSL. Script should get added to the <headcode> node of a page, so that it is added before theclose of the head of the document; for example, </head>.
Adding Tracking Code as an Include
1. Copy the tracking code into a .inc file and upload the file to the /includes directory.
2. Save the file and edit one or more XSLs as necessary to utilize the include file.
Example of Location in an HTML Page
<head>...<script type="text/javascript"> (function(i,s,o,g,r,a,m){i['GoogleAnalyticsObject']=r;i[r]=i[r]||function(){(i[r].q=i[r].q||[]).push(arguments)},i[r].l=1*newDate();a=s.createElement(o), m=s.getElementsByTagName(o)[0];a.async=1;a.src=g;m.parentNode.insertBefore(a,m)})(window,document,'script','//www.google-analytics.com/analytics.js','ga'); ga('create', 'UA-94263206b-2', 'auto'); ga('send', 'pageview');</script></head>
Adding Tracking Code to the XSL
Note: Editing the XSL for a site can affect the entire site. Familiarity with the templating process and XML/XSL is required for editing the base implementation for a site. For tips on setting up a test environment*before* implementing live changes to an XSL, see:
Troubleshooting Techniques
OU Campus Google Analytics Views Page 12 of 38
If there is a <headcode> node, add the script within those tags so that the script can be included just beforethe closing </head> tag of an HTML page.
1. View a page in code view and look for the XSL that is called by the pcf-stylesheet declaration. Forexample: <?pcf-stylesheet path="/_resources/xsl/default.xsl" extension="html"?>
Note: Depending upon the implementation and the template, there may be more than one XSL used. Ifdifferent page templates use different XSLs, but all call the common.xsl, then the code could be added in acommon.xsl.
2. Locate where the scripts are being added to the <head> tag.
3. Drop the tracking code in as another script element.
4. Save the XSL. It is not required to publish the XSL.
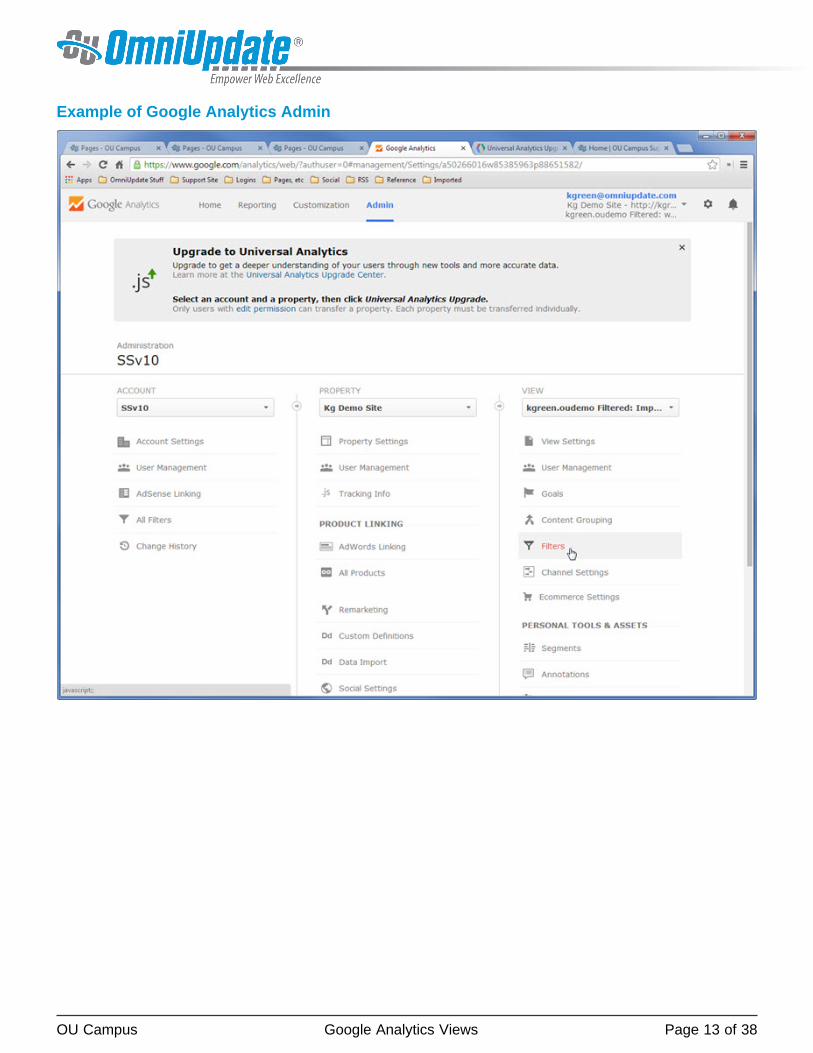
Creating a New Reporting View at Google Analytics
New views can be added at Google Analytics at any time for a property and will fall under the reporting ofthe JS code that has already been added to a site.
1. Log in to the Google Analytics account.2. Navigate to the Admin panel.3. Make sure that the correct account and property are selected if more than one is available.4. From the View drop-down, select Create New View.5. Use a meaningful name as this will be displayed in OU Campus and there may be many views from
which to choose.
There are many, many different ways to configure the setup of a view at Google. These include filters,channels, segments, content groupings, and so on. The Support Site v10 topics about the Site AnalyticsGadget, the Page Analytics Gadget, and the Analytics Data Groups provide more information about thereporting items that are included in OU Campus.
OU Campus Google Analytics Views Page 13 of 38
Example of Google Analytics Admin
OU Campus Site Analytics Page 14 of 38
Site AnalyticsOverviewAuthority Level: All user levels by default;
administrators may restrict access to the gadget and to each data group in the gadget through accesssettings.
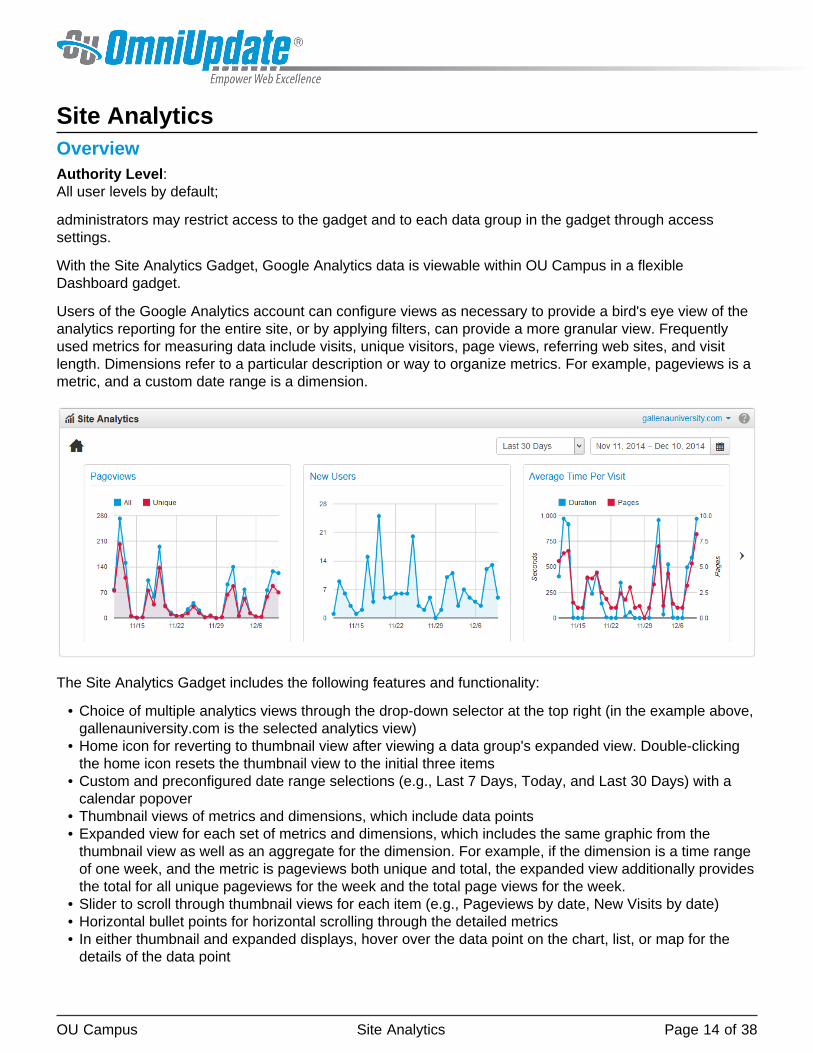
With the Site Analytics Gadget, Google Analytics data is viewable within OU Campus in a flexibleDashboard gadget.
Users of the Google Analytics account can configure views as necessary to provide a bird's eye view of theanalytics reporting for the entire site, or by applying filters, can provide a more granular view. Frequentlyused metrics for measuring data include visits, unique visitors, page views, referring web sites, and visitlength. Dimensions refer to a particular description or way to organize metrics. For example, pageviews is ametric, and a custom date range is a dimension.
The Site Analytics Gadget includes the following features and functionality:
• Choice of multiple analytics views through the drop-down selector at the top right (in the example above,gallenauniversity.com is the selected analytics view)
• Home icon for reverting to thumbnail view after viewing a data group's expanded view. Double-clickingthe home icon resets the thumbnail view to the initial three items
• Custom and preconfigured date range selections (e.g., Last 7 Days, Today, and Last 30 Days) with acalendar popover
• Thumbnail views of metrics and dimensions, which include data points• Expanded view for each set of metrics and dimensions, which includes the same graphic from the
thumbnail view as well as an aggregate for the dimension. For example, if the dimension is a time rangeof one week, and the metric is pageviews both unique and total, the expanded view additionally providesthe total for all unique pageviews for the week and the total page views for the week.
• Slider to scroll through thumbnail views for each item (e.g., Pageviews by date, New Visits by date)• Horizontal bullet points for horizontal scrolling through the detailed metrics• In either thumbnail and expanded displays, hover over the data point on the chart, list, or map for the
details of the data point
OU Campus Site Analytics Page 15 of 38
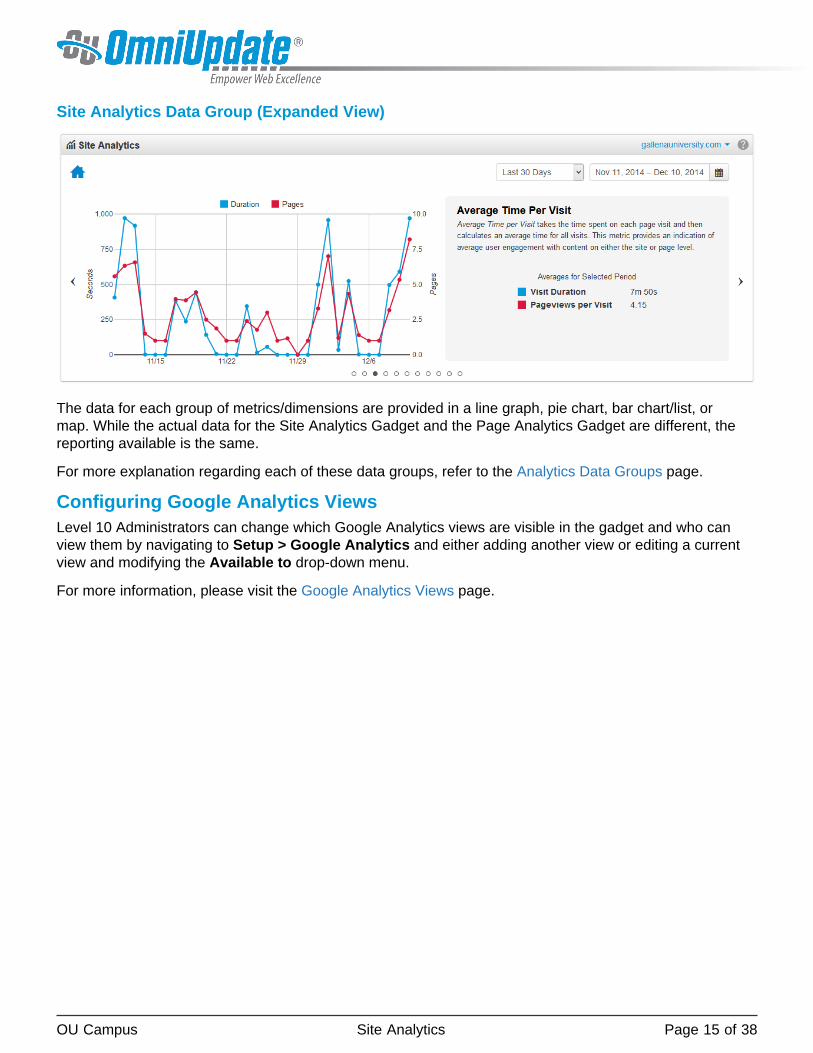
Site Analytics Data Group (Expanded View)
The data for each group of metrics/dimensions are provided in a line graph, pie chart, bar chart/list, ormap. While the actual data for the Site Analytics Gadget and the Page Analytics Gadget are different, thereporting available is the same.
For more explanation regarding each of these data groups, refer to the Analytics Data Groups page.
Configuring Google Analytics ViewsLevel 10 Administrators can change which Google Analytics views are visible in the gadget and who canview them by navigating to Setup > Google Analytics and either adding another view or editing a currentview and modifying the Available to drop-down menu.
For more information, please visit the Google Analytics Views page.

OU Campus Site Analytics Page 16 of 38
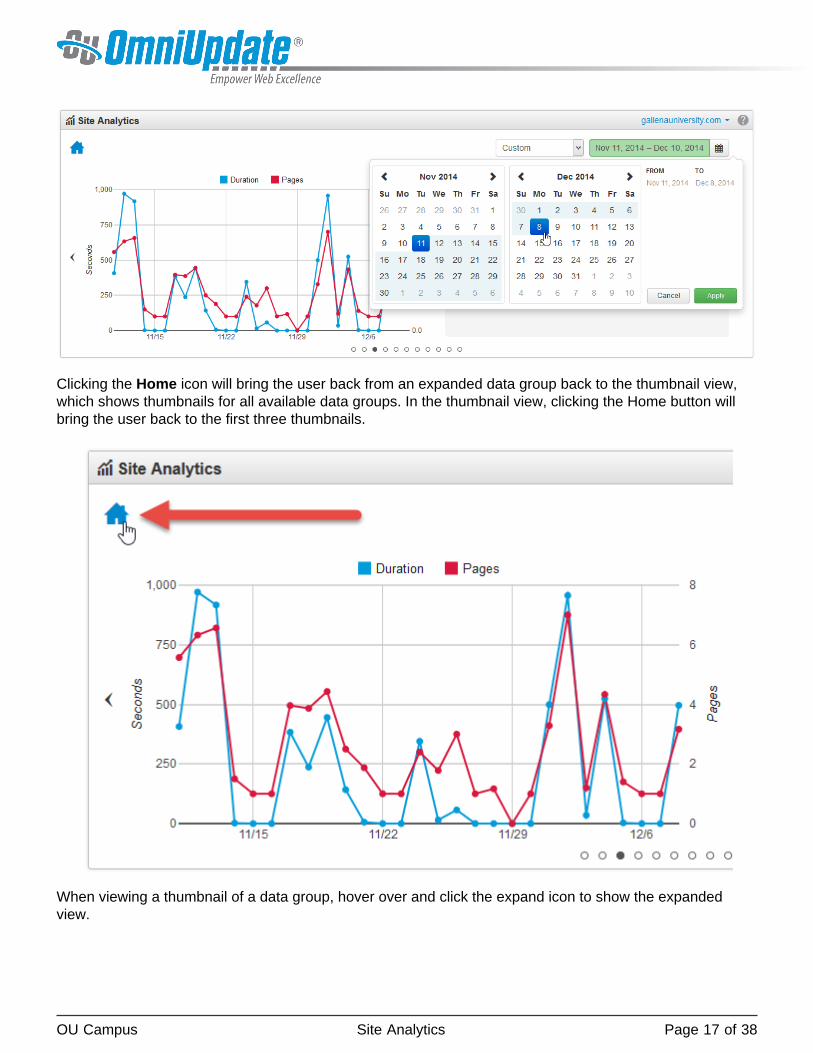
Using the GadgetIn the Site Analytics Gadget itself, users can use the date range selectors to view data over a predefined orcustom-defined amount of time.
OU Campus Site Analytics Page 17 of 38
Clicking the Home icon will bring the user back from an expanded data group back to the thumbnail view,which shows thumbnails for all available data groups. In the thumbnail view, clicking the Home button willbring the user back to the first three thumbnails.
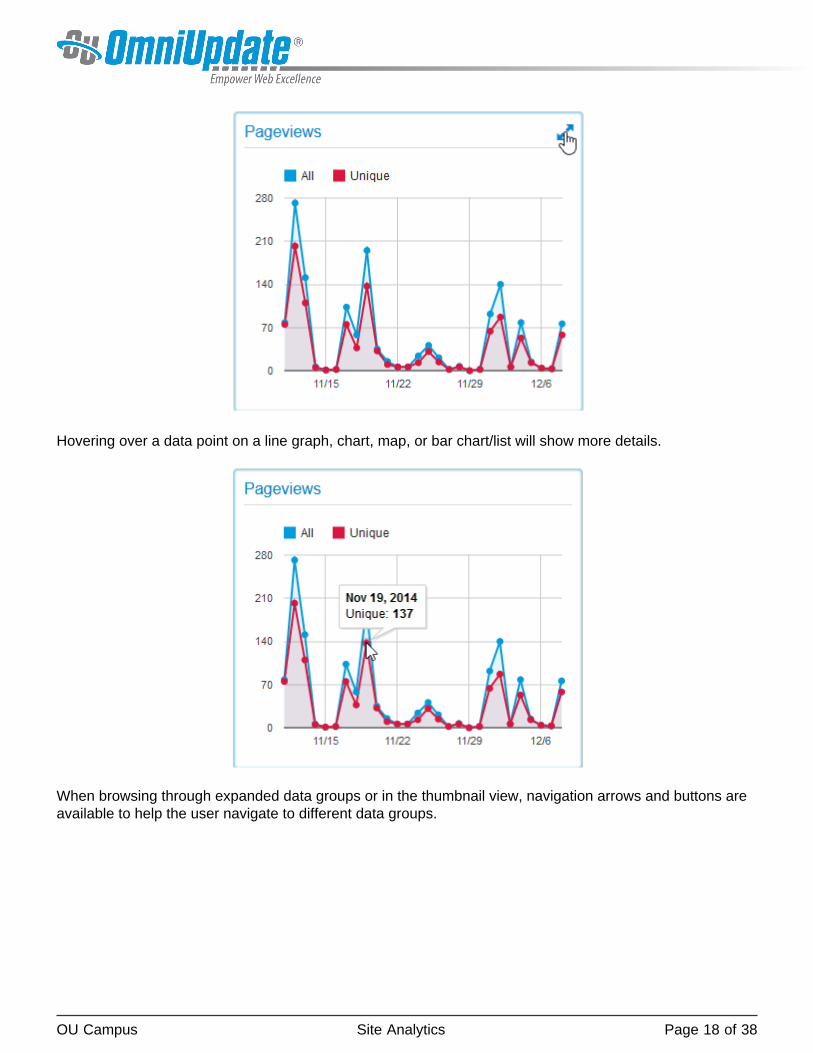
When viewing a thumbnail of a data group, hover over and click the expand icon to show the expandedview.
OU Campus Site Analytics Page 18 of 38
Hovering over a data point on a line graph, chart, map, or bar chart/list will show more details.
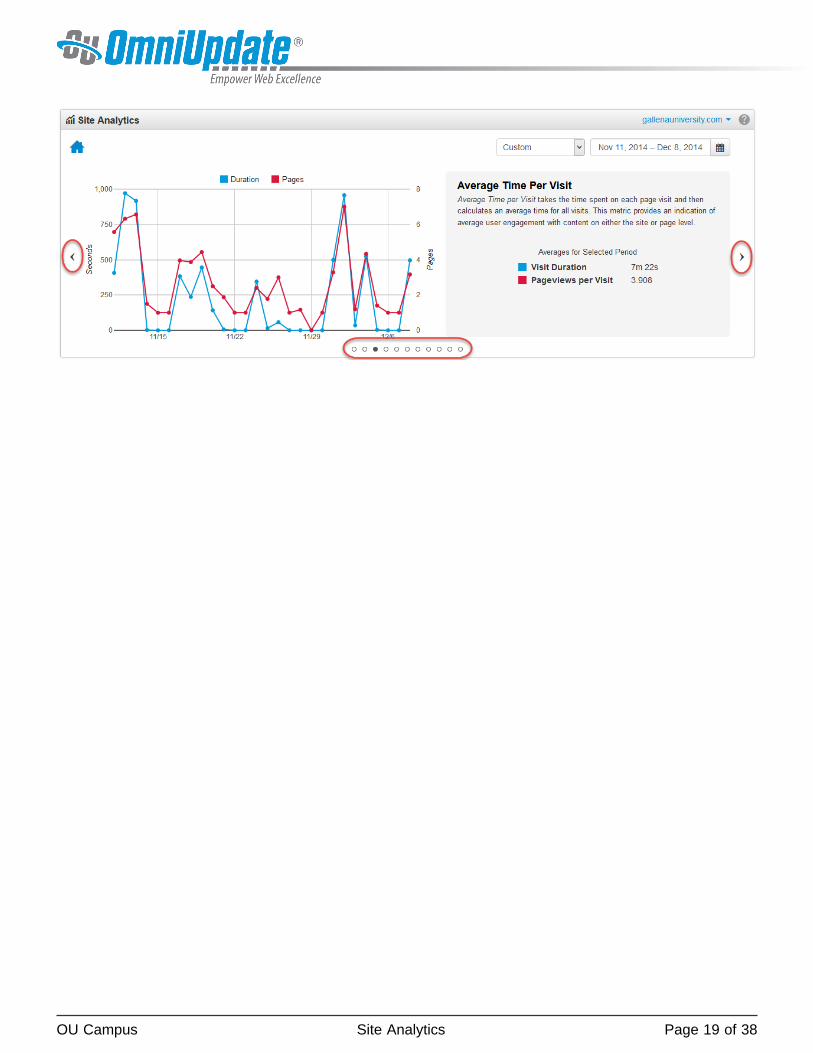
When browsing through expanded data groups or in the thumbnail view, navigation arrows and buttons areavailable to help the user navigate to different data groups.
OU Campus Site Analytics Page 19 of 38
OU Campus Page Analytics Gadget Page 20 of 38
Page Analytics GadgetOverviewAuthority Level: All user levels by default; administrators may restrict access to the gadget and to each data group within the gadget through accesssettings.
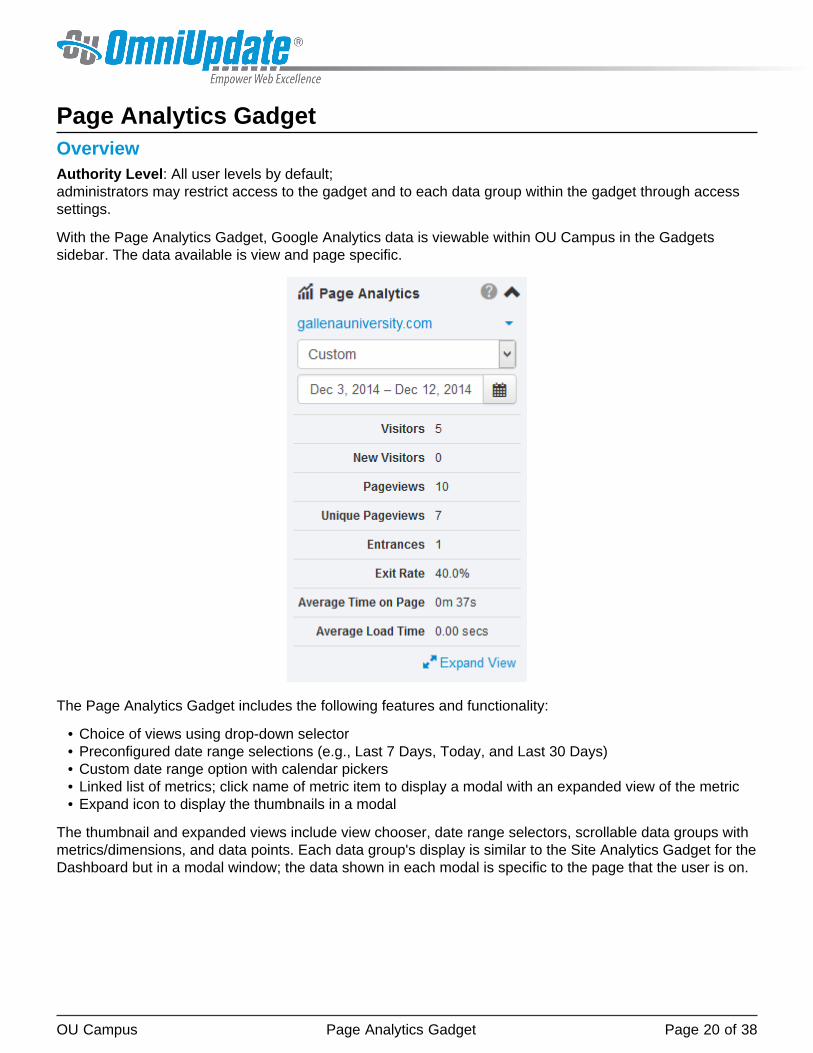
With the Page Analytics Gadget, Google Analytics data is viewable within OU Campus in the Gadgetssidebar. The data available is view and page specific.
The Page Analytics Gadget includes the following features and functionality:
• Choice of views using drop-down selector• Preconfigured date range selections (e.g., Last 7 Days, Today, and Last 30 Days)• Custom date range option with calendar pickers• Linked list of metrics; click name of metric item to display a modal with an expanded view of the metric• Expand icon to display the thumbnails in a modal
The thumbnail and expanded views include view chooser, date range selectors, scrollable data groups withmetrics/dimensions, and data points. Each data group's display is similar to the Site Analytics Gadget for theDashboard but in a modal window; the data shown in each modal is specific to the page that the user is on.
OU Campus Page Analytics Gadget Page 21 of 38
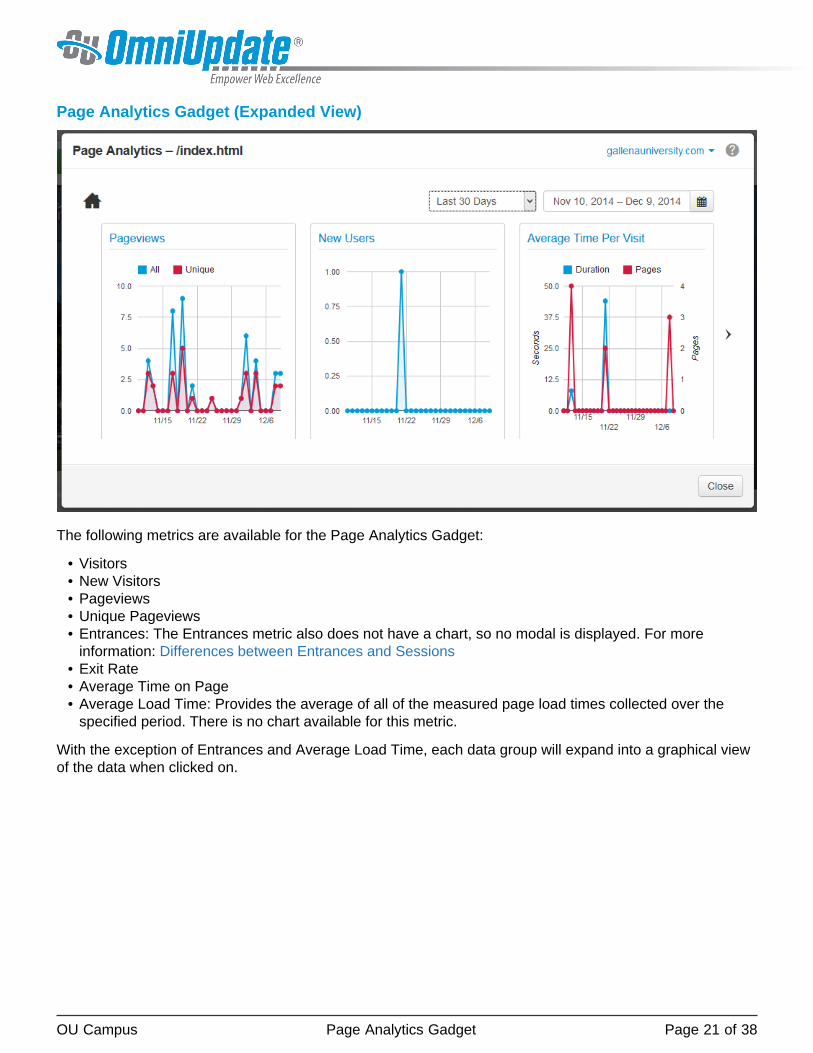
Page Analytics Gadget (Expanded View)
The following metrics are available for the Page Analytics Gadget:
• Visitors• New Visitors• Pageviews• Unique Pageviews• Entrances: The Entrances metric also does not have a chart, so no modal is displayed. For more
information: Differences between Entrances and Sessions• Exit Rate• Average Time on Page• Average Load Time: Provides the average of all of the measured page load times collected over the
specified period. There is no chart available for this metric.
With the exception of Entrances and Average Load Time, each data group will expand into a graphical viewof the data when clicked on.
OU Campus Page Analytics Gadget Page 22 of 38
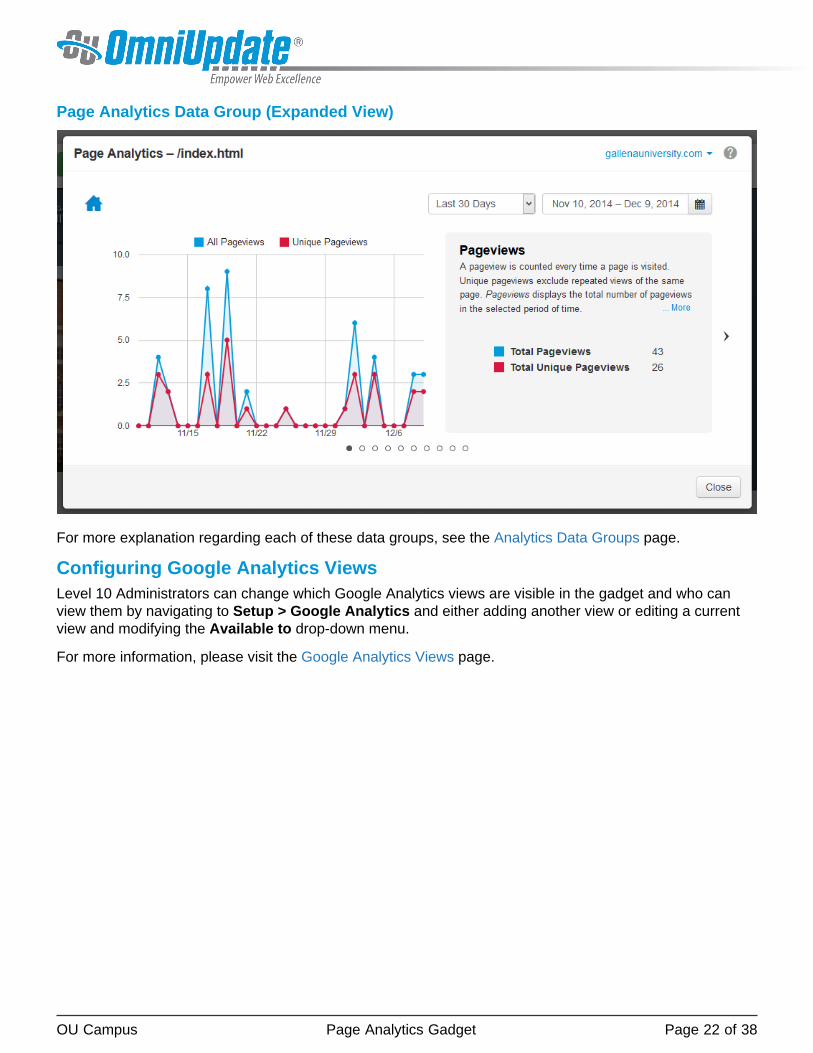
Page Analytics Data Group (Expanded View)
For more explanation regarding each of these data groups, see the Analytics Data Groups page.
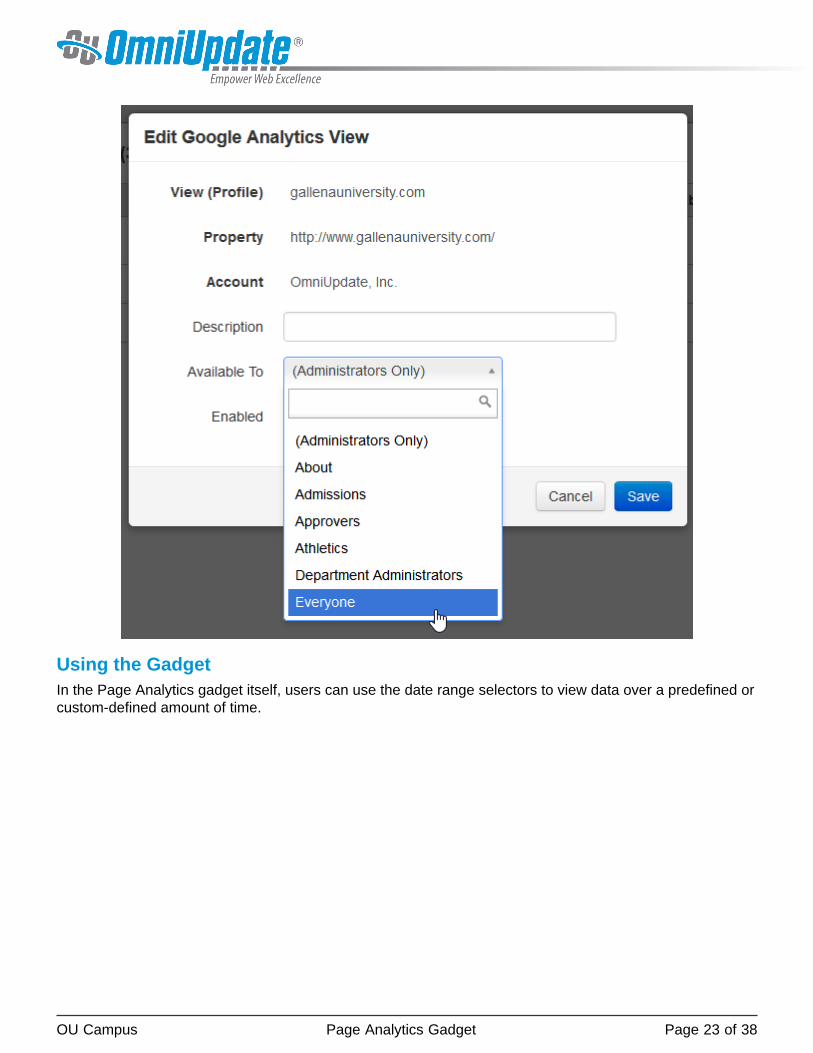
Configuring Google Analytics ViewsLevel 10 Administrators can change which Google Analytics views are visible in the gadget and who canview them by navigating to Setup > Google Analytics and either adding another view or editing a currentview and modifying the Available to drop-down menu.
For more information, please visit the Google Analytics Views page.
OU Campus Page Analytics Gadget Page 23 of 38
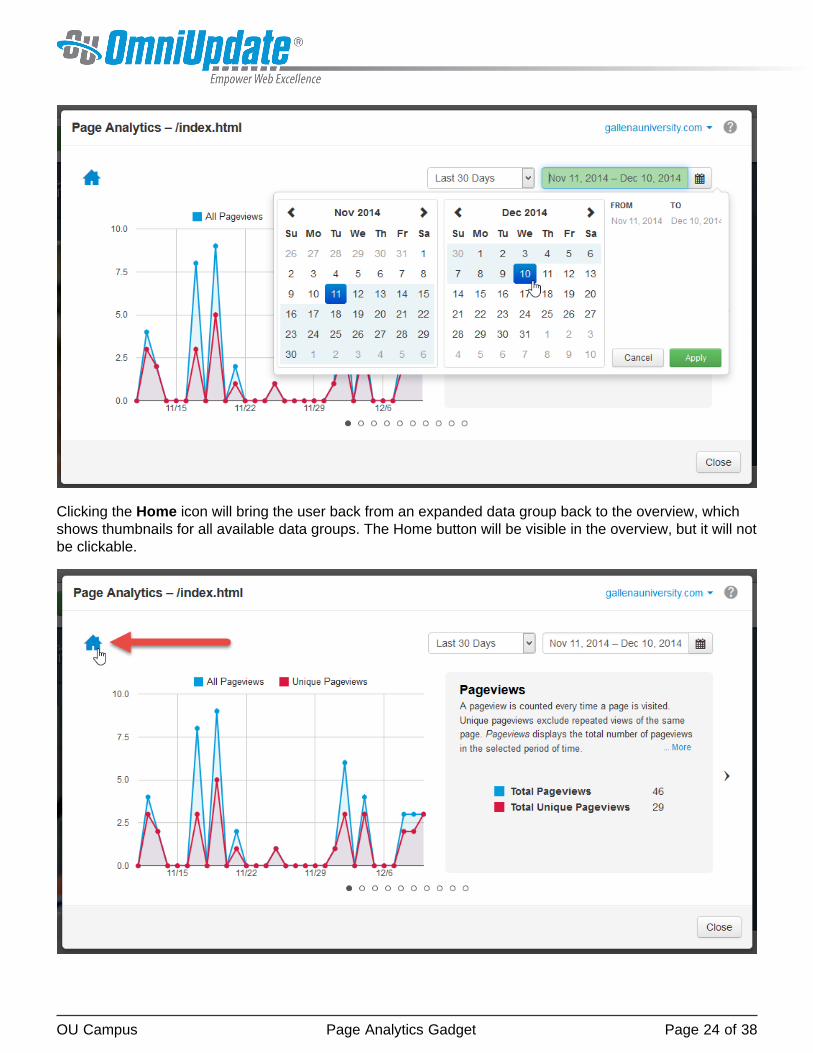
Using the GadgetIn the Page Analytics gadget itself, users can use the date range selectors to view data over a predefined orcustom-defined amount of time.
OU Campus Page Analytics Gadget Page 24 of 38
Clicking the Home icon will bring the user back from an expanded data group back to the overview, whichshows thumbnails for all available data groups. The Home button will be visible in the overview, but it will notbe clickable.
OU Campus Page Analytics Gadget Page 25 of 38
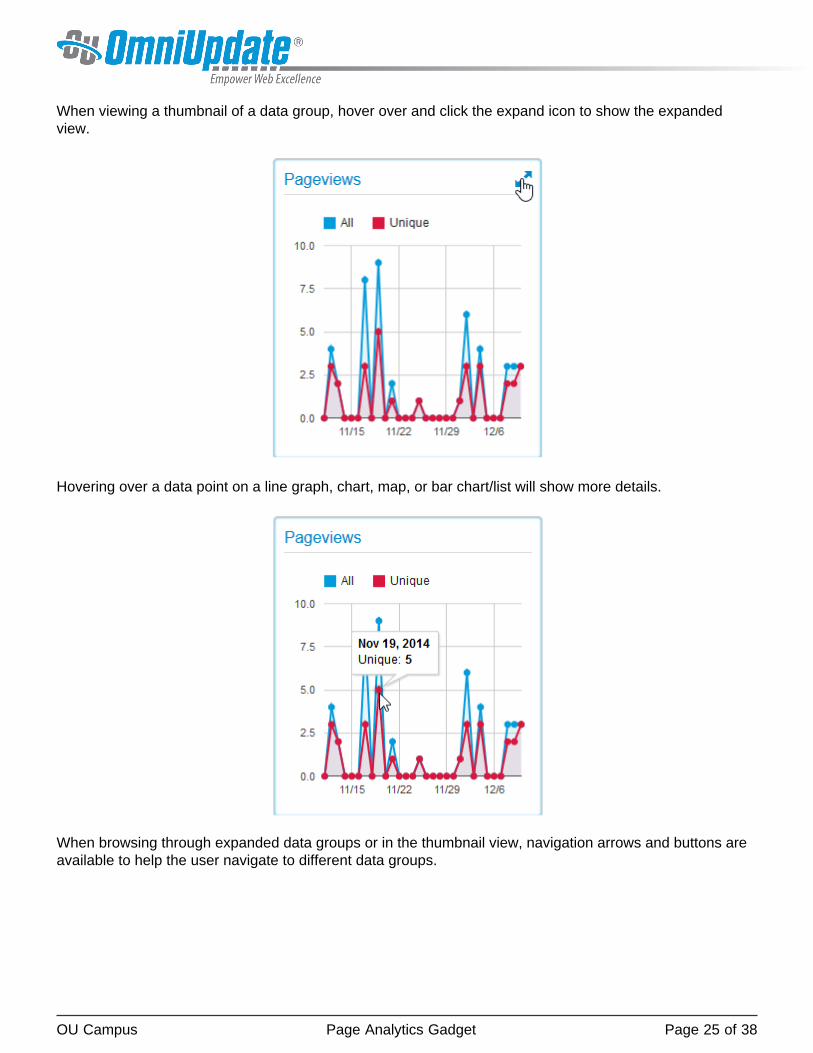
When viewing a thumbnail of a data group, hover over and click the expand icon to show the expandedview.
Hovering over a data point on a line graph, chart, map, or bar chart/list will show more details.
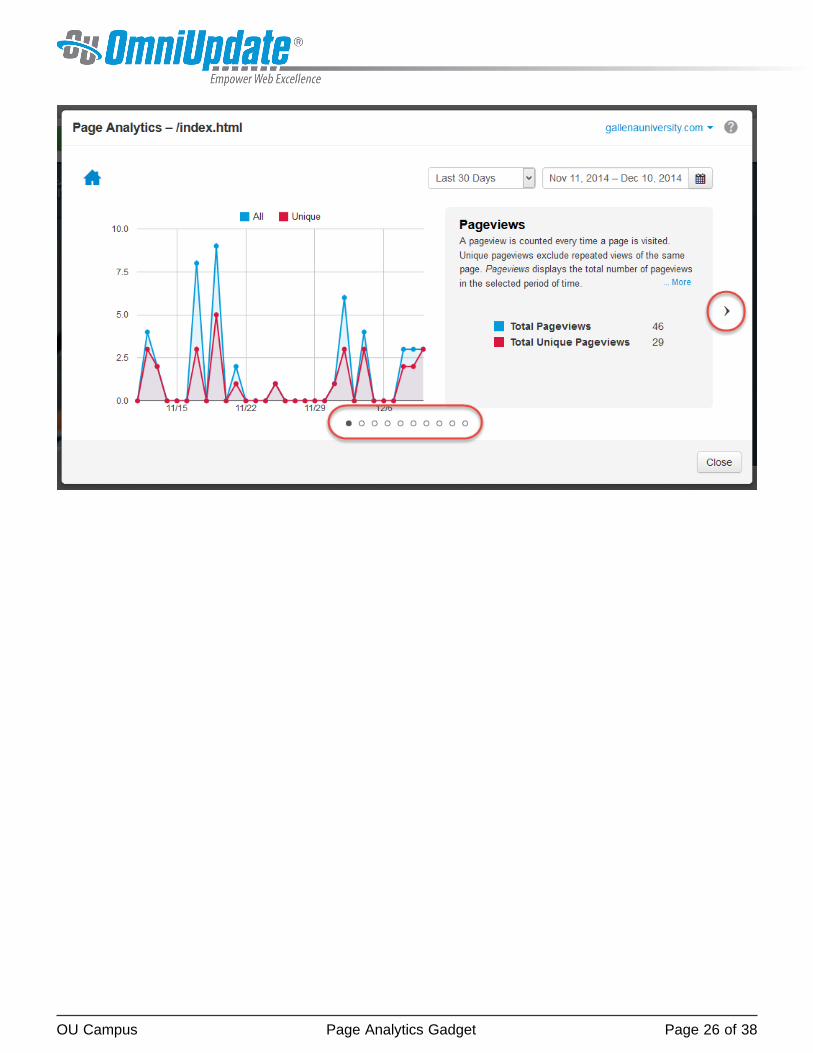
When browsing through expanded data groups or in the thumbnail view, navigation arrows and buttons areavailable to help the user navigate to different data groups.
OU Campus Page Analytics Gadget Page 26 of 38
OU Campus Analytics Data Groups Page 27 of 38
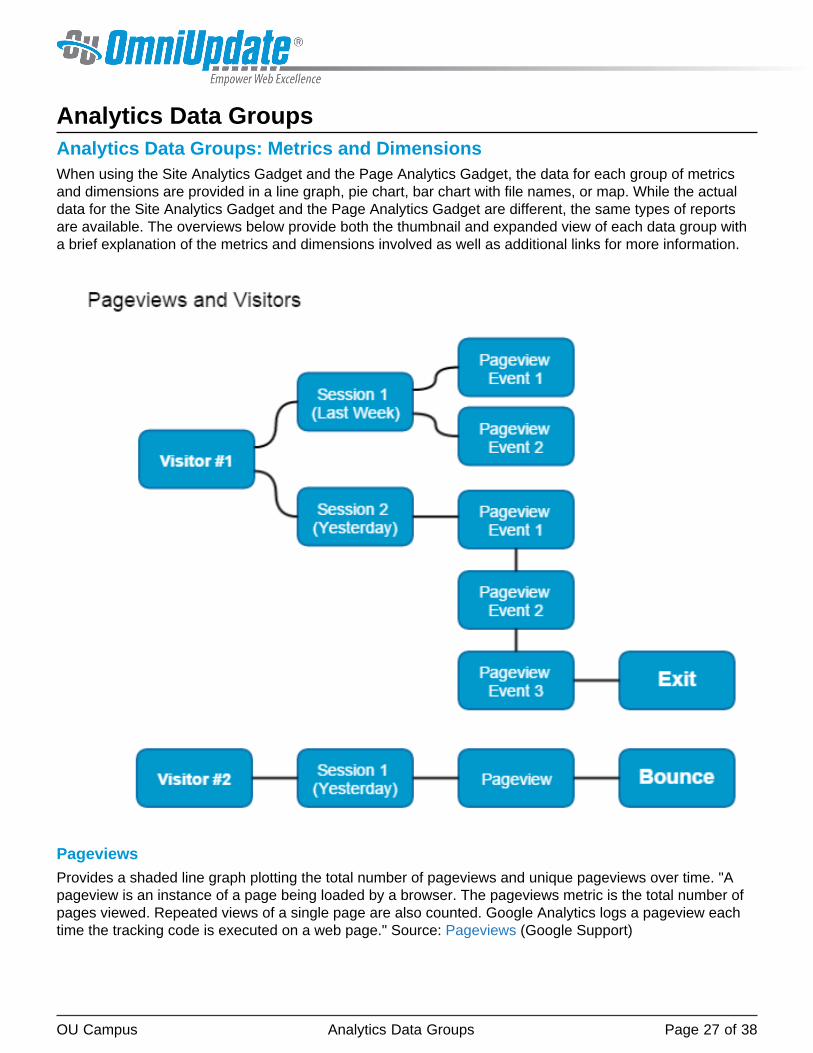
Analytics Data GroupsAnalytics Data Groups: Metrics and DimensionsWhen using the Site Analytics Gadget and the Page Analytics Gadget, the data for each group of metricsand dimensions are provided in a line graph, pie chart, bar chart with file names, or map. While the actualdata for the Site Analytics Gadget and the Page Analytics Gadget are different, the same types of reportsare available. The overviews below provide both the thumbnail and expanded view of each data group witha brief explanation of the metrics and dimensions involved as well as additional links for more information.
PageviewsProvides a shaded line graph plotting the total number of pageviews and unique pageviews over time. "Apageview is an instance of a page being loaded by a browser. The pageviews metric is the total number ofpages viewed. Repeated views of a single page are also counted. Google Analytics logs a pageview eachtime the tracking code is executed on a web page." Source: Pageviews (Google Support)
OU Campus Analytics Data Groups Page 28 of 38
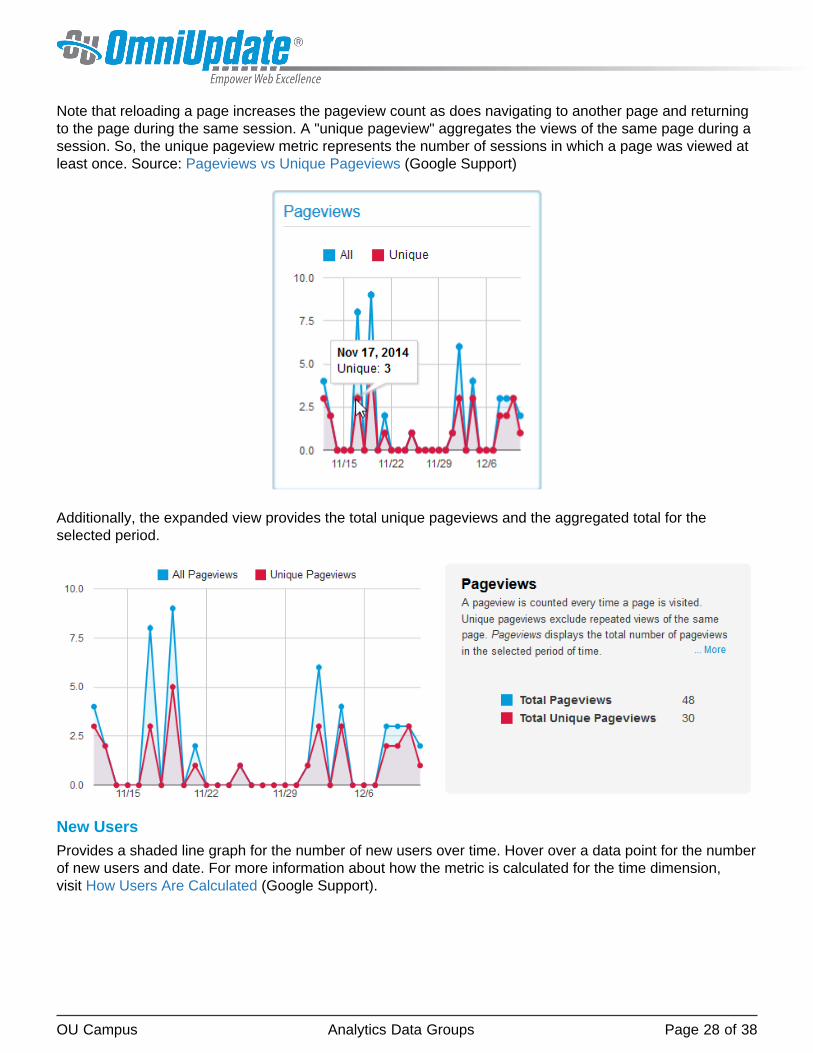
Note that reloading a page increases the pageview count as does navigating to another page and returningto the page during the same session. A "unique pageview" aggregates the views of the same page during asession. So, the unique pageview metric represents the number of sessions in which a page was viewed atleast once. Source: Pageviews vs Unique Pageviews (Google Support)
Additionally, the expanded view provides the total unique pageviews and the aggregated total for theselected period.
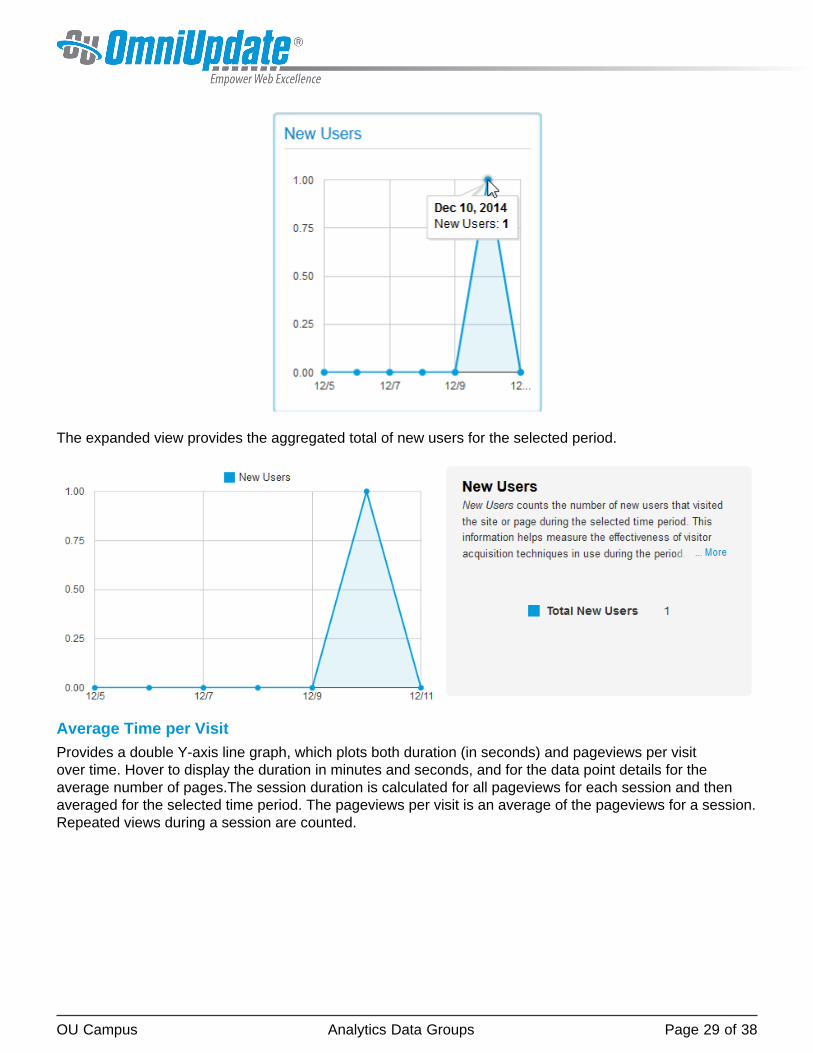
New UsersProvides a shaded line graph for the number of new users over time. Hover over a data point for the numberof new users and date. For more information about how the metric is calculated for the time dimension,visit How Users Are Calculated (Google Support).
OU Campus Analytics Data Groups Page 29 of 38
The expanded view provides the aggregated total of new users for the selected period.
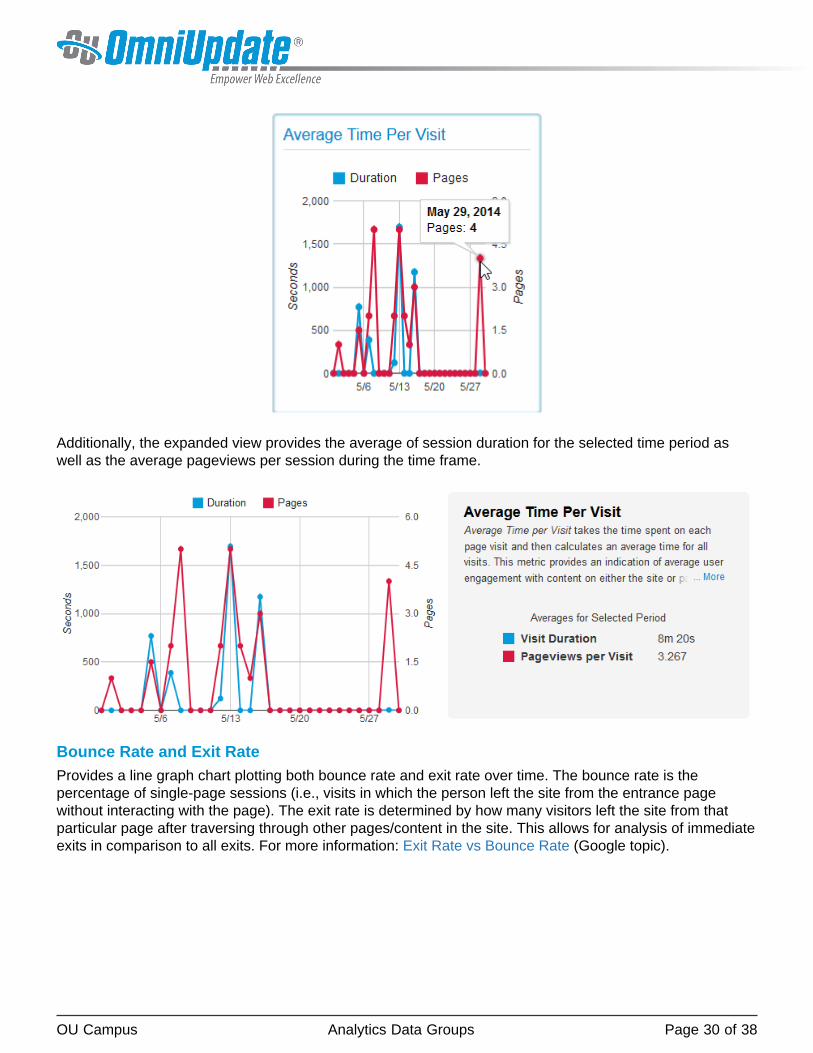
Average Time per VisitProvides a double Y-axis line graph, which plots both duration (in seconds) and pageviews per visitover time. Hover to display the duration in minutes and seconds, and for the data point details for theaverage number of pages.The session duration is calculated for all pageviews for each session and thenaveraged for the selected time period. The pageviews per visit is an average of the pageviews for a session.Repeated views during a session are counted.
OU Campus Analytics Data Groups Page 30 of 38
Additionally, the expanded view provides the average of session duration for the selected time period aswell as the average pageviews per session during the time frame.
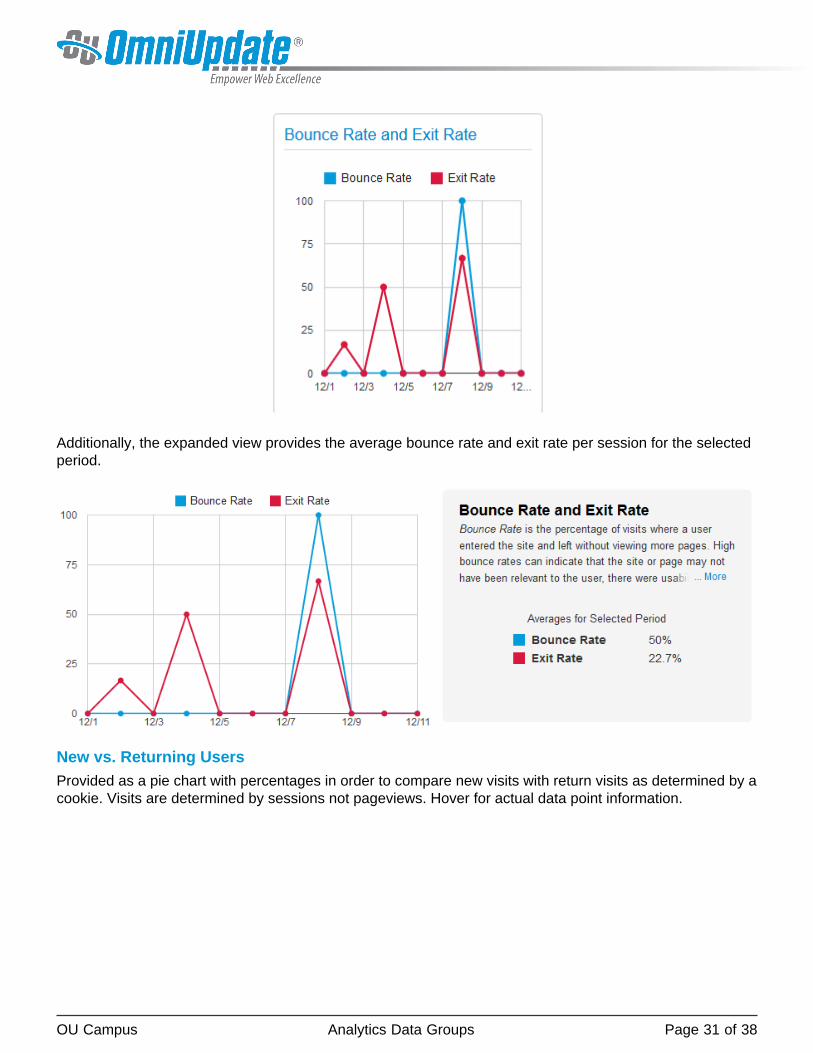
Bounce Rate and Exit RateProvides a line graph chart plotting both bounce rate and exit rate over time. The bounce rate is thepercentage of single-page sessions (i.e., visits in which the person left the site from the entrance pagewithout interacting with the page). The exit rate is determined by how many visitors left the site from thatparticular page after traversing through other pages/content in the site. This allows for analysis of immediateexits in comparison to all exits. For more information: Exit Rate vs Bounce Rate (Google topic).
OU Campus Analytics Data Groups Page 31 of 38
Additionally, the expanded view provides the average bounce rate and exit rate per session for the selectedperiod.
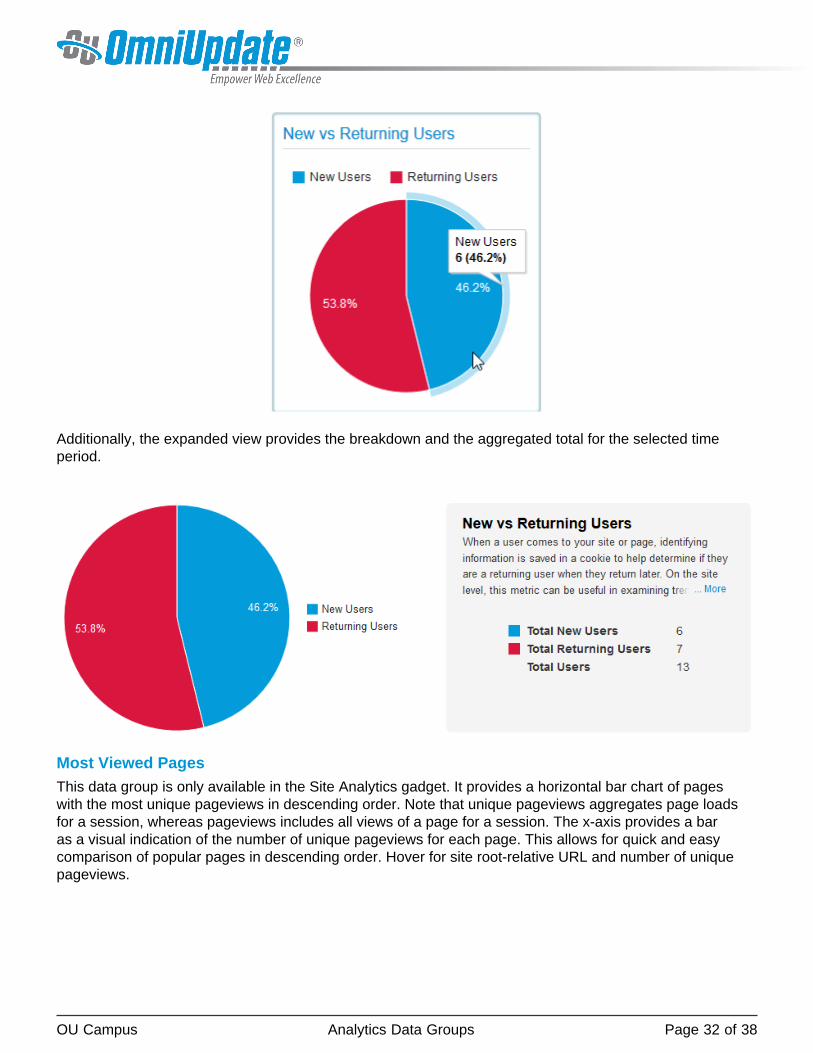
New vs. Returning UsersProvided as a pie chart with percentages in order to compare new visits with return visits as determined by acookie. Visits are determined by sessions not pageviews. Hover for actual data point information.
OU Campus Analytics Data Groups Page 32 of 38
Additionally, the expanded view provides the breakdown and the aggregated total for the selected timeperiod.
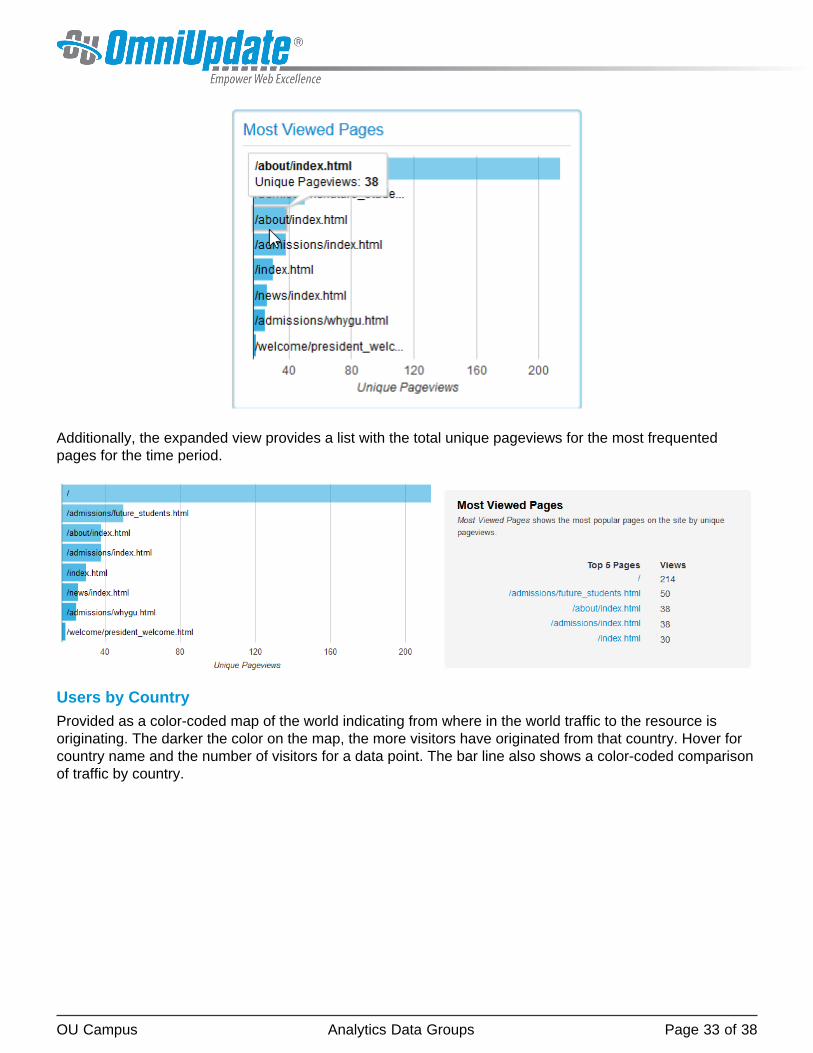
Most Viewed PagesThis data group is only available in the Site Analytics gadget. It provides a horizontal bar chart of pageswith the most unique pageviews in descending order. Note that unique pageviews aggregates page loadsfor a session, whereas pageviews includes all views of a page for a session. The x-axis provides a baras a visual indication of the number of unique pageviews for each page. This allows for quick and easycomparison of popular pages in descending order. Hover for site root-relative URL and number of uniquepageviews.
OU Campus Analytics Data Groups Page 33 of 38
Additionally, the expanded view provides a list with the total unique pageviews for the most frequentedpages for the time period.
Users by CountryProvided as a color-coded map of the world indicating from where in the world traffic to the resource isoriginating. The darker the color on the map, the more visitors have originated from that country. Hover forcountry name and the number of visitors for a data point. The bar line also shows a color-coded comparisonof traffic by country.

OU Campus Analytics Data Groups Page 34 of 38
Additionally, the expanded view provides a list of the top five countries (if available) generating the mosttraffic and the total of all visits for the country for the selected time period.
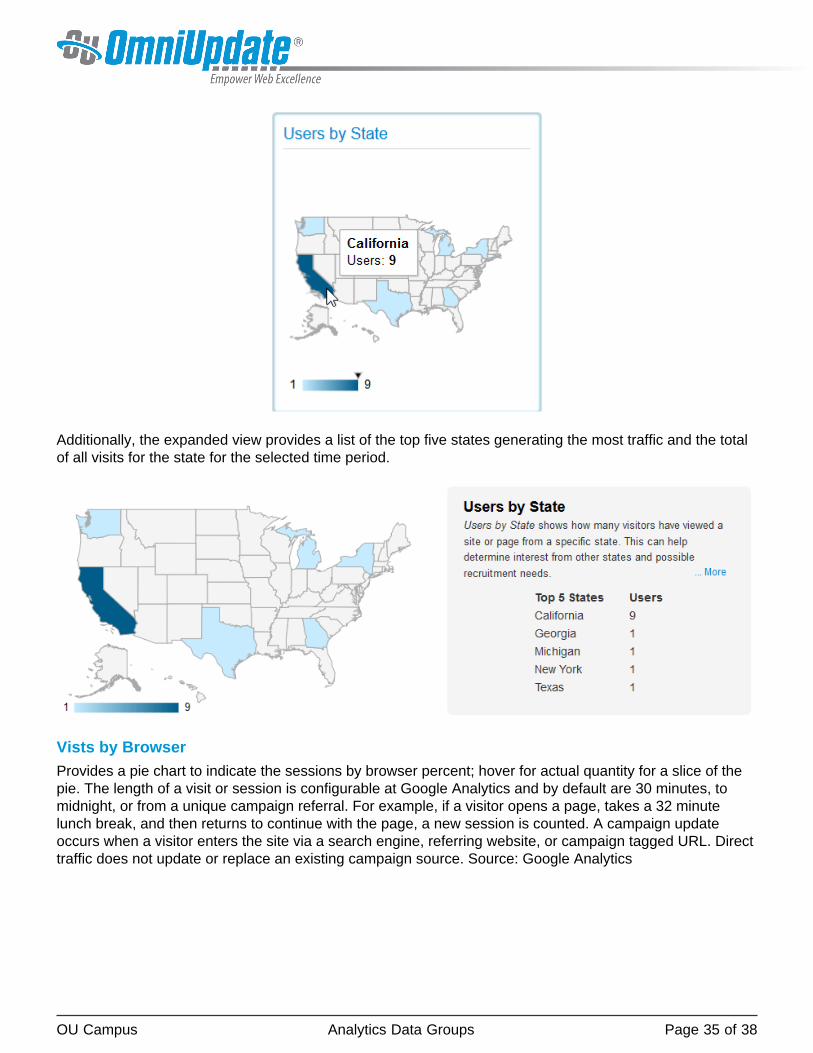
Users by StateHover for state name and the number of visitors for a data point. Provided as a color-coded map of theUnited States indicating from where in the United States traffic to the resource is originating. The darker thecolor on the map, the more visitors have originated from that state. Hover for state name and the number ofvisitors. The bar line also shows a color-coded comparison of traffic by state.
OU Campus Analytics Data Groups Page 35 of 38
Additionally, the expanded view provides a list of the top five states generating the most traffic and the totalof all visits for the state for the selected time period.
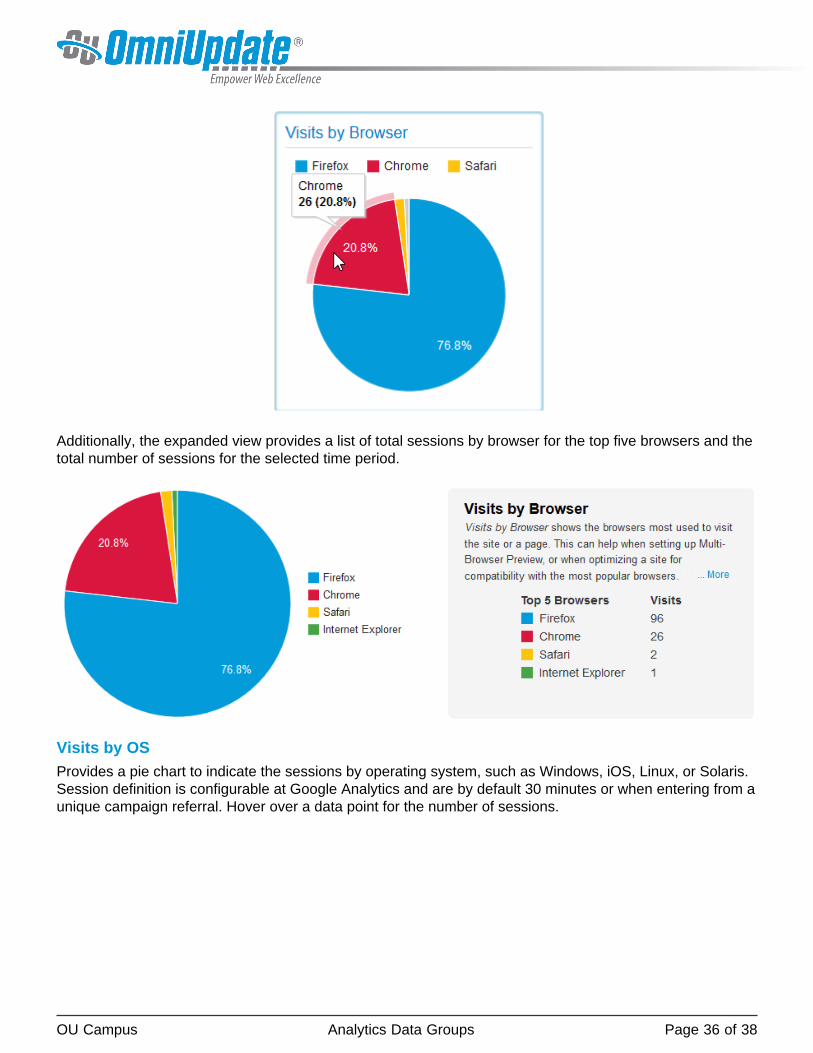
Vists by BrowserProvides a pie chart to indicate the sessions by browser percent; hover for actual quantity for a slice of thepie. The length of a visit or session is configurable at Google Analytics and by default are 30 minutes, tomidnight, or from a unique campaign referral. For example, if a visitor opens a page, takes a 32 minutelunch break, and then returns to continue with the page, a new session is counted. A campaign updateoccurs when a visitor enters the site via a search engine, referring website, or campaign tagged URL. Directtraffic does not update or replace an existing campaign source. Source: Google Analytics
OU Campus Analytics Data Groups Page 36 of 38
Additionally, the expanded view provides a list of total sessions by browser for the top five browsers and thetotal number of sessions for the selected time period.
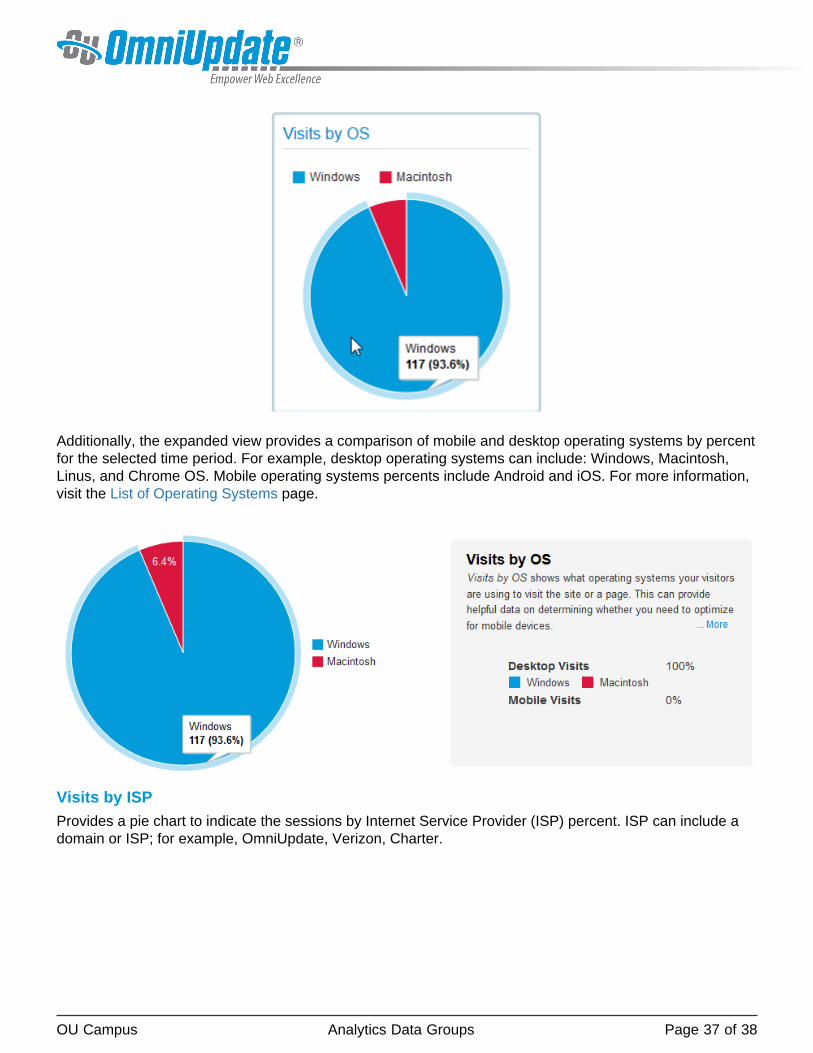
Visits by OSProvides a pie chart to indicate the sessions by operating system, such as Windows, iOS, Linux, or Solaris.Session definition is configurable at Google Analytics and are by default 30 minutes or when entering from aunique campaign referral. Hover over a data point for the number of sessions.
OU Campus Analytics Data Groups Page 37 of 38
Additionally, the expanded view provides a comparison of mobile and desktop operating systems by percentfor the selected time period. For example, desktop operating systems can include: Windows, Macintosh,Linus, and Chrome OS. Mobile operating systems percents include Android and iOS. For more information,visit the List of Operating Systems page.
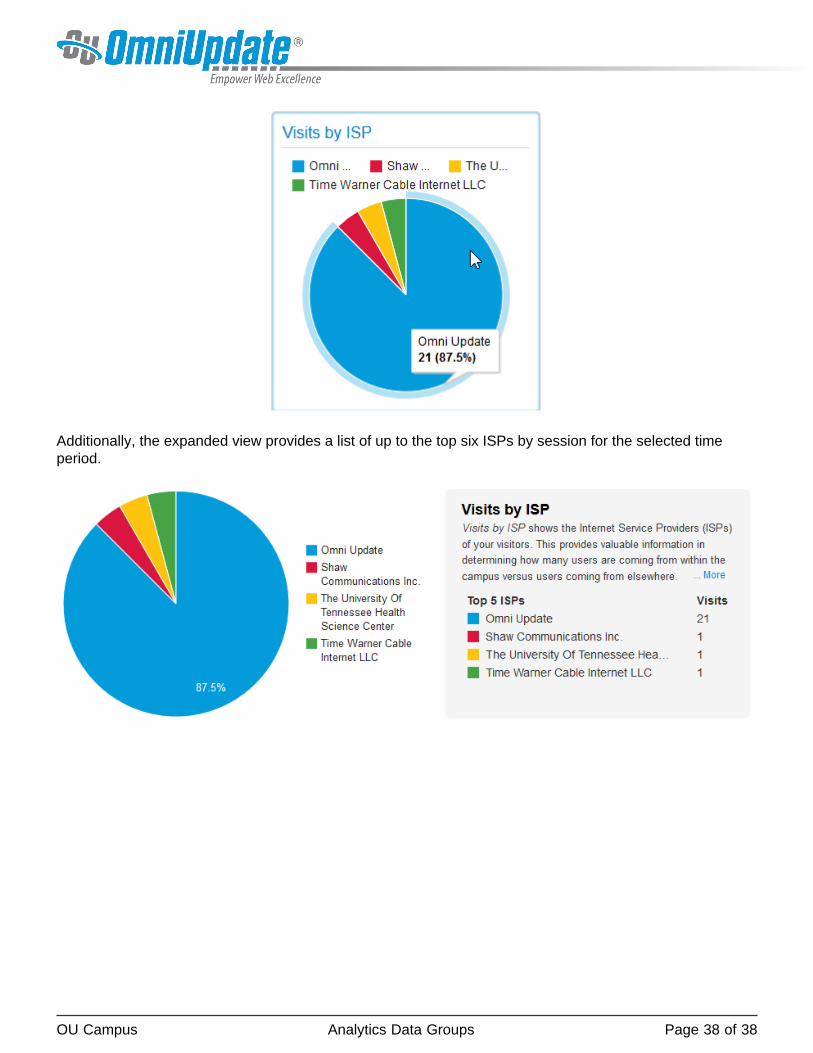
Visits by ISPProvides a pie chart to indicate the sessions by Internet Service Provider (ISP) percent. ISP can include adomain or ISP; for example, OmniUpdate, Verizon, Charter.
OU Campus Analytics Data Groups Page 38 of 38
Additionally, the expanded view provides a list of up to the top six ISPs by session for the selected timeperiod.