Embed Size (px)
Citation preview

WORDPRESS HOW-TO:
Using Google Analytics to Track Site Statistics and Search Engine Optimization
GOOGLE ANALYTICS
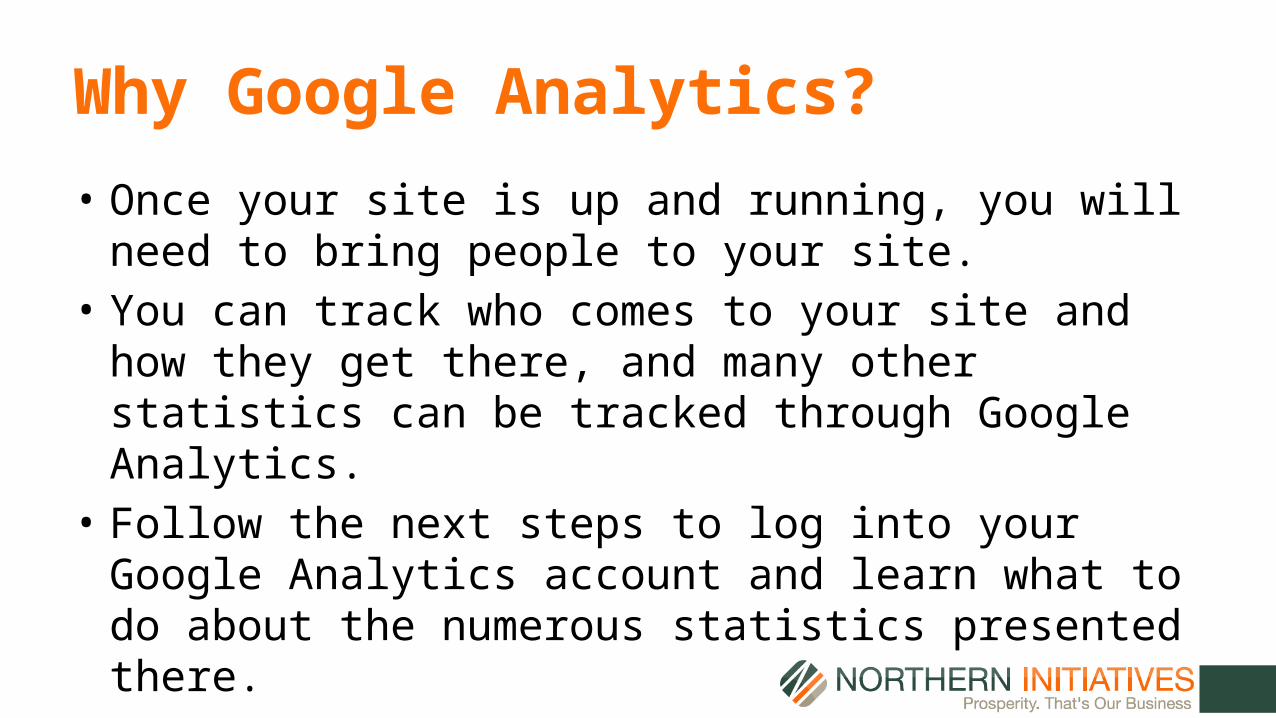
Why Google Analytics?
• Once your site is up and running, you will need to bring people to your site.
• You can track who comes to your site and how they get there, and many other statistics can be tracked through Google Analytics.
• Follow the next steps to log into your Google Analytics account and learn what to do about the numerous statistics presented there.
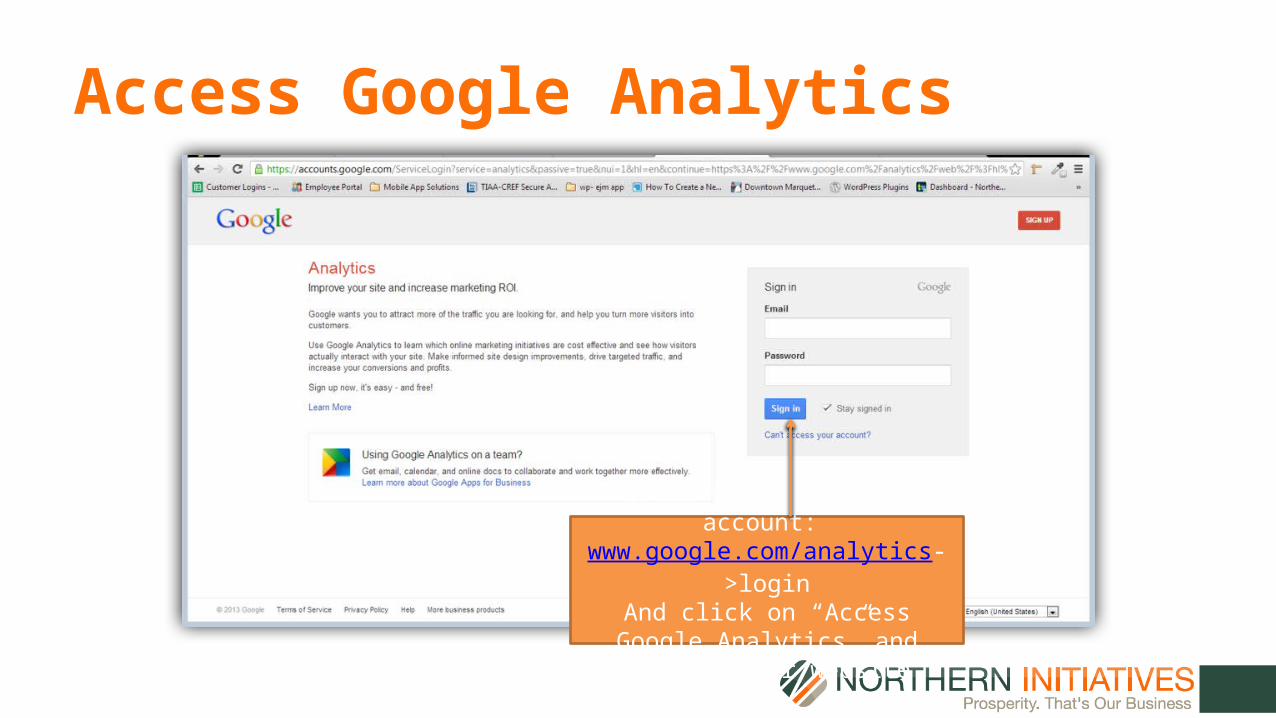
Access Google Analytics
Login to your google account: www.google.com/analytics->login
And click on “Access Google Analytics” and click on your website.
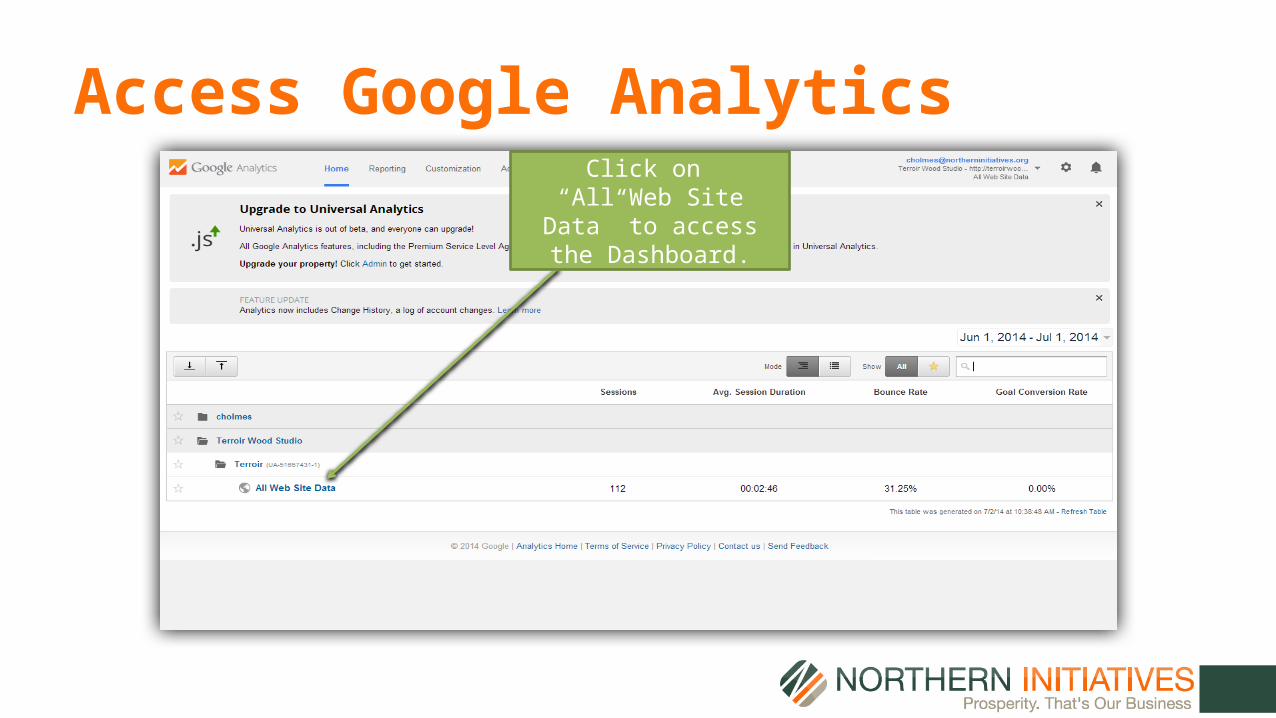
Access Google AnalyticsClick on
“All Web Site Data” to access the Dashboard.
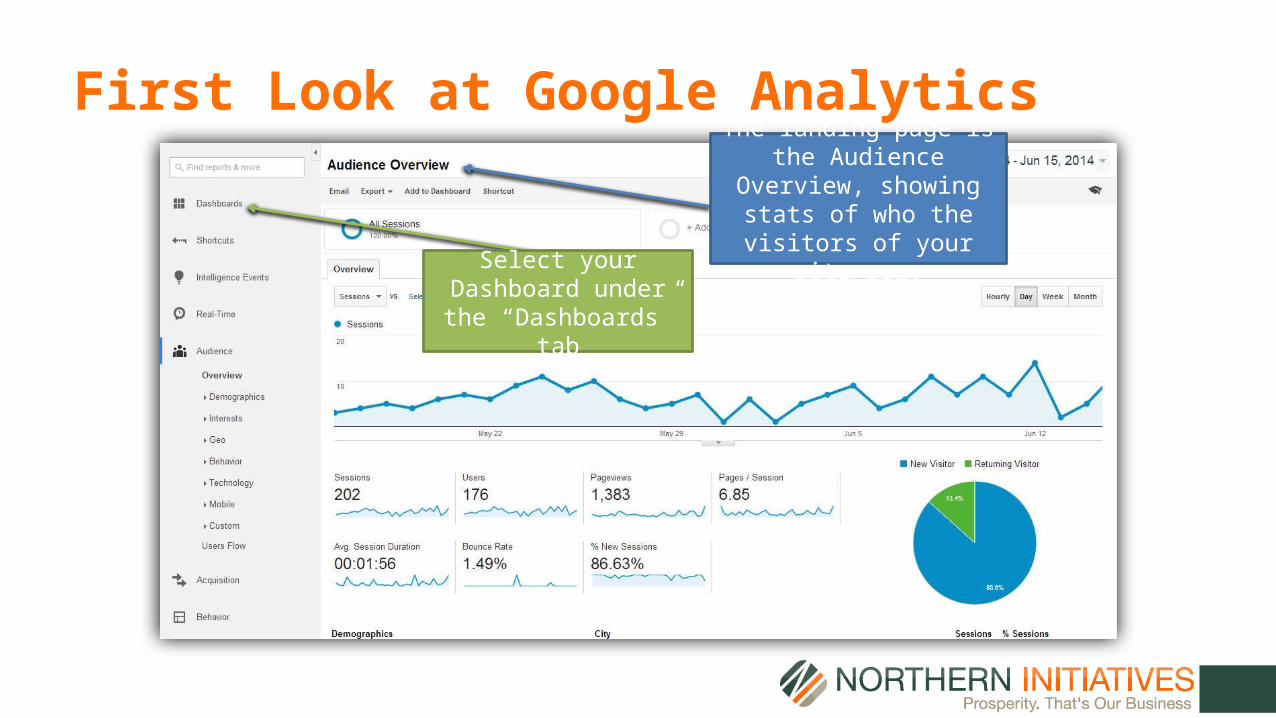
First Look at Google Analytics
Select your Dashboard under the “Dashboards”
tab
The landing page is the Audience Overview,
showing stats of who the visitors of your site are.
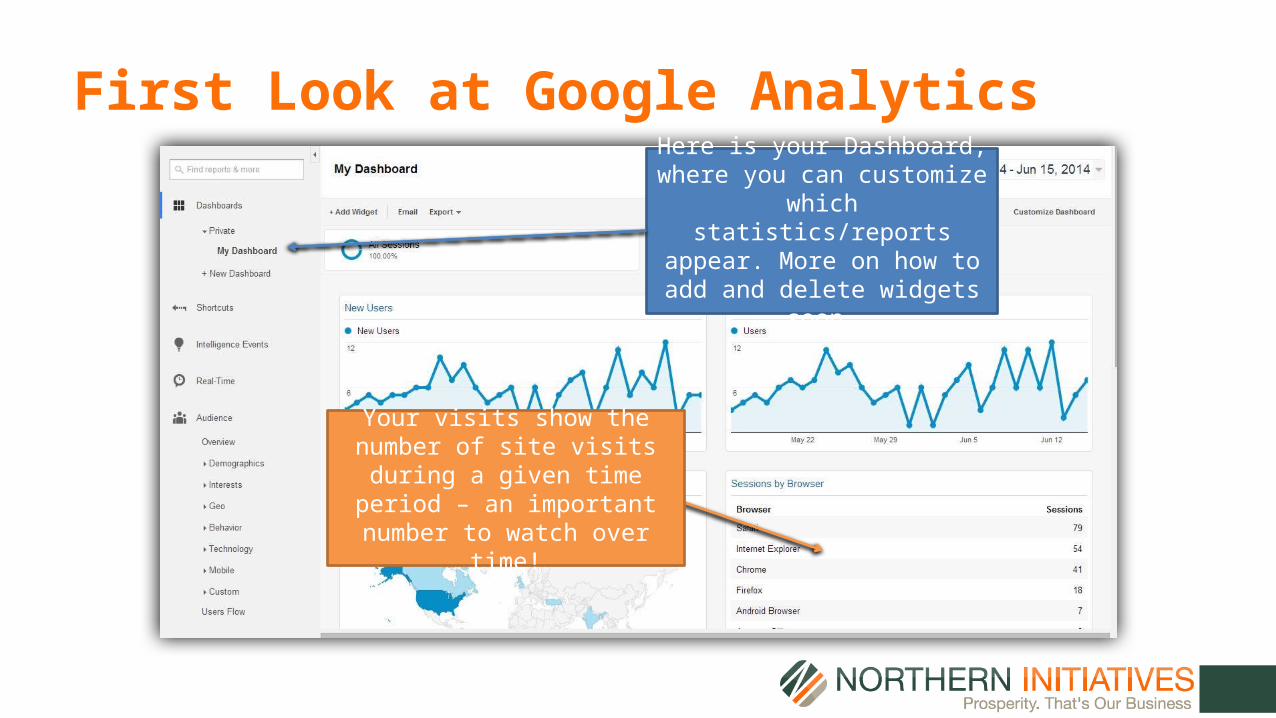
First Look at Google AnalyticsHere is your Dashboard, where
you can customize which statistics/reports appear. More on
how to add and delete widgets soon.
Your visits show the number of site visits during a given time
period – an important number to watch over time!
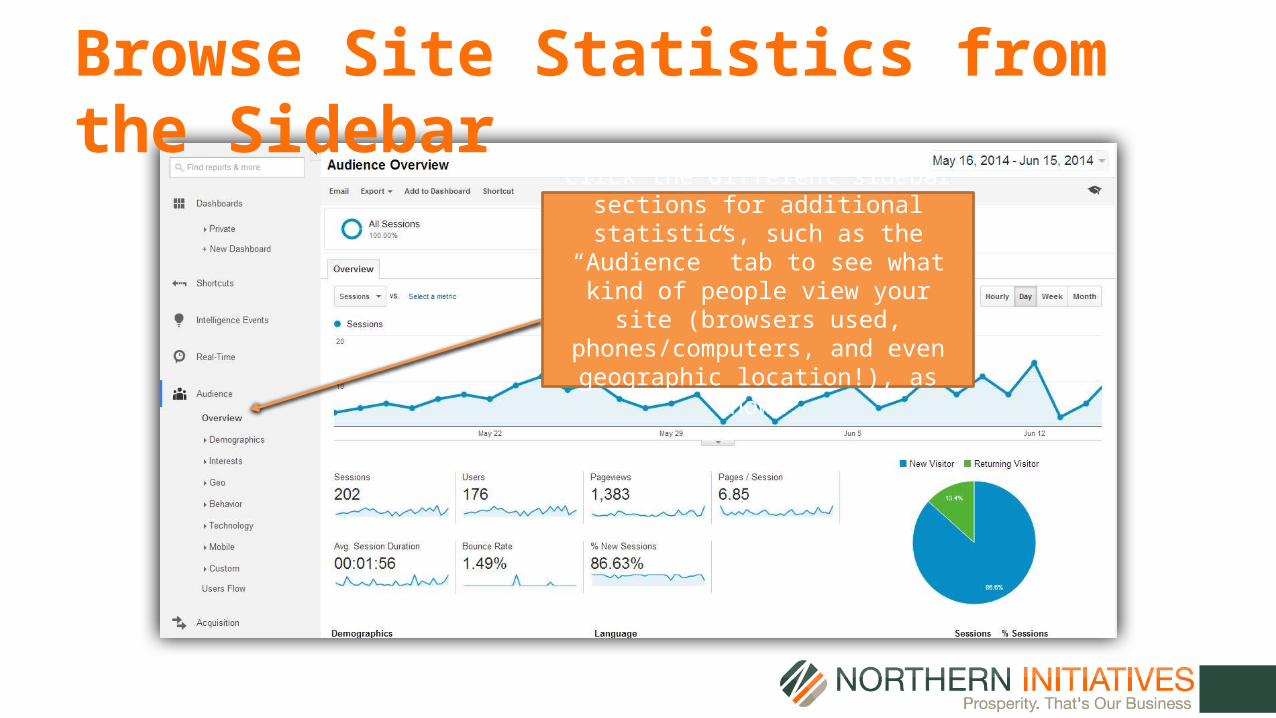
Browse Site Statistics from the Sidebar
Click the different sidebar sections for additional statistics, such as the
“Audience” tab to see what kind of people view your site (browsers used,
phones/computers, and even geographic location!), as shown.
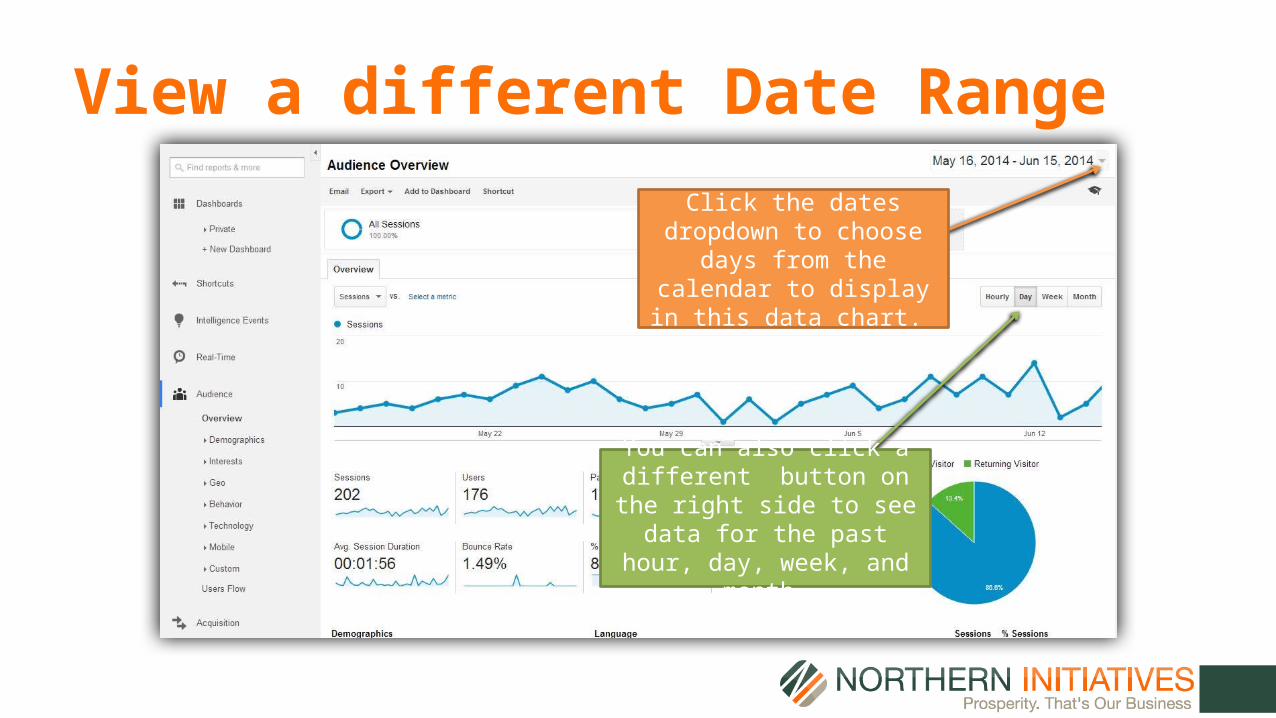
View a different Date Range
Click the dates dropdown to choose days from the
calendar to display in this data chart.
You can also click a different button on the right side to see
data for the past hour, day, week, and month.
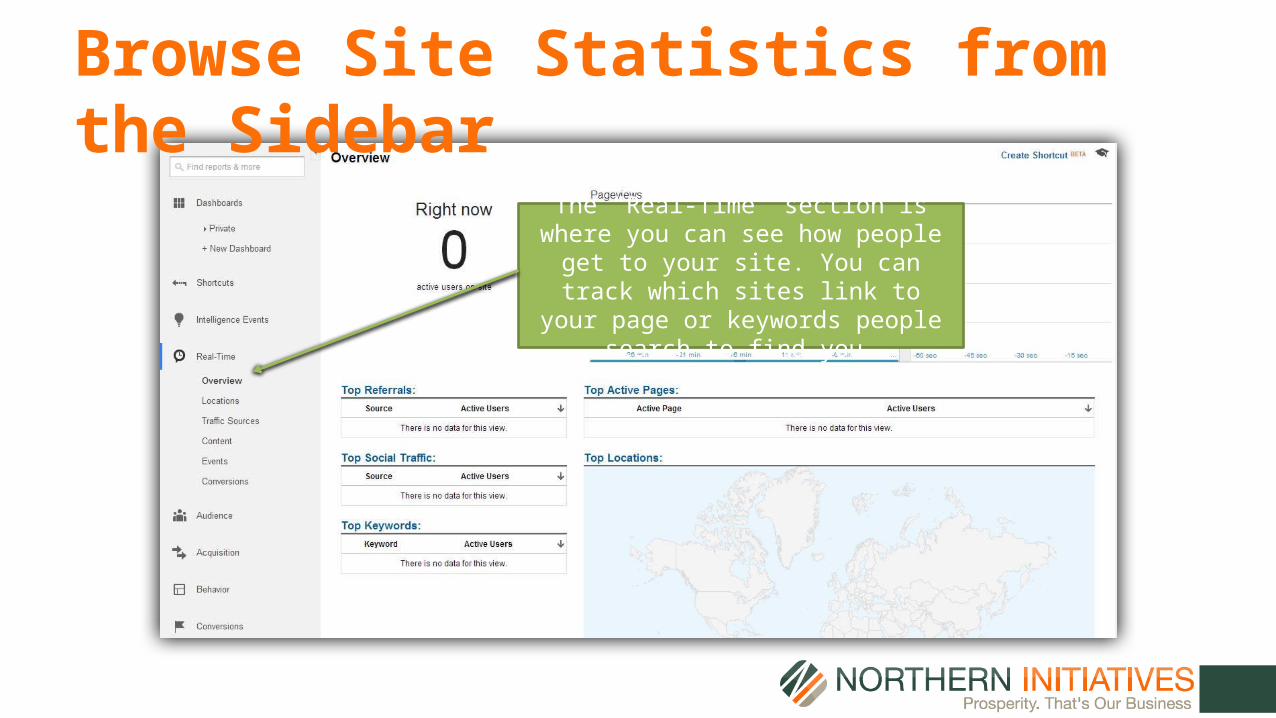
Browse Site Statistics from the Sidebar
The “Real-Time” section is where you can see how people get to your site. You can
track which sites link to your page or keywords people search to find you.
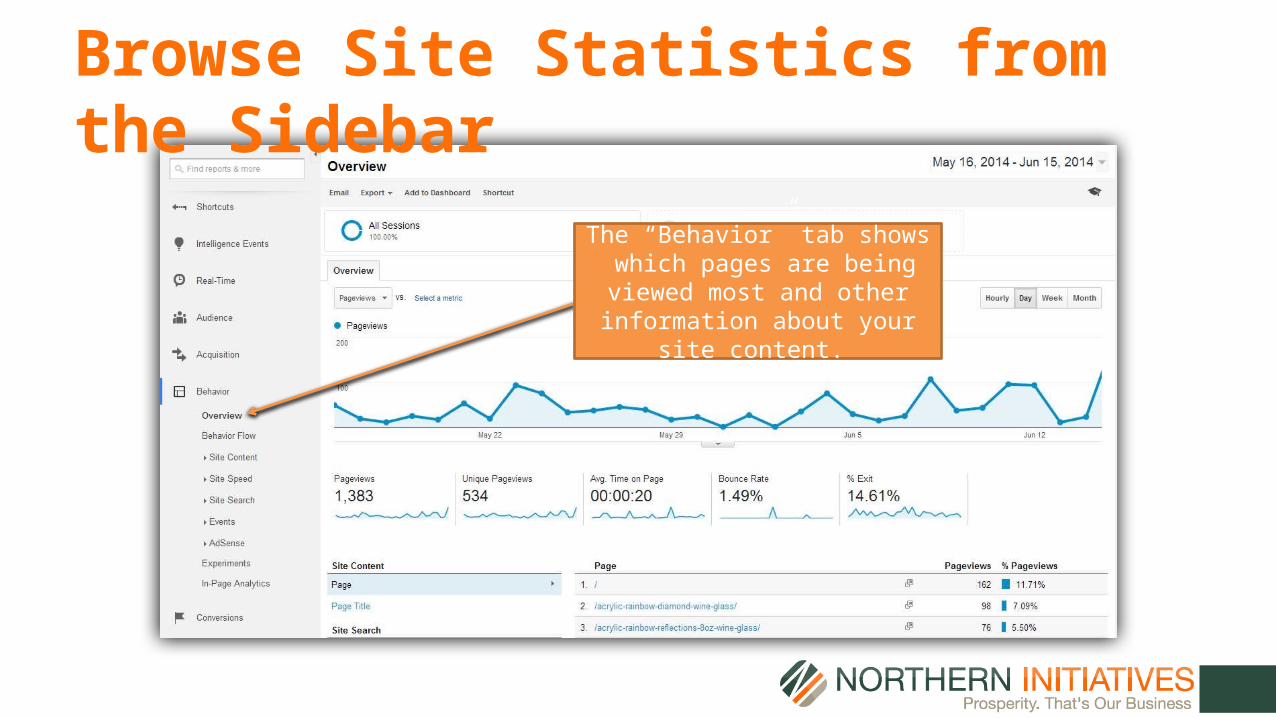
Browse Site Statistics from the Sidebar
The “Behavior” tab shows which pages are being viewed most and other information about your site
content.
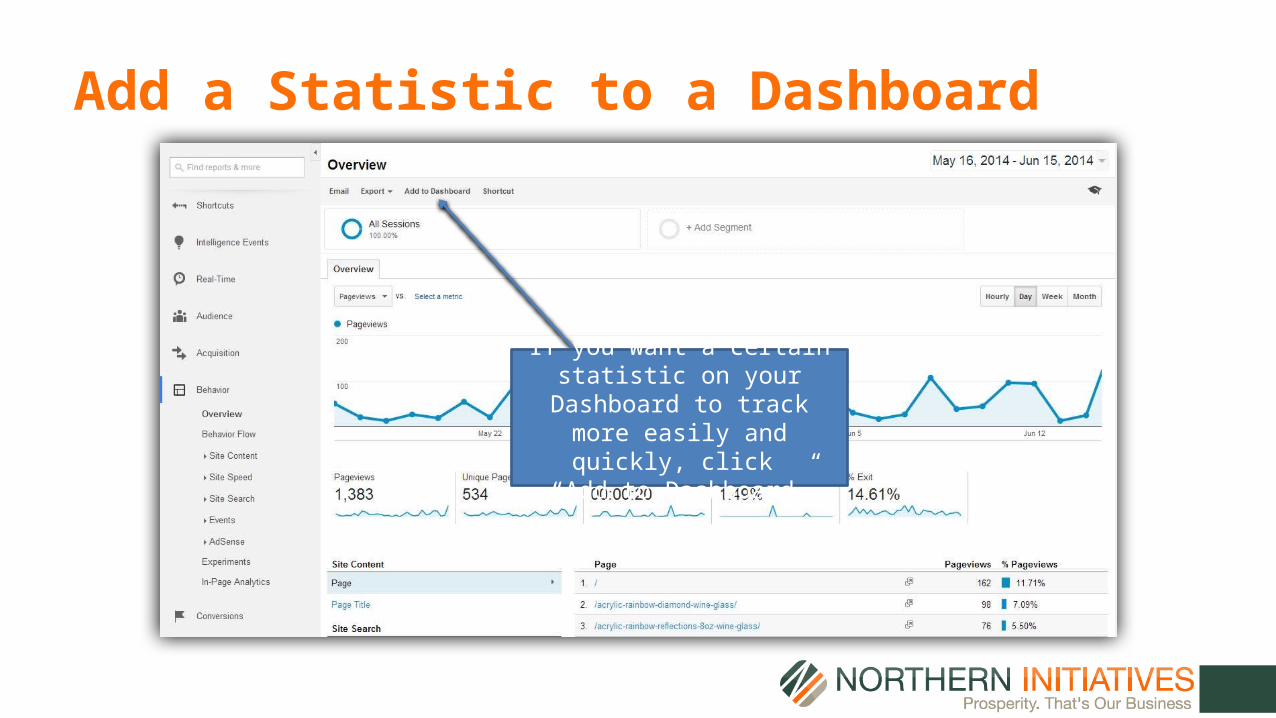
Add a Statistic to a Dashboard
If you want a certain statistic on your Dashboard to track more
easily and quickly, click “Add to Dashboard”
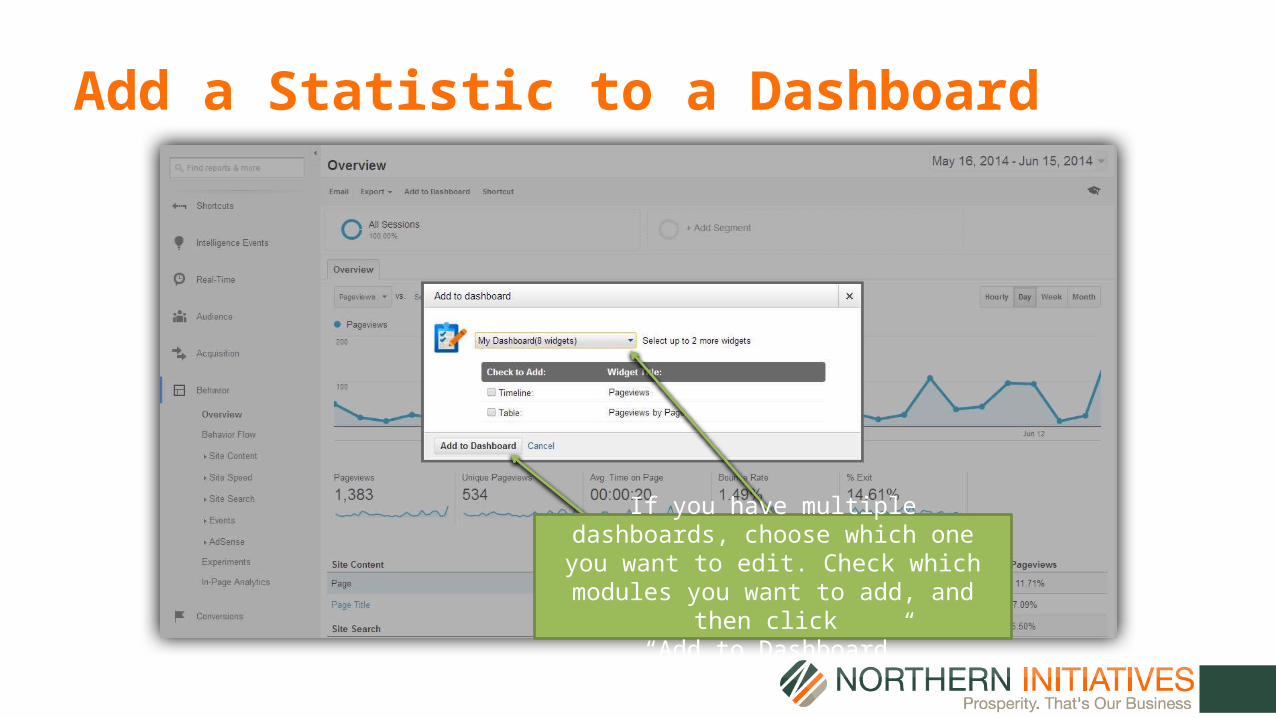
Add a Statistic to a Dashboard
If you have multiple dashboards, choose which one you want to edit. Check which modules
you want to add, and then click “Add to Dashboard”
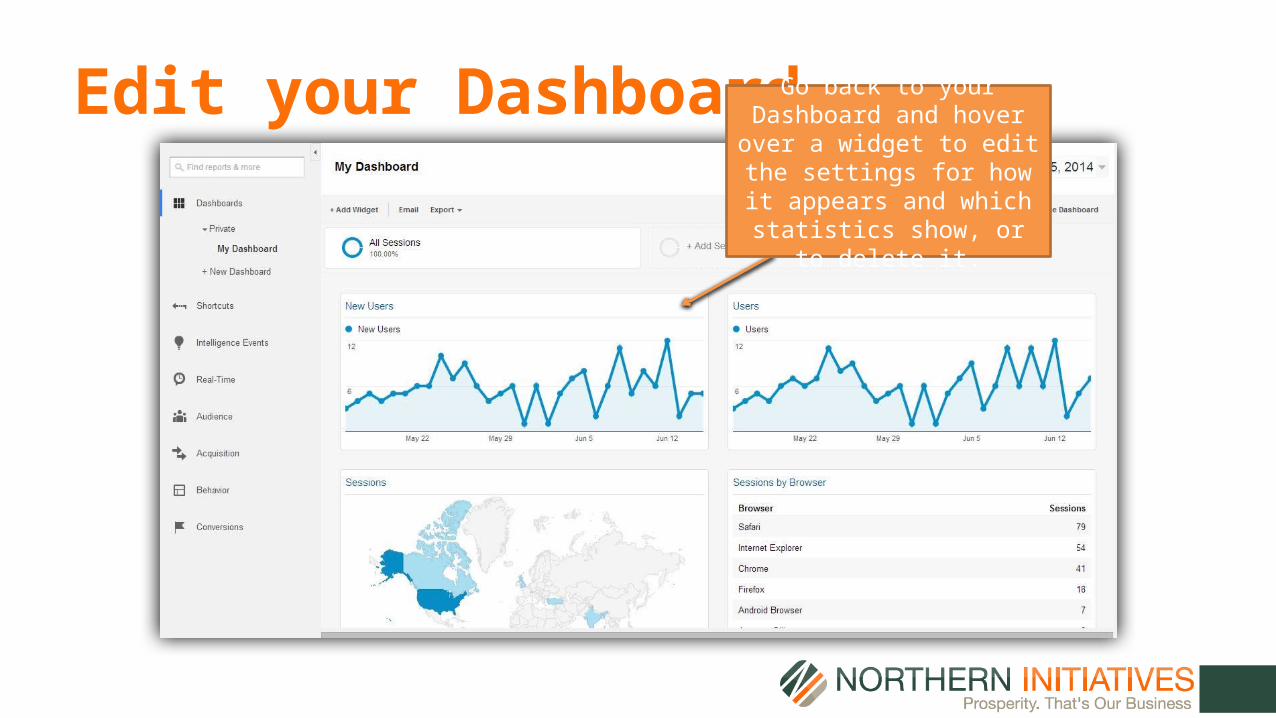
Edit your Dashboard Go back to your Dashboard and hover over a widget to edit the settings for how it appears and which statistics show, or to
delete it.
Now What?
• You have your dashboard set up. Now what do you do with all these graphs and charts? How do you know what to change and why?
• Conversion goals help you track specific outcomes you want to happen, such as a newsletter subscription, an order confirmation page, or time duration on your website.
• Follow these steps to set up a goal and track its progress
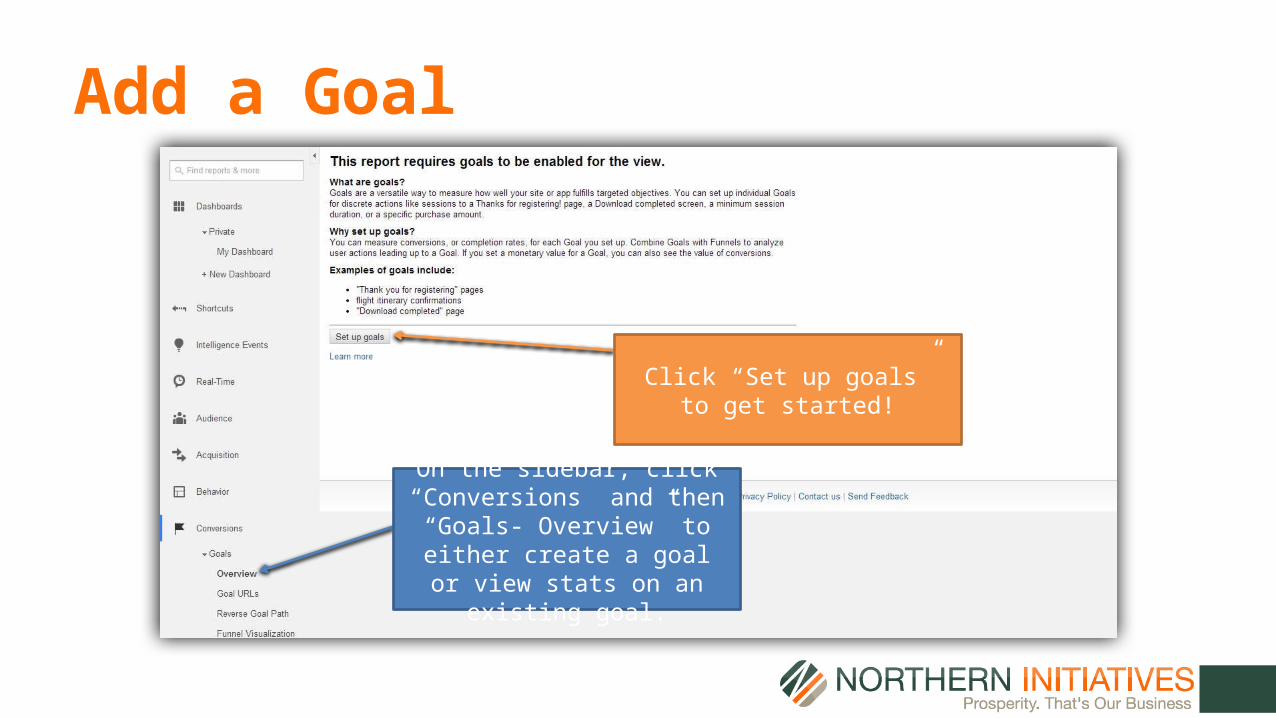
Add a Goal
On the sidebar, click “Conversions” and then “Goals-
Overview” to either create a goal or view stats on an existing goal.
Click “Set up goals” to get started!
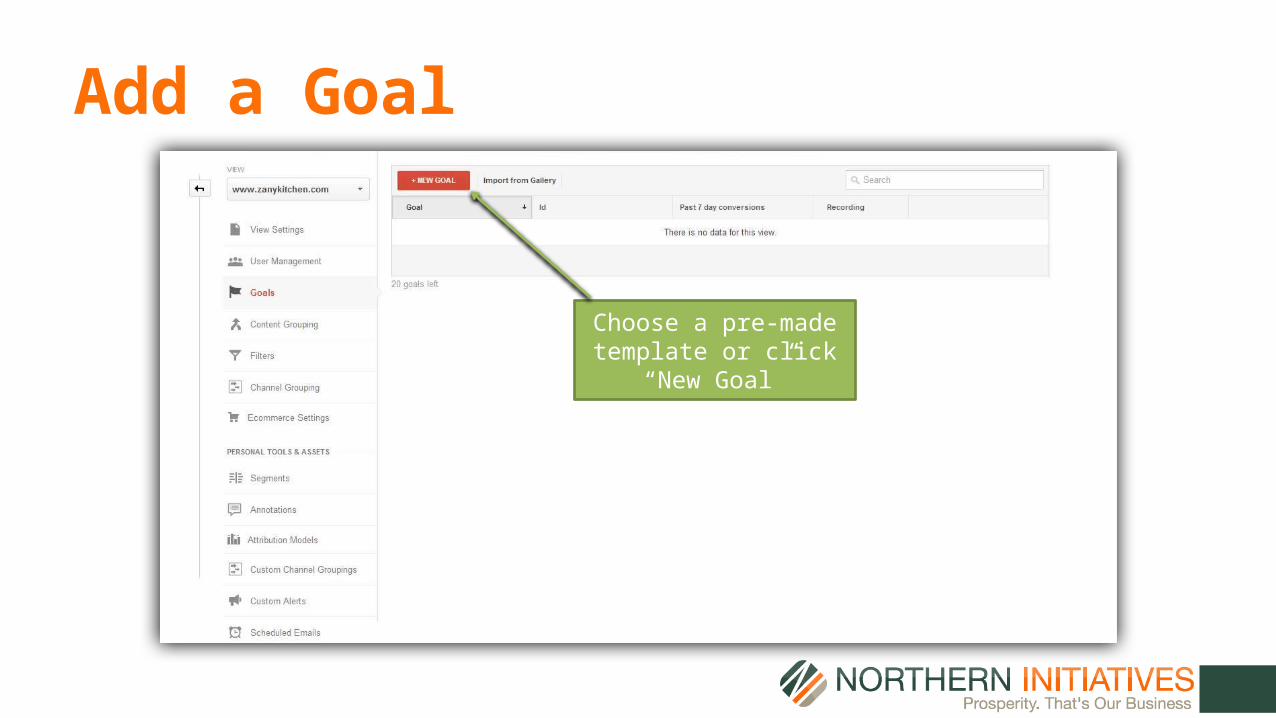
Add a Goal
Choose a pre-made template or click
“New Goal”
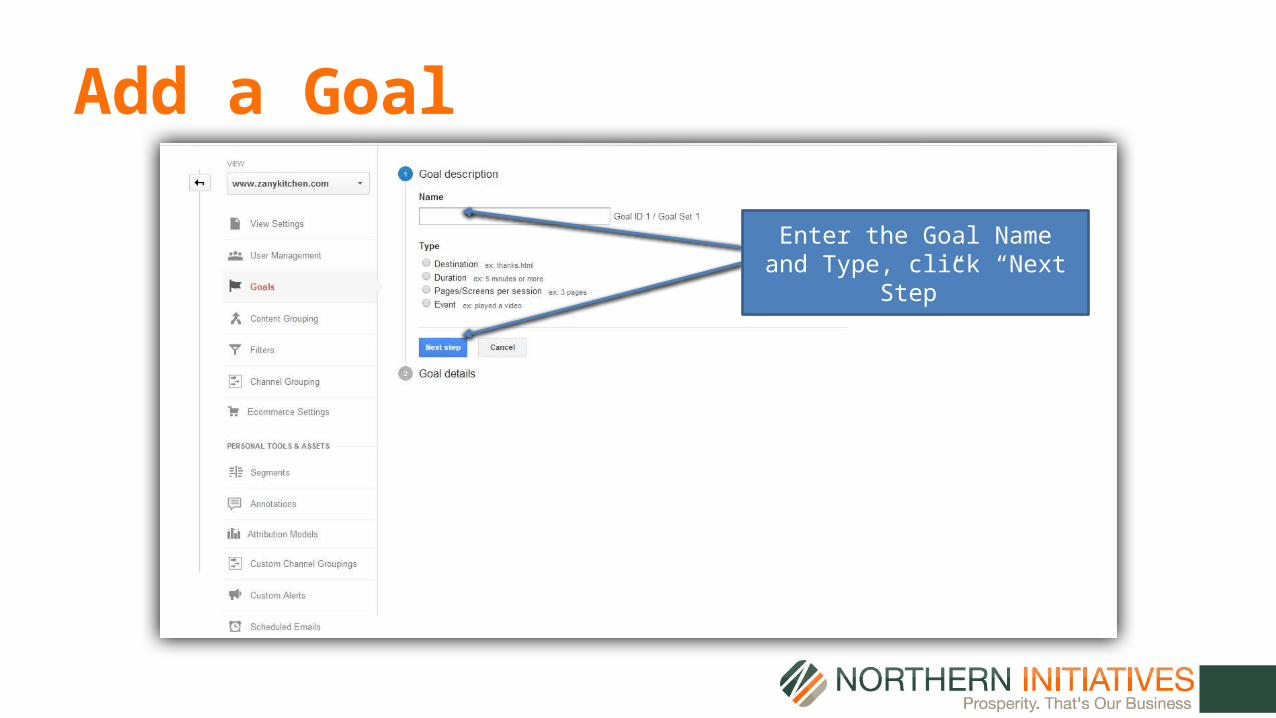
Add a Goal
Enter the Goal Name and Type, click “Next Step”
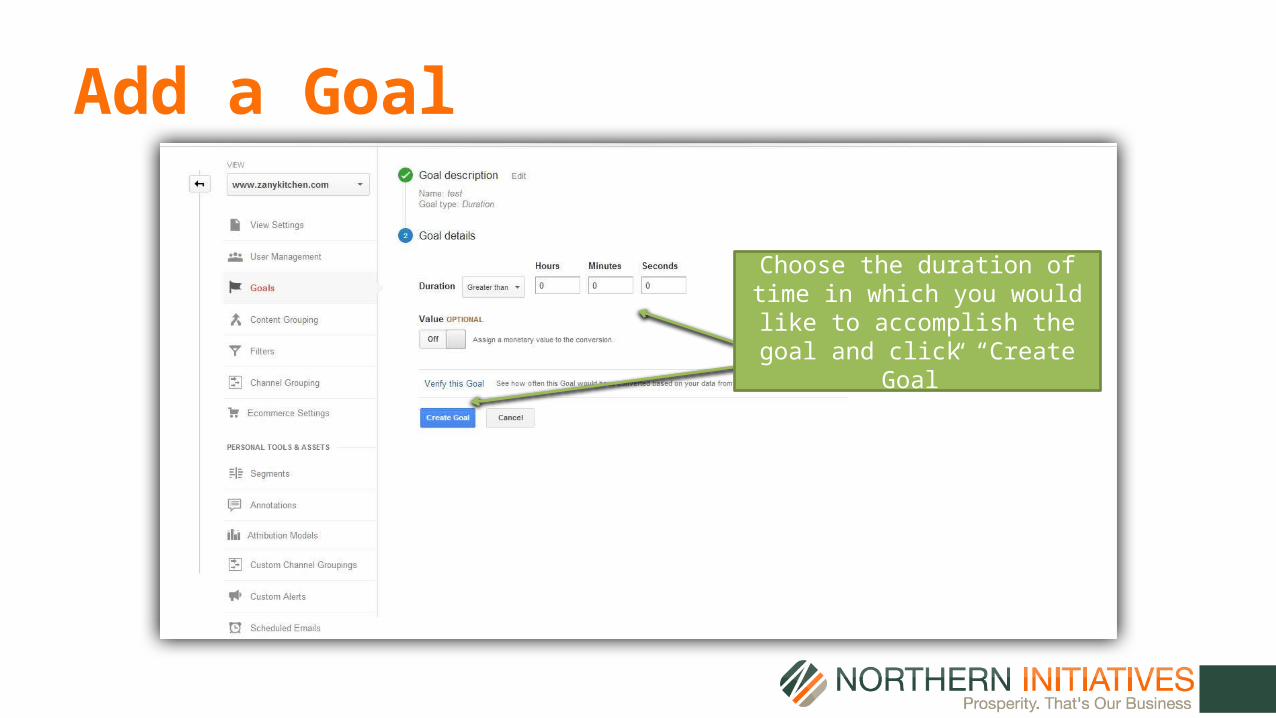
Add a Goal
Choose the duration of time in which you would like to accomplish
the goal and click “Create Goal”
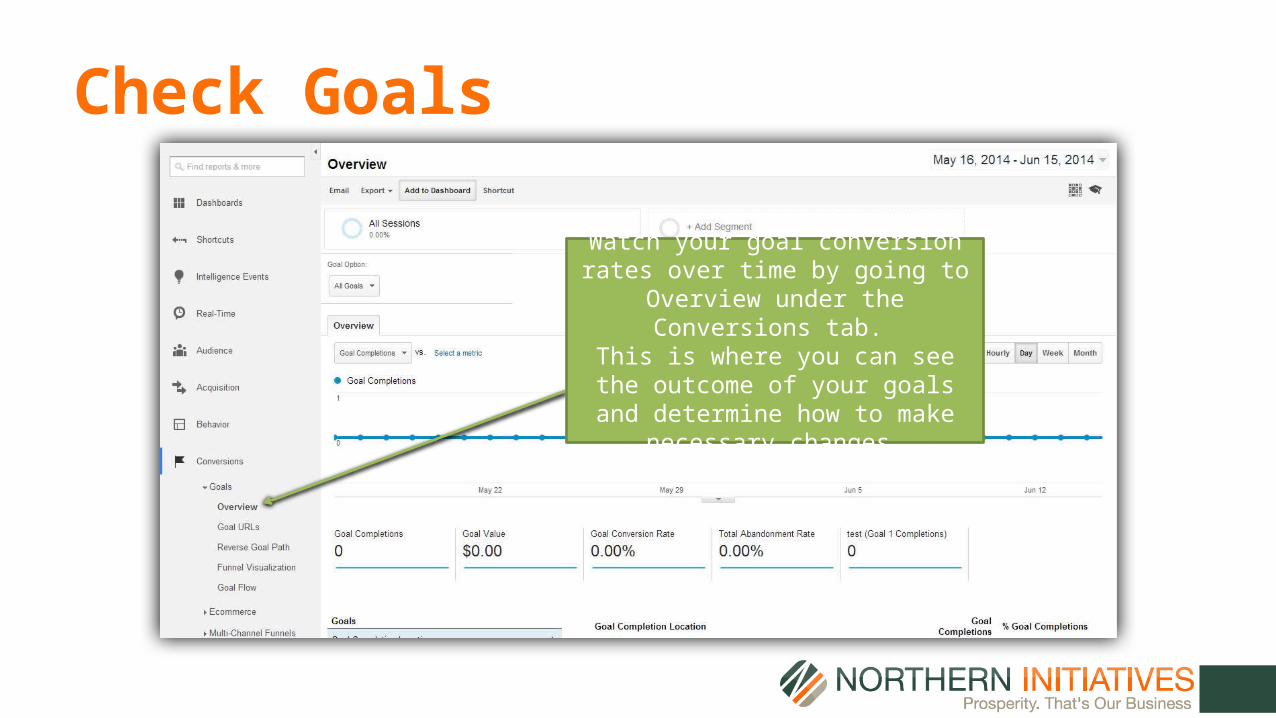
Check Goals
Watch your goal conversion rates over time by going to Overview under the
Conversions tab. This is where you can see the outcome
of your goals and determine how to make necessary changes.