Embed Size (px)
Citation preview
8/13/2019 635264979128106250_Ajanta Pharma_Q3FY14 Result Update
http://slidepdf.com/reader/full/635264979128106250ajanta-pharmaq3fy14-result-update 1/4
‐
50.00
100.00
150.00
200.00
250.00
300.00
350.00
Ajanta Pharma Sensex
IndiaNivesh Research IndiaNivesh Securities Private Limited601 & 602, Sukh Sagar, N. S. Patkar Marg, Girgaum Chowpatty, Mumbai 400 007. Tel: (022) 66188800
Result UpdateJanuary 28, 2014
Ajanta Pharma Ltd.(Standalone)
IndiaNivesh Research is also available on Bloomberg INNS, Thomson First Call, Reuters and Factiva INDNIV.
STOCK INFO
Bse 532331
Nse AJANTPHARM
Bloomberg AJP IN
Reuters AJPH. BO
Sector Pharmaceutical
Face Value (Rs) 5
Equity Capital (Rs mn) 177
Mkt Cap (Rs mn) 32,002
52w H/L (Rs) 1,020/327
Avg Daily Vol (BSE+NSE) 64,567
SHAREHOLDING PATTERN %
(as on 31st Dec. 2013)
Promoters 73.60
FIIs 2.74
DIIs 0.04
Public & Others 23.62
Source: BSE
STOCK PERFORMANCE (%) 1m 3m 12m
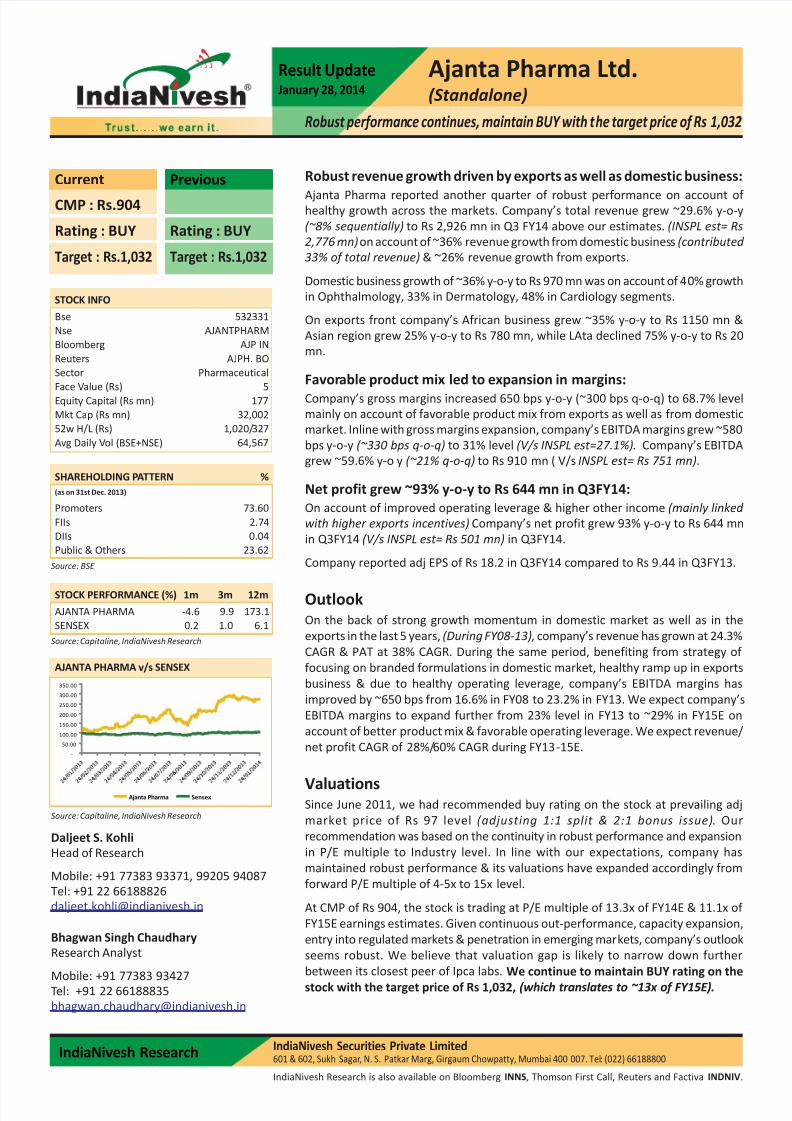
AJANTA PHARMA -4.6 9.9 173.1
SENSEX 0.2 1.0 6.1
AJANTA PHARMA v/s SENSEX
Source: Capitaline, IndiaNivesh Research
Source: Capitaline, IndiaNivesh Research
CMP : Rs.904
Rating : BUY
Target : Rs.1,032
Rating : BUY
Target : Rs.1,032
Current Previous
Daljeet S. Kohli
Head of Research
Mobile: +91 77383 93371, 99205 94087
Tel: +91 22 66188826
Bhagwan Singh Chaudhary
Research Analyst
Mobile: +91 77383 93427
Tel: +91 22 66188835
Robust revenue growth driven by exports as well as domestic business:
Ajanta Pharma reported another quarter of robust performance on account of healthy growth across the markets. Company’s total revenue grew ~29.6% y-o-y
(~8% sequentially) to Rs 2,926 mn in Q3 FY14 above our estimates. (INSPL est= Rs
2,776 mn) on account of ~36% revenue growth from domestic business (contributed
33% of total revenue) & ~26% revenue growth from exports.
Domestic business growth of ~36% y-o-y to Rs 970 mn was on account of 40% growth
in Ophthalmology, 33% in Dermatology, 48% in Cardiology segments.
On exports front company’s African business grew ~35% y-o-y to Rs 1150 mn &
Asian region grew 25% y-o-y to Rs 780 mn, while LAta declined 75% y-o-y to Rs 20
mn.
Favorable product mix led to expansion in margins:
Company’s gross margins increased 650 bps y-o-y (~300 bps q-o-q) to 68.7% level
mainly on account of favorable product mix from exports as well as from domestic
market. Inline with gross margins expansion, company’s EBITDA margins grew ~580
bps y-o-y (~330 bps q-o-q) to 31% level (V/s INSPL est=27.1%). Company’s EBITDA
grew ~59.6% y-o y (~21% q-o-q) to Rs 910 mn ( V/s INSPL est= Rs 751 mn).
Net profit grew ~93% y-o-y to Rs 644 mn in Q3FY14:
On account of improved operating leverage & higher other income (mainly linked
with higher exports incentives) Company’s net profit grew 93% y-o-y to Rs 644 mn
in Q3FY14 (V/s INSPL est= Rs 501 mn) in Q3FY14.
Company reported adj EPS of Rs 18.2 in Q3FY14 compared to Rs 9.44 in Q3FY13.
OutlookOn the back of strong growth momentum in domestic market as well as in the
exports in the last 5 years, (During FY08-13), company’s revenue has grown at 24.3%
CAGR & PAT at 38% CAGR. During the same period, benefiting from strategy of
focusing on branded formulations in domestic market, healthy ramp up in exports
business & due to healthy operating leverage, company’s EBITDA margins has
improved by ~650 bps from 16.6% in FY08 to 23.2% in FY13. We expect company’s
EBITDA margins to expand further from 23% level in FY13 to ~29% in FY15E on
account of better product mix & favorable operating leverage. We expect revenue/
net profit CAGR of 28%/60% CAGR during FY13-15E.
ValuationsSince June 2011, we had recommended buy rating on the stock at prevailing adj
market price of Rs 97 level (adjusting 1:1 split & 2:1 bonus issue). Our
recommendation was based on the continuity in robust performance and expansion
in P/E multiple to Industry level. In line with our expectations, company has
maintained robust performance & its valuations have expanded accordingly from
forward P/E multiple of 4-5x to 15x level.
At CMP of Rs 904, the stock is trading at P/E multiple of 13.3x of FY14E & 11.1x of
FY15E earnings estimates. Given continuous out-performance, capacity expansion,
entry into regulated markets & penetration in emerging markets, company’s outlook
seems robust. We believe that valuation gap is likely to narrow down further
between its closest peer of Ipca labs. We continue to maintain BUY rating on the
stock with the target price of Rs 1,032, (which translates to ~13x of FY15E).
Robust performance continues, maintain BUY with the target price of Rs 1,032
8/13/2019 635264979128106250_Ajanta Pharma_Q3FY14 Result Update
http://slidepdf.com/reader/full/635264979128106250ajanta-pharmaq3fy14-result-update 2/4
IndiaNivesh Research Ajanta Pharma Ltd|Result Update
Result Update (contd...)
January 28, 2014 | 2
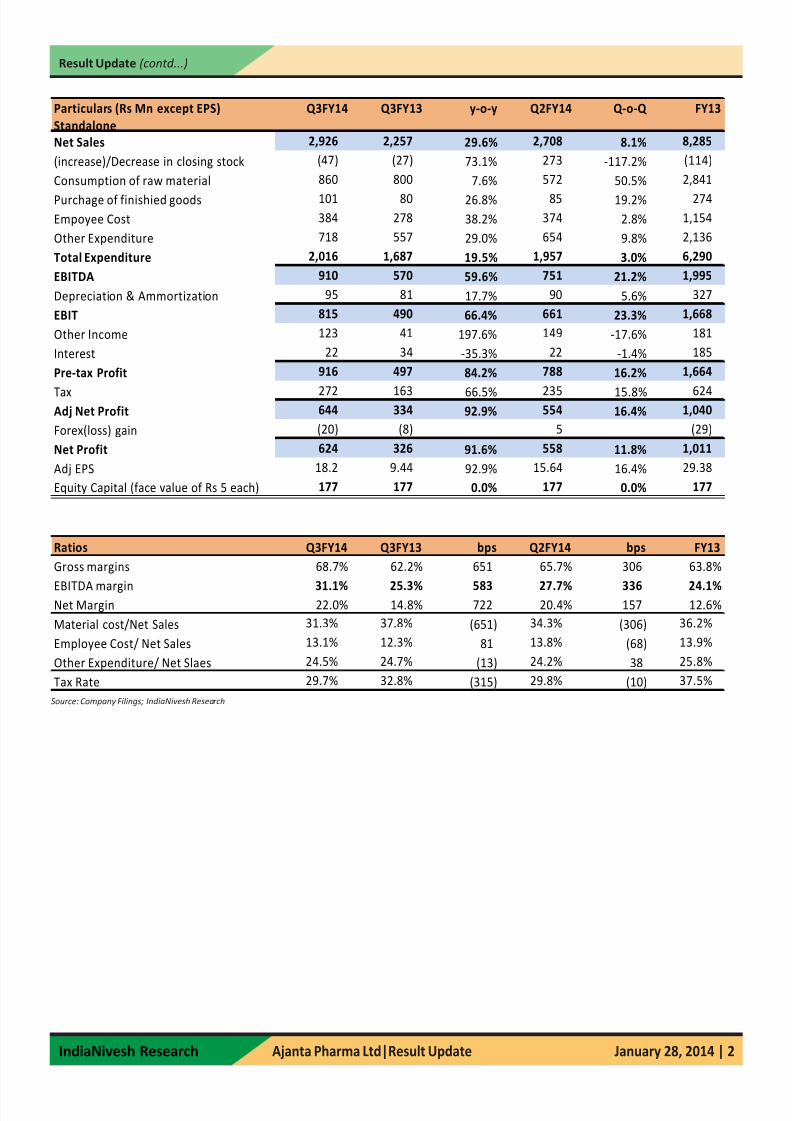
Source: Company Filings; IndiaNivesh Research
Particulars (Rs Mn except EPS)
Standalone
Q3FY14 Q3FY13 y-o-y Q2FY14 Q-o-Q FY13
Net Sales 2,926 2,257 29.6% 2,708 8.1% 8,285
(increase)/Decrease in closing stock (47) (27) 73.1% 273 -117.2% (114)
Consumption of raw material 860 800 7.6% 572 50.5% 2,841
Purchage of finishied goods 101 80 26.8% 85 19.2% 274
Empoyee Cost 384 278 38.2% 374 2.8% 1,154
Other Expenditure 718 557 29.0% 654 9.8% 2,136
Total Expenditure 2,016 1,687 19.5% 1,957 3.0% 6,290
EBITDA 910 570 59.6% 751 21.2% 1,995
Depreciation & Ammortization 95 81 17.7% 90 5.6% 327
EBIT 815 490 66.4% 661 23.3% 1,668
Other Income 123 41 197.6% 149 -17.6% 181
Interest 22 34 -35.3% 22 -1.4% 185
Pre-tax Profit 916 497 84.2% 788 16.2% 1,664
Tax 272 163 66.5% 235 15.8% 624Adj Net Profit 644 334 92.9% 554 16.4% 1,040
Forex(loss) gain (20) (8) 5 (29)
Net Profit 624 326 91.6% 558 11.8% 1,011
Adj EPS 18.2 9.44 92.9% 15.64 16.4% 29.38
Equity Capital (face value of Rs 5 each) 177 177 0.0% 177 0.0% 177
Ratios Q3FY14 Q3FY13 bps Q2FY14 bps FY13
Gross margins 68.7% 62.2% 651 65.7% 306 63.8%
EBITDA margin 31.1% 25.3% 583 27.7% 336 24.1%Net Margin 22.0% 14.8% 722 20.4% 157 12.6%
Material cost/Net Sales 31.3% 37.8% (651) 34.3% (306) 36.2%
Employee Cost/ Net Sales 13.1% 12.3% 81 13.8% (68) 13.9%
Other Expenditure/ Net Slaes 24.5% 24.7% (13) 24.2% 38 25.8%
Tax Rate 29.7% 32.8% (315) 29.8% (10) 37.5%
8/13/2019 635264979128106250_Ajanta Pharma_Q3FY14 Result Update
http://slidepdf.com/reader/full/635264979128106250ajanta-pharmaq3fy14-result-update 3/4
IndiaNivesh Research Ajanta Pharma Ltd|Result Update
Result Update (contd...)
January 28, 2014 | 3
Source: Company Filings; IndiaNivesh Research
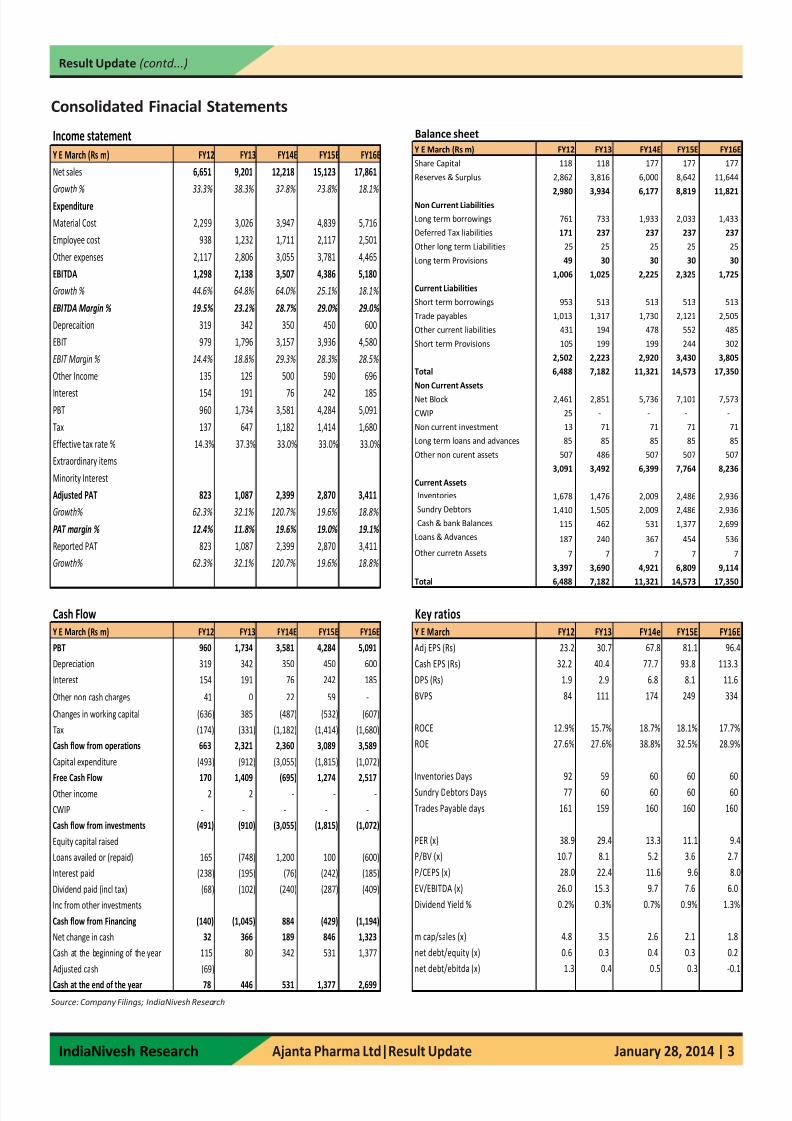
Consolidated Finacial Statements
Income statement
Y E March (Rs m) FY12 FY13 FY14E FY15E FY16E
Net sales 6,651 9,201 12,218 15,123 17,861
Growth % 33.3% 38.3% 32.8% 23.8% 18.1%
Expenditure
Material Cost 2,299 3,026 3,947 4,839 5,716
Employee cost 938 1,232 1,711 2,117 2,501
Other expenses 2,117 2,806 3,055 3,781 4,465
EBITDA 1,298 2,138 3,507 4,386 5,180
Growth % 44.6% 64.8% 64.0% 25.1% 18.1%
EBITDA Margin % 19.5% 23.2% 28.7% 29.0% 29.0%
Deprecaition 319 342 350 450 600
EBIT 979 1,796 3,157 3,936 4,580
EBIT Margin % 14.4% 18.8% 29.3% 28.3% 28.5%
Other Income 135 129 500 590 696
Interest 154 191 76 242 185
PBT 960 1,734 3,581 4,284 5,091
Tax 137 647 1,182 1,414 1,680
Effective tax rate % 14.3% 37.3% 33.0% 33.0% 33.0%
Extraordinary items
Minority Interest
Adjusted PAT 823 1,087 2,399 2,870 3,411
Growth% 62.3% 32.1% 120.7% 19.6% 18.8%
PAT margin % 12.4% 11.8% 19.6% 19.0% 19.1%
Reported PAT 823 1,087 2,399 2,870 3,411
Growth% 62.3% 32.1% 120.7% 19.6% 18.8%
Balance sheet
Y E March (Rs m) FY12 FY13 FY14E FY15E FY16E
Share Capital 118 118 177 177 177
Reserves & Surplus 2,862 3,816 6,000 8,642 11,644
2,980 3,934 6,177 8,819 11,821
Non Current Liabilities
Long term borrowings 761 733 1,933 2,033 1,433
Deferred Tax liabilities 171 237 237 237 237
Other long term Liabilities 25 25 25 25 25
Long term Provisions 49 30 30 30 30
1,006 1,025 2,225 2,325 1,725
Current Liabilities
Short term borrowings 953 513 513 513 513
Trade payables 1,013 1,317 1,730 2,121 2,505
Other current liabilities 431 194 478 552 485
Short term Provisions 105 199 199 244 302
2,502 2,223 2,920 3,430 3,805
Total 6,488 7,182 11,321 14,573 17,350
Non Current Assets
Net Block 2,461 2,851 5,736 7,101 7,573
CWIP 25 - - - -
Non current investment 13 71 71 71 71
Long term loans and advances 85 85 85 85 85
Other non curent assets 507 486 507 507 507
3,091 3,492 6,399 7,764 8,236
Current Assets
Inventories 1,678 1,476 2,009 2,486 2,936
Sundry Debtors 1,410 1,505 2,009 2,486 2,936
Cash & bank Balances 115 462 531 1,377 2,699
Loans & Advances 187 240 367 454 536
Other curretn Assets 7 7 7 7 7
3,397 3,690 4,921 6,809 9,114
Total 6,488 7,182 11,321 14,573 17,350
Cash Flow
Y E March (Rs m) FY12 FY13 FY14E FY15E FY16E
PBT 960 1,734 3,581 4,284 5,091
Depreciation 319 342 350 450 600
Interest 154 191 76 242 185
Other non cash charges 41 0 22 59 -
Changes in working capital (636) 385 (487) (532) (607)
Tax (174) (331) (1,182) (1,414) (1,680)
Cash flow from operations 663 2,321 2,360 3,089 3,589
Capital expenditure (493) (912) (3,055) (1,815) (1,072)
Free Cash Flow 170 1,409 (695) 1,274 2,517
Other income 2 2 - - -
CWIP - - - - -
Cash flow from investments (491) (910) (3,055) (1,815) (1,072)
Equity capital raised
Loans availed or (repaid) 165 (748) 1,200 100 (600)
Interest paid (238) (195) (76) (242) (185)
Dividend paid (incl tax) (68) (102) (240) (287) (409)
Inc from other investments
Cash flow from Financing (140) (1,045) 884 (429) (1,194)
Net change in cash 32 366 189 846 1,323
Cash at the beginning of the year 115 80 342 531 1,377
Adjusted cash (69)
Cash at the end of the year 78 446 531 1,377 2,699
Key ratios
Y E March FY12 FY13 FY14e FY15E FY16E
Adj EPS (Rs) 23.2 30.7 67.8 81.1 96.4
Cash EPS (Rs) 32.2 40.4 77.7 93.8 113.3
DPS (Rs) 1.9 2.9 6.8 8.1 11.6
BVPS 84 111 174 249 334
ROCE 12.9% 15.7% 18.7% 18.1% 17.7%
ROE 27.6% 27.6% 38.8% 32.5% 28.9%
Inventories Days 92 59 60 60 60
Sundry Debtors Days 77 60 60 60 60
Trades Payable days 161 159 160 160 160
PER (x) 38.9 29.4 13.3 11.1 9.4
P/BV (x) 10.7 8.1 5.2 3.6 2.7
P/CEPS (x) 28.0 22.4 11.6 9.6 8.0
EV/EBITDA (x) 26.0 15.3 9.7 7.6 6.0
Dividend Yield % 0.2% 0.3% 0.7% 0.9% 1.3%
m cap/sales (x) 4.8 3.5 2.6 2.1 1.8
net debt/equity (x) 0.6 0.3 0.4 0.3 0.2
net debt/ebitda (x) 1.3 0.4 0.5 0.3 -0.1
8/13/2019 635264979128106250_Ajanta Pharma_Q3FY14 Result Update
http://slidepdf.com/reader/full/635264979128106250ajanta-pharmaq3fy14-result-update 4/4


![Result Update Presentation [Company Update]](https://img.pdfslide.us/doc/110x75/577ca5841a28abea748b9163/result-update-presentation-company-update.jpg)


![Revised Result Press Release [Company Update]](https://img.pdfslide.us/doc/110x75/577c7e171a28abe054a084a7/revised-result-press-release-company-update.jpg)
![Result update presentation Q2 FY16 [Company Update]](https://img.pdfslide.us/doc/110x75/577ca7c81a28abea748c8e41/result-update-presentation-q2-fy16-company-update.jpg)
![Presentation on Financial Result [Company Update]](https://img.pdfslide.us/doc/110x75/577c98481a28ab163a8b50a4/presentation-on-financial-result-company-update.jpg)
![Financial Result Updates [Company Update]](https://img.pdfslide.us/doc/110x75/577c78191a28abe0548eb963/financial-result-updates-company-update.jpg)

![Result Update Presentation Q1 FY 16 [Company Update]](https://img.pdfslide.us/doc/110x75/577cb2961a28aba7118c175a/result-update-presentation-q1-fy-16-company-update.jpg)