Embed Size (px)
Citation preview
8/6/2019 Indusind Bank Q1FY12 Result Update
http://slidepdf.com/reader/full/indusind-bank-q1fy12-result-update 1/3
Wealth Research, Unicon Financial Intermediaries. Pvt Ltd.
Email: [email protected]
ONG TERM INVESTMENT CALL
Accumulate9 July 2011
Company Report | Q1FY12 Result Update
Q1FY12 Result Highlights
Indusind Bank (IIB) net profit grew by 52% YoY to INR 1802 Mnmainly driven by robust core fee income growth of 44% YoY. The
proportion of core fee income increased due to increase in its third
party products, trade and remittances, foreign exchange and
Investment banking income. IIB’s net interest income has grown by
32% to INR 3900 Mn as compared to INR 2957 Mn in Q1FY11 & other
income increased by 34% YoY to INR 2154 Mn.
Advances grew 31.3% YoY to INR 283.8 Bn & deposits grew by 28.7%
to INR 352.6 Bn. This was stronger than the industry’s growth rate of
~20% & ~17% respectively. Improvement in deposit mix along with
branch expansion (326 from 224 branches) led to higher CASA ratio of
28.2% in Q1FY12 (24.3% in Q1FY11). Reported NIM improved 9 bps
YoY to 3.41%, however, on sequential basis it declined 9 bps due to
sharp rise in the cost of deposits (68 bps QoQ) while yield on
advances increased by 68 bps.
IIB continued to improve its asset quality and has brought down the
net NPA level to 0.3% in Q1FY12 from 0.38% in Q1FY11. Gross NPA
ratio fell to 1.08% in Q1FY12 from 1.26% in Q1FY11, but it increasedsequentially by 7 bps and 2 bps. The NPA coverage ratio rose 288 bps
YoY to 72.9%. Also the IIB maintained a healthy capital adequacy
ratio (CAR) of 14.99% in Q1FY12 as against 13.71% in Q1FY11. The
strong traction in CAR is likely to sustain IIB’s growth momentum in
coming quarters.
Outlook & Valuation
Going forward IIB in next 3 years is planning to keep NIMs above
3.5% along with healthy bottom-line, this would be possible through
1. scaling up CASA ratio to 35% with 200 bps to 300 bps improvement
every year. 2. Bank plans to take the branch network to 550 by Mar
’13. 3. Bank is expected to expand its product suite and services to
achieve higher business growth. At the CMP, stock trades at 3x FY12E
BV, we have Accumulate rating on the stock with target price of INR
320.
Industry Banking
CMP (INR) 287Target (INR) 320
52 week High/Low (INR) 292/200
Market Cap (INR BN) 133571
3M Avg. Daily Volumes 665280
P/BV FY12E 3x
Shareholding Pattern (%)
Promoters
20%
Institutions
42%
Others
14%Non-
institutions
24%
Stock Performance
150
200
250
300
350
400
J u l
S e p
N o v
J a n
M a r
M a y
J u l
IIB NSE Nifty
Performance (%)
1 Month 3 Months 1 Year
IIB 9.4% 5.7% 31.4%
NIFTY 2.5% -2.2% 5.8%* Source: Ace, Unicon Research
(INR in mn)
Particulars Actual Estimates
NII 3900 4137
Operating Profit 3117 3282
PAT 1802 1853* Source: Company, Unicon Research
AnalystShweta Rane | [email protected]
8/6/2019 Indusind Bank Q1FY12 Result Update
http://slidepdf.com/reader/full/indusind-bank-q1fy12-result-update 2/3
Wealth Research, Unicon Financial Intermediaries. Pvt Ltd.
Email: [email protected]
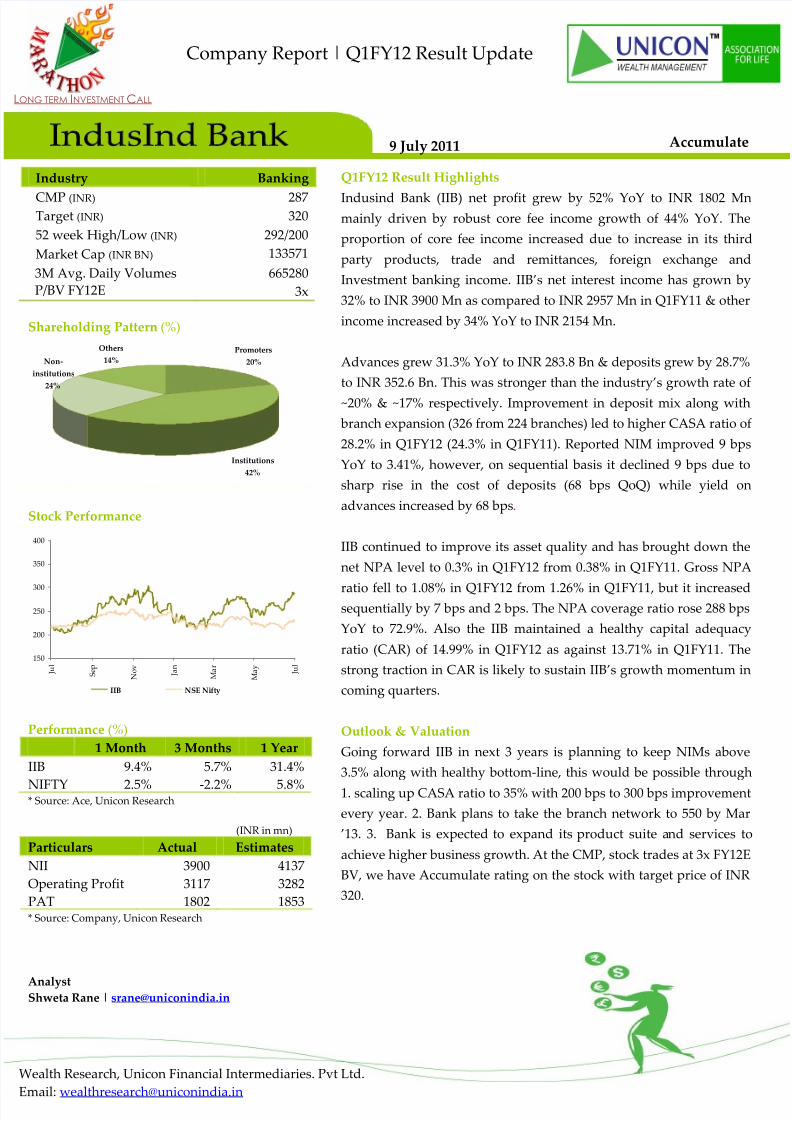
Financials(INR in mn)
Q1 FY12 Q1 FY11 Y-o-Y Q4 FY11 Q-o-Q
Interest income 11646 7715 50.94 10488 11.04
Interest expense 7746 4759 62.77 6608 17.22
Net Interest Income 3900 2957 31.90 3881 0.50
Other Income 2154 1610 33.82 1816 18.59
Total Operating income 6054 4566 32.58 5697 6.27
Operating expenditure 2937 2260 29.93 2717 8.10
Operating Profit 3117 2306 35.17 2980 4.59
Operating Profit (%) 26.77 29.89 -312 bps 28.42 -164 bps
Provisions 446 487 -8.51 403 10.78
PBT 2671 1819 46.87 2578 3.61Tax 870 633 37.32 860 1.08
PAT 1802 1186 51.97 1718 4.88
EPS (INR.) 4662 4111 13.40 4660 0.04
NIMs 3.41 3.32 9 bps 3.5 -8 bpsSource: Company, Unicon Research *Standalone
8/6/2019 Indusind Bank Q1FY12 Result Update
http://slidepdf.com/reader/full/indusind-bank-q1fy12-result-update 3/3
Wealth Research, Unicon Financial Intermediaries. Pvt Ltd.
Email: [email protected]
Unicon Investment Ranking Methodology
Rating Buy Accumulate Hold Reduce Sell
Return Range >= 20% 10% to 20% -10% to 10% -10% to -20% <= -20%
Disclaimer
This document has been issued by Unicon Financial Intermediaries Pvt. Ltd. (“UNICON”) for the information of its customers only. UNICON is governed by
the Securities and Exchange Board of India. This document is not for public distribution and has been furnished to you solely for your information and must
not be reproduced or redistributed to any other person. Persons into whose possession this document may come are required to observe these restrictions. The
information and opinions contained herein have been compiled or arrived at based upon information obtained in good faith from public sources believed tobe reliable. Such information has not been independently verified and no guarantee, representation or warranty, express or implied is made as to its accuracy,
completeness or correctness. All such information and opinions are subject to change without notice. This document has been produced independently of any
company or companies mentioned herein, and forward looking statements; opinions and expectations contained herein are subject to change without notice.
This document is for information purposes only and is provided on an “as is” basis. Descriptions of any company or companies or their securities mentioned
herein are not intended to be complete and this document is not, and should not be construed as an offer, or solicitation of an offer, to buy or sell or subscribe
to any securities or other financial instruments. We are not soliciting any action based on this document. UNICON, its associate and group companies its
directors or employees do not take any responsibility, financial or otherwise, of the losses or the damages sustained due to the investments made or any action
taken on basis of this document, including but not restricted to, fluctuation in the prices of the shares and bonds, reduction in the dividend or income, etc. This
document is not directed to or intended for display, downloading, printing, reproducing or for distribution to or use by any person or entity who is a citizen
or resident or located in any locality, state, country or other jurisdiction where such distribution, publication, reproduction, availability or use would be
contrary to law or regulation or would subject UNICON or its associates or group companies to any registration or licensing requirement within such
jurisdiction. If this document is inadvertently sent or has reached any individual in such country, the same may be ignored and brought to the attention of the
sender. This document may not be reproduced, distributed or published for any purpose without prior written approval of UNICON. This document is for
the general information and does not take into account the particular investment objectives, financial situation or needs of any individual customer, and itdoes not constitute a personalised recommendation of any particular security or investment strategy. Before acting on any advice or recommendation in this
document, a customer should consider whether i t is suitable given the customer’s particular circumstances and, if necessary, seek professional advice. Certain
transactions, including those involving futures, options, and high yield securities, give rise to substantial risk and are not suitable for all investors. UNICON,
its associates or group companies do not represent or endorse the accuracy or reliability of any of the information or content of the document and reliance
upon it is at your own risk.
UNICON, its associates or group companies, expressly disclaims any and all warranties, express or implied, including without limitation warranties of
merchantability and fitness for a particular purpose with respect to the document and any information in it. UNICON, its associates or group companies, shall
not be liable for any direct, indirect, incidental, punitive or consequential damages of any kind with respect to the document. No part of this publication may
be reproduced, stored in a retrieval system, or transmitted, on any form or by any means, electronic, mechanical, photocopying, recording, or otherwise,
without the prior written permission of Unicon Financial Intermediaries Pvt. Ltd.
Address:
Wealth ManagementUnicon Financial Intermediaries. Pvt. Ltd.
VILCO Center, 2nd Floor,
8 Subhash Road, Vile Parle (E)
Mumbai 400 057Ph: 022-3390 1234
Email: [email protected]
Visit us at www.unicon.in