Embed Size (px)
DESCRIPTION
2010 Weinland Park Evaluation Project
Citation preview

Weinland Park Evaluation Project Tamar M. Forrest, Ph.D. and Howard Goldstein, Ph.D., Schoenbaum Family Center • Funded by The Columbus Foundation
Data Collected: February‐August 2010 • Report Version: December 2, 2010

Acknowledgements
We wish to express our appreciation and gratitude to the following people whose help have made this research possible: We gratefully acknowledge grant support from The Columbus Foundation. We would like to thank the Poverty Solutions Collaborative for their input into the development of the Weinland Park Survey, in particular to the interdisciplinary group of researchers that provided feedback from their diverse fields of interest. We would like to thank the Weinland Park Evaluation Research Team: Weslie Coleman, Catherine Girves, Christina Harris, Julius Jefferson, Kristen Nelson, Sam Saldivar, Clarence Thompson, Michael Webb, and Brett Zehner. Their unique backgrounds and cultural sensitivity put participants at ease and led to the high quality of data received during the research process. Finally, our deepest debts are to all of the residents of Weinland Park who participated in interviews and were willing to provide their stories, without which this research would not have been possible.

Table of Contents
Executive Summary I‐V
Demographics 1‐3
Education 4‐5
Economic Well‐being 6‐13
Workforce Development 14‐15
Religion 16‐17
Housing and Mobility 18‐24
Neighborhood Identification/Interaction 25‐27
Personal Interests/Community Involvement 28‐30
Public Safety 31‐36
Access to Basic Needs 37‐38
Use of Computers and Media 39‐43
Health 44‐50
Children and Child Development 51‐60
Neighborhood Feedback 61‐69
Needs Assessment 70‐71

I
Executive Summary The Weinland Park Evaluation survey was created in response to a need for comprehensive baseline data that would set the foundation for tracking changes in the neighborhood overtime, and a needs assessment of residents to be used to guide program development.
A geographically stratified random sampling technique was used to recruit participants, and a $20 Kroger gift card was used as an incentive to participate. The boundaries of the neighborhood included High Street on the West, the CSX Railroad Tracks/Grant on the East, Chittenden Ave‐nue on the North, and Fifth Avenue on the South. Sampling was accomplished by visiting every third house or housing unit and continuing to recycle through parts of the neighborhood until a 25% threshold was reached.
The survey was conducted in an interview format. Two surveyors (from a diverse team of 9) met each respondent at a location of their choice, typically the respondent’s home. The interview included ~150 questions and took 45‐90 minutes to complete, and covered the following top‐ics: 1) Demographics, 2) Housing and Mobility, 3) Access to Basic Needs, 4) Neighbor Interaction, 5) Personal Interests and Community Involve‐ment, 6) Public Safety, 7) Workforce Development, 8) Education and Child Development, 9) Use of Computers and Media, 10) Economic Well‐Being, 11) Health, 12) Feedback about the Neighborhood, and 13) Needs Assessment. Upon completion of the needs assessment, residents were asked if they would like information about specific resources in the area. A Weinland Park resource list was created for this purpose. A member of the evaluation team, currently a graduate student of social work, followed up with residents of great need, and helped them over‐come obstacles to receiving services. A total of 441 Weinland Park residents were interviewed, a sample representing 26% of Weinland Park households. A total of 217 residents declined to be interviewed. The number of vacant housing units was found to total 313 (16%). Because numbers reported in results (noted in parenthesis throughout the report) represent about ¼ of the total households, percentages are the main focus to aid in interpreting findings. The following pages include key conclusions by topic that have resulted from the analysis of this survey data.

II
Demographics
When compared to the city of Columbus, overall, Weinland Park’s population is younger, with 45% of respondents between 18 and 30 years of age. Those who are married are a minority (only 11%), and single women with children make up 17% of respondents. Despite the low rates of marriage, 34% of households contain children, with 50% of children under the age of 5. A great majority (91%) of Weinland Park respondents are renters, many unable to meet minimum requirements needed to own or rent‐to‐own a home (23% of respondents reported they did not pay rent, and the average monthly payment was $361). 36% of the population is unem‐ployed, and only 18% have full‐time jobs. “Stable” work environments are not the norm, with 67% of those who work reporting inconsistent work schedules. Many Weinland Park residents require public assistance, with 49% receiving food stamps and 30% living in section 8 housing. Some residents are on the brink of homelessness, with 9% reporting they have been homeless over the last year, and 13% reporting individuals staying with them in their household for four nights per week or more as a guest. African Americans make up 50% of respondents, and are more concentrated in the eastern half of Weinland Park. Disparities in education are apparent, with African American respondents much less likely to have obtained High School or higher degrees when compared to their white counterparts. There is also a small, but concentrated (southwest), Latino population in Weinland Park (5%) with significant language, legal, and employment barriers. Students are a large subgroup of the Weinland Park population, with 18% attending OSU, and another 17% (many “non‐traditional” students) attending other local schools such as Columbus State and Franklin University.
Barriers to Employment and Workforce Development
The number one barrier to employment reported by respondents is health (22%) ‐‐ this includes having a disability, mental illness, an injury, a pregnancy, or a child with an illness. Other commonly mentioned barriers are transportation barriers (not having a car/license) (19%), the "bad economy" (no jobs available) (18%), and a criminal history (15%). Education (no high school diploma) (10%) and lack of childcare (7%) are also significant barriers. 30% of respondents have attended a workforce development program (28% of these respondents at Godman Guild), most (63%) over the last 3 years. 14% of those who have attended such a program report having a full‐time job, and 42% are unemployed. The characteristics of those who have attended programs are different from those of the larger Weinland Park population. They are more likely to be female (65%), African American (72%), have children residing in their home (56%), have a high school degree or less (82%), or to have been homeless over the last year (12%).

III
Housing and Mobility
67% of respondents report living in Weinland Park for 5 years or less, and 11% for 20 years or more. While 71% of respondents report their housing is in good condition or needs minor repairs, only 26% want to live in Weinland Park over the next 5 years, suggesting that factors out‐side of actual housing conditions (e.g., poverty, crime) are attributable to high mobility rates. When asked more specifically about buying a home in Weinland Park, responses are more positive, with 39% of renters reporting they would consider buying home in Weinland Park, and 49% of home owners reporting they would consider buying again. Survey responses indicate that there are around 500 section 8 units in Weinland Park, with CPO project units making up 343 of these units, and the remaining 157 being voucher based units (possibly more vulnerable to displacement if housing prices and rents increase).
Neighborhood Identification and Engagement
Most respondents (87%) do not identify as living in Weinland Park, but call the neighborhood they live in “The Short North,” “The Short,” “The Campus Area,” “South Campus,” or “The Gateway.” With regard to resident interaction, the most common interactions (36%) with neighbors are more superficial in nature (e.g., a “hello” from the porch), while more significant interactions include sharing meals, sitting on the porch together, or helping a neighbor with a "problem." Respondents report interests or volunteer experiences around helping those in need through providing or cooking meals, activities with children, sports, reading or writing, and music or dance. Survey responses indicated that Kroger’s (95% grocery shop here) and the Northside Library (51% attend on a regular basis) might be viable locations for resident engagement. One, or even a few, churches do not dominate with regard to resident attendance. Respondents attend over 150 churches in the Columbus metropolitan area.
Public Safety
Safety issues are a major concern for respondents, particularly in the evening hours; and when traveling in the eastern part of the neighbor‐hood, near corner stores; or when passing/being “hassled” by those loitering (e.g., “young, rowdy people”). 43% of respondents report that they or someone close to them has been affected by (were a victim of, witnessed, or affected by) gun violence. And, among other things, they report that they or someone close to them has been affected by home burglaries (42%), automobile break‐ins (37%), or domestic violence (33%). Trust of police varies by race and age, with older, white respondents instilling more trust in officers than younger, African American re‐spondents.

IV
Access to Basic Needs
Most respondents grocery shop in Weinland Park or bordering neighborhoods (95% at Kroger’s, 24% at Giant Eagle, 21% at Aldi), but are more likely to leave the neighborhood to shop for non‐food items (e.g., to Walmart, Target, or AJ Wright).
Use of Computers and Media
Respondents report high rates of literacy (99%) and reading levels, with 81% reading everyday. An overwhelming majority (92%) also report reading to their children under 11 years of age, most (62%) report reading to their child everyday. Library access is high, with 80% of respon‐dents going to the library, and 45% of these respondents visiting at least once a week. Respondents also report high computer literacy and access, with 85% of respondents knowing how to use a computer, and 67% having a home computer. 78% of these respondents also report having internet access at home.
Health
Survey responses indicate high levels of health problems among Weinland Park residents. 50% of households contain an individual(s) that has been diagnosed with one or more of these conditions: Asthma, Diabetes, High Blood Pressure, Heart Disease, Obesity. Mental issues are re‐ported often, with 38% of households containing an individual(s) that has been diagnosed with one or more of these conditions: Depression, Anxiety Disorder, Bipolar Disorder, Schizophrenia. 20% of households with children have a child with a developmental or behavioral disability, and 13% of households with children have a child with significant limitations that prevent full participation with peers. With regard to treat‐ment, 60% of households contain an individual who has sought treatment in the emergency room over the last year. The average number of visits was 5 (the median was 2, the mode was 1). Overall, Weinland Park respondents who have access to healthcare (58%) are satisfied with their treatment (mean score = 8, median score =9, mode score = 10). 66% of respondents drink alcohol. On average, the maximum number of drinks respondents have had on any given occasion during the past month averaged 7 (the mode was more than 12). 53% of respondents report smoking cigarettes, smoking cigars, or chewing tobacco. Respondents report that recreational drug use is a moderate to major problem for residents in Weinland Park (mean score = 7, median score =8, mode score = 10), a theme that was reiterated throughout different sections of the survey (Health, Public Safety, and Neighborhood Feed‐back), with respondents suggesting a need for increased police enforcement around drug use/dealing or AOD (alcohol and other Drugs) treat‐ment programs.

V
Children and Child Development
Weinland Park children attend schools throughout the Columbus metropolitan area, with 194 children of respondents attending 60 different pre‐, elementary, middle, and high schools. When deciding where to send their children to school, parent respondents note the most impor‐tant factors they consider are the quality of teachers/teaching, safety, the types of curriculum/variety of classes, location, and services offered (e.g., special needs programming, daycare, arts programming, college preparatory programming). 43% of parents have minimal interaction (a few times per year or never) with schools, and 80% are overwhelmingly satisfied with the schools their children are attending. Over half (53%) of children are not involved in extracurricular activities, with the biggest barriers to participation being that children are too young (or there are no programs for young children), lack of time, financial barriers, or transportation barriers.
Neighborhood Feedback
Overall, respondents are slightly satisfied with Weinland Park as a place to live, though a majority of respondents who have lived in Weinland Park for two years or more feel that conditions have improved. Although a great majority report not being involved in community organizing around new developments or neighborhood issues (75%), a majority (79%) note they would be interested if the opportunity arose. Respon‐dents want to see improvements around trash pick‐up, litter, and safety. They report that police and city services need improvement, and that vacant housing should be addressed. Many respondents also feel programming that provides more creative activities and outlets for children are needed and, from a safety perspective, feel unsupervised youth are a major problem.
Needs Assessment
The needs of Weinland Park residents are great, with the top needs of respondents being in the areas of economic development (employment that pays more than a minimum wage, entrepreneur development), health (access to insurance, dental, and vision care), basic needs (transportation, affordable housing), and social services (counseling).

Weinland Park Survey: Schoenbaum Family Center Demographics
Our survey included 440 adults between the ages of 18 and 79, 45% males and 55% females.
This sample represents 26% of the households in Weinland Park.
15 10 5 0 5 10 15 20
18‐1920‐2425‐2930‐3435‐3940‐4445‐4950‐5455‐5960‐6465‐6970‐74
Percent
Age
Weinland Park: Survey Sample, 2010
% Female
% Male
Race/Ethnicity
Our survey included 440 adults between the ages of 18 and 79, 45% males and 55% females.
This sample represents 26% of the households in Weinland Park.
15 10 5 0 5 10 15 20
18‐1920‐2425‐2930‐3435‐3940‐4445‐4950‐5455‐5960‐6465‐6970‐74
Percent
Age
Weinland Park: Survey Sample, 2010
% Female
% Male
Respondents identified themselves as 50% African American, 36% Caucasian, and 5% Hispanic/Latino (over half of whom reported Mexican heritage).
0 10 20 30 40 50 60
African American
Caucasian
Mixed Race (variety)
Hispanic/Latino
Asian
Other (Middle Eastern, Somali)
American Indian
219
158
24
20
6
5
2
Percent
Race/Ethnicity
1

Weinland Park Survey: Schoenbaum Family Center Demographics
42% of respondents were born in Columbus, 25% elsewhere in Ohio, 26% in other states, and 7% were foreign‐born (50% born in Mexico).
18342%
11125%
11226%
327%
Place of Birth
Columbus
Ohio, not Columbus
US, not Ohio
Outside of the US
Relationship Status
42% of respondents were born in Columbus, 25% elsewhere in Ohio, 26% in other states, and 7% were foreign‐born (50% born in Mexico).
A majority (58%) of respondents were single, never married; 14% were cohabitating; 11% were married; and 9% were divorced. The remainder were separated or widowed.
The average length for those married was 10 years, and those cohabitating averaged 5 years.
18342%
11125%
11226%
327%
Place of Birth
Columbus
Ohio, not Columbus
US, not Ohio
Outside of the US
0 10 20 30 40 50 60
Single, never Married
Cohabitating
Married
Divorced
Separated
Widowed
254
63
47
41
27
7
Percent
Relationship Status
2

Weinland Park Survey: Schoenbaum Family Center Demographics
Children56% of our sample had children (not necessarlly residing with them).
46% of single adults had children, 63% of those cohabitating had children, and 68% of those married had children.
0 20 40 60 80
Single, never married
Cohabitating
Married
Separated
Divorced
Widowed
117
39
32
21
34
5
137
23
15
6
7
2
Percent
Child Status
No Children
Have Children
3
Weinland Park Survey: Schoenbaum Family Center Education
0 10 20 30 40 50 60
<High School DegreeHigh School Diploma/GEDCollege Credit, no degree
Associate's DegreeBachelor's Degre
Master's credit, no degreeMaster's Degree
Credit towards a Professional DegreeProfessional Degree
Doctoral credit, no degreeDoctoral Degree
10089
15921
3899
2153
Percent
Educational Attainment23% of respondents had less than a high school degree; 20% had received their High School Diploma/GED.
36% of respondents had attained some college credit, but did not have a degree, 9% had a Bachelor's degree; and 7% had credit, or a degree beyond their Bachelor's degree.
Educational Attainment by Race
0 10 20 30 40 50 60
<High School DegreeHigh School Diploma/GEDCollege Credit, no degree
Associate's DegreeBachelor's Degre
Master's credit, no degreeMaster's Degree
Credit towards a Professional DegreeProfessional Degree
Doctoral credit, no degreeDoctoral Degree
10089
15921
3899
2153
Percent
Educational Attainment23% of respondents had less than a high school degree; 20% had received their High School Diploma/GED.
36% of respondents had attained some college credit, but did not have a degree, 9% had a Bachelor's degree; and 7% had credit, or a degree beyond their Bachelor's degree.
African American respondents were lesslikely to have obtained High School or higher degrees when compared to their white counterparts. 35% of black respondents had less than a High School degree, compared with only 3% of white respondents. Furthermore, 29% of white respondents had a Bachelor's degree or higher, compared with only 4% of black respondents.
5
23
72
11
46
78
50
71
10
9
0 20 40 60
<High School
GED/HS Diploma
College credit, no degree
Associate's Degree
Bachelor's Degree or higher
Percent
Educational Attainment by Race
Black
White
4

Weinland Park Survey: Schoenbaum Family Center Education
35% of adult respondents were currently students.
18% were enrolled at OSU, 7% at Columbus State, and 6% in a variety of technical school programs. Additionally, 1% were enrolled at Franklin University, and 1% at a four year institution outside of OSU.
3% were enrolled in a High School or a GED program (5 individuals noted being enrolled at Godman Guild).
0 10 20 30 40 50 60
OSU
Columbus State
Technical School (not Franklin or CSCC)
High School/GED
Franklin University
4 Year College, not OSU
78
31
24
13
5
3
Percent
Schools of Attendance
5

Weinland Park Survey: Schoenbaum Family Center Economic Well‐being
Only 18% of respondents had full‐time employment.26% worked part‐time, and 36% were unemployed.
The employment pattern of the current student population was slightly different ‐‐ 12% employed full‐time, 39% employed part‐time, and 44% unemployed.
Of those employed over the last 2 years, 43% worked within the same job, 31% had two different jobs , and 26% had over 3 jobs over the last two years.
Those who worked part‐time averaged 23 hours/week.
Of those employed full or part‐time, 67% reported that their hours varied. Only 33% reported their hours were the same every week.
The average hourly wage was $13. The median hourly wage was $10.
Student Employment Status
0 10 20 30 40 50 60
Unemployed
Employed part‐time
Employed full‐time
Receiving Disability
Retired
Homemaker
158
112
80
66
12
12
Percent
Employment StatusOnly 18% of respondents had full‐time employment.26% worked part‐time, and 36% were unemployed.
The employment pattern of the current student population was slightly different ‐‐ 12% employed full‐time, 39% employed part‐time, and 44% unemployed.
Of those employed over the last 2 years, 43% worked within the same job, 31% had two different jobs , and 26% had over 3 jobs over the last two years.
0 20 40 60
1
2
3
4
5 or more
149
108
51
19
17
Percent
How many different jobs have you had in the past two years?
Those who worked part‐time averaged 23 hours/week.
Of those employed full or part‐time, 67% reported that their hours varied. Only 33% reported their hours were the same every week.
The average hourly wage was $13. The median hourly wage was $10.
0 10 20 30 40 50 60
Unemployed
Employed part‐time
Employed full‐time
Receiving Disability
Retired
68
60
18
7
2
Percent
Student Employment Status
0 10 20 30 40 50 60
Unemployed
Employed part‐time
Employed full‐time
Receiving Disability
Retired
Homemaker
158
112
80
66
12
12
Percent
Employment Status
6

Weinland Park Survey: Schoenbaum Family Center Economic Well‐being
Office/Administrative SupportIT/Web Development/Graphic Design/Engineer
Customer ServicePackage Handler
Driver/ValetWarehouse/Production
SecurityAuto Technician
LifeguardWaste Management
Other
7644433222
20
Employment: Types of Jobs
Employed respondents worked within a variety of different fields, with Food Services (21%), Healthcare (9%), Custodial (7%), Education/Childcare (7%), Retail Sales (7%), and Construction (6%) being the top fields of employment.
0 10 20 30 40 50 60
Food Services/BartenderHealthcare
Custodial/CleaningEducation/Childcare
SalesConstruction/Rehab
GRA/GTA/Fellowhip/InternResearch
Office/Administrative SupportIT/Web Development/Graphic Design/Engineer
Customer ServicePackage Handler
Driver/ValetWarehouse/Production
SecurityAuto Technician
LifeguardWaste Management
Other
4118
141414121097644433222
20
Percent
Employment: Types of Jobs
Employed respondents worked within a variety of different fields, with Food Services (21%), Healthcare (9%), Custodial (7%), Education/Childcare (7%), Retail Sales (7%), and Construction (6%) being the top fields of employment.
7

Weinland Park Survey: Schoenbaum Family Center Economic Well‐being
28% of jobs were located in the 43201 zip code area. 27% were located in the downtown area (43210 or 43215 zip code areas).
The most common job locations outside of the immediate Weinland Park/downtown area were the 43219 (Easton) (5%) and 43212 (Grandview) (5%) zip code areas.
8
28% of jobs were located in the 43201 zip code area. 27% were located in the downtown area (43210 or 43215 zip code areas).
The most common job locations outside of the immediate Weinland Park/downtown area were the 43219 (Easton) (5%) and 43212 (Grandview) (5%) zip code areas.
8

Weinland Park Survey: Schoenbaum Family Center Economic Well‐being
44% of employed individuals drove their own car to work. 23% walked, 15% took the bus, 7% biked, and 6% got a ride.
The average commute time reported was 19 minutes, the median commute time was 15 minutes.
0 10 20 30 40 50 60
Drive own car
Walk
Bus
Bike
Get a ride
N/A, work from home
Drive company car
85
44
29
14
11
10
1
Percent
How do you usually get to work?44% of employed individuals drove their own car to work. 23% walked, 15% took the bus, 7% biked, and 6% got a ride.
The average commute time reported was 19 minutes, the median commute time was 15 minutes.
0 10 20 30 40 50 60
Drive own car
Walk
Bus
Bike
Get a ride
N/A, work from home
Drive company car
85
44
29
14
11
10
1
Percent
How do you usually get to work?
49% of respondents received food stamps. 30% lived in Section 8 housing. Additionally, 6% received TANF, 5% received Title 20, and 2% received unemployment benefits.
*It is possible some respondents have exhausted TANF benefits, as a TANF recipient may not receive TANF benefits for more than 60 months (five years).
0 10 20 30 40 50 60
Food Stamps
Section 8
TANF
Title 20
Unemployment
216
130
28
23
7
Percent
Public Assistance
9
Weinland Park Survey: Schoenbaum Family Center Economic Well‐being
Job Satisfaction
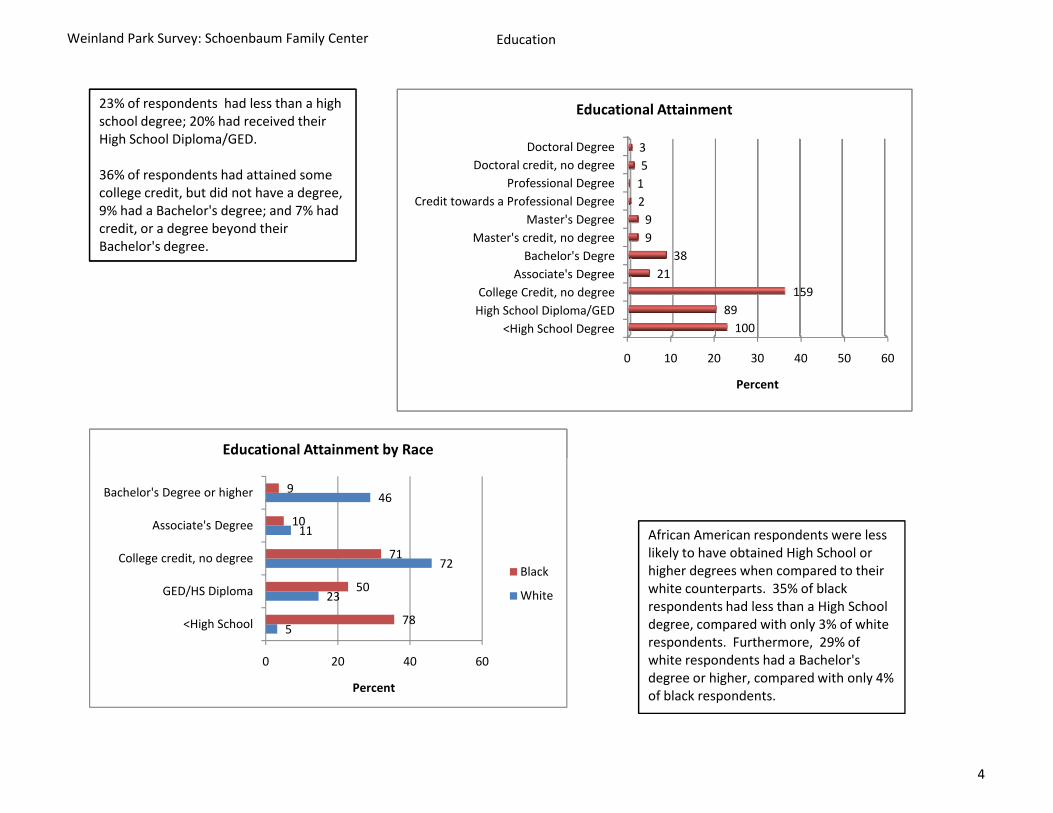
Of those employed, 80% (153) reported being satisfied with their job. Those not satisfied attributed low satisfaction levels to: 1) the type of job (not a career, not what was trained for, not satisfying), 2) low pay, 3) conflict with co‐workers, management, or customers 4) hours (not enough or overworked), 5) conditions (harassment, racism, lack of benefits, non‐union), 6) stress, 7) generally not wanting to work or not liking anything about their job, and 8) lack of opportunities for growth.
50% (218) of respondents were looking for a job or a different job. Those looking for work, on average, had been looking for 7 months (the median was 3 months).
High stress
Generally unsatisfied
No opportunities for growth
4
4
1
Reasons for Being Unsatisfied
Job Satisfaction
Of those employed, 80% (153) reported being satisfied with their job. Those not satisfied attributed low satisfaction levels to: 1) the type of job (not a career, not what was trained for, not satisfying), 2) low pay, 3) conflict with co‐workers, management, or customers 4) hours (not enough or overworked), 5) conditions (harassment, racism, lack of benefits, non‐union), 6) stress, 7) generally not wanting to work or not liking anything about their job, and 8) lack of opportunities for growth.
50% (218) of respondents were looking for a job or a different job. Those looking for work, on average, had been looking for 7 months (the median was 3 months).
Type of job
Low wage
Conflict
Too many or too few hours
Poor working conditions
High stress
Generally unsatisfied
No opportunities for growth
0 10 20 30 40 50 60
7
6
5
5
5
4
4
1
Percent
Reasons for Being Unsatisfied
10
Weinland Park Survey: Schoenbaum Family Center Economic Well‐being
Sales
Customer Service
Education/Training/Library
Personal Care/Service
Arts/Design/Entertainment/Sports
Community/Social Services
Computer/Mathematical
Installation/Maintenance/Reapair
Life/Physical/Social Sciences
Architecture/Engineering
Building Grounds
Legal
Protective Services
Auto Technician
Research
17
14
12
11
9
8
6
4
4
3
3
2
2
1
1
Employment: Type Job Looking For
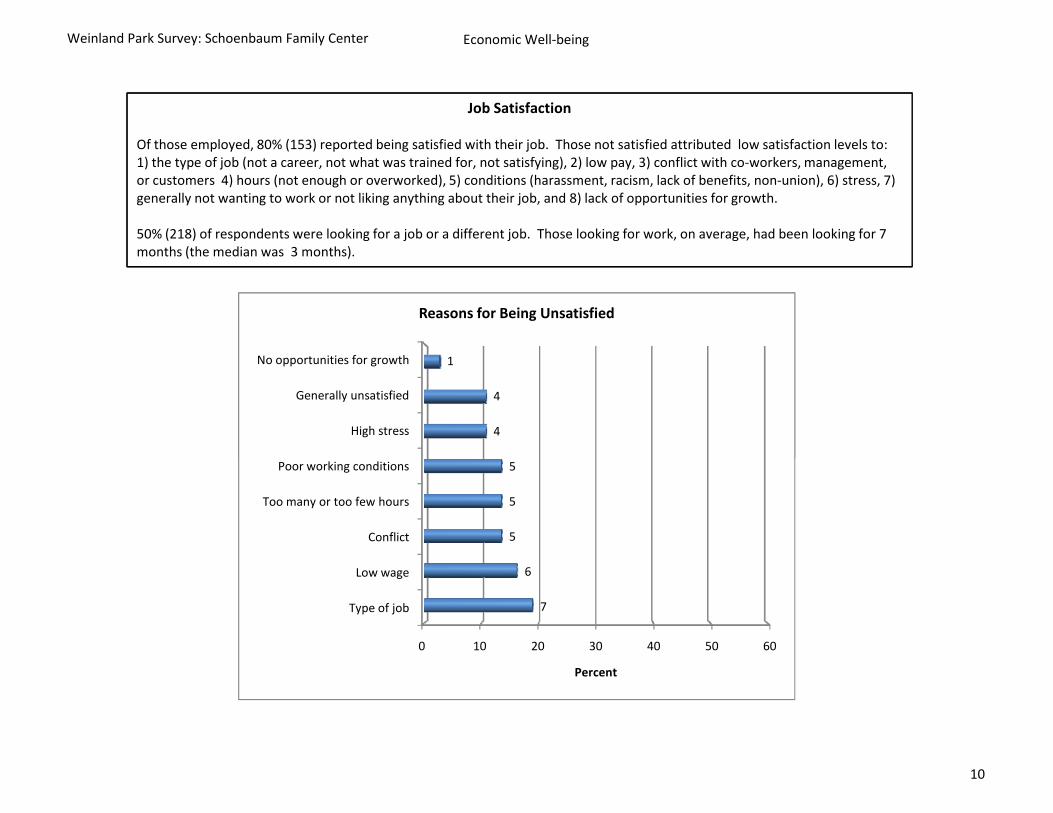
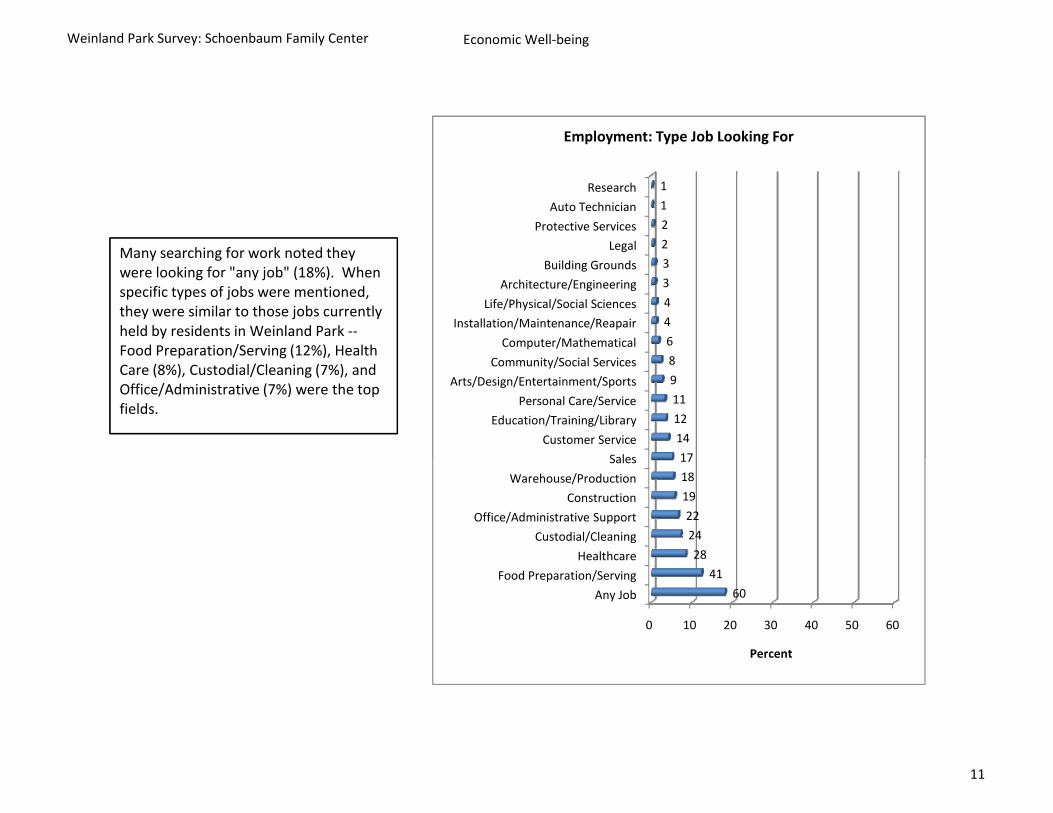
Many searching for work noted they were looking for "any job" (18%). When specific types of jobs were mentioned, they were similar to those jobs currently held by residents in Weinland Park ‐‐Food Preparation/Serving (12%), Health Care (8%), Custodial/Cleaning (7%), and Office/Administrative (7%) were the top fields.
0 10 20 30 40 50 60
Any Job
Food Preparation/Serving
Healthcare
Custodial/Cleaning
Office/Administrative Support
Construction
Warehouse/Production
Sales
Customer Service
Education/Training/Library
Personal Care/Service
Arts/Design/Entertainment/Sports
Community/Social Services
Computer/Mathematical
Installation/Maintenance/Reapair
Life/Physical/Social Sciences
Architecture/Engineering
Building Grounds
Legal
Protective Services
Auto Technician
Research
60
41
28
24
22
19
18
17
14
12
11
9
8
6
4
4
3
3
2
2
1
1
Percent
Employment: Type Job Looking For
Many searching for work noted they were looking for "any job" (18%). When specific types of jobs were mentioned, they were similar to those jobs currently held by residents in Weinland Park ‐‐Food Preparation/Serving (12%), Health Care (8%), Custodial/Cleaning (7%), and Office/Administrative (7%) were the top fields.
11

Weinland Park Survey: Schoenbaum Family Center Economic Well‐being
Barriers to Employment
141 Individuals (of 220 looking for a job, or 64%) reported having barriers
0102030405060
30 26 24 20 13 9 8 6 6 4 4 3 3 2 2 2 2 1 1 1Percen
t
Barriers to Employment
Health BarriersBarriers to Employment
141 Individuals (of 220 looking for a job, or 64%) reported having barriers that prevented them from getting a job. The most common barriers reported were health barriers (22%) ‐‐ this included having a disability, an injury, mental illness, a child with an illness, or a pregnancy. Other commonly mentioned barriers were transportation barriers (not having a car/license) (19%), the "bad economy" (no jobs available) (18%), and a criminal history (felony) (15%). Education (no high school diploma) (10%) and lack of childcare (7%) also were significant barriers.
0102030405060
30 26 24 20 13 9 8 6 6 4 4 3 3 2 2 2 2 1 1 1Percen
t
Barriers to Employment
0 5 10 15 20 25
DisabilityHealth (General)
OrthopedicMental Illness
Child's/Relative's …PregnantAsthmaStroke
Heart DiseaseDiabetes
77
433
21111
Percent
Health Barriers
12

Weinland Park Survey: Schoenbaum Family Center Economic Well‐being
Do you have a credit card? YES 58% NO 42%
Do you have a bank account? YES 33% NO 67%
Do you use rapid tax refund services? YES 17% NO 83%
82%
3%4%
6% 3% 0.5%
How often do you use payday lending?
Never
Less than once a year
1‐6 times/year
Once a month
Several times/month
Once a week
Respondents were asked a variety of questions around their access to financial services/resources...
Do you have a credit card? YES 58% NO 42%
Do you have a bank account? YES 33% NO 67%
Do you use rapid tax refund services? YES 17% NO 83%
82%
3%4%
6% 3% 0.5%
How often do you use payday lending?
Never
Less than once a year
1‐6 times/year
Once a month
Several times/month
Once a week
84.2%
7.1%6.2%1.8% 0.5% 0.2%
How often do you sell your items at pawn shop?
Never
Less than once a year
1‐6 times/year
Once a month
Several times/month
Once a week
43%
13%
29%
16%
How often are you behind on your bills?
Never
Less than once a year
1‐6 times/year
Every month
Respondents were asked a variety of questions around their access to financial services/resources...
13

Weinland Park Survey: Schoenbaum Family Center Workforce Development
Workforce Development
30% (132) of respondents reported having attended a workforce development program.
70% (92) of these respondents reported attending programs that generally concentrated on workforce readiness.
71% of these respondents completed the program they were enrolled in.
56% (74) of these respondents believed that the program they attended helped increase their ability to get a job.
‐‐‐‐‐‐‐‐‐‐‐‐‐‐‐‐‐‐‐‐‐‐‐‐‐‐‐‐‐‐‐‐‐‐‐‐‐‐‐‐‐‐‐‐‐‐‐‐‐‐‐‐‐‐‐‐‐‐‐‐‐‐‐‐‐‐‐‐
Godman Guild
37 respondents (28% of the total participating in any workforce development program) attended a program at Godman Guild.
21 of these respondents (57%) believed that the program they attended at the Guild helped increase their ability to get a job.
920
70
2
What was the programs focus?
Computer Training
Technical Training
Workforce Readiness
Don't Know
0 10 20 30 40 50 60
2010
2009
2008
2007
2006
2005
2004
2003
2000
<2000
26
34
19
7
7
4
4
3
4
18
Percent
Year of Program Attendance
63% of workforce development participants attended programs over the last three years (5 respondents were currently enrolled).
14

Weinland Park Survey: Schoenbaum Family Center Workforce Development
42.4%56
20.5%27
17.4%23
14.4%19
3.0%4
2.3%3
Workforce Development Participants: Employment Status
Unemployed
Employed Part‐time
Receiving Disability
Employed Full‐time
Homemaker
Retired
54.1%2021.6%
8
13.5%5
8.1%3
2.7%1
Godman Guild Participants: Employment Status
Unemployed
Employed Part‐time
Employed Full‐time
Receving Disability
Homemaker
14% of those who had attended a workforce development training program reported having a full‐time job, and 42% were unemployed.
Of those who had attended a program at Godman Guild, 14% reported having a full time job, and 54% were unemployed. ‐‐‐‐‐‐‐‐‐‐‐‐‐‐‐‐‐‐‐‐‐‐‐‐‐‐‐‐‐‐‐‐‐‐‐‐‐‐‐‐‐‐‐‐‐‐‐‐‐‐‐‐‐‐‐‐‐‐The characteristics of those who have attended these programs are:
•65% Female
•72% African American
•55% Single, 16% Cohabitating
•56% have children living in their home
•82% have a high school degree or less
•12% have been homeless in the last year
15

Weinland Park Survey: Schoenbaum Family Center Religion
71% of respondents reported being Christian, and 25% reported being affiliated with no religion. The remainder reported being Jewish, Buddhist, or Christian and Muslim.
30971%
11025%
102%
72%
Religious Affiliation
Christian
None
Muslim
Other
About once a week
More than once a week
63
44
Church/Temple Attendance
71% of respondents reported being Christian, and 25% reported being affiliated with no religion. The remainder reported being Jewish, Buddhist, or Christian and Muslim.
30971%
11025%
102%
72%
Religious Affiliation
Christian
None
Muslim
Other
69% of respondents reported attending church/temple/mosque. Of those who attended services, 49% attended several times a year or less, 16% attended 2 or 3 times per month, 21% attended about once a week, and 15% attended more than once a week.
0 10 20 30 40 50 60
Several times a year or less
Two or three times a month
About once a week
More than once a week
147
48
63
44
Percent
Church/Temple Attendance
16
Weinland Park Survey: Schoenbaum Family Center Religion
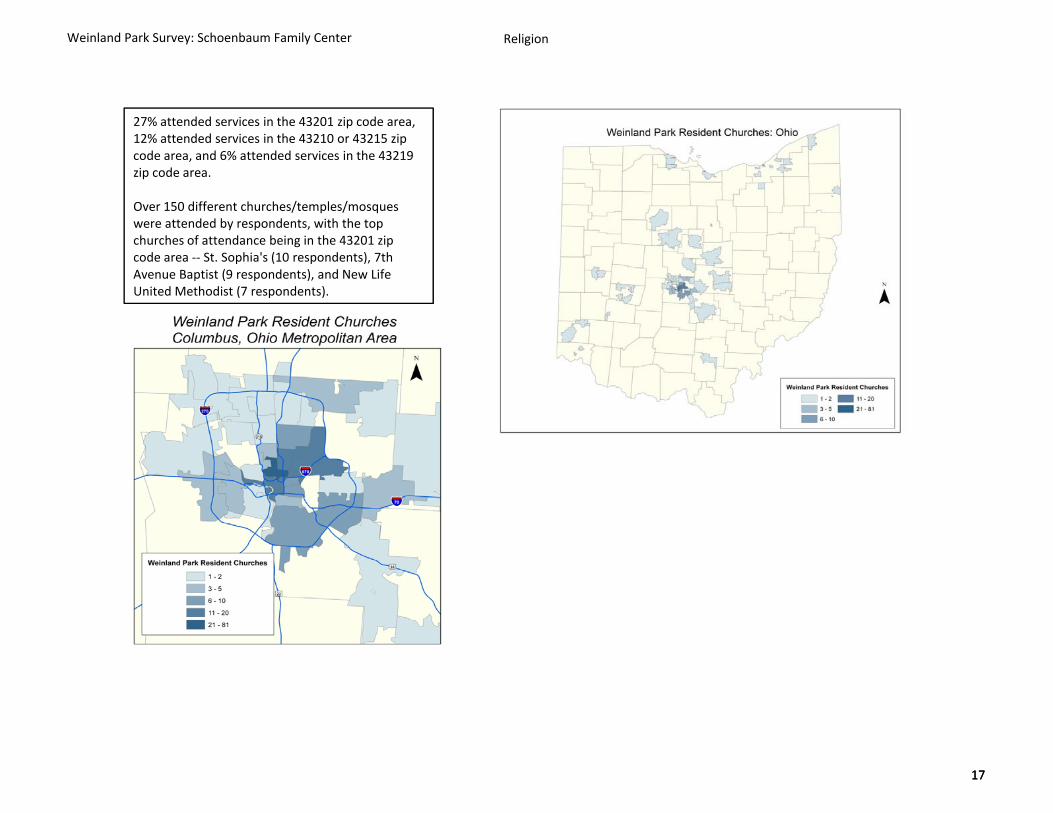
27% attended services in the 43201 zip code area, 12% attended services in the 43210 or 43215 zip code area, and 6% attended services in the 43219 zip code area.
Over 150 different churches/temples/mosques were attended by respondents, with the top churches of attendance being in the 43201 zip code area ‐‐ St. Sophia's (10 respondents), 7th Avenue Baptist (9 respondents), and New Life United Methodist (7 respondents).
17

Weinland Park Survey: Schoenbaum Family Center Housing and Mobility
Household Composition
On average, there were 2.6 individuals living in a a household (the median was 2, the mode was 1).
34% of respondents reported living with children, 31% (138) of respondents reported living alone, and 20% (86) reported living with a roommate.
"Guests" Residing in Homes
13% of respondents reported that an individual(s) was staying with them in their household for 4 nights per week or more as a guest (4 people did not respond).
0 10 20 30 40 50 60
Living with Children
Living Alone
Living with Roomate(s)
Living with (unmarried) Partner
Living with "Other" Relative(s)
Living with Spouse
Living with Parent(s)
151
138
86
62
42
40
11
Percent
Household Composition
Homelessness
9% (38) of respondents reported they had been homeless over the last year.
18

Weinland Park Survey: Schoenbaum Family Center Housing and Mobility
7952%29
19%
2315%
128%
64%
21%
Households with Children
Single
Cohabitating
Married
Separated
Divorced
Widowed
Children
52% of children were living in single parent homes (96% of these were female headed households), 19% were living in a home with two cohabitating adults, and 15% were living in a home with married adults.
50% of children were 5 years or younger.
0 10 20 30 40 50 60
18 Years
17 Years
16 Years
15 Years
14 Years
13 Years
12 Years
11 Years
10 Years
9 Year
8 Year
7 Year
6 Year
5 Year
4 Year
3 Year
2 Year
1 Year
<1 Years
2
15
10
7
11
10
13
15
14
10
19
22
20
18
33
32
37
30
14
Percentage
Children: Age Distribution
19

Weinland Park Survey: Schoenbaum Family Center Housing and Mobility
Renters
91% of Weinland Park respondents were renters.
39% of renters reported they would consider buying a home in Weinland Park.
Owners
49% of owners reported that, when ready to move, they would consider buying again in Weinland Park.
The average housing cost was $74,000 (with a low of $4,000 and a high of $160,000)
49%
39%
12%
Owners: When ready to move, would you buy again in this neighborhood?
Yes
No
Don't Know
39%
58%
3%
Renters: Would you consider buying a home in this neighborhood?
Yes
No
Don't Know
20

Weinland Park Survey: Schoenbaum Family Center Housing and Mobility
Rent/Housing Payments
23% (90) of respondents reported that they did not pay rent/housing payment (it was $0).
The average monthly household rent/housing payment was $361 (with a low of $4, and a high of $1,850).
0 10 20 30 40 50 60
0$1‐$100
$100‐$200$200‐$300$300‐$400$400‐$500$500‐$600
>$600
90343734
7059
3830
Percent
Monthly Household Rent/Housing Payment
0 10 20 30 40 50 60
1
2
3
4
5
6
7
8
9
10
259
14
21
60
46
81
79
29
75
Percent
Rating
How satisfied are you with your present housing situation?
Satisfaction with Housing
On a scale from 1 to 10, 10 being the most satisfied, respondents, on average, rated their satisfaction with their present housing situation as a 7 (the median was a 7, the mode was a 7). This indicates respondents were moderately satisfied with their housing.
71% of respondents reported that their home was in good condition or needed minor repairs, and 29% reported needs for moderate or major repairs.
14%
15%
37%
34%
Condition of Home
Needs major repairs
Needs moderate repairs
Needs minor repairs
Good
21

Weinland Park Survey: Schoenbaum Family Center Housing and Mobility
0 10 20 30 40 50 60
Plumbing/Bathroom ImprovementsWalls/Ceiling
Flooring
Window Replacement/RepairKitchen Improvements
Leaks
Electrical System
Interior/Exterior PaintingDoors/Screens
Foundation Repair
Insulation/WeatherizationHeating & Cooling System
Appliances
Porch Repair
Sidewalk/Steps/Railing/FenceNew Roof/Shingles
Water Heater
GuttersLandscaping
Locks
Mold
GarageSiding
Other
94
65
6363
61
55
3735
33
3232
28
25
2421
18
76
6
4
43
3
32
Percent
Repairs NeededHome Repairs
73% of respondents reported that their homes needed repairs.
The most commonly reported repairs needed were in the following areas:
Plumbing/Bathroom (13%)
Walls/Ceiling (9%)
Flooring (8%)
Windows (8%)
Kitchen (8%)
Leaks/Water Damage (8%)
22
Weinland Park Survey: Schoenbaum Family Center Housing and Mobility
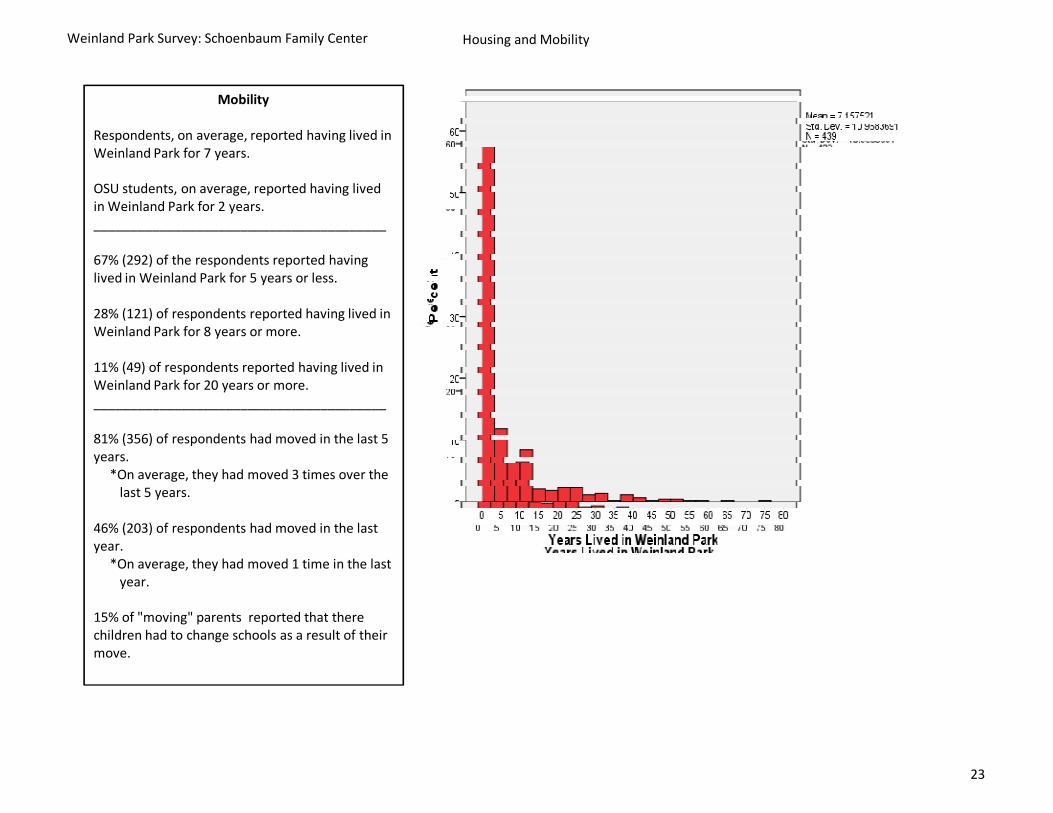
Mobility
Respondents, on average, reported having lived in Weinland Park for 7 years.
OSU students, on average, reported having lived in Weinland Park for 2 years.________________________________________
67% (292) of the respondents reported having lived in Weinland Park for 5 years or less.
28% (121) of respondents reported having lived in Weinland Park for 8 years or more.
11% (49) of respondents reported having lived in Weinland Park for 20 years or more.________________________________________
81% (356) of respondents had moved in the last 5 years.
*On average, they had moved 3 times over the last 5 years.
46% (203) of respondents had moved in the last year.
*On average, they had moved 1 time in the last year.
15% of "moving" parents reported that there children had to change schools as a result of their move.
23

Weinland Park Survey: Schoenbaum Family Center Housing and Mobility
Mobility
Where did you live prior to your current home?
33% (141) of respondents reported living in the Weinland Park/43201 area prior to moving into their current home. 8% had lived in the Linden area. The remainder had lived in scattered locations through the Columbus metropolitan area.
In what neighborhood would you like to see yourself/your family living in the next 5 years?
26% of respondents reported wanting to live in Weinland Park in the next 5 years, 44% in another neighborhood in Columbus. The Northside (19), Short North (18), Eastside (13), and the far east (13) were some of the top locations of choice mentioned by respondents.
When excluding currently enrolled students from the scenario, the percentage wanting to remain in Weinland Park goes up slightly (30%).
11326%
19544%
235%
7718%
72% 25
6%
Where would you like to live in the next 5 years?This Neighborhood
Another Neighborhood in ColumbusA Neighborhood Outside of ColumbusA Neighborhood Outside of OhioA Neighborhood Outside of the USDon't Know
Columbus Neighborhoods of Choice
24

Weinland Park Survey: Schoenbaum Family Center Neighborhood Identification/Interaction
Neighborhood Identification
Respondents were shown a map of the area between High Street and Grant Avenue, and 5th Avenue and Chittenden Avenue (what some "term" Weinland Park), and were asked how they referred to this neighborhood they resided in.
49% reported living in the Short North.
21% reported living in the Campus Area.
13% reported living in Weinland Park.
*Those who have resided in "the neighborhood" for 20 years or more were less likely to refer to the neighborhood as Weinland Park (9%).
*Home Owners were much more likely to refer to "the neighborhood" as Weinland Park (63%).
What do you call your neighborhood?All Respondents
Short North/The Short/Short North P
What do you call your neighborhood?
Respondents who have lived in Weinland Park 20 years or more
Shorth/The Shorth North/Short North
19%
What do you call your neighborhood?Home Owners
Neighborhood Identification
Respondents were shown a map of the area between High Street and Grant Avenue, and 5th Avenue and Chittenden Avenue (what some "term" Weinland Park), and were asked how they referred to this neighborhood they resided in.
49% reported living in the Short North.
21% reported living in the Campus Area.
13% reported living in Weinland Park.
*Those who have resided in "the neighborhood" for 20 years or more were less likely to refer to the neighborhood as Weinland Park (9%).
*Home Owners were much more likely to refer to "the neighborhood" as Weinland Park (63%).
49%
21%
13%
8%4%
2%
4%
What do you call your neighborhood?All Respondents
Short North/The Short/Short North Posse
Campus Area/South Campus/Gateway
Weinland Park
Listed Street(s)/Intersections
The Hood/Ghetto
North/Northside
68%
9%
9%
6% 6%2%
What do you call your neighborhood?
Respondents who have lived in Weinland Park 20 years or more
Shorth/The Shorth North/Short North Posse
Campus Area/South Campus/Gateway
Weinland Park
Listed Street/Intersections
The Hood/Ghetto
Northside
13%
19%
63%
6%
What do you call your neighborhood?Home Owners
Shorth/The Shorth North/Short North Posse
Campus Area/South Campus/Gateway
Weinland Park
Listed Street/Intersections
25

Weinland Park Survey: Schoenbaum Family Center Neighbor Interaction
419%
24255%
8118%
317%
4410%
How many neighbors do you know by name?
0
1‐10
10‐25
25‐50
>50
A majority of respondents (55%) reported they knew 1‐10 neighbors by name.
Only 9% of respondents reported they didn't know any of their neighbors by name.
297%
153% 21
5%
12529%
24757%
How often do you interact with your neighbors?
Never
Less than once a month
Once a month
Weekly or bi‐weekly
Daily
26
Weinland Park Survey: Schoenbaum Family Center Neighbor Interaction
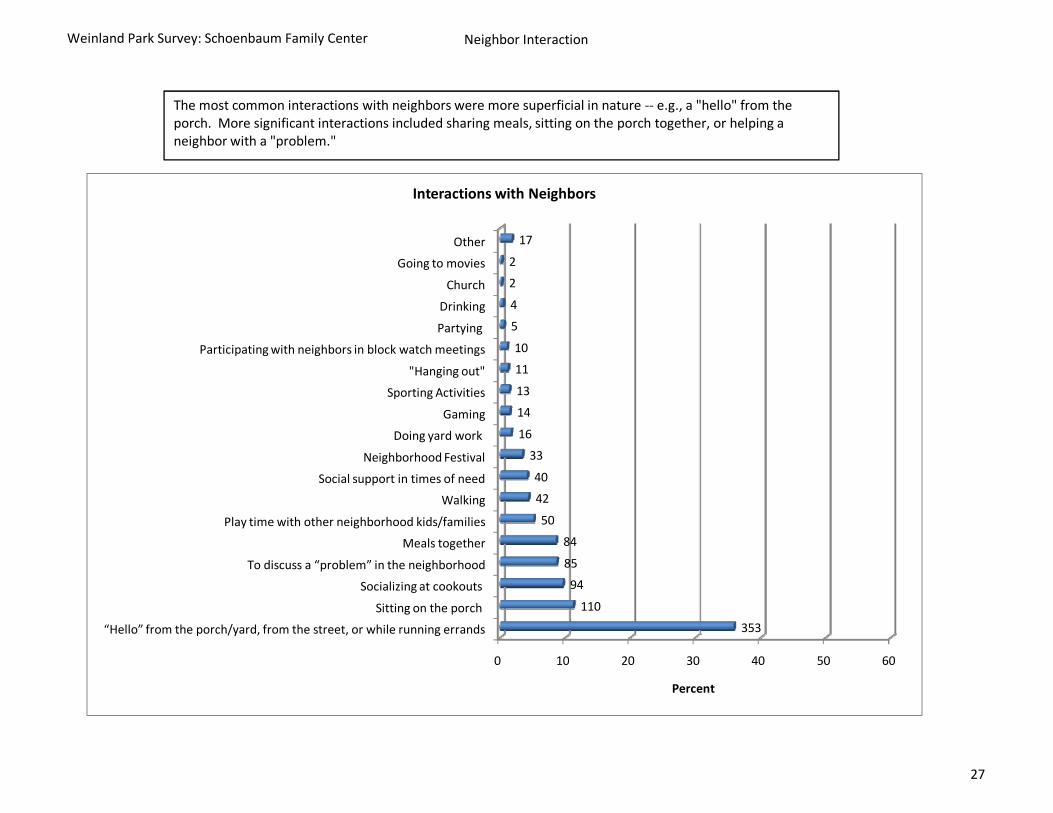
The most common interactions with neighbors were more superficial in nature ‐‐ e.g., a "hello" from the porch. More significant interactions included sharing meals, sitting on the porch together, or helping a neighbor with a "problem."
0 10 20 30 40 50 60
“Hello” from the porch/yard, from the street, or while running errands
Sitting on the porch
Socializing at cookouts
To discuss a “problem” in the neighborhood
Meals together
Play time with other neighborhood kids/families
Walking
Social support in times of need
Neighborhood Festival
Doing yard work
Gaming
Sporting Activities
"Hanging out"
Participating with neighbors in block watch meetings
Partying
Drinking
Church
Going to movies
Other
353
110
94
85
84
50
42
40
33
16
14
13
11
10
5
4
2
2
17
Percent
Interactions with Neighbors
27

Weinland Park Survey: Schoenbaum Family Center Personal Interests/Community Involvement
0 10 20 30 40 50 60
Sports
Reading/Writing
Music/Dancing/Performing Arts
Caring for children
Gaming
Arts/Photography/Fashion/Film
Watching movies
Socializing
Cooking
Using computers
Volunteering/Community Development
Gardening
Shopping
Caring for animals
Sewing and knitting
Drinking, Bars
Cars, Car repair
Going to the park
Learning (History, Medicine, Science, Theology)
Home repair
181
109
77
65
59
55
52
47
44
28
26
25
25
18
15
13
11
11
11
10
Percent
Personal Interests: Top InterestsRespondents reported having a variety of interests. Top interests mentioned included sports, reading/writing, music/arts, caring for children, gaming, and watching movies.
28

Weinland Park Survey: Schoenbaum Family Center Personal Interests/Community Involvement
Volunteer Experience
129 respondents reported volunteering their time toward a variety of causes. 30 respondents volunteered in two locations. 12 respondents volunteered in three locations.
‐‐‐‐‐‐‐‐‐‐‐‐‐‐‐‐‐‐‐‐‐‐‐‐‐‐‐‐‐‐‐‐‐‐‐‐‐‐‐‐‐‐‐‐‐‐‐‐‐‐‐‐‐‐
51% of volunteers worked on projects in the Weinland Park/43201 area code. Another 20% volunteered in the downtown or OSU campus areas.
29

Weinland Park Survey: Schoenbaum Family Center Personal Interests/Community Involvement
0 10 20 30 40 50 60
Food (cook, clean, serve)Children (baby‐sit, read, tutor, field trips, sports)
Events (organize, set‐up, clean‐up)Church/Mosque (transportation, bake sales, choir)
WPCCAClean‐up
ComputersHospital
Animals (vet assistant, humane society)Clothes (donate, sort)
Homeless (shelter)Bikes (repair)
GardeningHealth (health advisor, special Olympics)
Research ProjectCollege Organization (fraternity/sorority, student orientation)
Adult Education (GED, parenting)Other
4232
1715
6555444333332
23
Percent
Volunteer Activities
The most popular volunteer activities included cooking/serving food at food pantries (23%), caring for/activities with children (18%), involvement in planning/running events (9%), or volunteering at a church/mosque (8%).
30

Weinland Park Survey: Schoenbaum Family Center Public Safety
0 10 20 30 40 50 60
1
2
3
4
5
6
7
8
9
10
10811
637
2251
7360
162
Percent
How safe do you feel alone outside during the day?
9
10
1364
How safe do you feel alone outside at night?
Day
Respondents were asked to rate how safe they felt alone outside during the day ("10" being the most safe, and "1" not safe at all). The average rating given by respondents was "8" (the median was a "9," the mode was a "10"), suggesting that respondents feel relatively safe when alone outside during the day.‐‐‐‐‐‐‐‐‐‐‐‐‐‐‐‐‐‐‐‐‐‐‐‐‐‐‐‐‐‐‐‐‐‐‐‐‐‐‐‐‐‐‐‐‐‐‐‐‐‐‐‐‐‐‐‐
Night
Respondents were asked to rate how safe they felt alone outside at night ("10" being the most safe, and "1" not safe at all). In contrast, the average rating given by respondents was a "5" (the median was a "5," the mode was a "1"), suggesting that respondents do not feel very safe when alone outside at night.
0 10 20 30 40 50 60
1
2
3
4
5
6
7
8
9
10
10811
637
2251
7360
162
Percent
How safe do you feel alone outside during the day?
0 10 20 30 40 50 60
1
2
3
4
5
6
7
8
9
10
7526
4434
5339
4843
1364
Percent
How safe do you feel alone outside at night?
Day
Respondents were asked to rate how safe they felt alone outside during the day ("10" being the most safe, and "1" not safe at all). The average rating given by respondents was "8" (the median was a "9," the mode was a "10"), suggesting that respondents feel relatively safe when alone outside during the day.‐‐‐‐‐‐‐‐‐‐‐‐‐‐‐‐‐‐‐‐‐‐‐‐‐‐‐‐‐‐‐‐‐‐‐‐‐‐‐‐‐‐‐‐‐‐‐‐‐‐‐‐‐‐‐‐
Night
Respondents were asked to rate how safe they felt alone outside at night ("10" being the most safe, and "1" not safe at all). In contrast, the average rating given by respondents was a "5" (the median was a "5," the mode was a "1"), suggesting that respondents do not feel very safe when alone outside at night.
‐‐‐‐‐‐‐‐‐‐‐‐‐‐‐‐‐‐‐‐‐‐‐‐‐‐‐‐‐‐‐‐‐‐‐‐‐‐‐‐‐‐‐‐‐‐‐‐‐‐‐‐‐‐‐‐
Safe for Children
Is this neighborhood a safe place for children to play outside during the day?
Yes 55%
No 45%
*Respondents were mixed on whether they felt Weinland Park was a safe place for children to play outside during the day.
31

Weinland Park Survey: Schoenbaum Family Center Public Safety
Respondents were asked what made them feel unsafe in the neighborhood. The top responses were the people ("young people," "rowdy people," "African Americans") (20%), Guns/Shootings (18%), Crime (in general) (13%), Drugs/Alcohol Use/Distribution (12%), and Poor Lighting/Night (6%).
Police Absence/Poor Policing
Strangers
Location of Neighborhood
Loitering
Traffic
Stories I've Heard
Lack of Security
Corner Stores
Alleys
Being Alone
Appearance of Neighborhood
Racism
Vacant Houses/Buildings
Walking in the Neighborhood
Other
21
16
14
13
11
8
7
6
4
4
4
3
2
2
26
What makes you feel unsafe in this neighborhood?Respondents were asked what made them feel unsafe in the neighborhood. The top responses were the people ("young people," "rowdy people," "African Americans") (20%), Guns/Shootings (18%), Crime (in general) (13%), Drugs/Alcohol Use/Distribution (12%), and Poor Lighting/Night (6%).
0 10 20 30 40 50 60
People
Guns/Shootings
Crime
Drugs/Alcohol
Night/Poor Lighting
Altercations
Gangs
Police Absence/Poor Policing
Strangers
Location of Neighborhood
Loitering
Traffic
Stories I've Heard
Lack of Security
Corner Stores
Alleys
Being Alone
Appearance of Neighborhood
Racism
Vacant Houses/Buildings
Walking in the Neighborhood
Other
115
103
74
71
36
25
22
21
16
14
13
11
8
7
6
4
4
4
3
2
2
26
Percent
What makes you feel unsafe in this neighborhood?
32

Weinland Park Survey: Schoenbaum Family Center Public Safety
Location
I feel safe when at home
Crowds/People Around
Stay Inside/Keep to Self
Longevity ("I am comfortable here")
Security Device
Lighting (well‐lit)
Armed
Dogs
Students
Faith/Religion
Change in Neighborhood
Block watch
Culture "I understand others in the neighborhood"
Other
30
25
24
18
17
14
12
10
10
10
9
6
3
3
28
What makes you feel safe in this neighborhood?Respondents were asked what made them feel safe in the neighborhood. The top responses were the police presence/officers (26%), social networks (23%), a personal sense of safety (9%), and the location of Weinland Park (proximity to High Street, on a main street) (6%).
0 10 20 30 40 50 60
Police
Social Networks
Personal ("I am not fearful")
Location
I feel safe when at home
Crowds/People Around
Stay Inside/Keep to Self
Longevity ("I am comfortable here")
Security Device
Lighting (well‐lit)
Armed
Dogs
Students
Faith/Religion
Change in Neighborhood
Block watch
Culture "I understand others in the neighborhood"
Other
132
119
45
30
25
24
18
17
14
12
10
10
10
9
6
3
3
28
Percent
What makes you feel safe in this neighborhood?Respondents were asked what made them feel safe in the neighborhood. The top responses were the police presence/officers (26%), social networks (23%), a personal sense of safety (9%), and the location of Weinland Park (proximity to High Street, on a main street) (6%).
33

Weinland Park Survey: Schoenbaum Family Center Public Safety
Have you or someone close to you experienced:
Gun Violence Yes 43% No 57%
Home Burglary/Break‐ins Yes 42% No 58%
Automobile Break‐ins Yes 37% No 63%
Domestic Violence Yes 33% No 67%
Personal Robbery Yes 32% No 68%
Drug Trafficking/Drug Related Violence Yes 30% No 70%
Gang‐related Violence Yes 25% No 75%
Prostitution Yes 11% No 89%
Littering Yes 68% No 32%
Vandalism Yes 34% No 66%
Around 40% of respondents reported that they or someone close to them had experienced (were a victim of, witnessed, or affected by) gun violence, home burglaries, and automobile break‐ins.
34
Have you or someone close to you experienced:
Gun Violence Yes 43% No 57%
Home Burglary/Break‐ins Yes 42% No 58%
Automobile Break‐ins Yes 37% No 63%
Domestic Violence Yes 33% No 67%
Personal Robbery Yes 32% No 68%
Drug Trafficking/Drug Related Violence Yes 30% No 70%
Gang‐related Violence Yes 25% No 75%
Prostitution Yes 11% No 89%
Littering Yes 68% No 32%
Vandalism Yes 34% No 66%
On a scale from 1 to 10, 10 being a major problem for residents living in this neighborhood, and 1 not a problem at all, how would you rate the following?
SCORES
Unsupervised youth Mean: 6 Median: 7 Mode: 10
Infestation of pests (e.g., cockroaches, mice, bed bugs) Mean: 6 Median: 6 Mode: 1
Noise and poor air quality from traffic Mean: 5 Median: 5 Mode: 1
Strangers from outside the neighborhood Mean: 5 Median: 5 Mode: 1
Aggressive dogs Mean: 3 Median: 1 Mode: 1
Around 40% of respondents reported that they or someone close to them had experienced (were a victim of, witnessed, or affected by) gun violence, home burglaries, and automobile break‐ins.
34

Weinland Park Survey: Schoenbaum Family Center Public Safety
On a scale from 1 to 10, 10 being completely trustworthy and 1 not trustworthy at all, how would you rate your trust of the police?
All Respondents (434):Mean Score: 6Median Score: 7Mode Score: 10
African American Respondents (217):Mean Score: 6Median Score: 6Mode Score: 10
Respondents <30 years (194)
Mean Score: 6Median Score: 6Mode Score: 10
0 10 20 30 40 50 60
1
2
3
4
5
6
7
8
9
10
5110
2820
563442
6625
102
Percent
Trust of Police: All Respondents
Trust of Police: African American Respondents
Trust of Police: Respondent <30 yearsRespondents expressed moderate
On a scale from 1 to 10, 10 being completely trustworthy and 1 not trustworthy at all, how would you rate your trust of the police?
All Respondents (434):Mean Score: 6Median Score: 7Mode Score: 10
African American Respondents (217):Mean Score: 6Median Score: 6Mode Score: 10
Respondents <30 years (194)
Mean Score: 6Median Score: 6Mode Score: 10
0 10 20 30 40 50 60
1
2
3
4
5
6
7
8
9
10
5110
2820
563442
6625
102
Percent
Trust of Police: All Respondents
0 20 40 60
123456789
10
378
1611
3419
1326
746
Percent
Trust of Police: African American Respondents
0 20 40 60
1
2
3
4
5
6
7
8
9
10
313
1310
212020
3112
33
Percent
Trust of Police: Respondent <30 yearsRespondents expressed moderate trust of police. African American respondents and respondents under the age of 30 expressed slightly less trust of police when compared to the total respondent group.
*The 12 respondents under the age of 20, though, were even less trustful (Mean: 5, Median: 5, Mode: 1)
35
Weinland Park Survey: Schoenbaum Family Center Public Safety
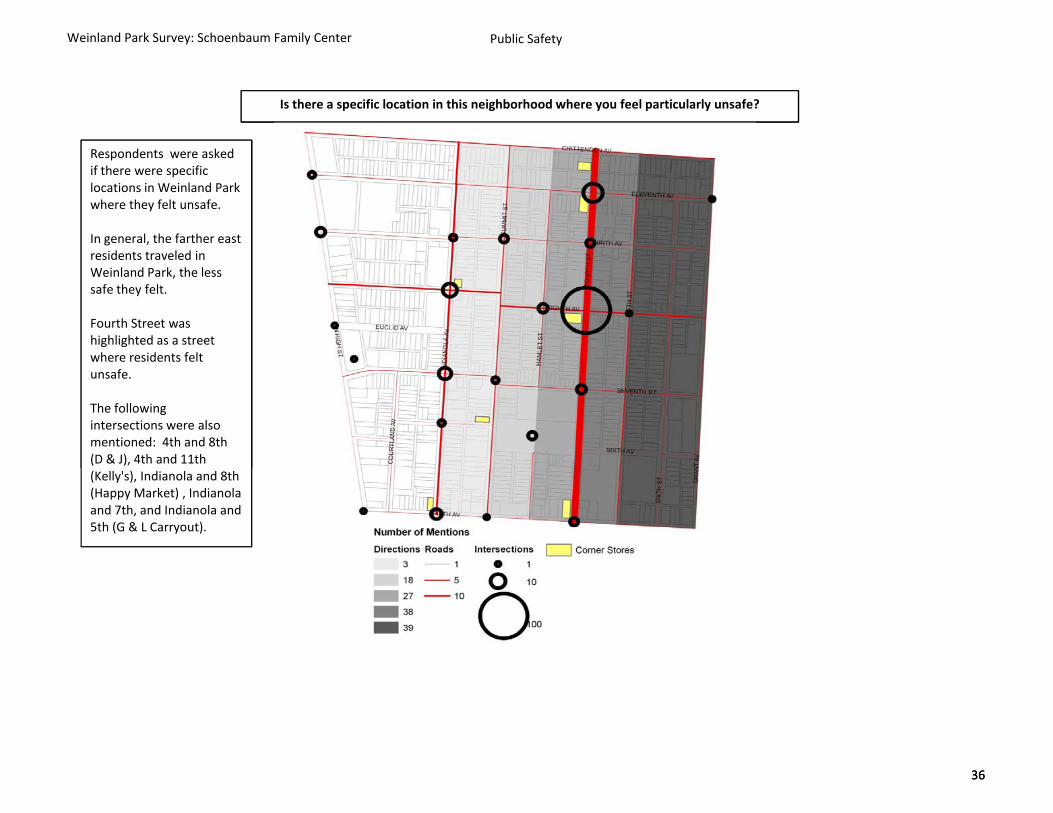
Is there a specific location in this neighborhood where you feel particularly unsafe?
Respondents were asked if there were specific locations in Weinland Park where they felt unsafe.
In general, the farther east residents traveled in Weinland Park, the less safe they felt.
Fourth Street was highlighted as a street where residents felt unsafe.
The following intersections were also mentioned: 4th and 8th (D & J), 4th and 11th
36
Is there a specific location in this neighborhood where you feel particularly unsafe?
Respondents were asked if there were specific locations in Weinland Park where they felt unsafe.
In general, the farther east residents traveled in Weinland Park, the less safe they felt.
Fourth Street was highlighted as a street where residents felt unsafe.
The following intersections were also mentioned: 4th and 8th (D & J), 4th and 11th (Kelly's), Indianola and 8th (Happy Market) , Indianola and 7th, and Indianola and 5th (G & L Carryout).
36

Weinland Park Survey: Schoenbaum Family Center Access to Basic Needs
Where do you or the person who gets food in your household usually get your food? (up to 3 answers were accepted)
95% of respondents reported shopping for groceries at Kroger (84% at 43201, the remainder at a variety of locations).
24% of respondents reported shopping for groceries at Giant Eagle (43202, 43215).
21% of respondents reported shopping for groceries at Aldi (43211).
19% of respondents reported shopping for groceries at Wal‐Mart (43219/Easton).
Grocery Locations
Top Choice Top Three Locations
37
Weinland Park Survey: Schoenbaum Family Center Access to Basic Needs
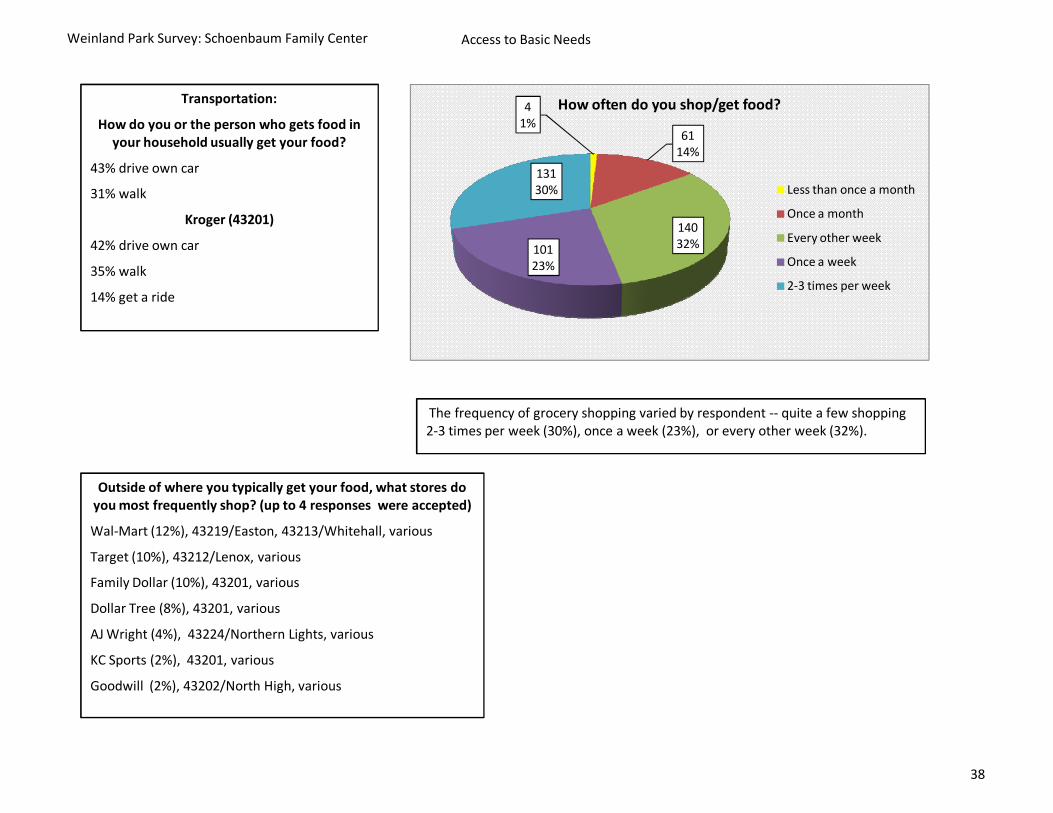
Transportation:
How do you or the person who gets food in your household usually get your food?
43% drive own car
31% walk
Kroger (43201)
42% drive own car
35% walk
14% get a ride
The frequency of grocery shopping varied by respondent ‐‐ quite a few shopping 2‐3 times per week (30%), once a week (23%), or every other week (32%).
Outside of where you typically get your food, what stores do you most frequently shop? (up to 4 responses were accepted)
Wal‐Mart (12%), 43219/Easton, 43213/Whitehall, various
Target (10%), 43212/Lenox, various
Family Dollar (10%), 43201, various
Dollar Tree (8%), 43201, various
AJ Wright (4%), 43224/Northern Lights, various
KC Sports (2%), 43201, various
Goodwill (2%), 43202/North High, various
41%
6114%
14032%101
23%
13130%
How often do you shop/get food?
Less than once a month
Once a month
Every other week
Once a week
2‐3 times per week
38

Weinland Park Survey: Schoenbaum Family Center Use of Computers and Media
Computer Use
85% (373) of respondents reported they knew how to use a computer.
58% (212) of those who are computer literate reported typically using a computer at home.
‐‐‐‐‐‐‐‐‐‐‐‐‐‐‐‐‐‐‐‐‐‐‐‐‐‐‐‐‐‐‐‐‐‐‐‐‐‐‐‐‐‐‐‐‐‐‐‐‐‐‐‐‐‐‐‐‐‐‐‐‐‐‐‐‐‐‐‐
Home Computer
67% (290) of respondents reported having a home computer.
Of these respondents, 78% (225) had internet access at home.
‐‐‐‐‐‐‐‐‐‐‐‐‐‐‐‐‐‐‐‐‐‐‐‐‐‐‐‐‐‐‐‐‐‐‐‐‐‐‐‐‐‐‐‐‐‐‐‐‐‐‐‐‐‐‐‐‐‐‐‐‐‐‐‐‐‐‐‐
Frequency of Computer Use
76% (283) of respondents who use a computer reported using a computer every day or every other day.
0 10 20 30 40 50 60
Home
Library
School/Program
Office
Relative's House
Wireless in many locations
Friend's House
Other
212
78
22
18
16
7
5
7
Percent
Where do you typically use a computer?
0 10 20 30 40 50 60
Internet/Email
School Work
Work (not school)
Playing Games
Financial Management
Media (Books, Movies, Music, Phone)
337
130
96
69
48
22
Percent
For what purpose(s) do you use a computer?
Most computer activity revolved around internet searches and online activities (48%), with 43 individuals specifically reporting they utilized the internet to do job searches/apply for jobs. Work related activity (employment, school, and volunteer work) accounted for 33% of activity reported.
5314%
359%
7119%
21257%
How often do you use a computer?
Less than once a week
Once a week
Every other day
Every day
39

Weinland Park Survey: Schoenbaum Family Center Use of Computers and Media
Children: Computer Use
66% (96) of respondents with children living in their home reported that their child knew how to use a computer.
According to respondents, outside of school , a majority (57%) of computer literate children typically used a computer at home.
‐‐‐‐‐‐‐‐‐‐‐‐‐‐‐‐‐‐‐‐‐‐‐‐‐‐‐‐‐‐‐‐‐‐‐‐‐‐‐‐‐‐‐‐‐‐‐‐‐‐‐‐‐‐‐‐‐‐‐‐‐‐‐‐‐‐‐‐
Children: Frequency of Computer Use
According to respondents, 77% (71) of computer literate children used a computer every day or every other day (outside of school).
0 10 20 30 40 50 60
Home
Library
Relative's House
Friend's House
Wireless in many locations
Other
51
19
12
3
2
2
Percent
Where does your child typically use a computer (outside of school)?
Most childrens' computer activity revolved around playing games (41%) and internet searches/online activities (33%).
0 20 40 60
Games
Internet/Email
Homework/Early Computer Literacy
Media (Movies, Music)
60
49
34
5
Percent
For what purpose do your children use a computer (outside of school)?
33% 19
20%
2426%
4751%
How often does your child use a computer (outside of school)?
Never
Once a week
Every other day
Every day
40

Weinland Park Survey: Schoenbaum Family Center Use of Computers and Media
Reading/Access to Books
99% of respondents reported knowing how to read.
81% of these individuals reported reading every day.
20% of reading materials included novels, and another 31% was made up of newspapers and magazines.
0 20 40 60 80 100
Never
Less than several times a month
Several times a month
Once a week
Every day
3
21
28
29
353
Percent
How often do you read?
0 10 20 30 40 50 60
NovelsNewspapersMagazines
InternetTextbooksNon‐fiction
Inspirational Books (Bible)Children's Books
Catalogues/Mail/ManualsWork‐related documents
BiographiesSelf‐help books
HistoryComicsPoemsEssays
201169
141968879
64382722161512654
Percent
What do you typically read?
41

Weinland Park Survey: Schoenbaum Family Center Use of Computers and Media
0 10 20 30 40 50 60
Beauty/Fashion/Gossip/TV
Sports
Political/News
Home Improvement/Gardening/Cooking
Arts/Music
Science/Educational
The Slammer
Car/Motorcycle/Truck
Parenting/Baby
Gaming/Puzzles
Other
46
29
25
24
15
12
8
6
5
4
24
Percent
Magazine Types
0 20 40 60 80
Columbus Dispatch
New York Times
Lantern
Other Paper
Columbus Alive
USA Today
Other
131
21
8
8
8
7
31
Percent
Newspaper Types
The Columbus Dispatch was the dominant newspaper read by respondents (61%). The most popular magazines types were fashion/gossip (23%), sports (15%), and political (13%).
Library Use
80% (349) of respondents reported going to the library, with 45% of these respondents (156) visiting every day to once a week.
The Northside library was, by far, the most utilized library (65%).
0 20 40 60 80
Northside Library
OSU Libraries
Main Library (Grant)
Linden Public Library
Whetstone Library
Other
225
57
26
7
7
26
What library do you typically go to?
10430%
8825%
10430%
5215%
How often do you go to the library?
Less than several times a month
Several times a month
Once a week
Every day
42

Weinland Park Survey: Schoenbaum Family Center Use of Computers and Media
Reading to Children
92% (112) of respondents with children living in their home reported reading to their children under the age of 11.
A majority of these respondents (62%) reported reading to their child under 11 every day, with the remainder reading to their children once a week, several times a month, or less than several times a month.
54% 19
17%
1917%70
62%
How often do you read to your child(ren)?
Less than several times a month
Several times a month
Once a week
Every day
The characteristics of respondents who read to their children every day are the following:
•89% Women
•77% African American
•54% Single, 29% Married
•96% Renters
43
Weinland Park Survey: Schoenbaum Family Center Health
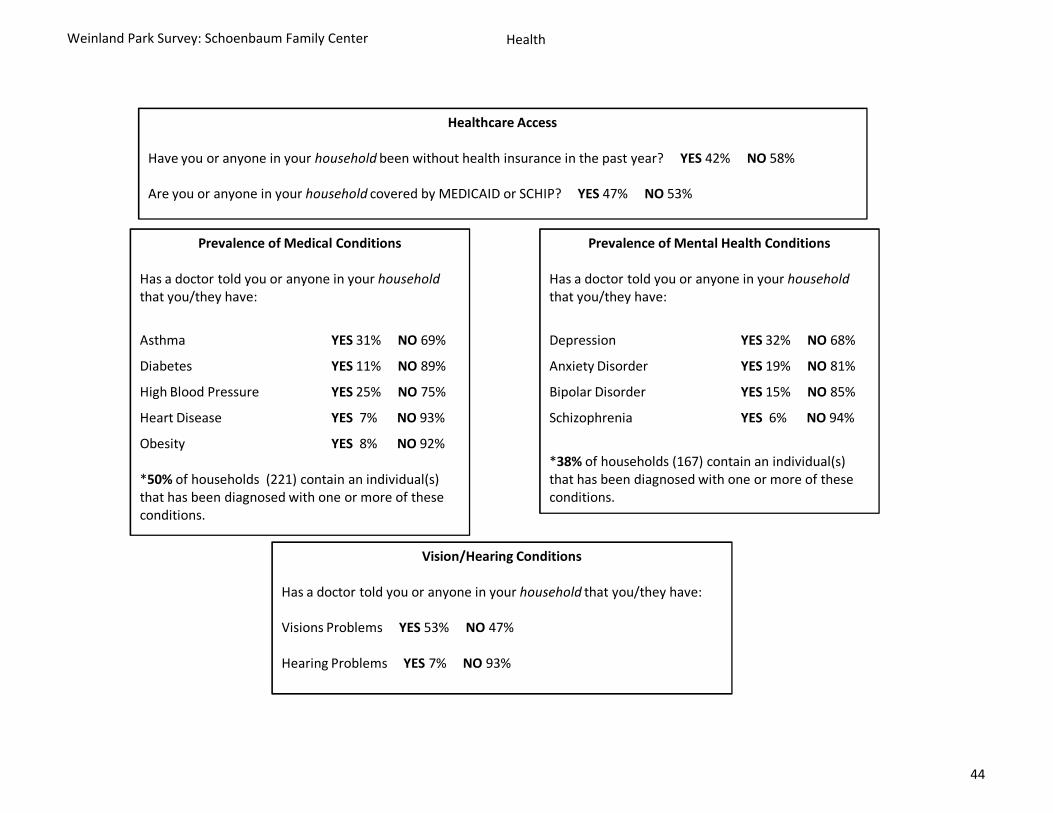
Healthcare Access
Have you or anyone in your household been without health insurance in the past year? YES 42% NO 58%
Are you or anyone in your household covered by MEDICAID or SCHIP? YES 47% NO 53%
Prevalence of Medical Conditions
Has a doctor told you or anyone in your household that you/they have:
Asthma YES 31% NO 69%
Diabetes YES 11% NO 89%
High Blood Pressure YES 25% NO 75%
Heart Disease YES 7% NO 93%
Obesity YES 8% NO 92%
*50% of households (221) contain an individual(s) that has been diagnosed with one or more of these conditions.
Prevalence of Mental Health Conditions
Has a doctor told you or anyone in your household that you/they have:
Depression YES 32% NO 68%
Anxiety Disorder YES 19% NO 81%
Bipolar Disorder YES 15% NO 85%
Schizophrenia YES 6% NO 94%
*38% of households (167) contain an individual(s) that has been diagnosed with one or more of these conditions.
Vision/Hearing Conditions
Has a doctor told you or anyone in your household that you/they have:
Visions Problems YES 53% NO 47%
Hearing Problems YES 7% NO 93%
44
Weinland Park Survey: Schoenbaum Family Center Health
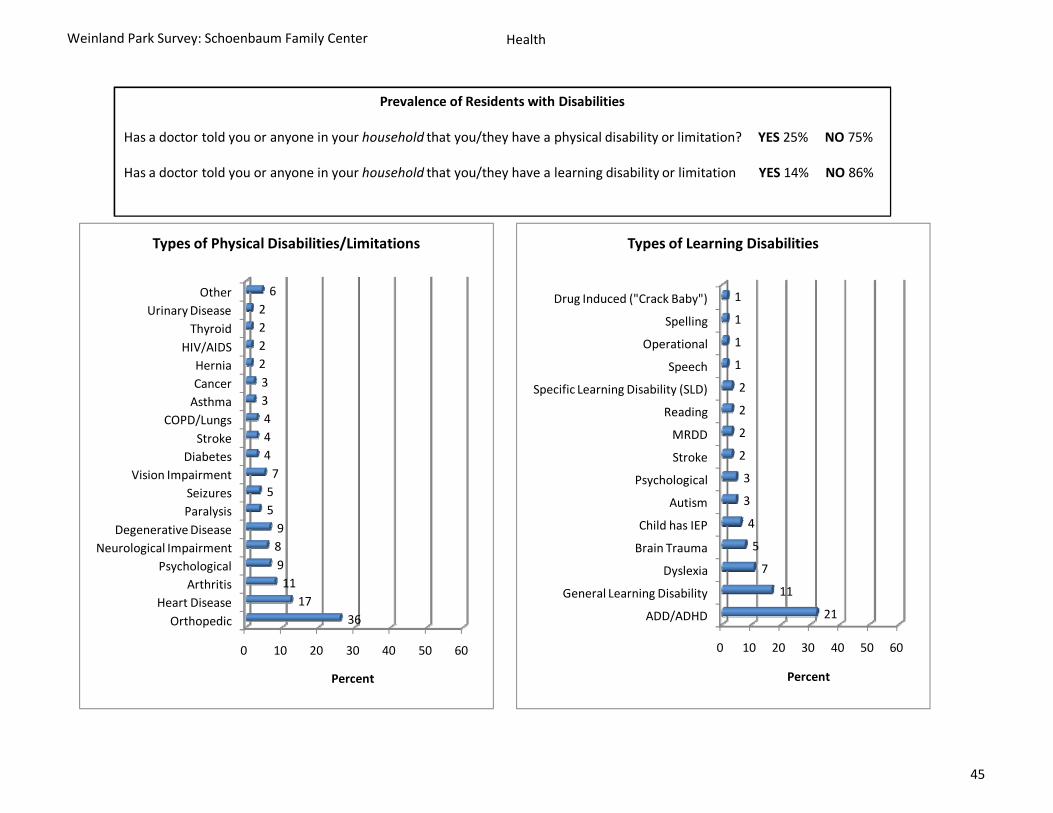
Prevalence of Residents with Disabilities
Has a doctor told you or anyone in your household that you/they have a physical disability or limitation? YES 25% NO 75%
Has a doctor told you or anyone in your household that you/they have a learning disability or limitation YES 14% NO 86%
0 10 20 30 40 50 60
OrthopedicHeart Disease
ArthritisPsychological
Neurological ImpairmentDegenerative Disease
ParalysisSeizures
Vision ImpairmentDiabetesStroke
COPD/LungsAsthmaCancerHernia
HIV/AIDSThyroid
Urinary DiseaseOther
3617
11989
557
4443322226
Percent
Types of Physical Disabilities/Limitations
0 10 20 30 40 50 60
ADD/ADHD
General Learning Disability
Dyslexia
Brain Trauma
Child has IEP
Autism
Psychological
Stroke
MRDD
Reading
Specific Learning Disability (SLD)
Speech
Operational
Spelling
Drug Induced ("Crack Baby")
21
11
7
5
4
3
3
2
2
2
2
1
1
1
1
Percent
Types of Learning Disabilities
45

Weinland Park Survey: Schoenbaum Family Center Health
Prevalence of Childhood Disabilities
Parents with children living in their home (145) provided the following information about their children:
•20% of households have a child(ren) with a developmental or behavioral disability.
•20% of households have a child(ren) receiving physical, occupational, or speech therapy.
•At least 3% of households have a child(ren) with a significant physical disability.
•13% of households have a child(ren) with significant limitations that prevent him/her from full participation with peers.
•47% of households have a child(ren) taking prescription medications.
46

Weinland Park Survey: Schoenbaum Family Center Health
Where Weinland Park Residents Access Healthcare Services
10% (42) respondents had not received any medical treatment in the last year, and therefore could not comment on where they "typically receive treatment." Of those able to anser the questions, 47% reported they typically received medical treatment from a primary care physician, 22% went to the Emergency Room, and 15% visited a specialist.
0 20 40 60
Primary Care Physician
Emergency Room
Specialist
Free Clinic
Urgent Care
Other
186
87
59
27
25
9
Percent
Location of Medical Treatment Emergency Room Use
60% of households contained an individual(s) who had sought treatment in the emergency room over the last year. The average number of visits was 5 (the median was 2, the mode was 1).
0
10
20
30
40
50
60
1 2 3 4 5 6 7 8 9 10 11 12 15 20 25 28 30 40 50 100
7761
3315 23 15 7 3 1 3 2 4 1 8 1 1 3 1 1 1
Percen
t
# Visits
Emergency Room Visits
47

Weinland Park Survey: Schoenbaum Family Center Health
Satisfaction Levels
On a scale from 1 to 10, 10 being the most satisfied, and 1 the least satisfied, how satisfied are you with any medical treatment you have received in the last year?
41 respondents had not received any medical treatment in the last year, and therefore could not answer the question. The average point score for the 393 respondents who did answer the question was an "8" (the median was a "9", and the mode was a "10") suggesting that, overall, Weinland Park residents with access to healthcare have been satisfied with their treatment.
0 10 20 30 40 50 60
1
2
3
4
5
6
7
8
9
10
12
4
5
10
22
24
28
59
38
191
Percent
Satisfaction with Medical Treatment
48

Weinland Park Survey: Schoenbaum Family Center Health
Cooking and Eating Habits
Based on responses to the following questions, access to cooking facilities/equipment does not appear to be a major issue for Weinland Park respondents:
Do you have pots and pans? YES 97% NO 3%
Do you have a working stove/oven? YES 98% NO 2%
•On average, Weinland Park households eat 5 home cooked dinners a week (the median was 6, the mode was 7).
A great majority (82%) of respondents reported eating fruits and vegetables every day or every other day.
In contrast, "fast food" consumption varied, with the largest number of respondents reporting they eat "fast food" less than once a week.
133%
102%
164%
419%
9722%260
60%
Fruit and Vegetable Consumption
Never
Less than once a week
Once a week
Twice a week
Every other day
Every day
5513%
14232%
7617%
8519%
5011%
307%
"Fast Food" Consumption
Never
Less than once a week
Once a week
Twice a week
Every other day
Every day
49

Weinland Park Survey: Schoenbaum Family Center Health
Alcohol Use
•66% (290) of respondents drink alcoholic beverages.
•Those respondents who drink (290), on average, drink 2.5 days per week .
•On a typical day when respondents (288) drink, they drink 4 alcoholic beverages.
•On average, the maximum number if drinks respondents (286) have had on any given occasion during the past month was 7 (the mode was 13 or more ).
Recreational Drug Use
•Residents were asked to rate how much of a problem recreational drug use was on a scale from 1 to 10 ("10" being a major problems from residents, and "1" not a problem at all).
•The average rating given by respondents (390 responded, 46 "didn't know," and 4 refused) was a "7" (the median was an "8," the mode was a "10"), suggesting that respondents felt recreational drug use was a moderate to major problem for residents in Weinland Park.
Tobacco Use
•53% of respondents smoked cigarettes, cigars or chewed tobacco (7 respondents did not answer the question).
50

Weinland Park Survey: Schoenbaum Family Center Children and Child Development
Children: Schools of Attendance
Respondents with children living in their homes were asked about their child(ren)'s school of attendance In total the school
51
Children: Schools of Attendance
Respondents with children living in their homes were asked about their child(ren)'s school of attendance. In total, the school attendance of 194 children was discussed.
•There were 38 children attending 13 different Preschools.
Location of Schools
Children attended schools throughout the Columbus metropolitan area, with the largest concentration in the Weinland Park and
Children: Schools of Attendance
Respondents with children living in their homes were asked about their child(ren)'s school of attendance. In total, the school attendance of 194 children was discussed.
•There were 38 children attending 13 different Preschools.
•There were 100 children attending 26 different Elementary or K‐8/K‐12 Schools.
•There were 33 children attending 8 different Middle Schools.
Location of Schools
Children attended schools throughout the Columbus metropolitan area, with the largest concentration in the Weinland Park and downtown areas.
Children: Schools of Attendance
Respondents with children living in their homes were asked about their child(ren)'s school of attendance. In total, the school attendance of 194 children was discussed.
•There were 38 children attending 13 different Preschools.
•There were 100 children attending 26 different Elementary or K‐8/K‐12 Schools.
•There were 33 children attending 8 different Middle Schools.
•There were 23 children attending 13 different High Schools.
Location of Schools
Children attended schools throughout the Columbus metropolitan area, with the largest concentration in the Weinland Park and downtown areas.
51
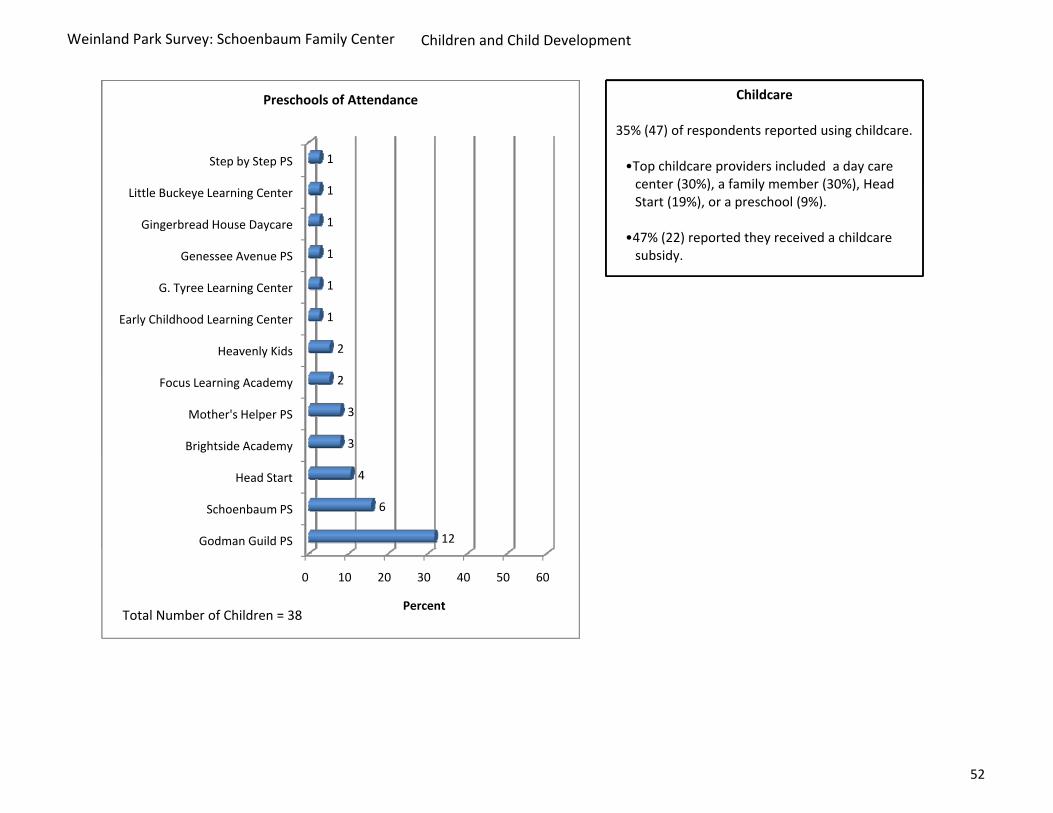
Weinland Park Survey: Schoenbaum Family Center Children and Child Development
Step by Step PS
1
1
Preschools of Attendance Childcare
35% (47) of respondents reported using childcare.
•Top childcare providers included a day care center (30%) a family member (30%) Head
Genessee Avenue PS
Gingerbread House Daycare
Little Buckeye Learning Center
Step by Step PS
1
1
1
1
1
Preschools of Attendance Childcare
35% (47) of respondents reported using childcare.
•Top childcare providers included a day care center (30%), a family member (30%), Head Start (19%), or a preschool (9%).
•47% (22) reported they received a childcare subsidy.
Heavenly Kids
Early Childhood Learning Center
G. Tyree Learning Center
Genessee Avenue PS
Gingerbread House Daycare
Little Buckeye Learning Center
Step by Step PS
2
2
1
1
1
1
1
1
Preschools of Attendance Childcare
35% (47) of respondents reported using childcare.
•Top childcare providers included a day care center (30%), a family member (30%), Head Start (19%), or a preschool (9%).
•47% (22) reported they received a childcare subsidy.
Brightside Academy
Mother's Helper PS
Focus Learning Academy
Heavenly Kids
Early Childhood Learning Center
G. Tyree Learning Center
Genessee Avenue PS
Gingerbread House Daycare
Little Buckeye Learning Center
Step by Step PS
3
3
2
2
1
1
1
1
1
1
Preschools of Attendance Childcare
35% (47) of respondents reported using childcare.
•Top childcare providers included a day care center (30%), a family member (30%), Head Start (19%), or a preschool (9%).
•47% (22) reported they received a childcare subsidy.
Godman Guild PS
Schoenbaum PS
Head Start
Brightside Academy
Mother's Helper PS
Focus Learning Academy
Heavenly Kids
Early Childhood Learning Center
G. Tyree Learning Center
Genessee Avenue PS
Gingerbread House Daycare
Little Buckeye Learning Center
Step by Step PS
12
6
4
3
3
2
2
1
1
1
1
1
1
Preschools of Attendance Childcare
35% (47) of respondents reported using childcare.
•Top childcare providers included a day care center (30%), a family member (30%), Head Start (19%), or a preschool (9%).
•47% (22) reported they received a childcare subsidy.
0 10 20 30 40 50 60
Godman Guild PS
Schoenbaum PS
Head Start
Brightside Academy
Mother's Helper PS
Focus Learning Academy
Heavenly Kids
Early Childhood Learning Center
G. Tyree Learning Center
Genessee Avenue PS
Gingerbread House Daycare
Little Buckeye Learning Center
Step by Step PS
12
6
4
3
3
2
2
1
1
1
1
1
1
Percent
Preschools of Attendance
Total Number of Children = 38
Childcare
35% (47) of respondents reported using childcare.
•Top childcare providers included a day care center (30%), a family member (30%), Head Start (19%), or a preschool (9%).
•47% (22) reported they received a childcare subsidy.
52

Weinland Park Survey: Schoenbaum Family Center Children and Child Development
Success Works Academy (K‐12)West Central School (K‐12)
Noble ES
111
Elementary and K‐8/K‐12 Schools of Attendance
Duxberry Park ESFairwood ESHamilton ES
Indian Springs ElSSouth Mifflin ES
Success Works Academy (K‐12)West Central School (K‐12)
Noble ES
11111111
Elementary and K‐8/K‐12 Schools of Attendance
A li P k ESBroadleigh ESColerain ES
Columbus Humanities, Arts, and Technology Academy (K‐8)Columbus Prep Academy (K‐8)
Cranbrook ESDuxberry Park ES
Fairwood ESHamilton ES
Indian Springs ElSSouth Mifflin ES
Success Works Academy (K‐12)West Central School (K‐12)
Noble ES
11111111111111
Elementary and K‐8/K‐12 Schools of Attendance
Douglas ESFCI Academy (K‐12)
West Mound ESComo ES
Arlington Park ESBroadleigh ESColerain ES
Columbus Humanities, Arts, and Technology Academy (K‐8)Columbus Prep Academy (K‐8)
Cranbrook ESDuxberry Park ES
Fairwood ESHamilton ES
Indian Springs ElSSouth Mifflin ES
Success Works Academy (K‐12)West Central School (K‐12)
Noble ES
333211111111111111
Elementary and K‐8/K‐12 Schools of Attendance
W.C. Cupe (K‐8)Glacier Ridge ESOhio Avenue ES
Windsor ESClinton ESDouglas ES
FCI Academy (K‐12)West Mound ES
Como ESArlington Park ES
Broadleigh ESColerain ES
Columbus Humanities, Arts, and Technology Academy (K‐8)Columbus Prep Academy (K‐8)
Cranbrook ESDuxberry Park ES
Fairwood ESHamilton ES
Indian Springs ElSSouth Mifflin ES
Success Works Academy (K‐12)West Central School (K‐12)
Noble ES
65543333211111111111111
Elementary and K‐8/K‐12 Schools of Attendance
0 10 20 30 40 50 60
Weinland Park ESFifth Avenue ES
Hubbard ESW.C. Cupe (K‐8)Glacier Ridge ESOhio Avenue ES
Windsor ESClinton ESDouglas ES
FCI Academy (K‐12)West Mound ES
Como ESArlington Park ES
Broadleigh ESColerain ES
Columbus Humanities, Arts, and Technology Academy (K‐8)Columbus Prep Academy (K‐8)
Cranbrook ESDuxberry Park ES
Fairwood ESHamilton ES
Indian Springs ElSSouth Mifflin ES
Success Works Academy (K‐12)West Central School (K‐12)
Noble ES
397665543333211111111111111
Percent
Elementary and K‐8/K‐12 Schools of Attendance
Total Number of Children = 100
53

Weinland Park Survey: Schoenbaum Family Center Children and Child Development
Middle Schools of Attendance High Schools of Attendance
Columbus Collegiate Academy
Dominion MS
1
1
Middle Schools of Attendance
Linden McKinley …
Northland HS
Rosemont HS
1
1
1
High Schools of Attendance
Ridgeview MS
Clearbrook MS
Columbus Collegiate Academy
Dominion MS
2
1
1
1
Middle Schools of Attendance
Centennial HS
DH Franklin County
Independence HS
Linden McKinley …
Northland HS
Rosemont HS
1
1
1
1
1
1
High Schools of Attendance
Monroe MS
Mifflin MS
Ridgeview MS
Clearbrook MS
Columbus Collegiate Academy
Dominion MS
3
2
2
1
1
1
Middle Schools of Attendance
Fort Hayes HS
Mifflin HS
Brookhaven HS
Centennial HS
DH Franklin County
Independence HS
Linden McKinley …
Northland HS
Rosemont HS
2
2
1
1
1
1
1
1
1
High Schools of Attendance
Indianola MS
Aims MS
Monroe MS
Mifflin MS
Ridgeview MS
Clearbrook MS
Columbus Collegiate Academy
Dominion MS
19
4
3
2
2
1
1
1
Middle Schools of Attendance
Whetstone HS
Afrocentric HS
East HS
Fort Hayes HS
Mifflin HS
Brookhaven HS
Centennial HS
DH Franklin County
Independence HS
Linden McKinley …
Northland HS
Rosemont HS
3
2
2
2
2
1
1
1
1
1
1
1
High Schools of Attendance
0 10 20 30 40 50 60
Indianola MS
Aims MS
Monroe MS
Mifflin MS
Ridgeview MS
Clearbrook MS
Columbus Collegiate Academy
Dominion MS
19
4
3
2
2
1
1
1
Percent
Middle Schools of Attendance
Total Number of Children = 33
0 20 40 60
Metro HS
Whetstone HS
Afrocentric HS
East HS
Fort Hayes HS
Mifflin HS
Brookhaven HS
Centennial HS
DH Franklin County
Independence HS
Linden McKinley …
Northland HS
Rosemont HS
5
3
2
2
2
2
1
1
1
1
1
1
1
Percent
High Schools of Attendance
Total Number of Children = 23
54
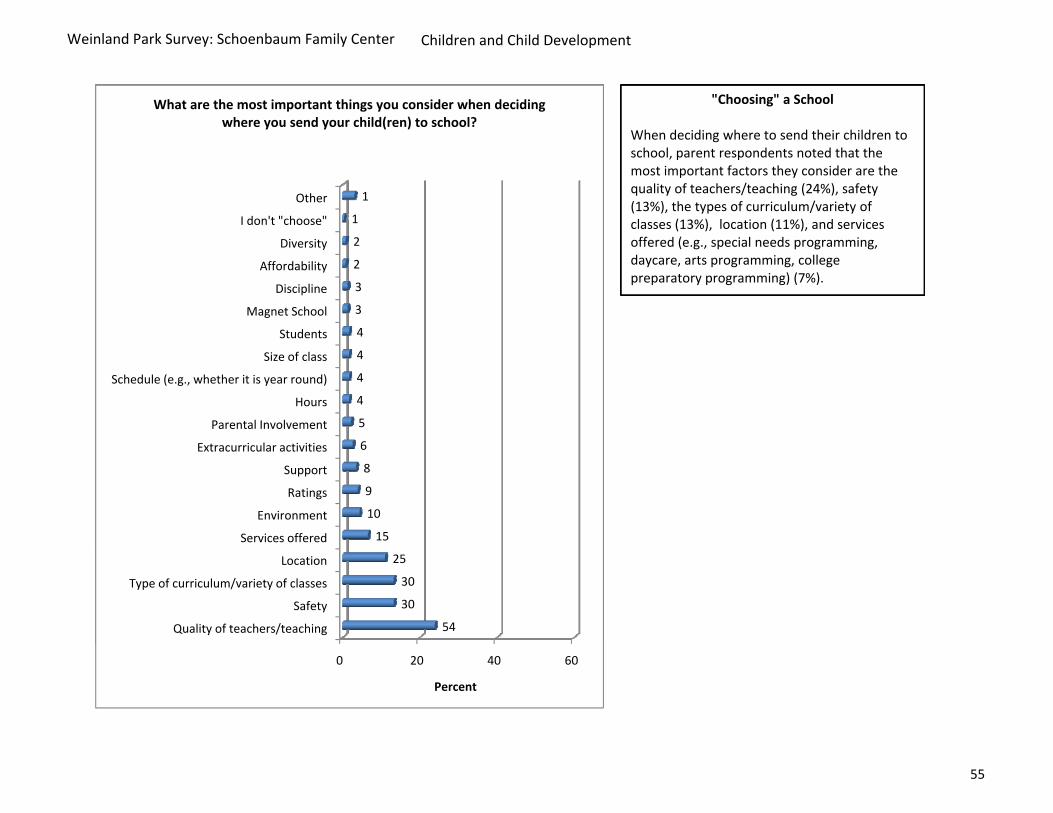
Weinland Park Survey: Schoenbaum Family Center Children and Child Development
What are the most important things you consider when deciding where you send your child(ren) to school?
"Choosing" a School
When deciding where to send their children to school, parent respondents noted that the most important factors they consider are the
lit f t h /t hi (24%) f t
Affordability
Diversity
I don't "choose"
Other
2
2
1
1
What are the most important things you consider when deciding where you send your child(ren) to school?
"Choosing" a School
When deciding where to send their children to school, parent respondents noted that the most important factors they consider are the quality of teachers/teaching (24%), safety (13%), the types of curriculum/variety of classes (13%), location (11%), and services offered (e.g., special needs programming, daycare, arts programming, college preparatory programming) (7%).
S h d l ( h th it i d)
Size of class
Students
Magnet School
Discipline
Affordability
Diversity
I don't "choose"
Other
4
4
4
3
3
2
2
1
1
What are the most important things you consider when deciding where you send your child(ren) to school?
"Choosing" a School
When deciding where to send their children to school, parent respondents noted that the most important factors they consider are the quality of teachers/teaching (24%), safety (13%), the types of curriculum/variety of classes (13%), location (11%), and services offered (e.g., special needs programming, daycare, arts programming, college preparatory programming) (7%).
Extracurricular activities
Parental Involvement
Hours
Schedule (e.g., whether it is year round)
Size of class
Students
Magnet School
Discipline
Affordability
Diversity
I don't "choose"
Other
6
5
4
4
4
4
3
3
2
2
1
1
What are the most important things you consider when deciding where you send your child(ren) to school?
"Choosing" a School
When deciding where to send their children to school, parent respondents noted that the most important factors they consider are the quality of teachers/teaching (24%), safety (13%), the types of curriculum/variety of classes (13%), location (11%), and services offered (e.g., special needs programming, daycare, arts programming, college preparatory programming) (7%).
Services offered
Environment
Ratings
Support
Extracurricular activities
Parental Involvement
Hours
Schedule (e.g., whether it is year round)
Size of class
Students
Magnet School
Discipline
Affordability
Diversity
I don't "choose"
Other
15
10
9
8
6
5
4
4
4
4
3
3
2
2
1
1
What are the most important things you consider when deciding where you send your child(ren) to school?
"Choosing" a School
When deciding where to send their children to school, parent respondents noted that the most important factors they consider are the quality of teachers/teaching (24%), safety (13%), the types of curriculum/variety of classes (13%), location (11%), and services offered (e.g., special needs programming, daycare, arts programming, college preparatory programming) (7%).
Quality of teachers/teaching
Safety
Type of curriculum/variety of classes
Location
Services offered
Environment
Ratings
Support
Extracurricular activities
Parental Involvement
Hours
Schedule (e.g., whether it is year round)
Size of class
Students
Magnet School
Discipline
Affordability
Diversity
I don't "choose"
Other
54
30
30
25
15
10
9
8
6
5
4
4
4
4
3
3
2
2
1
1
What are the most important things you consider when deciding where you send your child(ren) to school?
"Choosing" a School
When deciding where to send their children to school, parent respondents noted that the most important factors they consider are the quality of teachers/teaching (24%), safety (13%), the types of curriculum/variety of classes (13%), location (11%), and services offered (e.g., special needs programming, daycare, arts programming, college preparatory programming) (7%).
0 20 40 60
Quality of teachers/teaching
Safety
Type of curriculum/variety of classes
Location
Services offered
Environment
Ratings
Support
Extracurricular activities
Parental Involvement
Hours
Schedule (e.g., whether it is year round)
Size of class
Students
Magnet School
Discipline
Affordability
Diversity
I don't "choose"
Other
54
30
30
25
15
10
9
8
6
5
4
4
4
4
3
3
2
2
1
1
Percent
What are the most important things you consider when deciding where you send your child(ren) to school?
"Choosing" a School
When deciding where to send their children to school, parent respondents noted that the most important factors they consider are the quality of teachers/teaching (24%), safety (13%), the types of curriculum/variety of classes (13%), location (11%), and services offered (e.g., special needs programming, daycare, arts programming, college preparatory programming) (7%).
55
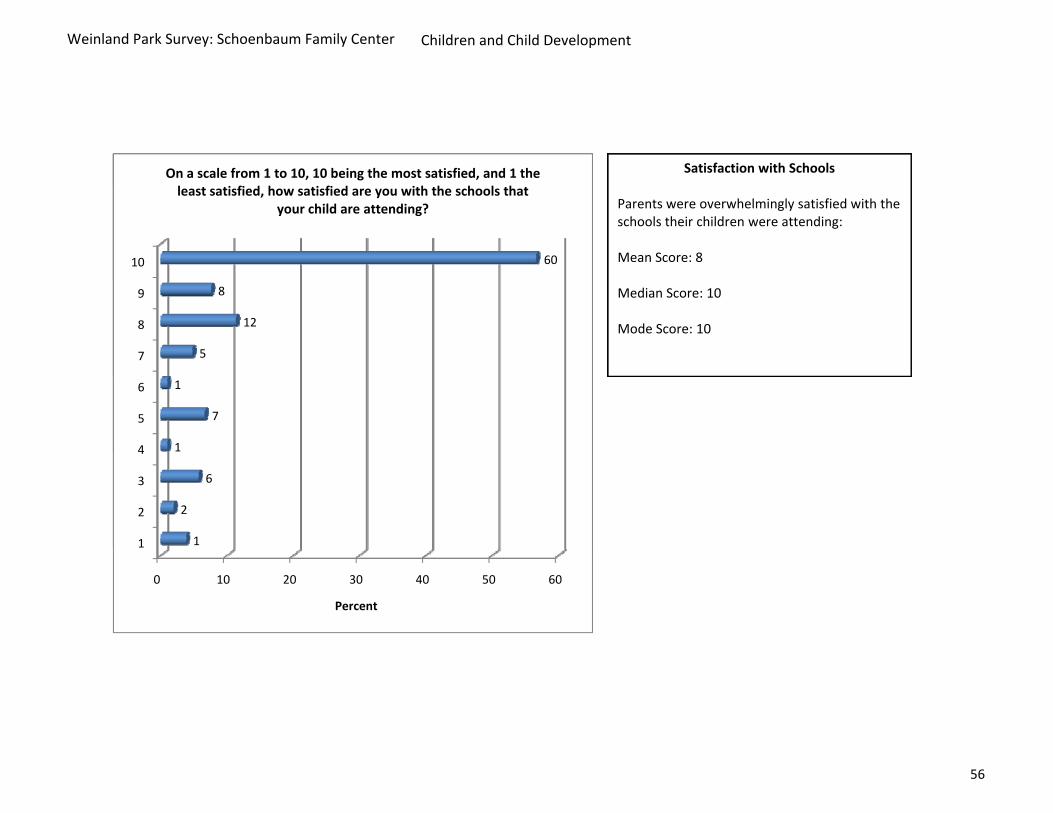
Weinland Park Survey: Schoenbaum Family Center Children and Child Development
Satisfaction with SchoolsOn a scale from 1 to 10, 10 being the most satisfied, and 1 the l i fi d h i fi d i h h h l h
Satisfaction with Schools
Parents were overwhelmingly satisfied with the schools their children were attending:
Mean Score: 810 60
On a scale from 1 to 10, 10 being the most satisfied, and 1 the least satisfied, how satisfied are you with the schools that
your child are attending?
Satisfaction with Schools
Parents were overwhelmingly satisfied with the schools their children were attending:
Mean Score: 8
Median Score: 10
Mode Score: 10
7
8
9
10
5
12
8
60
On a scale from 1 to 10, 10 being the most satisfied, and 1 the least satisfied, how satisfied are you with the schools that
your child are attending?
Satisfaction with Schools
Parents were overwhelmingly satisfied with the schools their children were attending:
Mean Score: 8
Median Score: 10
Mode Score: 10
4
5
6
7
8
9
10
1
7
1
5
12
8
60
On a scale from 1 to 10, 10 being the most satisfied, and 1 the least satisfied, how satisfied are you with the schools that
your child are attending?
Satisfaction with Schools
Parents were overwhelmingly satisfied with the schools their children were attending:
Mean Score: 8
Median Score: 10
Mode Score: 10
1
2
3
4
5
6
7
8
9
10
1
2
6
1
7
1
5
12
8
60
On a scale from 1 to 10, 10 being the most satisfied, and 1 the least satisfied, how satisfied are you with the schools that
your child are attending?
Satisfaction with Schools
Parents were overwhelmingly satisfied with the schools their children were attending:
Mean Score: 8
Median Score: 10
Mode Score: 10
0 10 20 30 40 50 60
1
2
3
4
5
6
7
8
9
10
1
2
6
1
7
1
5
12
8
60
Percent
On a scale from 1 to 10, 10 being the most satisfied, and 1 the least satisfied, how satisfied are you with the schools that
your child are attending?
56

Weinland Park Survey: Schoenbaum Family Center Children and Child Development
Interaction with Schools
Parents varied in their time spent involved in school activities, with only a few reporting they never participated.
77%
2627%
How often do you participate in school events/programs? Interaction with Schools
Parents varied in their time spent involved in school activities, with only a few reporting they never participated.
A majority of interactions with schools were meetings/phone calls/emails with teachers and principals (35%) or attendance at school events (27%).
77%
3436%
2830%
2627%
How often do you participate in school events/programs?
Never
A few times per year
Once a month
At least once a week
Interaction with Schools
Parents varied in their time spent involved in school activities, with only a few reporting they never participated.
A majority of interactions with schools were meetings/phone calls/emails with teachers and principals (35%) or attendance at school events (27%).
77%
3436%
2830%
2627%
How often do you participate in school events/programs?
Never
A few times per year
Once a month
At least once a week
Other
N/A ‐‐ I am not involved
9
10
Describe your interactions with your child(rens)'s school's.
Interaction with Schools
Parents varied in their time spent involved in school activities, with only a few reporting they never participated.
A majority of interactions with schools were meetings/phone calls/emails with teachers and principals (35%) or attendance at school events (27%).
77%
3436%
2830%
2627%
How often do you participate in school events/programs?
Never
A few times per year
Once a month
At least once a week
Involvement with the Parent Teacher Association (PTA)
Volunteer
Involvement with extracurricular activities
Behavioral interventions
Other
N/A ‐‐ I am not involved
19
10
8
3
9
10
Describe your interactions with your child(rens)'s school's.
Interaction with Schools
Parents varied in their time spent involved in school activities, with only a few reporting they never participated.
A majority of interactions with schools were meetings/phone calls/emails with teachers and principals (35%) or attendance at school events (27%).
77%
3436%
2830%
2627%
How often do you participate in school events/programs?
Never
A few times per year
Once a month
At least once a week
0 10 20 30 40 50 60
Meetings/phone calls/emails with teachers or principal
Attendance at school events
Daily checking on child's progress through homework folder
Involvement with the Parent Teacher Association (PTA)
Volunteer
Involvement with extracurricular activities
Behavioral interventions
Other
N/A ‐‐ I am not involved
78
59
27
19
10
8
3
9
10
Percent
Describe your interactions with your child(rens)'s school's.
57

Weinland Park Survey: Schoenbaum Family Center Children and Child Development
If you would like to be involved what keeps you from Parents who reported not being very involved
Other 7
If you would like to be involved, what keeps you from being more involved with your child(ren)'s school?
Parents who reported not being very involved or wanting to be more involved reported that a lack of time (30%) or simply not wanting to be more involved (26%) as the major reasons.
Lack of communication
Stress
Timing
Other
3
2
2
7
If you would like to be involved, what keeps you from being more involved with your child(ren)'s school?
Parents who reported not being very involved or wanting to be more involved reported that a lack of time (30%) or simply not wanting to be more involved (26%) as the major reasons.
Health
Childcare
They don't speak my language
Lack of communication
Stress
Timing
Other
8
5
4
3
2
2
7
If you would like to be involved, what keeps you from being more involved with your child(ren)'s school?
Parents who reported not being very involved or wanting to be more involved reported that a lack of time (30%) or simply not wanting to be more involved (26%) as the major reasons.
Lack of time
N/A ‐ "I don't want to be involved"
Transportation barriers
Health
Childcare
They don't speak my language
Lack of communication
Stress
Timing
Other
34
29
19
8
5
4
3
2
2
7
If you would like to be involved, what keeps you from being more involved with your child(ren)'s school?
Parents who reported not being very involved or wanting to be more involved reported that a lack of time (30%) or simply not wanting to be more involved (26%) as the major reasons.
0 10 20 30 40 50 60
Lack of time
N/A ‐ "I don't want to be involved"
Transportation barriers
Health
Childcare
They don't speak my language
Lack of communication
Stress
Timing
Other
34
29
19
8
5
4
3
2
2
7
Percent
If you would like to be involved, what keeps you from being more involved with your child(ren)'s school?
Parents who reported not being very involved or wanting to be more involved reported that a lack of time (30%) or simply not wanting to be more involved (26%) as the major reasons.
58

Weinland Park Survey: Schoenbaum Family Center Children and Child Development
Extracurricular Activities
47% of respondents' children were involved in extracurricular activities.
Other
2
2
What keeps your child(ren) from participating in extracurricular activities?Extracurricular Activities
47% of respondents' children were involved in extracurricular activities.
The top reasons respondents reported their children were'nt involved in extracurricular activities
Lack of Organized Activities
Parental Priorities
Health
Other
3
2
2
2
What keeps your child(ren) from participating in extracurricular activities?Extracurricular Activities
47% of respondents' children were involved in extracurricular activities.
The top reasons respondents reported their children were'nt involved in extracurricular activities included their children being too young, lack of time, financial barriers, or transportation barriers.
Time of Day (e.g., conflict with parent's work)
Behavior Problems
Safety
Lack of Organized Activities
Parental Priorities
Health
Other
4
3
3
3
2
2
2
What keeps your child(ren) from participating in extracurricular activities?Extracurricular Activities
47% of respondents' children were involved in extracurricular activities.
The top reasons respondents reported their children were'nt involved in extracurricular activities included their children being too young, lack of time, financial barriers, or transportation barriers.
Child(ren) is/are uninterested
Uninformed
Time of Day (e.g., conflict with parent's work)
Behavior Problems
Safety
Lack of Organized Activities
Parental Priorities
Health
Other
5
4
4
3
3
3
2
2
2
What keeps your child(ren) from participating in extracurricular activities?Extracurricular Activities
47% of respondents' children were involved in extracurricular activities.
The top reasons respondents reported their children were'nt involved in extracurricular activities included their children being too young, lack of time, financial barriers, or transportation barriers.
Lack of Time
Financial Barriers
Transportation Barriers
Child(ren) is/are uninterested
Uninformed
Time of Day (e.g., conflict with parent's work)
Behavior Problems
Safety
Lack of Organized Activities
Parental Priorities
Health
Other
10
10
8
5
4
4
3
3
3
2
2
2
What keeps your child(ren) from participating in extracurricular activities?Extracurricular Activities
47% of respondents' children were involved in extracurricular activities.
The top reasons respondents reported their children were'nt involved in extracurricular activities included their children being too young, lack of time, financial barriers, or transportation barriers.
0 20 40 60
Too Young
Lack of Time
Financial Barriers
Transportation Barriers
Child(ren) is/are uninterested
Uninformed
Time of Day (e.g., conflict with parent's work)
Behavior Problems
Safety
Lack of Organized Activities
Parental Priorities
Health
Other
31
10
10
8
5
4
4
3
3
3
2
2
2
Percent
What keeps your child(ren) from participating in extracurricular activities?
59

Weinland Park Survey: Schoenbaum Family Center Children and Child Development
The top ways children spenttheir free time were playing outside the house (yard, neighborhood) (21%), playing in the house (16%), watching TV (11%) visitingListening to Music
Other
1
5
How do your children spend their free time? The top ways children spenttheir free time were playing outside the house (yard, neighborhood) (21%), playing in the house (16%), watching TV (11%), visiting with family members (10%), and gaming (gaming system, computer) (9%).
Church/Mosque/Synnagogue
Working
Movies/Out to Eat
COSI/Conservatory
Listening to Music
Other
2
2
2
2
2
1
5
How do your children spend their free time? The top ways children spenttheir free time were playing outside the house (yard, neighborhood) (21%), playing in the house (16%), watching TV (11%), visiting with family members (10%), and gaming (gaming system, computer) (9%).
Academic activties/Educational games
Club
With Mentor
Cooking/Gardening (not as a chore)
Sports
Church/Mosque/Synnagogue
Working
Movies/Out to Eat
COSI/Conservatory
Listening to Music
Other
5
3
3
3
2
2
2
2
2
1
5
How do your children spend their free time? The top ways children spenttheir free time were playing outside the house (yard, neighborhood) (21%), playing in the house (16%), watching TV (11%), visiting with family members (10%), and gaming (gaming system, computer) (9%).
C t
Reading
Biking
Chores
Academic activties/Educational games
Club
With Mentor
Cooking/Gardening (not as a chore)
Sports
Church/Mosque/Synnagogue
Working
Movies/Out to Eat
COSI/Conservatory
Listening to Music
Other
11
6
5
5
5
3
3
3
2
2
2
2
2
1
5
How do your children spend their free time? The top ways children spenttheir free time were playing outside the house (yard, neighborhood) (21%), playing in the house (16%), watching TV (11%), visiting with family members (10%), and gaming (gaming system, computer) (9%).
Gaming
Park/Recreation Center
Homework
Library
Computer
Reading
Biking
Chores
Academic activties/Educational games
Club
With Mentor
Cooking/Gardening (not as a chore)
Sports
Church/Mosque/Synnagogue
Working
Movies/Out to Eat
COSI/Conservatory
Listening to Music
Other
25
16
14
12
11
6
5
5
5
3
3
3
2
2
2
2
2
1
5
How do your children spend their free time? The top ways children spenttheir free time were playing outside the house (yard, neighborhood) (21%), playing in the house (16%), watching TV (11%), visiting with family members (10%), and gaming (gaming system, computer) (9%).
0 10 20 30 40 50 60
Playing outside of the home
Playing in the house
TV
Visiting family members
Gaming
Park/Recreation Center
Homework
Library
Computer
Reading
Biking
Chores
Academic activties/Educational games
Club
With Mentor
Cooking/Gardening (not as a chore)
Sports
Church/Mosque/Synnagogue
Working
Movies/Out to Eat
COSI/Conservatory
Listening to Music
Other
51
45
31
30
25
16
14
12
11
6
5
5
5
3
3
3
2
2
2
2
2
1
5
Percent
How do your children spend their free time?
60
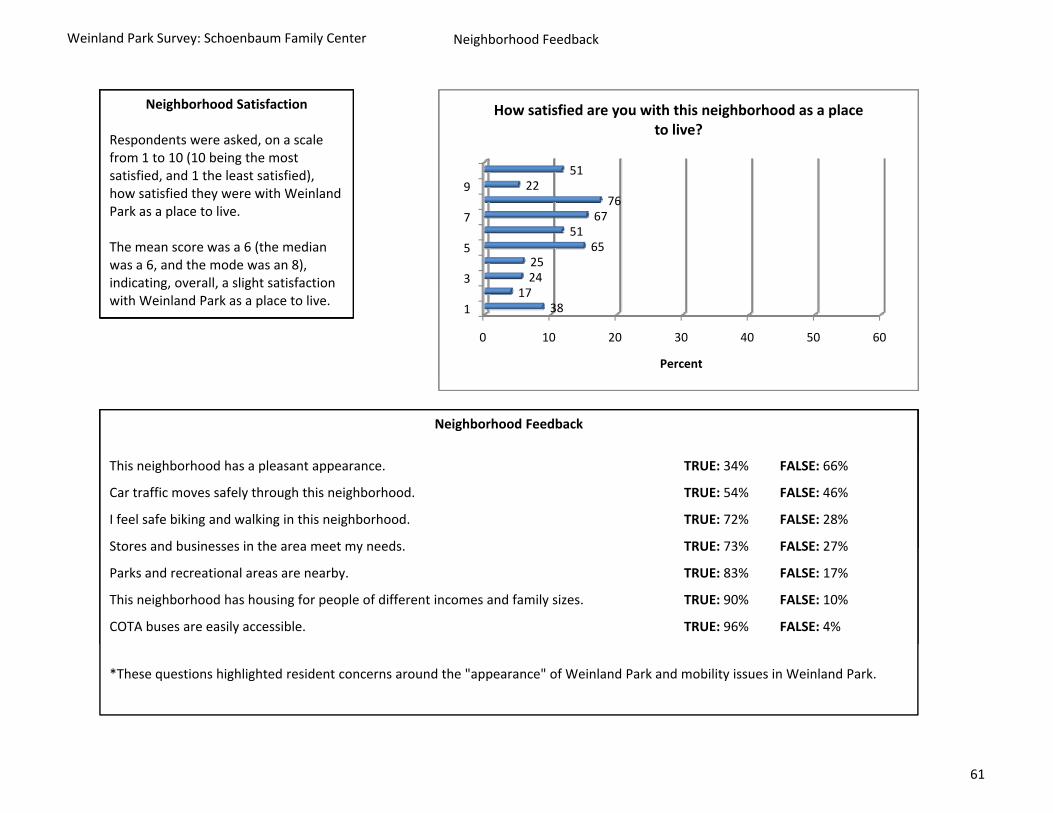
Weinland Park Survey: Schoenbaum Family Center Neighborhood Feedback
9 2251
How satisfied are you with this neighborhood as a place to live?
Neighborhood Satisfaction
Respondents were asked, on a scale from 1 to 10 (10 being the most satisfied, and 1 the least satisfied),
3
5
7
9
2425
6551
6776
2251
How satisfied are you with this neighborhood as a place to live?
Neighborhood Satisfaction
Respondents were asked, on a scale from 1 to 10 (10 being the most satisfied, and 1 the least satisfied), how satisfied they were with Weinland Park as a place to live.
The mean score was a 6 (the median was a 6, and the mode was an 8), indicating overall a slight satisfaction
0 10 20 30 40 50 60
1
3
5
7
9
38172425
6551
6776
2251
Percent
How satisfied are you with this neighborhood as a place to live?
Neighborhood Satisfaction
Respondents were asked, on a scale from 1 to 10 (10 being the most satisfied, and 1 the least satisfied), how satisfied they were with Weinland Park as a place to live.
The mean score was a 6 (the median was a 6, and the mode was an 8), indicating, overall, a slight satisfaction with Weinland Park as a place to live.
Neighborhood Feedback
This neighborhood has a pleasant appearance. TRUE: 34% FALSE: 66%
Car traffic moves safely through this neighborhood. TRUE: 54% FALSE: 46%
I feel safe biking and walking in this neighborhood. TRUE: 72% FALSE: 28%
Stores and businesses in the area meet my needs TRUE: 73% FALSE: 27%
0 10 20 30 40 50 60
1
3
5
7
9
38172425
6551
6776
2251
Percent
How satisfied are you with this neighborhood as a place to live?
Neighborhood Satisfaction
Respondents were asked, on a scale from 1 to 10 (10 being the most satisfied, and 1 the least satisfied), how satisfied they were with Weinland Park as a place to live.
The mean score was a 6 (the median was a 6, and the mode was an 8), indicating, overall, a slight satisfaction with Weinland Park as a place to live.
Neighborhood Feedback
This neighborhood has a pleasant appearance. TRUE: 34% FALSE: 66%
Car traffic moves safely through this neighborhood. TRUE: 54% FALSE: 46%
I feel safe biking and walking in this neighborhood. TRUE: 72% FALSE: 28%
Stores and businesses in the area meet my needs. TRUE: 73% FALSE: 27%
Parks and recreational areas are nearby. TRUE: 83% FALSE: 17%
This neighborhood has housing for people of different incomes and family sizes. TRUE: 90% FALSE: 10%
COTA buses are easily accessible. TRUE: 96% FALSE: 4%
*These questions highlighted resident concerns around the "appearance" of Weinland Park and mobility issues in Weinland Park.
61

Weinland Park Survey: Schoenbaum Family Center Neighborhood Feedback
Neighborhood Change
Respondents who had lived in Weinland Park for two years or more were asked whether conditions have gotten better, worse, or haven't changed much
2911%
Over the past two years have living conditions gotten better, worse, or have they not changed much?
Neighborhood Change
Respondents who had lived in Weinland Park for two years or more were asked whether conditions have gotten better, worse, or haven't changed much.
A majority (55%) felt that conditions in Weinland Park had improved.
2911%
8734%140
55%
Over the past two years have living conditions gotten better, worse, or have they not changed much?
Worse
Not changed much
Better
Resident Voice
Neighborhood Change
Respondents who had lived in Weinland Park for two years or more were asked whether conditions have gotten better, worse, or haven't changed much.
A majority (55%) felt that conditions in Weinland Park had improved.
2911%
8734%140
55%
Over the past two years have living conditions gotten better, worse, or have they not changed much?
Worse
Not changed much
Better
81
5112%
How much does your voice matter in decisions affecting this neighborhood?
Resident Voice
A great majority of respondents felt there voice didn't matter (40%) or mattered little (29%) in decisions affecting Weinland Park
Neighborhood Change
Respondents who had lived in Weinland Park for two years or more were asked whether conditions have gotten better, worse, or haven't changed much.
A majority (55%) felt that conditions in Weinland Park had improved.
2911%
8734%140
55%
Over the past two years have living conditions gotten better, worse, or have they not changed much?
Worse
Not changed much
Better
16740%
12229%
8119%
5112%
How much does your voice matter in decisions affecting this neighborhood?
Not at all
A little
A fair amount
A t d l
Resident Voice
A great majority of respondents felt there voice didn't matter (40%) or mattered little (29%) in decisions affecting Weinland Park.
Neighborhood Change
Respondents who had lived in Weinland Park for two years or more were asked whether conditions have gotten better, worse, or haven't changed much.
A majority (55%) felt that conditions in Weinland Park had improved.
2911%
8734%140
55%
Over the past two years have living conditions gotten better, worse, or have they not changed much?
Worse
Not changed much
Better
16740%
12229%
8119%
5112%
How much does your voice matter in decisions affecting this neighborhood?
Not at all
A little
A fair amount
A great deal
Community Involvement
While a great majority of respondents reported not being involved in community organizing around new developments or neighborhood issues (75%), a majority (79%) noted they would be interested if the opportunity arose.
Resident Voice
A great majority of respondents felt there voice didn't matter (40%) or mattered little (29%) in decisions affecting Weinland Park.
62
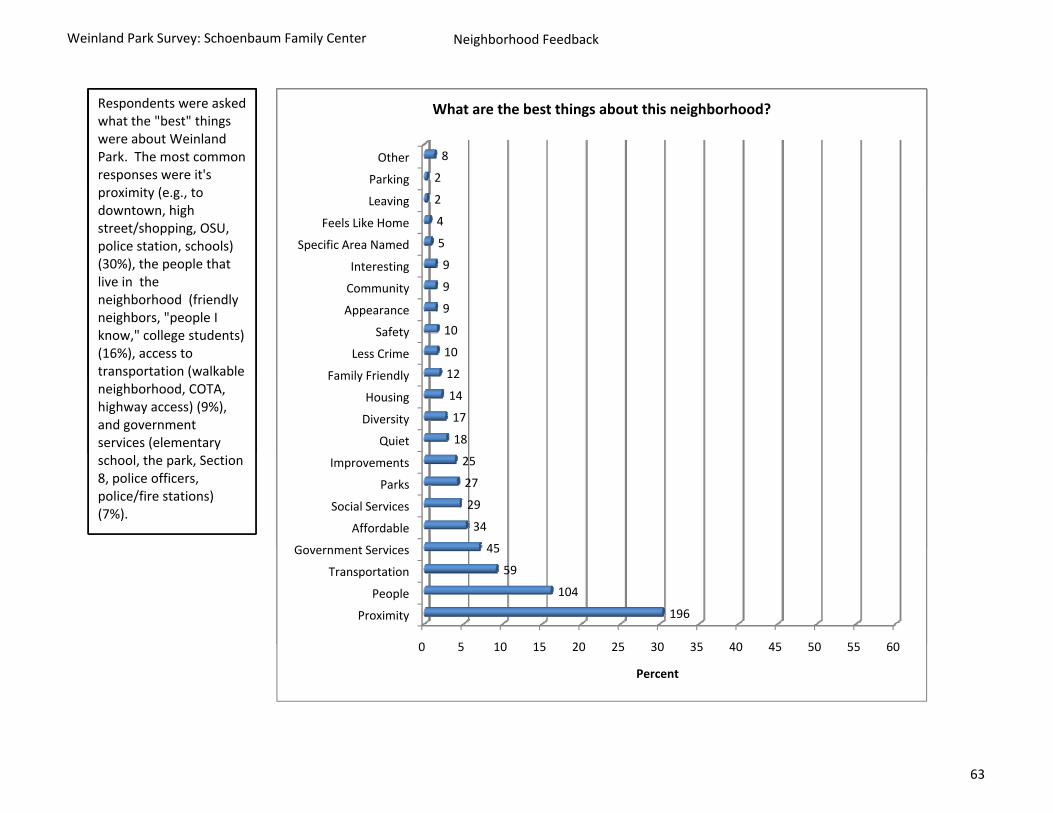
Weinland Park Survey: Schoenbaum Family Center Neighborhood Feedback
Parking
Other
2
8
What are the best things about this neighborhood?Respondents were asked what the "best" things were about Weinland Park. The most common responses were it's
Interesting
Specific Area Named
Feels Like Home
Leaving
Parking
Other
9
5
4
2
2
8
What are the best things about this neighborhood?Respondents were asked what the "best" things were about Weinland Park. The most common responses were it's proximity (e.g., to downtown, high street/shopping, OSU, police station, schools) (30%), the people that live in the
Family Friendly
Less Crime
Safety
Appearance
Community
Interesting
Specific Area Named
Feels Like Home
Leaving
Parking
Other
12
10
10
9
9
9
5
4
2
2
8
What are the best things about this neighborhood?Respondents were asked what the "best" things were about Weinland Park. The most common responses were it's proximity (e.g., to downtown, high street/shopping, OSU, police station, schools) (30%), the people that live in the neighborhood (friendly neighbors, "people I know," college students) (16%), access to transportation (walkable
Quiet
Diversity
Housing
Family Friendly
Less Crime
Safety
Appearance
Community
Interesting
Specific Area Named
Feels Like Home
Leaving
Parking
Other
18
17
14
12
10
10
9
9
9
5
4
2
2
8
What are the best things about this neighborhood?Respondents were asked what the "best" things were about Weinland Park. The most common responses were it's proximity (e.g., to downtown, high street/shopping, OSU, police station, schools) (30%), the people that live in the neighborhood (friendly neighbors, "people I know," college students) (16%), access to transportation (walkable neighborhood, COTA, highway access) (9%), and government services (elementary
Government Services
Affordable
Social Services
Parks
Improvements
Quiet
Diversity
Housing
Family Friendly
Less Crime
Safety
Appearance
Community
Interesting
Specific Area Named
Feels Like Home
Leaving
Parking
Other
45
34
29
27
25
18
17
14
12
10
10
9
9
9
5
4
2
2
8
What are the best things about this neighborhood?Respondents were asked what the "best" things were about Weinland Park. The most common responses were it's proximity (e.g., to downtown, high street/shopping, OSU, police station, schools) (30%), the people that live in the neighborhood (friendly neighbors, "people I know," college students) (16%), access to transportation (walkable neighborhood, COTA, highway access) (9%), and government services (elementary school, the park, Section 8, police officers, police/fire stations) (7%).
0 5 10 15 20 25 30 35 40 45 50 55 60
Proximity
People
Transportation
Government Services
Affordable
Social Services
Parks
Improvements
Quiet
Diversity
Housing
Family Friendly
Less Crime
Safety
Appearance
Community
Interesting
Specific Area Named
Feels Like Home
Leaving
Parking
Other
196
104
59
45
34
29
27
25
18
17
14
12
10
10
9
9
9
5
4
2
2
8
Percent
What are the best things about this neighborhood?Respondents were asked what the "best" things were about Weinland Park. The most common responses were it's proximity (e.g., to downtown, high street/shopping, OSU, police station, schools) (30%), the people that live in the neighborhood (friendly neighbors, "people I know," college students) (16%), access to transportation (walkable neighborhood, COTA, highway access) (9%), and government services (elementary school, the park, Section 8, police officers, police/fire stations) (7%).
63

Weinland Park Survey: Schoenbaum Family Center Neighborhood Feedback
Respondents were asked what the "worst" things were about Weinland Park. The most common responses were alcohol and drug use/dealing
Nothing105
What are the worst things about this neighborhood?Top Responses
Respondents were asked what the "worst" things were about Weinland Park. The most common responses were alcohol and drug use/dealing (14%), the crime (10%), the people (e.g., teenagers, negligent parents, noisy neighbors, "bad
Lack of Programming/Services
Lack of Community
Unemployment
Nothing
888654105
What are the worst things about this neighborhood?Top Responses
Respondents were asked what the "worst" things were about Weinland Park. The most common responses were alcohol and drug use/dealing (14%), the crime (10%), the people (e.g., teenagers, negligent parents, noisy neighbors, "bad people") (9%), litter (8%), guns/shootings (7%), and altercations/violence (6%).
L i i
Police
Poverty
Not Family Friendly
Lack of Programming/Services
Lack of Community
Unemployment
Nothing
1212121111109888654105
What are the worst things about this neighborhood?Top Responses
Respondents were asked what the "worst" things were about Weinland Park. The most common responses were alcohol and drug use/dealing (14%), the crime (10%), the people (e.g., teenagers, negligent parents, noisy neighbors, "bad people") (9%), litter (8%), guns/shootings (7%), and altercations/violence (6%).
Specific Area (e.g., 4th and 8th)
Night/Poor Lighting
Loitering
Police
Poverty
Not Family Friendly
Lack of Programming/Services
Lack of Community
Unemployment
Nothing
17171514141212121111109888654105
What are the worst things about this neighborhood?Top Responses
Respondents were asked what the "worst" things were about Weinland Park. The most common responses were alcohol and drug use/dealing (14%), the crime (10%), the people (e.g., teenagers, negligent parents, noisy neighbors, "bad people") (9%), litter (8%), guns/shootings (7%), and altercations/violence (6%).
Gangs
Noise
Traffic
Specific Area (e.g., 4th and 8th)
Night/Poor Lighting
Loitering
Police
Poverty
Not Family Friendly
Lack of Programming/Services
Lack of Community
Unemployment
Nothing
46292823191817171514141212121111109888654105
What are the worst things about this neighborhood?Top Responses
Respondents were asked what the "worst" things were about Weinland Park. The most common responses were alcohol and drug use/dealing (14%), the crime (10%), the people (e.g., teenagers, negligent parents, noisy neighbors, "bad people") (9%), litter (8%), guns/shootings (7%), and altercations/violence (6%).
Alcohol and Drugs
People
Guns and Shootings
Gangs
Noise
Traffic
Specific Area (e.g., 4th and 8th)
Night/Poor Lighting
Loitering
Police
Poverty
Not Family Friendly
Lack of Programming/Services
Lack of Community
Unemployment
Nothing
106736761
5146
292823191817171514141212121111109888654105
What are the worst things about this neighborhood?Top Responses
Respondents were asked what the "worst" things were about Weinland Park. The most common responses were alcohol and drug use/dealing (14%), the crime (10%), the people (e.g., teenagers, negligent parents, noisy neighbors, "bad people") (9%), litter (8%), guns/shootings (7%), and altercations/violence (6%).
0 10 20 30 40 50 60
Alcohol and Drugs
People
Guns and Shootings
Gangs
Noise
Traffic
Specific Area (e.g., 4th and 8th)
Night/Poor Lighting
Loitering
Police
Poverty
Not Family Friendly
Lack of Programming/Services
Lack of Community
Unemployment
Nothing
106736761
5146
292823191817171514141212121111109888654105
Percent
What are the worst things about this neighborhood?Top Responses
64

Weinland Park Survey: Schoenbaum Family Center Neighborhood Feedback
I d id
Improved/more specialized programming 10
10
If you were in charge, what improvements would you like to make in this neighborhood?Top Responses
Improved landscaping
Help homeless people
More and improved child care
Increased access to parking
Increased respect among residents
Improved/more specialized programming
12
10
10
10
10
10
If you were in charge, what improvements would you like to make in this neighborhood?Top Responses
More unity among neighbors
Stop loitering
More affordable housing
"Tear it all down and start over"
Increased access to healthy foods
Improved landscaping
Help homeless people
More and improved child care
Increased access to parking
Increased respect among residents
Improved/more specialized programming
20
19
17
13
12
12
10
10
10
10
10
If you were in charge, what improvements would you like to make in this neighborhood?Top Responses
Increased/improved parks, recreation facilities, green space
More employment opportunities
Push "hoodlums" out
Better access to a variety of stores/resaurants
More unity among neighbors
Stop loitering
More affordable housing
"Tear it all down and start over"
Increased access to healthy foods
Improved landscaping
Help homeless people
More and improved child care
Increased access to parking
Increased respect among residents
Improved/more specialized programming
33
27
23
20
20
19
17
13
12
12
10
10
10
10
10
If you were in charge, what improvements would you like to make in this neighborhood?Top Responses
More creative activities/outlets for children
Rid neighborhood of drugs
Renovate housing
Better roads/streets/sidewalks
"Better neighbors"
Increased/improved parks, recreation facilities, green space
More employment opportunities
Push "hoodlums" out
Better access to a variety of stores/resaurants
More unity among neighbors
Stop loitering
More affordable housing
"Tear it all down and start over"
Increased access to healthy foods
Improved landscaping
Help homeless people
More and improved child care
Increased access to parking
Increased respect among residents
Improved/more specialized programming
6060
56
38
34
33
27
23
20
20
19
17
13
12
12
10
10
10
10
10
If you were in charge, what improvements would you like to make in this neighborhood?Top Responses
Cleaner neighborhood
Greater safety
Improved police/city services
Demolition/renovation of vacant properties
More creative activities/outlets for children
Rid neighborhood of drugs
Renovate housing
Better roads/streets/sidewalks
"Better neighbors"
Increased/improved parks, recreation facilities, green space
More employment opportunities
Push "hoodlums" out
Better access to a variety of stores/resaurants
More unity among neighbors
Stop loitering
More affordable housing
"Tear it all down and start over"
Increased access to healthy foods
Improved landscaping
Help homeless people
More and improved child care
Increased access to parking
Increased respect among residents
Improved/more specialized programming
128
128
94
82
6060
56
38
34
33
27
23
20
20
19
17
13
12
12
10
10
10
10
10
If you were in charge, what improvements would you like to make in this neighborhood?Top Responses
0 10 20 30 40 50 60
Cleaner neighborhood
Greater safety
Improved police/city services
Demolition/renovation of vacant properties
More creative activities/outlets for children
Rid neighborhood of drugs
Renovate housing
Better roads/streets/sidewalks
"Better neighbors"
Increased/improved parks, recreation facilities, green space
More employment opportunities
Push "hoodlums" out
Better access to a variety of stores/resaurants
More unity among neighbors
Stop loitering
More affordable housing
"Tear it all down and start over"
Increased access to healthy foods
Improved landscaping
Help homeless people
More and improved child care
Increased access to parking
Increased respect among residents
Improved/more specialized programming
128
128
94
82
6060
56
38
34
33
27
23
20
20
19
17
13
12
12
10
10
10
10
10
Percent
If you were in charge, what improvements would you like to make in this neighborhood?Top Responses
65

Weinland Park Survey: Schoenbaum Family Center Neighborhood Feedback
Cleaner Neighborhood•Improve/increase trash pickup.•Improve/increase recycling services.•Get rid of big dumpsters.
Improved Police/City Services•Need a better/increased police presence.•Need policing center at the elementary school.•"Make the police do something about people getting jumped."
Neighborhood Feedback: Respondent Comments
66
Cleaner Neighborhood•Improve/increase trash pickup.•Improve/increase recycling services.•Get rid of big dumpsters.•Clean the alleys. •Clean up around dumpsters.•Get rid of rodents.•Enforce mandatory clean‐ups.•Enforce litter laws. "People should get a ticket for littering."" h ld h ld h l "
Improved Police/City Services•Need a better/increased police presence.•Need policing center at the elementary school.•"Make the police do something about people getting jumped."•"Cops are trippin'."•"We need friendlier police."
More Creative Activities/Outlets for Children•Increased activities for single mothers and their children.
d f
Neighborhood Feedback: Respondent Comments
Cleaner Neighborhood•Improve/increase trash pickup.•Improve/increase recycling services.•Get rid of big dumpsters.•Clean the alleys. •Clean up around dumpsters.•Get rid of rodents.•Enforce mandatory clean‐ups.•Enforce litter laws. "People should get a ticket for littering."•"Children should participate in trash clean up"•"Inmates should participate in trash clean up "
Greater Safety•Need walking security patrols.•Need block watch/neighborhood watch/community policing
Improved Police/City Services•Need a better/increased police presence.•Need policing center at the elementary school.•"Make the police do something about people getting jumped."•"Cops are trippin'."•"We need friendlier police."
More Creative Activities/Outlets for Children•Increased activities for single mothers and their children.•Increased programming for teens.•Increased activities for kids in the summer time.•"We need a positive peer groups for kids that allows them to build confidence and relationships."
•"We need more direction for young adults, and more •supervision for children "
Neighborhood Feedback: Respondent Comments
Cleaner Neighborhood•Improve/increase trash pickup.•Improve/increase recycling services.•Get rid of big dumpsters.•Clean the alleys. •Clean up around dumpsters.•Get rid of rodents.•Enforce mandatory clean‐ups.•Enforce litter laws. "People should get a ticket for littering."•"Children should participate in trash clean up"•"Inmates should participate in trash clean up "
Greater Safety•Need walking security patrols.•Need block watch/neighborhood watch/community policing.•Need surveillance in/around vacant buildings.•Staff the park 24/7 to help watch the kids.•Need security cameras for apartment complexes/buildings•Enforce curfews/truancy.
Improved Police/City Services•Need a better/increased police presence.•Need policing center at the elementary school.•"Make the police do something about people getting jumped."•"Cops are trippin'."•"We need friendlier police."
More Creative Activities/Outlets for Children•Increased activities for single mothers and their children.•Increased programming for teens.•Increased activities for kids in the summer time.•"We need a positive peer groups for kids that allows them to build confidence and relationships."
•"We need more direction for young adults, and more •supervision for children."•"We need more activities to keep young men out of trouble."•"Create day camps for the kids at risk."•"Expose children to other things outside of the neighborhood."•"We need opportunities for 14‐19 year old males."
Neighborhood Feedback: Respondent Comments
Cleaner Neighborhood•Improve/increase trash pickup.•Improve/increase recycling services.•Get rid of big dumpsters.•Clean the alleys. •Clean up around dumpsters.•Get rid of rodents.•Enforce mandatory clean‐ups.•Enforce litter laws. "People should get a ticket for littering."•"Children should participate in trash clean up"•"Inmates should participate in trash clean up "
Greater Safety•Need walking security patrols.•Need block watch/neighborhood watch/community policing.•Need surveillance in/around vacant buildings.•Staff the park 24/7 to help watch the kids.•Need security cameras for apartment complexes/buildings•Enforce curfews/truancy.•Need more emergency lights (blue‐light call stations).•Enforce harsher punishments for crimes.•Handle domestic disputes.•Get rid of gangs.•Get more people to report crime.
Improved Police/City Services•Need a better/increased police presence.•Need policing center at the elementary school.•"Make the police do something about people getting jumped."•"Cops are trippin'."•"We need friendlier police."
More Creative Activities/Outlets for Children•Increased activities for single mothers and their children.•Increased programming for teens.•Increased activities for kids in the summer time.•"We need a positive peer groups for kids that allows them to build confidence and relationships."
•"We need more direction for young adults, and more •supervision for children."•"We need more activities to keep young men out of trouble."•"Create day camps for the kids at risk."•"Expose children to other things outside of the neighborhood."•"We need opportunities for 14‐19 year old males."•"We need more ways for adults to keep teens in school."
Renovate Housing•"Stop development and re‐invest money into community programs and fix existing housing up."
Neighborhood Feedback: Respondent Comments
Cleaner Neighborhood•Improve/increase trash pickup.•Improve/increase recycling services.•Get rid of big dumpsters.•Clean the alleys. •Clean up around dumpsters.•Get rid of rodents.•Enforce mandatory clean‐ups.•Enforce litter laws. "People should get a ticket for littering."•"Children should participate in trash clean up"•"Inmates should participate in trash clean up "
Greater Safety•Need walking security patrols.•Need block watch/neighborhood watch/community policing.•Need surveillance in/around vacant buildings.•Staff the park 24/7 to help watch the kids.•Need security cameras for apartment complexes/buildings•Enforce curfews/truancy.•Need more emergency lights (blue‐light call stations).•Enforce harsher punishments for crimes.•Handle domestic disputes.•Get rid of gangs.•Get more people to report crime.•Address issues at 4th and 8th.•Make neighborhood safer for vehicles.•"Make it so people aren't scared when they come to the Short North."
•"Make it an emotionally stable place to live."•"Screen new tenants to insure they aren't trouble makers "
Improved Police/City Services•Need a better/increased police presence.•Need policing center at the elementary school.•"Make the police do something about people getting jumped."•"Cops are trippin'."•"We need friendlier police."
More Creative Activities/Outlets for Children•Increased activities for single mothers and their children.•Increased programming for teens.•Increased activities for kids in the summer time.•"We need a positive peer groups for kids that allows them to build confidence and relationships."
•"We need more direction for young adults, and more •supervision for children."•"We need more activities to keep young men out of trouble."•"Create day camps for the kids at risk."•"Expose children to other things outside of the neighborhood."•"We need opportunities for 14‐19 year old males."•"We need more ways for adults to keep teens in school."
Renovate Housing•"Stop development and re‐invest money into community programs and fix existing housing up."
•"Redo housing on 11th Avenue and let people (CPO residents) come back home. "
•"Put in green buildings."•"Knock down buildings and make nice apartments."•"I would re‐do every house and apartment. "•" You can fix it up without gentrification "
Neighborhood Feedback: Respondent Comments
Cleaner Neighborhood•Improve/increase trash pickup.•Improve/increase recycling services.•Get rid of big dumpsters.•Clean the alleys. •Clean up around dumpsters.•Get rid of rodents.•Enforce mandatory clean‐ups.•Enforce litter laws. "People should get a ticket for littering."•"Children should participate in trash clean up"•"Inmates should participate in trash clean up "
Greater Safety•Need walking security patrols.•Need block watch/neighborhood watch/community policing.•Need surveillance in/around vacant buildings.•Staff the park 24/7 to help watch the kids.•Need security cameras for apartment complexes/buildings•Enforce curfews/truancy.•Need more emergency lights (blue‐light call stations).•Enforce harsher punishments for crimes.•Handle domestic disputes.•Get rid of gangs.•Get more people to report crime.•Address issues at 4th and 8th.•Make neighborhood safer for vehicles.•"Make it so people aren't scared when they come to the Short North."
•"Make it an emotionally stable place to live."•"Screen new tenants to insure they aren't trouble makers."•"Tell people to straighten up, move if you don’t stop."
Improved Police/City Services•Need a better/increased police presence.•Need policing center at the elementary school.•"Make the police do something about people getting jumped."•"Cops are trippin'."•"We need friendlier police."
More Creative Activities/Outlets for Children•Increased activities for single mothers and their children.•Increased programming for teens.•Increased activities for kids in the summer time.•"We need a positive peer groups for kids that allows them to build confidence and relationships."
•"We need more direction for young adults, and more •supervision for children."•"We need more activities to keep young men out of trouble."•"Create day camps for the kids at risk."•"Expose children to other things outside of the neighborhood."•"We need opportunities for 14‐19 year old males."•"We need more ways for adults to keep teens in school."
Renovate Housing•"Stop development and re‐invest money into community programs and fix existing housing up."
•"Redo housing on 11th Avenue and let people (CPO residents) come back home. "
•"Put in green buildings."•"Knock down buildings and make nice apartments."•"I would re‐do every house and apartment. "•" You can fix it up without gentrification."
Neighborhood Feedback: Respondent Comments
66
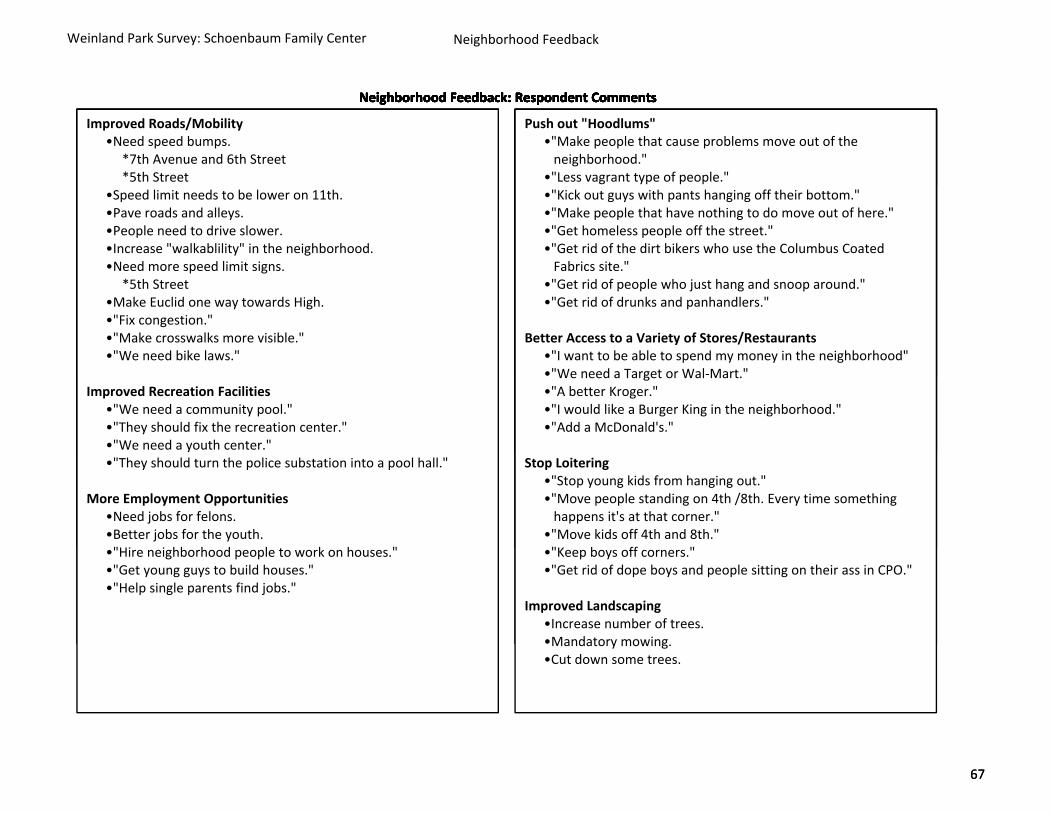
Weinland Park Survey: Schoenbaum Family Center Neighborhood Feedback
Improved Roads/Mobility•Need speed bumps.
*7th Avenue and 6th Street*5th Street
Push out "Hoodlums"•"Make people that cause problems move out of the neighborhood."
•"Less vagrant type of people."
Neighborhood Feedback: Respondent Comments
67
Improved Roads/Mobility•Need speed bumps.
*7th Avenue and 6th Street*5th Street
•Speed limit needs to be lower on 11th.•Pave roads and alleys.•People need to drive slower.•Increase "walkablility" in the neighborhood.•Need more speed limit signs.
*5th St t
Push out "Hoodlums"•"Make people that cause problems move out of the neighborhood."
•"Less vagrant type of people."•"Kick out guys with pants hanging off their bottom."•"Make people that have nothing to do move out of here."•"Get homeless people off the street."•"Get rid of the dirt bikers who use the Columbus Coated Fabrics site.""G t id f l h j t h d d "
Neighborhood Feedback: Respondent Comments
Improved Roads/Mobility•Need speed bumps.
*7th Avenue and 6th Street*5th Street
•Speed limit needs to be lower on 11th.•Pave roads and alleys.•People need to drive slower.•Increase "walkablility" in the neighborhood.•Need more speed limit signs.
*5th Street•Make Euclid one way towards High.•"Fix congestion."•"Make crosswalks more visible."•"We need bike laws."
Push out "Hoodlums"•"Make people that cause problems move out of the neighborhood."
•"Less vagrant type of people."•"Kick out guys with pants hanging off their bottom."•"Make people that have nothing to do move out of here."•"Get homeless people off the street."•"Get rid of the dirt bikers who use the Columbus Coated Fabrics site."
•"Get rid of people who just hang and snoop around."•"Get rid of drunks and panhandlers."
Better Access to a Variety of Stores/Restaurants•"I want to be able to spend my money in the neighborhood"•"We need a Target or Wal‐Mart."
Neighborhood Feedback: Respondent Comments
Improved Roads/Mobility•Need speed bumps.
*7th Avenue and 6th Street*5th Street
•Speed limit needs to be lower on 11th.•Pave roads and alleys.•People need to drive slower.•Increase "walkablility" in the neighborhood.•Need more speed limit signs.
*5th Street•Make Euclid one way towards High.•"Fix congestion."•"Make crosswalks more visible."•"We need bike laws."
Improved Recreation Facilities•"We need a community pool."•"They should fix the recreation center."•"We need a youth center."
Push out "Hoodlums"•"Make people that cause problems move out of the neighborhood."
•"Less vagrant type of people."•"Kick out guys with pants hanging off their bottom."•"Make people that have nothing to do move out of here."•"Get homeless people off the street."•"Get rid of the dirt bikers who use the Columbus Coated Fabrics site."
•"Get rid of people who just hang and snoop around."•"Get rid of drunks and panhandlers."
Better Access to a Variety of Stores/Restaurants•"I want to be able to spend my money in the neighborhood"•"We need a Target or Wal‐Mart."•"A better Kroger."•"I would like a Burger King in the neighborhood."•"Add a McDonald's."
Neighborhood Feedback: Respondent Comments
Improved Roads/Mobility•Need speed bumps.
*7th Avenue and 6th Street*5th Street
•Speed limit needs to be lower on 11th.•Pave roads and alleys.•People need to drive slower.•Increase "walkablility" in the neighborhood.•Need more speed limit signs.
*5th Street•Make Euclid one way towards High.•"Fix congestion."•"Make crosswalks more visible."•"We need bike laws."
Improved Recreation Facilities•"We need a community pool."•"They should fix the recreation center."•"We need a youth center."•"They should turn the police substation into a pool hall."
More Employment Opportunities•Need jobs for felons.•Better jobs for the youth."Hi i hb h d l t k h "
Push out "Hoodlums"•"Make people that cause problems move out of the neighborhood."
•"Less vagrant type of people."•"Kick out guys with pants hanging off their bottom."•"Make people that have nothing to do move out of here."•"Get homeless people off the street."•"Get rid of the dirt bikers who use the Columbus Coated Fabrics site."
•"Get rid of people who just hang and snoop around."•"Get rid of drunks and panhandlers."
Better Access to a Variety of Stores/Restaurants•"I want to be able to spend my money in the neighborhood"•"We need a Target or Wal‐Mart."•"A better Kroger."•"I would like a Burger King in the neighborhood."•"Add a McDonald's."
Stop Loitering•"Stop young kids from hanging out."•"Move people standing on 4th /8th. Every time something happens it's at that corner."
•"Move kids off 4th and 8th.""K b ff "
Neighborhood Feedback: Respondent Comments
Improved Roads/Mobility•Need speed bumps.
*7th Avenue and 6th Street*5th Street
•Speed limit needs to be lower on 11th.•Pave roads and alleys.•People need to drive slower.•Increase "walkablility" in the neighborhood.•Need more speed limit signs.
*5th Street•Make Euclid one way towards High.•"Fix congestion."•"Make crosswalks more visible."•"We need bike laws."
Improved Recreation Facilities•"We need a community pool."•"They should fix the recreation center."•"We need a youth center."•"They should turn the police substation into a pool hall."
More Employment Opportunities•Need jobs for felons.•Better jobs for the youth.•"Hire neighborhood people to work on houses."•"Get young guys to build houses."•"Help single parents find jobs."
Push out "Hoodlums"•"Make people that cause problems move out of the neighborhood."
•"Less vagrant type of people."•"Kick out guys with pants hanging off their bottom."•"Make people that have nothing to do move out of here."•"Get homeless people off the street."•"Get rid of the dirt bikers who use the Columbus Coated Fabrics site."
•"Get rid of people who just hang and snoop around."•"Get rid of drunks and panhandlers."
Better Access to a Variety of Stores/Restaurants•"I want to be able to spend my money in the neighborhood"•"We need a Target or Wal‐Mart."•"A better Kroger."•"I would like a Burger King in the neighborhood."•"Add a McDonald's."
Stop Loitering•"Stop young kids from hanging out."•"Move people standing on 4th /8th. Every time something happens it's at that corner."
•"Move kids off 4th and 8th."•"Keep boys off corners."•"Get rid of dope boys and people sitting on their ass in CPO."
Improved Landscaping•Increase number of trees.•Mandatory mowing
Neighborhood Feedback: Respondent Comments
Improved Roads/Mobility•Need speed bumps.
*7th Avenue and 6th Street*5th Street
•Speed limit needs to be lower on 11th.•Pave roads and alleys.•People need to drive slower.•Increase "walkablility" in the neighborhood.•Need more speed limit signs.
*5th Street•Make Euclid one way towards High.•"Fix congestion."•"Make crosswalks more visible."•"We need bike laws."
Improved Recreation Facilities•"We need a community pool."•"They should fix the recreation center."•"We need a youth center."•"They should turn the police substation into a pool hall."
More Employment Opportunities•Need jobs for felons.•Better jobs for the youth.•"Hire neighborhood people to work on houses."•"Get young guys to build houses."•"Help single parents find jobs."
Push out "Hoodlums"•"Make people that cause problems move out of the neighborhood."
•"Less vagrant type of people."•"Kick out guys with pants hanging off their bottom."•"Make people that have nothing to do move out of here."•"Get homeless people off the street."•"Get rid of the dirt bikers who use the Columbus Coated Fabrics site."
•"Get rid of people who just hang and snoop around."•"Get rid of drunks and panhandlers."
Better Access to a Variety of Stores/Restaurants•"I want to be able to spend my money in the neighborhood"•"We need a Target or Wal‐Mart."•"A better Kroger."•"I would like a Burger King in the neighborhood."•"Add a McDonald's."
Stop Loitering•"Stop young kids from hanging out."•"Move people standing on 4th /8th. Every time something happens it's at that corner."
•"Move kids off 4th and 8th."•"Keep boys off corners."•"Get rid of dope boys and people sitting on their ass in CPO."
Improved Landscaping•Increase number of trees.•Mandatory mowing.•Cut down some trees.
Neighborhood Feedback: Respondent Comments
67

Weinland Park Survey: Schoenbaum Family Center Neighborhood Feedback
Help Homeless People•"We need to help the homeless."•"We need a shelter for men. Men with a criminal background can't get an apartment."
Improved/More Specialized Programming•"Find out what single parents and young black males need in the hood. "
•"Need to reform the programs to better manage the area."
Neighborhood Feedback: Respondent Comments
68
Help Homeless People•"We need to help the homeless."•"We need a shelter for men. Men with a criminal background can't get an apartment."
•"We need a homeless shelter."•"We need to add a homeless shelter nearby."•"We need a mission close to this neighborhood. Places to eat. No place to sleep or rest. Need a place to kick off shoes and just rest for a few hours."
•"Turn abandoned buildings into housing for the homeless "
Improved/More Specialized Programming•"Find out what single parents and young black males need in the hood. "
•"Need to reform the programs to better manage the area."•"Need resources for people to spruce up their homes."•"Give people loans to buy homes, and teach people to buy homes and care for them."
•"Homeowner improvement with tax credits."•"Help elderly people shop."•" We need programs for people who own homes "
Neighborhood Feedback: Respondent Comments
Help Homeless People•"We need to help the homeless."•"We need a shelter for men. Men with a criminal background can't get an apartment."
•"We need a homeless shelter."•"We need to add a homeless shelter nearby."•"We need a mission close to this neighborhood. Places to eat. No place to sleep or rest. Need a place to kick off shoes and just rest for a few hours."
•"Turn abandoned buildings into housing for the homeless."
Increased Access to Parking•"Cars should have to have stickers to park or they get towed."•"Increased Parking at Bristol Bar."•Move "No Parking" signs further away.
Improved/More Specialized Programming•"Find out what single parents and young black males need in the hood. "
•"Need to reform the programs to better manage the area."•"Need resources for people to spruce up their homes."•"Give people loans to buy homes, and teach people to buy homes and care for them."
•"Homeowner improvement with tax credits."•"Help elderly people shop."•" We need programs for people who own homes."•Need programs to help residents out, e.g., when they are moving in.
•More services for Latinos.
Better lighting
Neighborhood Feedback: Respondent Comments
Help Homeless People•"We need to help the homeless."•"We need a shelter for men. Men with a criminal background can't get an apartment."
•"We need a homeless shelter."•"We need to add a homeless shelter nearby."•"We need a mission close to this neighborhood. Places to eat. No place to sleep or rest. Need a place to kick off shoes and just rest for a few hours."
•"Turn abandoned buildings into housing for the homeless."
Increased Access to Parking•"Cars should have to have stickers to park or they get towed."•"Increased Parking at Bristol Bar."•Move "No Parking" signs further away.•More resident parking on the street.•More "order" to parking.•"Get rid of street sweeping."•Safer access to parking.
Improved/More Specialized Programming•"Find out what single parents and young black males need in the hood. "
•"Need to reform the programs to better manage the area."•"Need resources for people to spruce up their homes."•"Give people loans to buy homes, and teach people to buy homes and care for them."
•"Homeowner improvement with tax credits."•"Help elderly people shop."•" We need programs for people who own homes."•Need programs to help residents out, e.g., when they are moving in.
•More services for Latinos.
Better lighting•"Give light to the alleys."•"Get three way switches on light bulbs."•"Increase lighting off of High."
Neighborhood Feedback: Respondent Comments
Help Homeless People•"We need to help the homeless."•"We need a shelter for men. Men with a criminal background can't get an apartment."
•"We need a homeless shelter."•"We need to add a homeless shelter nearby."•"We need a mission close to this neighborhood. Places to eat. No place to sleep or rest. Need a place to kick off shoes and just rest for a few hours."
•"Turn abandoned buildings into housing for the homeless."
Increased Access to Parking•"Cars should have to have stickers to park or they get towed."•"Increased Parking at Bristol Bar."•Move "No Parking" signs further away.•More resident parking on the street.•More "order" to parking.•"Get rid of street sweeping."•Safer access to parking.
Increased Respect among Residents•"Send a letter to management to have people be aware of respecting others."
Improved/More Specialized Programming•"Find out what single parents and young black males need in the hood. "
•"Need to reform the programs to better manage the area."•"Need resources for people to spruce up their homes."•"Give people loans to buy homes, and teach people to buy homes and care for them."
•"Homeowner improvement with tax credits."•"Help elderly people shop."•" We need programs for people who own homes."•Need programs to help residents out, e.g., when they are moving in.
•More services for Latinos.
Better lighting•"Give light to the alleys."•"Get three way switches on light bulbs."•"Increase lighting off of High."
Decrease Noise Pollution."•"Move the train. Quiet traffic"•"Move the fire station. I hate the loud noises. Most annoying thing. When I first moved in I couldn't sleep."
•"Enforce noise and music levels."•"We need strict noise regulation "
Neighborhood Feedback: Respondent Comments
Help Homeless People•"We need to help the homeless."•"We need a shelter for men. Men with a criminal background can't get an apartment."
•"We need a homeless shelter."•"We need to add a homeless shelter nearby."•"We need a mission close to this neighborhood. Places to eat. No place to sleep or rest. Need a place to kick off shoes and just rest for a few hours."
•"Turn abandoned buildings into housing for the homeless."
Increased Access to Parking•"Cars should have to have stickers to park or they get towed."•"Increased Parking at Bristol Bar."•Move "No Parking" signs further away.•More resident parking on the street.•More "order" to parking.•"Get rid of street sweeping."•Safer access to parking.
Increased Respect among Residents•"Send a letter to management to have people be aware of respecting others."
Improved/More Specialized Programming•"Find out what single parents and young black males need in the hood. "
•"Need to reform the programs to better manage the area."•"Need resources for people to spruce up their homes."•"Give people loans to buy homes, and teach people to buy homes and care for them."
•"Homeowner improvement with tax credits."•"Help elderly people shop."•" We need programs for people who own homes."•Need programs to help residents out, e.g., when they are moving in.
•More services for Latinos.
Better lighting•"Give light to the alleys."•"Get three way switches on light bulbs."•"Increase lighting off of High."
Decrease Noise Pollution."•"Move the train. Quiet traffic"•"Move the fire station. I hate the loud noises. Most annoying thing. When I first moved in I couldn't sleep."
•"Enforce noise and music levels."•"We need strict noise regulation."
Improve Parenting•"Make people more responsible for kids."•"Have parents discipline kids."•"Get on parents about the kids."
Neighborhood Feedback: Respondent Comments
Help Homeless People•"We need to help the homeless."•"We need a shelter for men. Men with a criminal background can't get an apartment."
•"We need a homeless shelter."•"We need to add a homeless shelter nearby."•"We need a mission close to this neighborhood. Places to eat. No place to sleep or rest. Need a place to kick off shoes and just rest for a few hours."
•"Turn abandoned buildings into housing for the homeless."
Increased Access to Parking•"Cars should have to have stickers to park or they get towed."•"Increased Parking at Bristol Bar."•Move "No Parking" signs further away.•More resident parking on the street.•More "order" to parking.•"Get rid of street sweeping."•Safer access to parking.
Increased Respect among Residents•"Send a letter to management to have people be aware of respecting others."
Improved/More Specialized Programming•"Find out what single parents and young black males need in the hood. "
•"Need to reform the programs to better manage the area."•"Need resources for people to spruce up their homes."•"Give people loans to buy homes, and teach people to buy homes and care for them."
•"Homeowner improvement with tax credits."•"Help elderly people shop."•" We need programs for people who own homes."•Need programs to help residents out, e.g., when they are moving in.
•More services for Latinos.
Better lighting•"Give light to the alleys."•"Get three way switches on light bulbs."•"Increase lighting off of High."
Decrease Noise Pollution."•"Move the train. Quiet traffic"•"Move the fire station. I hate the loud noises. Most annoying thing. When I first moved in I couldn't sleep."
•"Enforce noise and music levels."•"We need strict noise regulation."
Improve Parenting•"Make people more responsible for kids."•"Have parents discipline kids."•"Get on parents about the kids."•"Educate people on how to take care of their families, and raise kids."
•"Make fathers taking more responsibility for their kids."
Neighborhood Feedback: Respondent Comments
68

Weinland Park Survey: Schoenbaum Family Center Neighborhood Feedback
Get rid of sex offenders•"Pedophiles shouldn't be so close to school, or at least not be allowed to live near school bus stops."
Get rid of slumlords•"Make landlords more vigilant"•"We need better management."
Neighborhood Feedback: Respondent Comments
69
Get rid of sex offenders•"Pedophiles shouldn't be so close to school, or at least not be allowed to live near school bus stops."
•"Get rid of rapists, we got them right down the street."•"Get pedophiles out of neighborhood. Pedophiles live in the jungle building."
More Opportunities for Residents to Socialize and Develop a
Get rid of slumlords•"Make landlords more vigilant"•"We need better management."
Other•"Get rid of mountains of dirt at Wags Development."•"Move D&J out of the neighborhood. It has a lot to do with problems here."
Neighborhood Feedback: Respondent Comments
Get rid of sex offenders•"Pedophiles shouldn't be so close to school, or at least not be allowed to live near school bus stops."
•"Get rid of rapists, we got them right down the street."•"Get pedophiles out of neighborhood. Pedophiles live in the jungle building."
More Opportunities for Residents to Socialize and Develop a Sense of Community
•"Help neighbors be more active and involved."•"We need more opportunity for people in this neighborhood to interact."
•"We need more community activity."•"We need more block parties "
Get rid of slumlords•"Make landlords more vigilant"•"We need better management."
Other•"Get rid of mountains of dirt at Wags Development."•"Move D&J out of the neighborhood. It has a lot to do with problems here."
•"I would build myself a new community from the ground up."•"I would build better homes with higher prices so hoodlums can't buy them."
•"Break up 4th and 8th and spread them around."•"I would knock down building at 4th & 8th. All four corners need to be leveled I would shut down every convenience
Neighborhood Feedback: Respondent Comments
Get rid of sex offenders•"Pedophiles shouldn't be so close to school, or at least not be allowed to live near school bus stops."
•"Get rid of rapists, we got them right down the street."•"Get pedophiles out of neighborhood. Pedophiles live in the jungle building."
More Opportunities for Residents to Socialize and Develop a Sense of Community
•"Help neighbors be more active and involved."•"We need more opportunity for people in this neighborhood to interact."
•"We need more community activity."•"We need more block parties."•"We need more community events."•"Host community meetings."•"Meet your neighbor events."•"Community event every month to get people out."•Increased/better community gardens.
Get rid of slumlords•"Make landlords more vigilant"•"We need better management."
Other•"Get rid of mountains of dirt at Wags Development."•"Move D&J out of the neighborhood. It has a lot to do with problems here."
•"I would build myself a new community from the ground up."•"I would build better homes with higher prices so hoodlums can't buy them."
•"Break up 4th and 8th and spread them around."•"I would knock down building at 4th & 8th. All four corners need to be leveled. I would shut down every convenience store in neighborhood. They are dens of evil, harbingers of crime. I would do a sweep of known drug dealers. And, I would wire cameras to the FBI so they can see anytime they want."
Neighborhood Feedback: Respondent Comments
Get rid of sex offenders•"Pedophiles shouldn't be so close to school, or at least not be allowed to live near school bus stops."
•"Get rid of rapists, we got them right down the street."•"Get pedophiles out of neighborhood. Pedophiles live in the jungle building."
More Opportunities for Residents to Socialize and Develop a Sense of Community
•"Help neighbors be more active and involved."•"We need more opportunity for people in this neighborhood to interact."
•"We need more community activity."•"We need more block parties."•"We need more community events."•"Host community meetings."•"Meet your neighbor events."•"Community event every month to get people out."•Increased/better community gardens.•"Change the attitude of the neighborhood."•"Change the culture and state of mind out here."•"Give the neighborhood an identity."
Improved Utility Companies/Services
Get rid of slumlords•"Make landlords more vigilant"•"We need better management."
Other•"Get rid of mountains of dirt at Wags Development."•"Move D&J out of the neighborhood. It has a lot to do with problems here."
•"I would build myself a new community from the ground up."•"I would build better homes with higher prices so hoodlums can't buy them."
•"Break up 4th and 8th and spread them around."•"I would knock down building at 4th & 8th. All four corners need to be leveled. I would shut down every convenience store in neighborhood. They are dens of evil, harbingers of crime. I would do a sweep of known drug dealers. And, I would wire cameras to the FBI so they can see anytime they want."
Neighborhood Feedback: Respondent Comments
Get rid of sex offenders•"Pedophiles shouldn't be so close to school, or at least not be allowed to live near school bus stops."
•"Get rid of rapists, we got them right down the street."•"Get pedophiles out of neighborhood. Pedophiles live in the jungle building."
More Opportunities for Residents to Socialize and Develop a Sense of Community
•"Help neighbors be more active and involved."•"We need more opportunity for people in this neighborhood to interact."
•"We need more community activity."•"We need more block parties."•"We need more community events."•"Host community meetings."•"Meet your neighbor events."•"Community event every month to get people out."•Increased/better community gardens.•"Change the attitude of the neighborhood."•"Change the culture and state of mind out here."•"Give the neighborhood an identity."
Improved Utility Companies/Services•"Use AT&T substation to give Weinland Park residents wireless internet."
•"Get a different power company in the neighborhood."•"Bury telephone/cable lines."•"Remove power lines."
Get rid of slumlords•"Make landlords more vigilant"•"We need better management."
Other•"Get rid of mountains of dirt at Wags Development."•"Move D&J out of the neighborhood. It has a lot to do with problems here."
•"I would build myself a new community from the ground up."•"I would build better homes with higher prices so hoodlums can't buy them."
•"Break up 4th and 8th and spread them around."•"I would knock down building at 4th & 8th. All four corners need to be leveled. I would shut down every convenience store in neighborhood. They are dens of evil, harbingers of crime. I would do a sweep of known drug dealers. And, I would wire cameras to the FBI so they can see anytime they want."
Neighborhood Feedback: Respondent Comments
69

Weinland Park Survey: Schoenbaum Family Center Needs Assessment
# Individuals or Households Needing Assistance
# Individuals or Households Needing Assistance
70
Transportation 165 Adult Dental Care 189Affordable Housing 163 Adult Health Insurance 171Clothing 116 Adult Eye/Vision Care 166Legal Services 115 Adult Personal Physician 133
Basic Needs Assistance Health Care
Legal Services 115 Adult Personal Physician 133Safe Housing 112 Nutrition and Exercise Education 119Food 106 Help Getting Reimbursed for Health Care 108Language Interpretation Services 21 Information on Diseases 94
Adult Hearing or Speech Services 70Mentoring Program (Big Brother/Big Sister) 72 Immunization 54
Services for ChildrenMentoring Program (Big Brother/Big Sister) 72 Immunization 54Tutoring/Help with Homework 59 Home Health Care 38Programs for Gifted and Talented Students 57 Care for Children with Special Needs 23Childcare 42 Prenatal and Newborn Care 19Before or/and After School Care 42 Child Dental Care 12Job Training for Teenage Children 40 Child Hearing or Speech Services 10g g g pPreschool/Pre‐K 31 Child Eye/Vision Care 8Special Care for Children with Special Needs 21 Child Health Insurance 7
Child Personal Physician 7Employment that Pays a Living Wage 228Entrepreneur Development Opportunities 205 Counseling 102
Adult SupportSocial Services
p p pp gComputer or Internet Access 164 Family Planning 49Job Training 151 Services for Senior Citizens 38Access to College 150 Alcohol and Drug Abuse Treatment 35GED (High School Diploma) 93Help Learning How to Read 56p gParenting Education 43ESL (English as a Second Language) 26
70

Weinland Park Survey: Schoenbaum Family Center Needs Assessment
Support Networks
In terms of getting needs met (the needs just reviewed), please rate the following possible support networks on a scale of 1 to 10. A rating of 10 would indicate that they are a great source of support, while a 1 would indicate that they do not provide support at all.
71
FamilyMean Score: 8Median Score: 10 Mode Score: 10
Support Networks
In terms of getting needs met (the needs just reviewed), please rate the following possible support networks on a scale of 1 to 10. A rating of 10 would indicate that they are a great source of support, while a 1 would indicate that they do not provide support at all.
Respondents reported receiving the greatest support from family and friends, and little support from Church, Community Agencies, Government Agencies, and Schools.
FamilyMean Score: 8Median Score: 10 Mode Score: 10
FriendsMean Score: 7Median Score: 7 Mode Score: 10
ChurchMean Score: 5Median Score: 5 Mode Score: 1
Community agenciesMean Score: 5Median Score: 3 Mode Score: 1
Government agenciesMean Score: 5Median Score: 5 Mode Score: 1
School
Support Networks
In terms of getting needs met (the needs just reviewed), please rate the following possible support networks on a scale of 1 to 10. A rating of 10 would indicate that they are a great source of support, while a 1 would indicate that they do not provide support at all.
Respondents reported receiving the greatest support from family and friends, and little support from Church, Community Agencies, Government Agencies, and Schools.
FamilyMean Score: 8Median Score: 10 Mode Score: 10
FriendsMean Score: 7Median Score: 7 Mode Score: 10
ChurchMean Score: 5Median Score: 5 Mode Score: 1
Community agenciesMean Score: 5Median Score: 3 Mode Score: 1
Government agenciesMean Score: 5Median Score: 5 Mode Score: 1
SchoolMean Score: 5Median Score: 5 Mode Score: 1
Support Networks
In terms of getting needs met (the needs just reviewed), please rate the following possible support networks on a scale of 1 to 10. A rating of 10 would indicate that they are a great source of support, while a 1 would indicate that they do not provide support at all.
Respondents reported receiving the greatest support from family and friends, and little support from Church, Community Agencies, Government Agencies, and Schools.
71