Embed Size (px)
DESCRIPTION
The world’s third largest region by B2C E-Commerce sales shows wide diversity in terms of payment methods used in online shopping. While non-cash payment methods, especially credit cards, dominate in the Western sub-region, cash on delivery and various alternative methods are most used in Eastern European countries. Both sub-regions show potential for mobile payments growth.
Citation preview
EUROPE ONLINE PAYMENT METHODS:
SECOND HALF 2014
November 2014
- 2 -
General Information
Product Details
Language: English
Format: PDF & Power Point
Number of Pages/Charts: 103
Covered Countries/Regions: Western Europe, Eastern Europe, UK, Germany, France, Spain, Italy,
Netherlands, Sweden, Denmark, Finland, Norway, Switzerland, Austria,
Russia, Turkey, Poland, Greece, Czech Republic, Hungary, Romania,
Belarus, Slovenia, Estonia
Prices
Single User License: € 1,450 (excl. VAT)
Site License: € 2,900 (excl. VAT)
Global Site License: € 4,350 (excl. VAT)
Questions Answered in This Report
What are the major online and mobile payment trends in the third largest B2C E-Commerce market
worldwide?
How do preferences for payment methods differ between online shoppers in Western and Eastern
Europe?
What are the most used payment methods in B2C E-Commerce in various countries in Europe?
How are mobile and contactless payments developing in leading countries of this region?
Europe Online Payment Methods: Second Half 2014
- 3 -
Diversity in Online Payment Methods in Europe
The world’s third largest region by B2C E-Commerce sales shows wide diversity in terms of payment
methods used in online shopping. While non-cash payment methods, especially credit cards, dominate in
the Western sub-region, cash on delivery and various alternative methods are most used in Eastern
European countries. Both sub-regions show potential for mobile payments growth
Europe’s largest online market, the UK, was dominated by credit and debit cards in terms of payment
methods in 2014, while a quarter of online shoppers dropped the purchasing process if their preferred
payment method in not offered. Moreover, over one fourth of Internet users in the UK are interested in
using mobile payments, with the mobile payment offerings growing rapidly in H2 2014: Vodafone
launched SmartPass in cooperation with Visa, while the joint mobile effort of banks, Paym solution, signed
up 500,000 users in the first month after its launch.
In Germany, PayPal and express checkout methods were gaining a larger share of B2C E-Commerce
payments in H2 2014, and Amazon offered “Login and Pay” method. Invoice remained the leading
payment method in German B2C E-Commerce sales, while PayPal increased its share. Mobile payments in
Germany are forecasted to grow rapidly in the next several years in Germany to near one billion Euros in
the next five years.
The payment method used the most by online shoppers in France was “Bank Card” at the beginning of
2014, followed by “Online Payment Service”. The ecosystem for mobile payments is developing rapidly,
while adoption by consumers is still to take off. In many other Western European markets, including Italy
and Spain, credit card remained the dominant method. However, several countries have own specifics: in
the Netherlands, for example, local banking method iDEAL accounts for more than half of all online
purchases and in Sweden payment against invoice is used more than credit card in B2C E-Commerce.
In Russia, cash remained the most used payment method in online shopping, while alternative payments
showed dynamism in H2 2014: payments made through online banking grew, PayPal started accepting
cash payments through stores, terminal payments and E-Wallet company Qiwi held SPO raising EUR 60
million and another popular wallet Yandex.Money cooperated with Alibaba’s Aliexpress. While Cash on
Delivery remained the most used payment method, half of Internet users already have experience with
online payments and a significant share plans to do so more.
In some other Eastern European markets, including Hungary, Romania and Belarus, cash on delivery is
the most used method. However, there are also exemptions to this trend: in Turkey card payment
dominates and grew rapidly in the first three quarters of 2014.
Key Findings
Europe Online Payment Methods: Second Half 2014
- 4 -
1. MANAGEMENT SUMMARY
2. GLOBAL DEVELOPMENTS
Value of Digital Payments, in trillion, 2014e & 2019f
Number of B2C E-Commerce Payment Transactions, in billions, 2011 - 2015f
Number of Mobile Payment Transactions, by Bank and Non-Bank, in billions, 2011 - 2015f
Value of Mobile Payments, in USD billion, 2013 & 2014f
Mobile Wallet Market Value, in USD billion, 2012 & 2018f
Number of NFC Payment Users, in millions, 2014e & 2019f
3.1. UK
Online and Mobile Payment Trends and News about Players, H2 2014
Payment Methods Used in B2C E-Commerce, in % of Online Shoppers, 2014
Payment Methods Used in B2C E-Commerce, in % of Online Shoppers, by Gender, 2014
Popular Methods to Pay Online, in % of Consumers, August 2014
Major Reasons for Abandoning Online Shopping Cart, in % of Consumers who Abandoned Online
Shopping Carts, August 2014
Mobile Payments Conducted, by Type, in % of Internet Users, by Age Group, 12 Month to July 2014
Interest in Using Mobile Payments, in % of Internet Users Who Do Not Use Mobile Payments, by Age
Group, July 2014
Number of Cards with Contactless Payment Functionality, in millions, December 2012, December 2013
& June 2014
Number of Bank-Owned Terminals with Contactless Payment Functionality, in thousands, December
2012, December 2013 & June 2014
Number and Value of Contactless Card Transactions, in GBP million and million transactions, by Debit
and Credit/Charge Card, and in % Growth, June 2014
3. WESTERN EUROPE
Europe Online Payment Methods: Second Half 2014
Table of Contents (1 of 7)
- 5 -
3. WESTERN EUROPE (cont.)
3.2. GERMANY
Online and Mobile Payment Trends and News about Players, H2 2014
Breakdown of B2C E-Commerce Sales by Payment Methods, 2012 & 2013
Reasons for Abandoning Online Shopping Cart, in % of Internet Users, June 2014
Usage of Additional Charges for Selected Payment Methods, in % of Online Merchants, 2012 – 2014
Perception of Payment Method Costs, in % of Online Merchants Offering the Method, June 2014
Breakdown of Payment Method Processing, by Own Processing and Processing Through Payment
Service Provider, in % of Online Merchants Offering the Method, June 2014
Usage of Payment Risk Check, by Payment Method and by External and Internal Risk Check, in % of
Online Merchants, June 2014
Average Order Value, by Payment Method, in EUR, June 2014
Number of Mobile Payment Users, in thousands, 2014e & 2020f
Breakdown of Mobile Payment App Usage, by Current Usage and Potential Usage, in % of Internet
Users, June 2014
Breakdown of NFC Payment Usage, by Current Usage and Potential Usage, in % of Internet Users,
June 2014
3.3. FRANCE
Online and Mobile Payment Trends and News about Players, H2 2014
Payment Methods Most Used in B2C E-Commerce, in % of Online Shoppers, Q1 2014
Value of Card Fraud in Domestic E-Commerce Transactions, in EUR million, and Fraud Rate, in % of
Transactions, 2009 – 2013
Share of 3D Secure Transactions on Total Online Card Payments, in %, April 2011 - April 2014
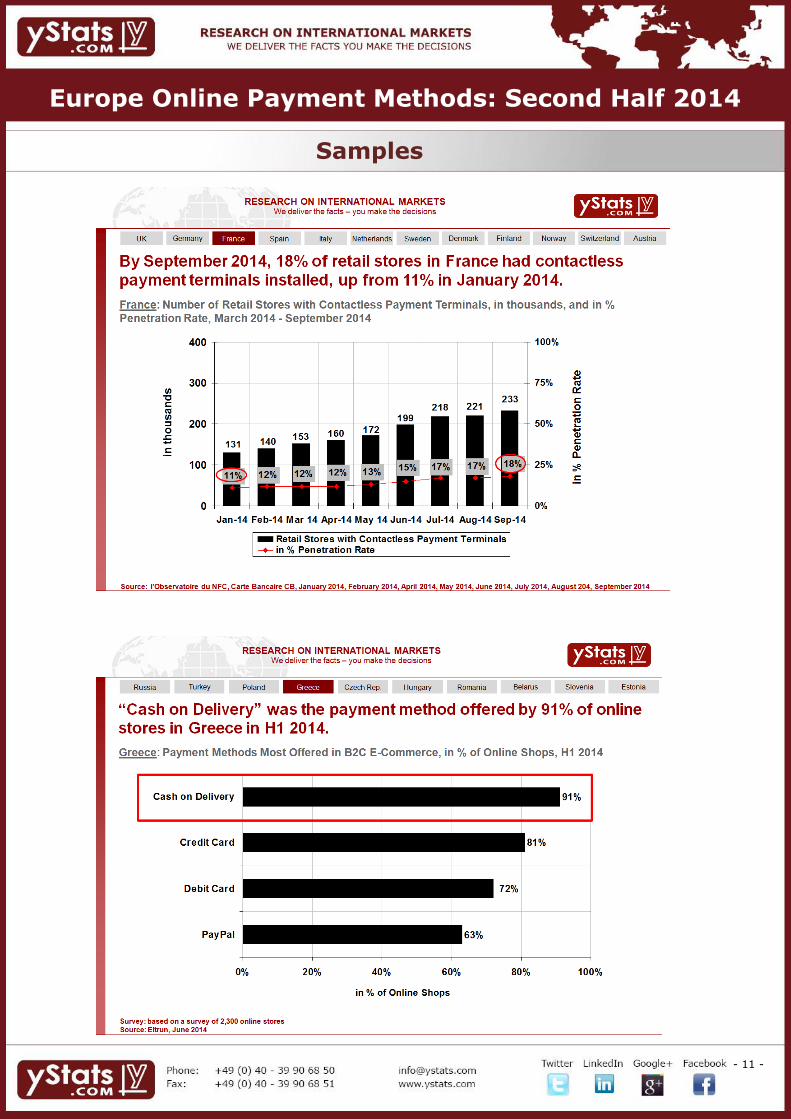
Number of Retail Stores with Contactless Payment Terminals, in thousands, and in % Penetration
Rate, March 2014 - September 2014
Number of Cards with Contactless Payment Functionality, in millions, and in % Penetration Rate,
March 2014 - September 2014
Share of Consumers Who Made Payments with Mobile Phone in Store, in %, September 2014
Interest in Making In-Store Payments with Mobile Phone in the Future, in % of Smartphone Owners
Who Have Not Made Payments with Mobile Phone in Store, in %, September 2014
Places for Perspective Usage of Mobile Payments, in % Smartphone Users who Have not Made Mobile
Payments in Store, September 2014
Europe Online Payment Methods: Second Half 2014
Table of Contents (2 of 7)
- 6 -
3.5. ITALY
Breakdown of B2C E-Commerce Sales, by Payment Methods, in %, 2012 - 2014f
Value of B2C E-Commerce Payments, by Credit Card and Others, in EUR million, August 2013 - August
2014
Number of Cards and POS with Contactless Payment Functionality, in thousands, 2013
Breakdown of Attitude to Mobile Proximity Payment, in % of Mobile Internet Users, 2014e
Breakdown of Attitude to Mobile Wallet, in % of Mobile Internet Users, 2014e
Breakdown of Most Trusted Providers of Mobile Wallet, in % of Mobile Internet Users who Are
Interested in Using Mobile Wallets, 2014e
3. WESTERN EUROPE (cont.)
3.4. SPAIN
Breakdown of B2C E-Commerce Purchases, by Selected Payment Methods, in %, 2014e
Reason for Abandoning Mobile Shopping Cart, in % of Mobile Shoppers, July 2014
Breakdown of Intention to Use Mobile Payments, in % of Consumers, July 2014
3.7. SWEDEN
Breakdown of Preferred Payment Methods in B2C E-Commerce, in % of Online Shoppers, January
2014
3.6. NETHERLANDS
Breakdown of B2C E-Commerce Payments, by Payment Method, in %, H1 2014
Breakdown of B2C E-Commerce Payments by Method, by Shopping Channel, in %, H1 2014
Table of Contents (3 of 7)
Europe Online Payment Methods: Second Half 2014
- 7 -
3.8. DENMARK
Breakdown of Preferred Payment Methods in B2C E-Commerce, in % of Online Shoppers, January
2014
3.9. FINLAND
Breakdown of Preferred Payment Methods in B2C E-Commerce, in % of Online Shoppers, January
2014
3. WESTERN EUROPE (cont.)
3.10. NORWAY
Breakdown of Preferred Payment Methods in B2C E-Commerce, in % of Online Shoppers, January
2014
3.11. SWITZERLAND
Breakdown of Mobile Payment App Usage, by Current Usage and Potential Usage, in % of Internet
Users, June 2014
Breakdown of NFC Payment Usage, by Current Usage and Potential Usage, in % of Internet Users,
June 2014
3.12. AUSTRIA
Breakdown of Preferred Payment Methods in B2C E-Commerce, in % of Online Shoppers, 2006 & 2013
Breakdown of Mobile Payment App Usage, by Current Usage and Potential Usage, in % of Internet
Users, June 2014
Breakdown of NFC Payment Usage, by Current Usage and Potential Usage, in % of Internet Users,
June 2014
Europe Online Payment Methods: Second Half 2014
Table of Contents (4 of 7)
- 8 -
4. EASTERN EUROPE
4.1. RUSSIA
Online and Mobile Payment Trends and News about Players, H2 2014
Payment Methods Used in B2C E-Commerce, in % of Online Shoppers, 2013
Payment Methods Used in B2C E-Commerce, in % of Online Shoppers, by Gender and Location, 2013
Breakdown of Usage of Online Payment, by Frequency, and Breakdown of Intention to Use Online
Payment in the Future, in % of Internet Users, February 2014
Purposes of Using Online Payment, in % of Online Payment Users, 12 Months to February 2014
Knowledge and Usage of Non-Cash Payment Methods, incl. Online, in % of Internet Users in Large
Cities, Ranked by Usage, April 2014
Knowledge and Usage of E-Wallet Services, incl. Online, in % of Internet Users in Large Cities, Ranked
by Usage, April 2014
Share of Attempted Fraud Transactions in E-Commerce, by Sector, 2013
The Share of Actual Fraudulent Transactions on E-Commerce Payments with Cards, 2013
Breakdown of Online Fraud Losses, by Fraud Type, in % and in USD million, 2011 & 2012
Devices Used to Make Online Payment, in % of Online Payment Users, 12 Months to February 2014
Penetration of Users Paying Online via Mobile Devices, by Age Group and Gender, in % of Online
Payment Users in the Relevant Group, 12 Months to February 2014
Penetration of Users Paying Online via Mobile Devices, by Household Income and City Size, in % of
Online Payment Users in the Relevant Group, 12 Months to February 2014
Purposes of Making Online Payments via Mobile Devices, by Rank, 12 Months to February 2014
4.2. TURKEY
Number and Value of Domestic E-Commerce Transactions with Cards, in millions and in TRY billion, Q1
2012 - Q3 2014
Number and Value of Cross-Border E-Commerce Transactions with Cards, in millions and in TRY
million, Q1 2012 - Q3 2014
Major Payment Methods Used in B2C E-Commerce, by Rank, 2014e
Europe Online Payment Methods: Second Half 2014
Table of Contents (5 of 7)
- 9 -
4. EASTERN EUROPE (cont.)
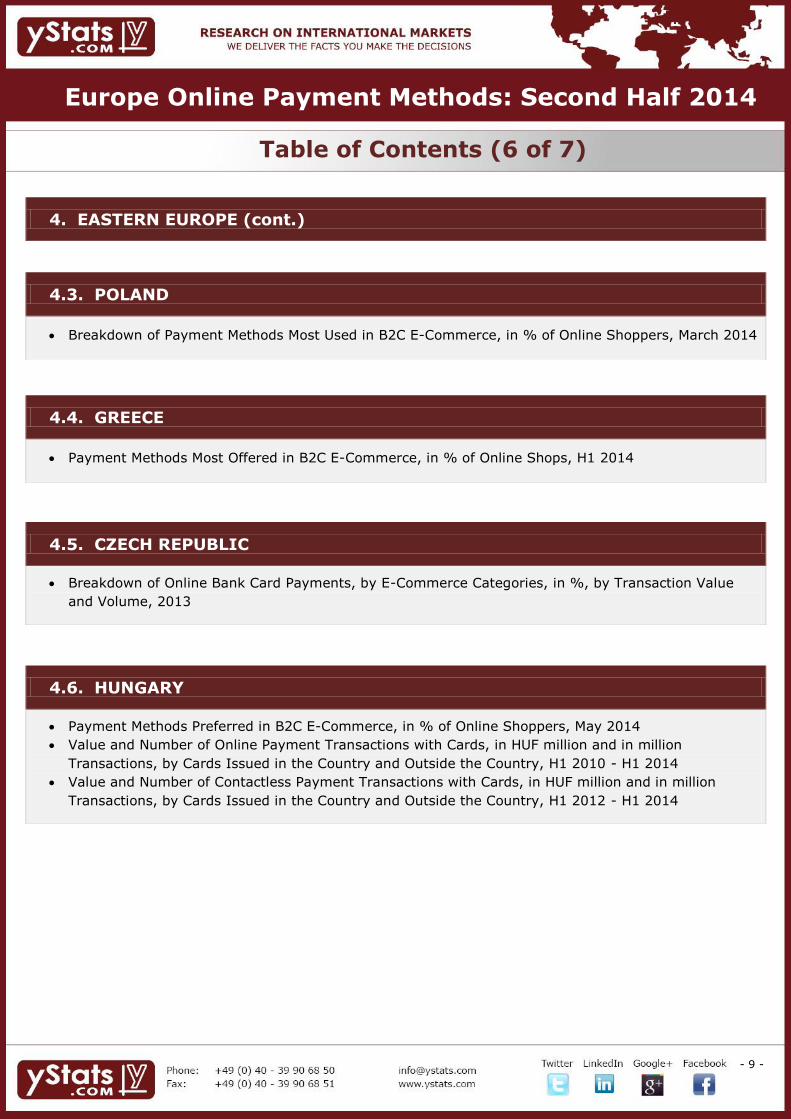
4.3. POLAND
Breakdown of Payment Methods Most Used in B2C E-Commerce, in % of Online Shoppers, March 2014
4.4. GREECE
Payment Methods Most Offered in B2C E-Commerce, in % of Online Shops, H1 2014
4.5. CZECH REPUBLIC
Breakdown of Online Bank Card Payments, by E-Commerce Categories, in %, by Transaction Value
and Volume, 2013
4.6. HUNGARY
Payment Methods Preferred in B2C E-Commerce, in % of Online Shoppers, May 2014
Value and Number of Online Payment Transactions with Cards, in HUF million and in million
Transactions, by Cards Issued in the Country and Outside the Country, H1 2010 - H1 2014
Value and Number of Contactless Payment Transactions with Cards, in HUF million and in million
Transactions, by Cards Issued in the Country and Outside the Country, H1 2012 - H1 2014
Europe Online Payment Methods: Second Half 2014
Table of Contents (6 of 7)
- 10 -
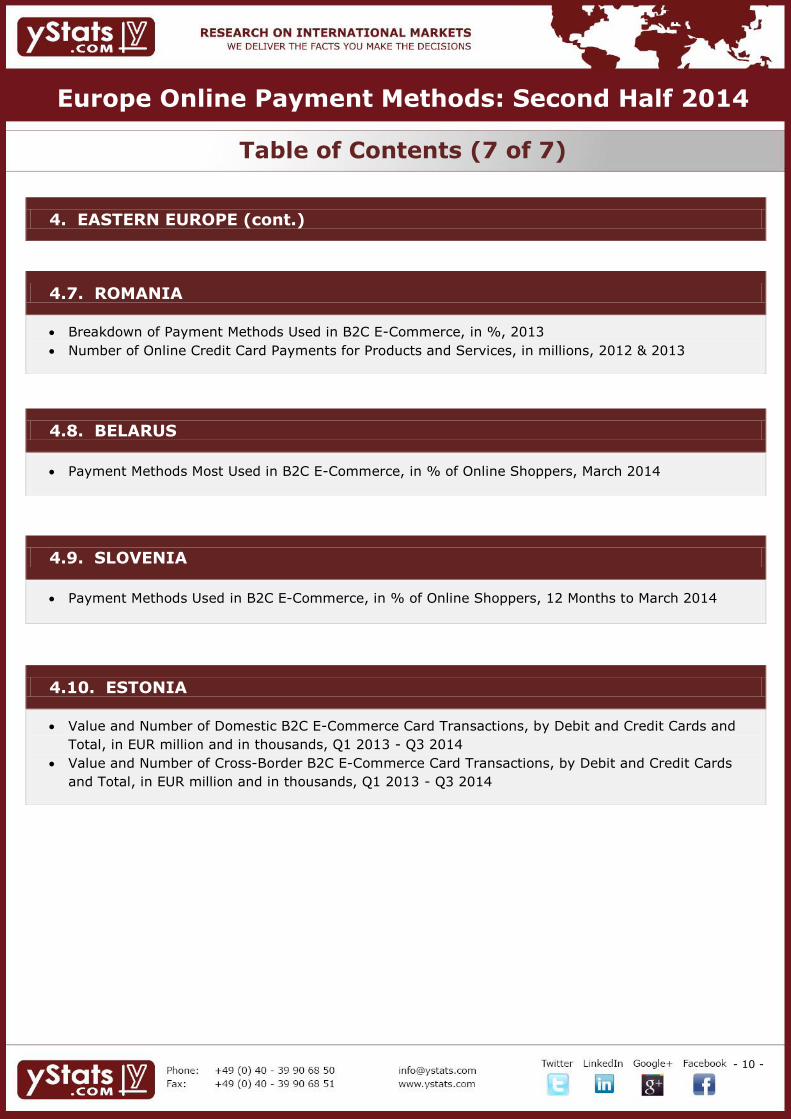
4.7. ROMANIA
Breakdown of Payment Methods Used in B2C E-Commerce, in %, 2013
Number of Online Credit Card Payments for Products and Services, in millions, 2012 & 2013
4. EASTERN EUROPE (cont.)
4.8. BELARUS
Payment Methods Most Used in B2C E-Commerce, in % of Online Shoppers, March 2014
4.9. SLOVENIA
Payment Methods Used in B2C E-Commerce, in % of Online Shoppers, 12 Months to March 2014
4.10. ESTONIA
Value and Number of Domestic B2C E-Commerce Card Transactions, by Debit and Credit Cards and
Total, in EUR million and in thousands, Q1 2013 - Q3 2014
Value and Number of Cross-Border B2C E-Commerce Card Transactions, by Debit and Credit Cards
and Total, in EUR million and in thousands, Q1 2013 - Q3 2014
Europe Online Payment Methods: Second Half 2014
Table of Contents (7 of 7)
- 11 -
Samples
Europe Online Payment Methods: Second Half 2014
- 12 -
General Methodology of our Market Reports:
This report includes the results of secondary market research: By using various sources we ensure maximum objectivity for all obtained data. As a result companies get a precise and unbiased impression of the market
situation.
Cross referencing of data was conducted in order to ensure validity and reliability.
This report contains a Management Summary, summarizing the main information provided in each chapter.
Besides providing information on the specific topic, every chart contains an Action Title, which summarizes the main statement of the chart and a Sub Title, which gives information about the country, the topic, the unit or currency, and the time period the data on the chart refers to.
Furthermore, the source of information and its release date are provided on every chart. It is possible that the information included in one chart is derived from several sources. Then, all sources are mentioned on the chart.
This report also includes rankings. Within these rankings, it is possible that the total amount adds up to more than 100%. If this is the case, multiple answers were possible, and this is then mentioned in the note of the chart.
If available, additional information about the data collection, for example the time of survey and number of people asked, is provided in the form of a note. In some cases, the note (also) contains additional information
needed to fully understand the contents of the respective data.
When providing information about amounts of money, local currencies were mostly used. When referencing them in the Action Title, the EUR values are also provided in brackets. The conversions are always made using the average currency exchange rate for the respective time period. Should the currency figure be in the future, the average exchange rate of the past 12 months is used.
Methodology for our Europe Online Payment: Second Half report:
This report covers the European online payment market. It takes into account a wide definition of online payment, including payment methods used in B2C E-Commerce and mobile payment.
All major European countries are covered, while data availability varied across the markets.
Countries are grouped by two sub-regions: Western and Eastern Europe. Within the sub-regions, the countries are presented in the descending order of B2C E-Commerce sales.
Besides country data, global data is also included.
Cross referencing of data was conducted in order to ensure validity and reliability.
Depending on data availability, the following types of market information are included: the most used payment methods in B2C E-Commerce, number and volume of online and mobile payment transactions, information about online and mobile payment users and about E-Commerce payment fraud. Not all the mentioned types of
information are available for each of the covered countries. For the leading country or countries in each sub-region, also online and mobile payment trends and news about major players, such as payment providers, banks and retailers are presented.
The report includes recent data, mostly published within the previous 6 months. The exact date of publication of the source is stated on each chart. The time period which the data refers to differs by source.
Europe Online Payment Methods: Second Half 2014
Methodology
- 13 -
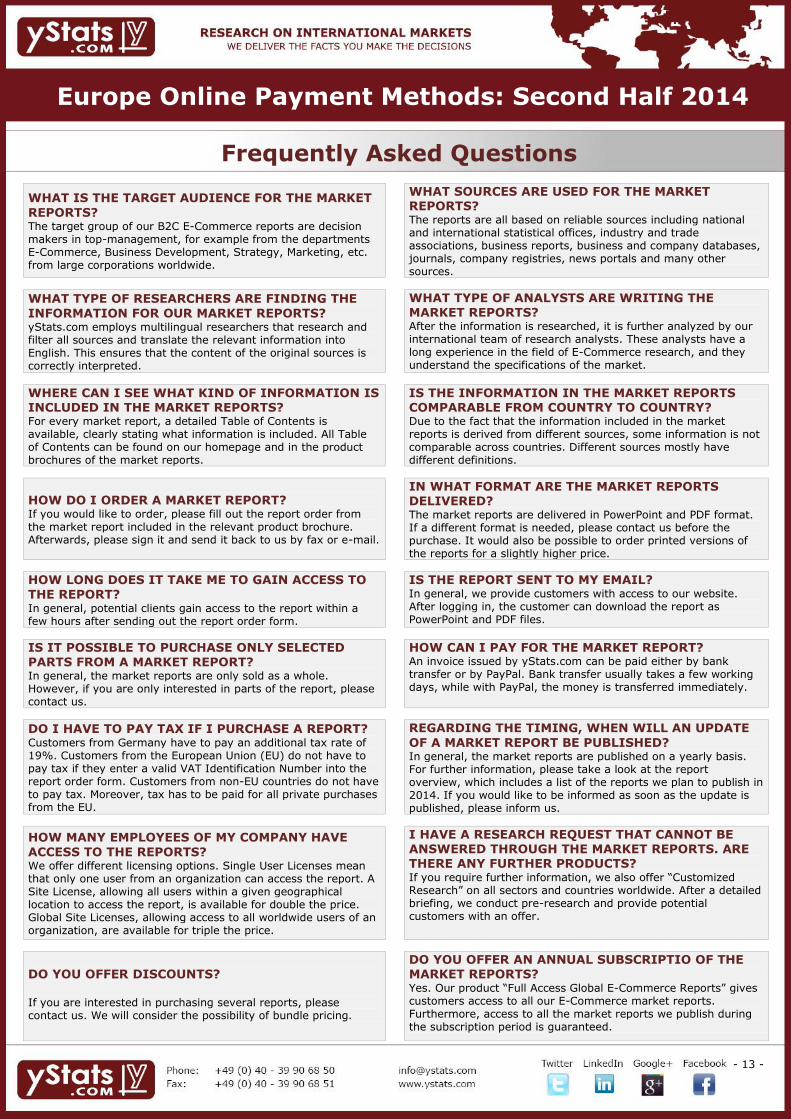
WHAT IS THE TARGET AUDIENCE FOR THE MARKET
REPORTS? The target group of our B2C E-Commerce reports are decision makers in top-management, for example from the departments E-Commerce, Business Development, Strategy, Marketing, etc. from large corporations worldwide.
WHAT SOURCES ARE USED FOR THE MARKET REPORTS? The reports are all based on reliable sources including national and international statistical offices, industry and trade associations, business reports, business and company databases, journals, company registries, news portals and many other sources.
WHAT TYPE OF RESEARCHERS ARE FINDING THE
INFORMATION FOR OUR MARKET REPORTS? yStats.com employs multilingual researchers that research and filter all sources and translate the relevant information into English. This ensures that the content of the original sources is correctly interpreted.
WHAT TYPE OF ANALYSTS ARE WRITING THE MARKET REPORTS? After the information is researched, it is further analyzed by our international team of research analysts. These analysts have a long experience in the field of E-Commerce research, and they understand the specifications of the market.
WHERE CAN I SEE WHAT KIND OF INFORMATION IS INCLUDED IN THE MARKET REPORTS? For every market report, a detailed Table of Contents is available, clearly stating what information is included. All Table of Contents can be found on our homepage and in the product brochures of the market reports.
IS THE INFORMATION IN THE MARKET REPORTS COMPARABLE FROM COUNTRY TO COUNTRY? Due to the fact that the information included in the market reports is derived from different sources, some information is not comparable across countries. Different sources mostly have different definitions.
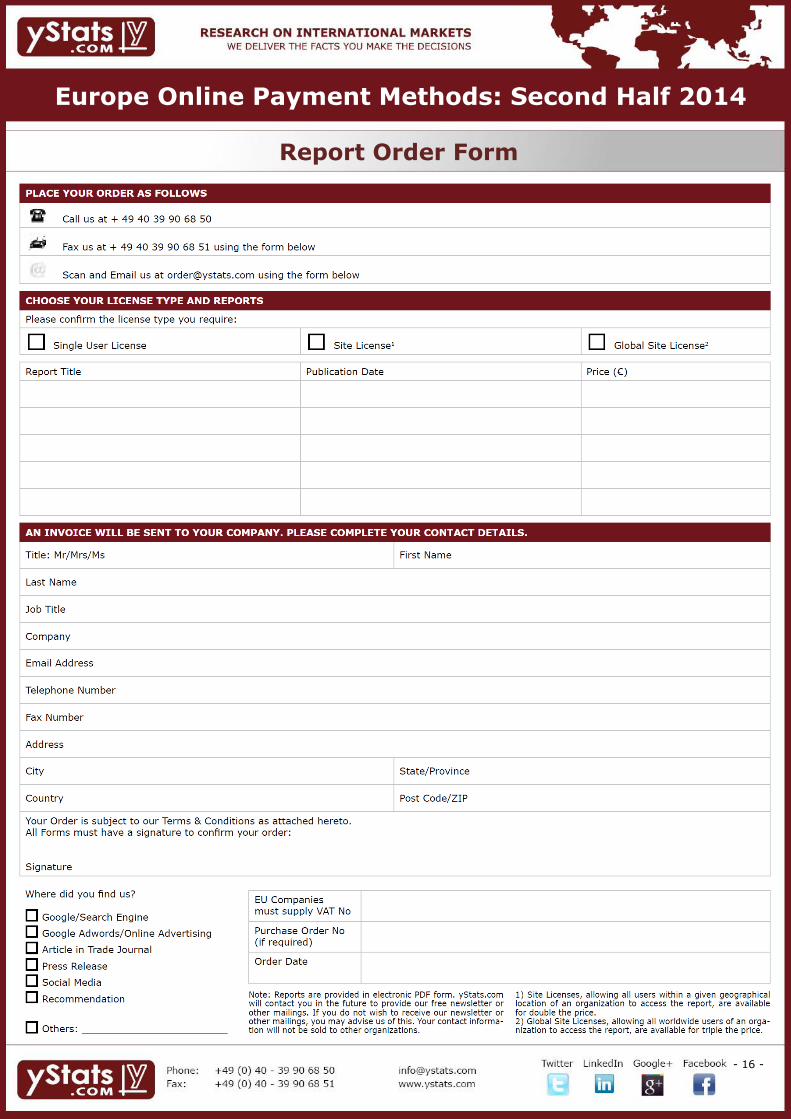
HOW DO I ORDER A MARKET REPORT? If you would like to order, please fill out the report order from the market report included in the relevant product brochure. Afterwards, please sign it and send it back to us by fax or e-mail.
IN WHAT FORMAT ARE THE MARKET REPORTS DELIVERED? The market reports are delivered in PowerPoint and PDF format. If a different format is needed, please contact us before the purchase. It would also be possible to order printed versions of the reports for a slightly higher price.
HOW LONG DOES IT TAKE ME TO GAIN ACCESS TO
THE REPORT? In general, potential clients gain access to the report within a few hours after sending out the report order form.
IS THE REPORT SENT TO MY EMAIL? In general, we provide customers with access to our website. After logging in, the customer can download the report as PowerPoint and PDF files.
IS IT POSSIBLE TO PURCHASE ONLY SELECTED PARTS FROM A MARKET REPORT? In general, the market reports are only sold as a whole. However, if you are only interested in parts of the report, please contact us.
HOW CAN I PAY FOR THE MARKET REPORT? An invoice issued by yStats.com can be paid either by bank transfer or by PayPal. Bank transfer usually takes a few working days, while with PayPal, the money is transferred immediately.
DO I HAVE TO PAY TAX IF I PURCHASE A REPORT? Customers from Germany have to pay an additional tax rate of 19%. Customers from the European Union (EU) do not have to pay tax if they enter a valid VAT Identification Number into the report order form. Customers from non-EU countries do not have to pay tax. Moreover, tax has to be paid for all private purchases from the EU.
REGARDING THE TIMING, WHEN WILL AN UPDATE
OF A MARKET REPORT BE PUBLISHED? In general, the market reports are published on a yearly basis. For further information, please take a look at the report overview, which includes a list of the reports we plan to publish in 2014. If you would like to be informed as soon as the update is published, please inform us.
HOW MANY EMPLOYEES OF MY COMPANY HAVE
ACCESS TO THE REPORTS? We offer different licensing options. Single User Licenses mean that only one user from an organization can access the report. A Site License, allowing all users within a given geographical location to access the report, is available for double the price. Global Site Licenses, allowing access to all worldwide users of an organization, are available for triple the price.
I HAVE A RESEARCH REQUEST THAT CANNOT BE ANSWERED THROUGH THE MARKET REPORTS. ARE THERE ANY FURTHER PRODUCTS? If you require further information, we also offer “Customized Research” on all sectors and countries worldwide. After a detailed briefing, we conduct pre-research and provide potential customers with an offer.
DO YOU OFFER DISCOUNTS?
If you are interested in purchasing several reports, please contact us. We will consider the possibility of bundle pricing.
DO YOU OFFER AN ANNUAL SUBSCRIPTIO OF THE MARKET REPORTS? Yes. Our product “Full Access Global E-Commerce Reports” gives customers access to all our E-Commerce market reports. Furthermore, access to all the market reports we publish during the subscription period is guaranteed.
Frequently Asked Questions
Europe Online Payment Methods: Second Half 2014
- 14 -
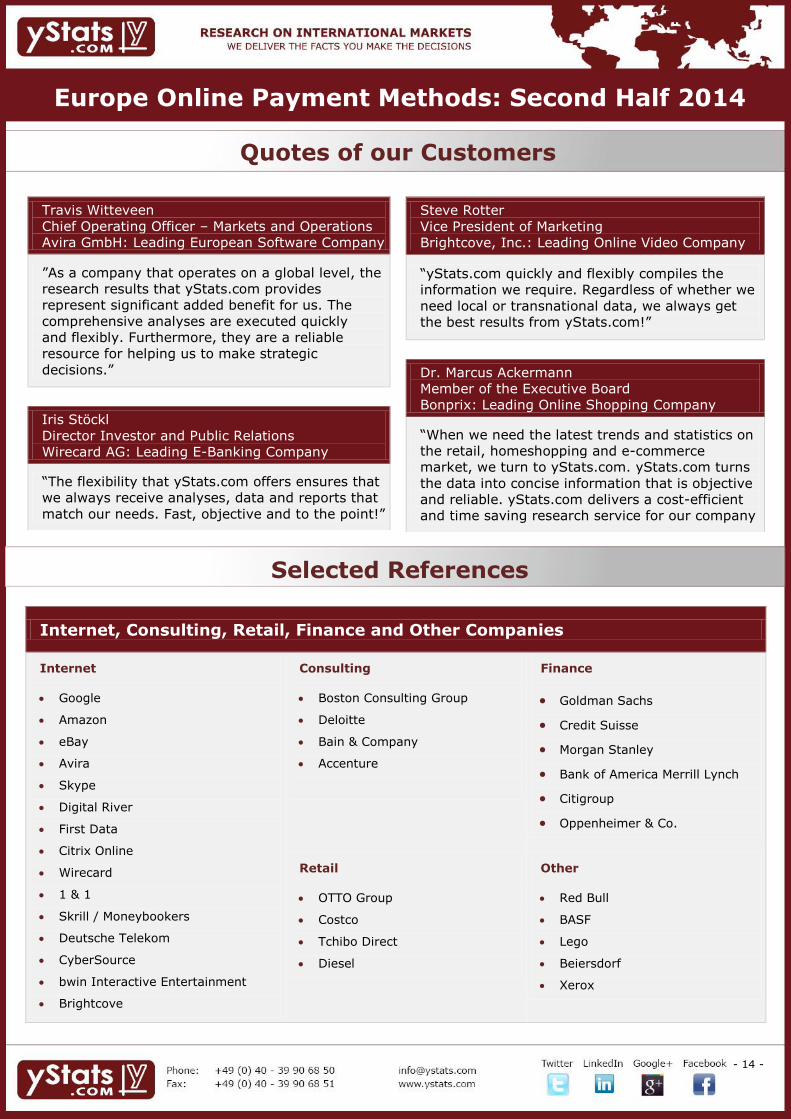
Travis Witteveen
Chief Operating Officer – Markets and Operations
Avira GmbH: Leading European Software Company
”As a company that operates on a global level, the
research results that yStats.com provides
represent significant added benefit for us. The
comprehensive analyses are executed quickly
and flexibly. Furthermore, they are a reliable
resource for helping us to make strategic
decisions.”
Iris Stöckl
Director Investor and Public Relations
Wirecard AG: Leading E-Banking Company
“The flexibility that yStats.com offers ensures that
we always receive analyses, data and reports that
match our needs. Fast, objective and to the point!”
Steve Rotter
Vice President of Marketing
Brightcove, Inc.: Leading Online Video Company
“yStats.com quickly and flexibly compiles the
information we require. Regardless of whether we
need local or transnational data, we always get
the best results from yStats.com!”
Dr. Marcus Ackermann
Member of the Executive Board
Bonprix: Leading Online Shopping Company
“When we need the latest trends and statistics on
the retail, homeshopping and e-commerce
market, we turn to yStats.com. yStats.com turns
the data into concise information that is objective
and reliable. yStats.com delivers a cost-efficient
and time saving research service for our company
Internet, Consulting, Retail, Finance and Other Companies
Internet
Amazon
eBay
Avira
Skype
Digital River
First Data
Citrix Online
Wirecard
1 & 1
Skrill / Moneybookers
Deutsche Telekom
CyberSource
bwin Interactive Entertainment
Brightcove
Consulting
Boston Consulting Group
Deloitte
Bain & Company
Accenture
Finance
Goldman Sachs
Credit Suisse
Morgan Stanley
Bank of America Merrill Lynch
Citigroup
Oppenheimer & Co.
Retail
OTTO Group
Costco
Tchibo Direct
Diesel
Other
Red Bull
BASF
Lego
Beiersdorf
Xerox
Quotes of our Customers
Selected References
Europe Online Payment Methods: Second Half 2014
- 15 -
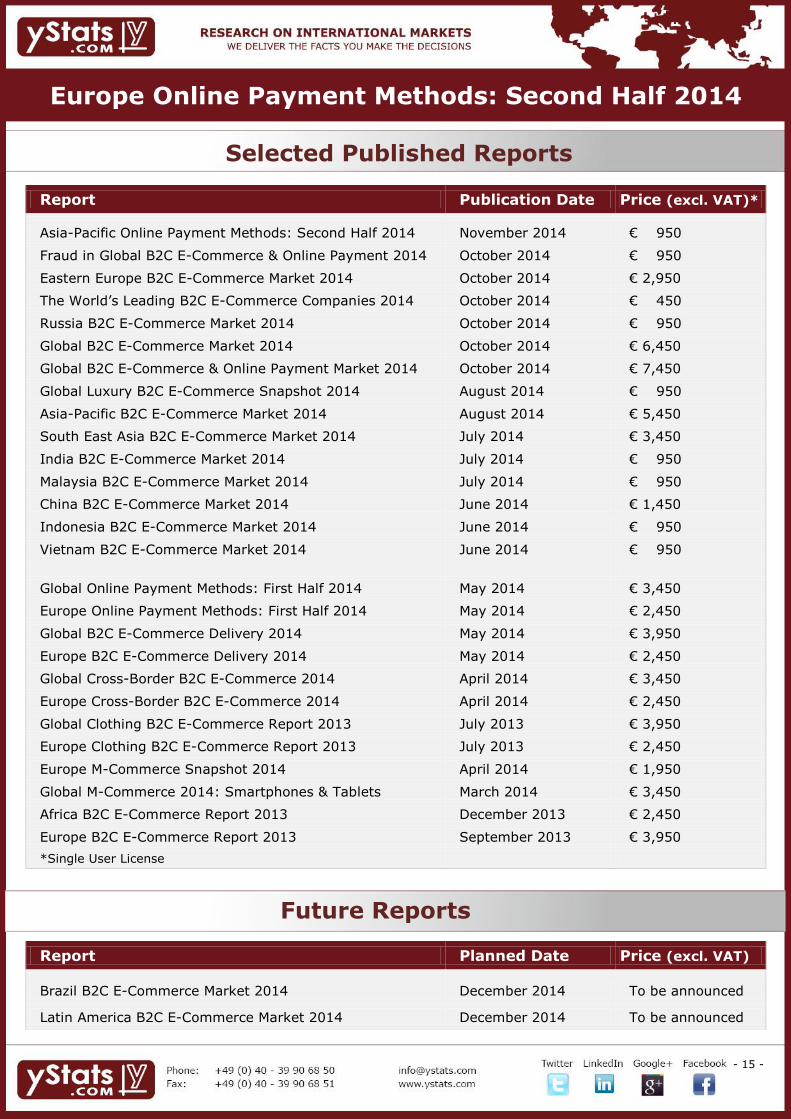
Report Publication Date Price (excl. VAT)*
Asia-Pacific Online Payment Methods: Second Half 2014 November 2014 € 950
Fraud in Global B2C E-Commerce & Online Payment 2014 October 2014 € 950
Eastern Europe B2C E-Commerce Market 2014 October 2014 € 2,950
The World’s Leading B2C E-Commerce Companies 2014 October 2014 € 450
Russia B2C E-Commerce Market 2014 October 2014 € 950
Global B2C E-Commerce Market 2014 October 2014 € 6,450
Global B2C E-Commerce & Online Payment Market 2014 October 2014 € 7,450
Global Luxury B2C E-Commerce Snapshot 2014 August 2014 € 950
Asia-Pacific B2C E-Commerce Market 2014 August 2014 € 5,450
South East Asia B2C E-Commerce Market 2014 July 2014 € 3,450
India B2C E-Commerce Market 2014 July 2014 € 950
Malaysia B2C E-Commerce Market 2014 July 2014 € 950
China B2C E-Commerce Market 2014 June 2014 € 1,450
Indonesia B2C E-Commerce Market 2014 June 2014 € 950
Vietnam B2C E-Commerce Market 2014 June 2014 € 950
Global Online Payment Methods: First Half 2014 May 2014 € 3,450
Europe Online Payment Methods: First Half 2014 May 2014 € 2,450
Global B2C E-Commerce Delivery 2014 May 2014 € 3,950
Europe B2C E-Commerce Delivery 2014 May 2014 € 2,450
Global Cross-Border B2C E-Commerce 2014 April 2014 € 3,450
Europe Cross-Border B2C E-Commerce 2014 April 2014 € 2,450
Global Clothing B2C E-Commerce Report 2013 July 2013 € 3,950
Europe Clothing B2C E-Commerce Report 2013 July 2013 € 2,450
Europe M-Commerce Snapshot 2014 April 2014 € 1,950
Global M-Commerce 2014: Smartphones & Tablets March 2014 € 3,450
Africa B2C E-Commerce Report 2013 December 2013 € 2,450
Europe B2C E-Commerce Report 2013 September 2013 € 3,950
*Single User License
Report Planned Date Price (excl. VAT)
Brazil B2C E-Commerce Market 2014 December 2014 To be announced
Latin America B2C E-Commerce Market 2014 December 2014 To be announced
Selected Published Reports
Future Reports
Europe Online Payment Methods: Second Half 2014
- 16 -
Report Order Form
Europe Online Payment Methods: Second Half 2014
- 17 -
Europe Online Payment Methods: Second Half 2014