Embed Size (px)
Citation preview
GLOBAL MOBILE PAYMENT METHODS: FIRST HALF 2016 PUBLICATION DATE: OCTOBER 2016
PAGE 2 GENERAL INFORMATION I PAGE 3 KEY FINDINGS I PAGE 4 - 8 TABLE OF CONTENTS I PAGE 9 REPORT-SPECIFIC SAMPLE
CHARTS I PAGE 10 METHODOLOGY I PAGE 11 RELATED REPORTS I PAGE 12 CLIENTS I PAGE 13-14 FREQUENTLY ASKED QUESTIONS
PAGE 15 ORDER FORM I PAGE 16 TERMS AND CONDITIONS
2
2
PRODUCT DETAILS Title:
Type of Product:
Category:
Covered Regions:
Covered Countries:
Language:
Formats:
Number of Charts:
Global Mobile Payment Methods: First Half 2016
Market Report
Online Payment
Global, Asia-Pacific, Europe, North America, Latin America, Middle
East & Africa
Japan, South Korea, Australia, China, Taiwan, India, Thailand, UK,
Germany, France, Spain, Italy, Russia, Poland, USA, Canada, Brazil,
Mexico, Nigeria, Kenya
English
PDF & PowerPoint
102
PRICES* Single User License:
Site License:
Global Site License:
€ 950 (exc. VAT)
€ 1425 (exc. VAT)
€ 1900 (exc. VAT)
QUESTIONS
ANSWERED
IN THIS REPORT
How many mobile payment users will there be by 2019?
Why do shoppers in various countries use mobile payments?
What are the main barriers to a wider adoption of mobile payments?
Which region is leading worldwide in usage of mobile money services?
How do mobile shoppers in selected markets prefer to pay for their purchases?
SECONDARY MARKET
RESEARCH
Our reports are exclusively based on secondary market research. Our researchers derive
information and data from a variety of reliable published sources and compile the data into
understandable and easy-to-use formats.
ADVANTAGES Maximum Objectivity
Reliable Sources
Up-To-Date Analysis
Boardroom-Ready PowerPoint Presentations
Guidance For Strategic Company Decisions
GLOBAL MOBILE PAYMENT METHODS: FIRST HALF 2016
CONVENIENCE AND SPEED DRIVE THE GROWTH OF MOBILE PAYMENTS
Global mobile payment adoption is driven by young, tech-savvy consumers who
value convenience and speed above everything else when making purchases. This is one of
the findings of the new report by yStats.com. In South Korea, a frontrunner of the mobile
payment trend, a majority of mobile payment users named convenience as the reason for
paying via mobile as of early 2016, while more than 50% of those surveyed also indicated
fast payment processing speed and one-third cited related promotions. In Europe and the
USA, surveys show that mobile shoppers would like to have their payment details saved in
order to be able to complete their next purchase with just one click.
Remote usage of mobile payment services, such as for online shopping, remained
ahead of in-store usage in 2015. Nevertheless, the number of proximity mobile payment
users is projected to top 1 billion worldwide in the next three years, according to a forecast
cited in the yStats.com report. Numerous new product launches and expansion to new
markets during 2016, such as Walmart Pay in the USA, Android Pay in the UK and Samsung
Pay in Brazil, encourage this trend.
Seeing no benefits from mobile payments and security concerns are the top barriers
to mobile payment adoption, according to consumer surveys in countries such as the USA,
Germany and the UK, cited in the yStats.com report. Innovative security features, such as
biometric authentication, are being introduced to allay customers’ fears over mobile
payment security.
GLOBAL MOBILE PAYMENT METHODS: FIRST HALF 2016
3
MANAGEMENT SUMMARY
GLOBAL DEVELOPMENTS
Mobile Payment Usage In-Store and Online, in % of Respondents, by Generation, 2015
Perception of Security of Mobile Payments, in % of Respondents, by Generations, 2015
Number of Mobile Money Accounts, by Registered and Active, by Selected Regions, in millions, December 2015
Breakdown of Types of Payments Made with Mobile Money, by Number of Transactions and Value of
Transactions, in %, December 2015
Mobile P2P Money Transfer Transaction Value, in USD billion, 2014 & 2019f
Number of P2P Mobile Money Transfer Users, in millions, 2014 – 2019f
Mobile Proximity Payment Transaction Value, in USD billion, 2014 & 2019f
Number of Proximity Mobile Payment Users, in millions, 2014 – 2019f
ASIA-PACIFIC
3.1 ADVANCED MARKETS
3.1.1 JAPAN
Online and Mobile Payment Trends and News about Players, H1 2016
Payment Methods Used in Online Shopping, incl. “Payment via Mobile Carrier”, in % of Online Shoppers, March
2016
Number and Value of Electronic Money Transactions, in millions and in JPY billions, and in % Year-on-Year
Change, 2010-2015
3.1.2 SOUTH KOREA
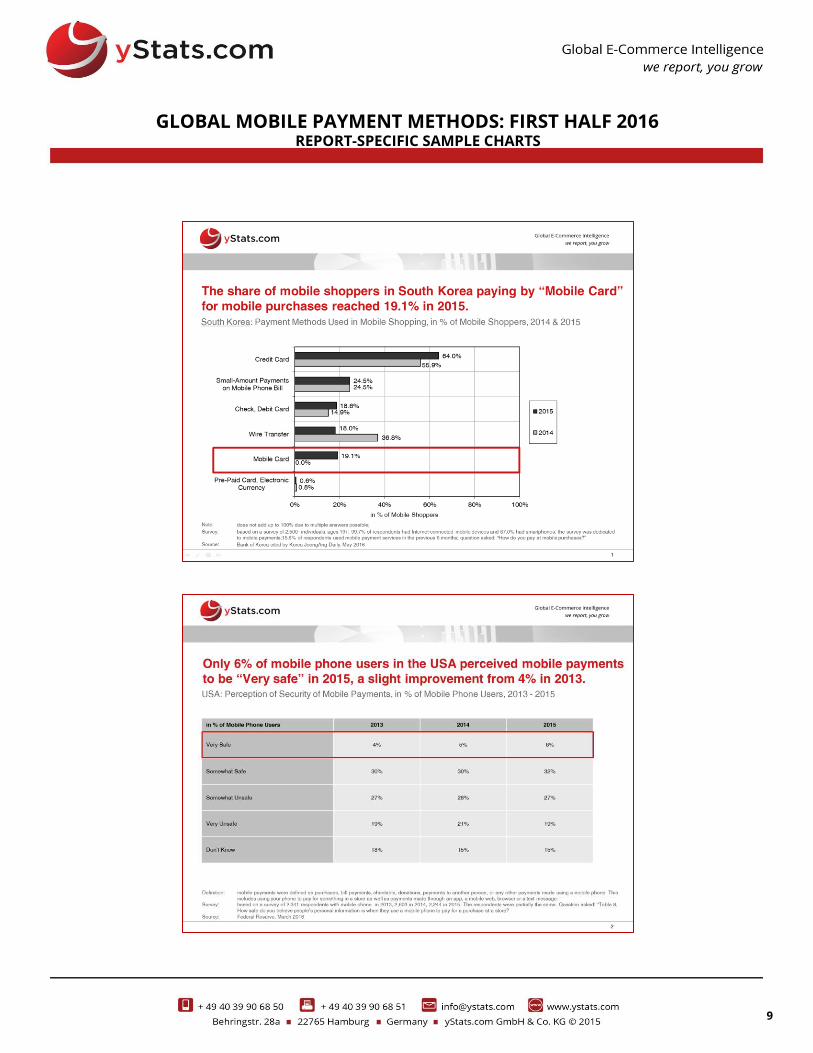
Payment Methods Used in Online Shopping, incl. “Mobile Payment”, in % of Online Shoppers, October 2015
Payment Methods Used in Mobile Shopping, in % of Mobile Shoppers, 2014 & 2015
Purposes of Using Mobile Payments, in % of Mobile Payment Users, September 2015
Reasons for Using Mobile Payment Services, in % of Mobile Payment Users, May 2016
Overview of Four Selected Mobile Payment Services, incl. Provider, Launch Date and Number of Users, June
2016
3.1.3 AUSTRALIA
Breakdown of Frequency of Using Contactless Payments In-Store, in % of Internet Users, 2015
3.2 EMERGING MARKETS
3.2.1 CHINA
Online and Mobile Payment Trends and News about Players, H1 2016
Number of Mobile Payment Users, in millions, and Penetration, in % of Mobile Internet Users, 2014 & 2015
GLOBAL MOBILE PAYMENT METHODS: FIRST HALF 2016
1 2
3
TABLE OF CONTENTS (1 OF 5)
5
5
ASIA-PACIFIC (Cont.)
3.2 EMERGING MARKETS (Cont.)
3.2.1 CHINA (Cont.)
Proximity Mobile Payment Users, in millions, and Penetration, in % of Smartphone Users, 2014 – 2020f
Third-Party Mobile Payment GMV, in CNY trillion, and in % Year-on-Year Change, 2012 - 2019f
Breakdown of Third-Party Mobile GMV by Provider, in %, 2015
Breakdown of Third-Party Mobile Payment Transaction Volume by Providers, in %, Q4 2015
Number of Active Users of Selected Mobile Payment Services, in millions, Q4 2015
3.2.2 TAIWAN
Share of Smartphone Users Who Use Mobile Payment Services, in %, 2014 & 2015
Top 5 Verification Methods Acceptable to Consumers in Mobile Payments, in % of Mobile Payment Users, 2015
3.2.3 INDIA
Top 3 Mobile Wallet Apps, by Penetration, in % of Mobile Payment App Users, and Average Time Spent Per
User Per Month, in minutes, December 2015 & April 2016
3.2.4 THAILAND
Value of Mobile Payment Transactions, in THB billion, and Volume, in millions, by Bank, Non-Bank and Total,
2010 – 2015
EUROPE
4.1. REGIONAL
Share of Online Shoppers Who Are More Inclined to Shop More Often from a Store Which Saves Their Payment
Details for One-Click Ordering, by Mobile Shoppers and Non-Mobile Shoppers, by Selected European
Countries, the USA and Australia, April 2016
Share of Internet Users Who Would Feel Confident that Their Money Is Secure If They Used Contactless
Payments, April 2016
Top Locations Where Consumers Would Want to Use Biometric Authentication for Payments, in % of
Respondents, May 2016
4.2. ADVANCED MARKETS
4.2.1. UK
Online and Mobile Payment Trends and News about Players, H1 2016
GLOBAL MOBILE PAYMENT METHODS: FIRST HALF 2016
TABLE OF CONTENTS (2 OF 5)
3
4
6
6
EUROPE
4.2. ADVANCED MARKETS (Cont.)
4.2.1. UK (Cont.)
Share of Online Card Purchases Made on Smartphones and Tablets, in %, 2014 & 2015
Breakdown of Frequency of Using a Mobile Phone for Transactional Activities, incl. “Making Payments in a
Shop”, in % of Mobile Users, 2015
Breakdown of Attitude Towards Security of Mobile Payments, in % of Mobile Users, by Age Group, Gender and
Total, 2015
Contactless Payment Statistics, incl. Number of Contactless Cards Issued, by Debit, Credit and Total, in millions,
Monthly Spending on Contactless Cards, in GBP million, Number of Monthly Contactless Transactions, in
millions, and Average Value of Contactless Transactions, in GBP, by Debit, Credit/Charge Cards and Total,
Number of Accepting Terminals/Outlets, May 2015 & May 2016
4.2.2. GERMANY
Online and Mobile Payment Trends and News about Players, August 2016
Breakdown of Online and Mail Order Sales, by Payment Methods, in % and in EUR million, 2014 & 2015
Most Important Criteria When Choosing a Payment Method to Purchase Online, incl. “Simple and Comfortable
Usage on Mobile”, in % of Online Shoppers, 2015
Payment Methods Used in Mobile Shopping, in % of Mobile Shoppers, May 2015
Usage of and Interest in Mobile Payments In-Store and Payments Based on Biometric Identification In-Store, in
% of Consumers, and in % of Retailers, May 2016
Share of Smartphone Users Who Used NFC Payment or Could Imagine Using It in the Future, in %, April 2016
Reasons for Not Using NFC Payments, in % of Smartphone Users Who Have Not Used NFC Payments, April
2016
4.2.3. FRANCE
Awareness of Contactless Payments, and Usage of Contactless Mobile Payments, by Monthly Payment with
NFC Card and with NFC-Enabled Smartphone, in % of Internet Users, 2014 & 2015
Number of Cards with Contactless Payment Functionality, in millions, May 2015 & May 2016
Number of Retail Stores with Contactless Payment Terminals, in thousands, May 2015 & May 2016
Number of Payment Transactions with Contactless Payment Cards, in millions, May 2015 & May 2016
4.2.4. SPAIN
Payment Methods Used in Mobile Shopping, in % of Mobile Shoppers, 2014 & 2015
In-Store Mobile Payments Used, by Type, in % of Digital Shoppers, February 2016
4.2.5. ITALY
Breakdown of Electronic Retail Payments, by Card Payments In-Store and Digital Payments, incl. “M-Commerce
Payment” and “Mobile POS Contactless Payment”, 2013 - 2015
4
GLOBAL MOBILE PAYMENT METHODS: FIRST HALF 2016
TABLE OF CONTENTS (3 OF 5)
7
7
EUROPE (Cont.)
4.2. ADVANCED MARKETS (Cont.)
4.2.5. ITALY (Cont.)
Contactless Payment Statistics, incl. Number of Contactless Cards in Circulation, in millions, Number of Active
Contactless Cards, in millions, Value of Contactless Transactions, in EUR billion, Number of Contactless
Transactions, in millions, Number of Contactless POS, in thousands, 2012 - 2015
4.3. EMERGING MARKETS
4.3.1. RUSSIA
Payment Methods Used in Online Shopping, incl. “SMS”, in % of Online Shoppers, 2013 - 2015
Payment Methods Used in Online Shopping, incl. “SMS”, in % of Online Shoppers, by Gender and Location Type,
2015
Online Payment Methods Used When Paying Online via Smartphone, in % of Users, March 2016
4.3.2 POLAND
Payment Methods Preferred in Online Shopping, incl. “Mobile Payments”, in % of Online Shoppers, April 2016
NORTH AMERICA
5.1. REGIONAL
Breakdown of All Payment Transactions by Payment Methods, incl. “Mobile Devices”, in %, by Country, 2015
Mobile Payment Platforms Used, in % of Respondents, by Country, 2015
5.2. USA
Online Payment Trends and News about Players, H1 2016
General Payment Methods Used, incl. “Mobile Wallet”, in % of Internet Users, March 2016
In-Person Mobile Payment Value, in USD billion, 2014 – 2019f
Mobile Payment User Penetration, in % of Mobile Phone Users and Smartphone Users, 2011 - 2015
Mobile Payment User Penetration, in % of Mobile Phone Users, by Age Group, 2015
Mobile Payment Uses, in % of Mobile Payment Users, 2015
Reasons for Not Using Mobile Payments, in % of Mobile Phone Users Who Did Not Use Mobile Payments, 2015
Perception of Security of Mobile Payments, in % of Mobile Phone Users, 2013 - 2015
Attitudes Toward Mobile Payments, in % of Consumers, by Generation, 2015
4
5
GLOBAL MOBILE PAYMENT METHODS: FIRST HALF 2016
TABLE OF CONTENTS (4 OF 5)
8
8
NORTH AMERICA (Cont.)
5.3. CANADA
Share of Smartphone Users Who Expect to Make More Mobile Payments in the Next Year, by Gender,
Generation and Total, in %, 2015 & 2016
Mobile Payment Apps Used, in % of Mobile Payments Users, by Gender, Generation and Total, April 2016
LATIN AMERICA
6.1. REGIONAL
Top 5 Mobile Services That Have Never Been Used by Mobile Internet Users, incl. Payment-Related, in % of
Mobile Internet Users, 2015
Share of Consumers Interested in In-Store Mobile Payments, in % of Surveyed Consumers, by Brazil and
Mexico, June 2016
6.2. BRAZIL
Online Payment Trends and News about Players, H1 2016
6.3. MEXICO
Share of Banked Internet Users Who Conduct Banking Transactions on Smartphones, in %, 2015
MIDDLE EAST AND AFRICA
7.1. REGIONAL
Share of Consumers in the Middle East Who Would Opt for Alternative Payment Methods, in %, and Selected
Alternative Payment Methods They Would Opt for, incl. “Mobile Wallet”, in %, May 2016
7.2. NIGERIA
Number and Value of Internet and Mobile Payment Transactions, in millions and in NGN billion, 2011- 2015
7.3. KENYA
Mobile Payment Statistics, incl. Number of Transactions, in millions, Value of Transactions, in KES billion,
Number of Customers, in millions, and Number of Agents, in thousands, 2008 - 2015
GLOBAL MOBILE PAYMENT METHODS: FIRST HALF 2016
TABLE OF CONTENTS (5 OF 5)
7
5
6
9
9
GLOBAL MOBILE PAYMENT METHODS: FIRST HALF 2016
REPORT-SPECIFIC SAMPLE CHARTS
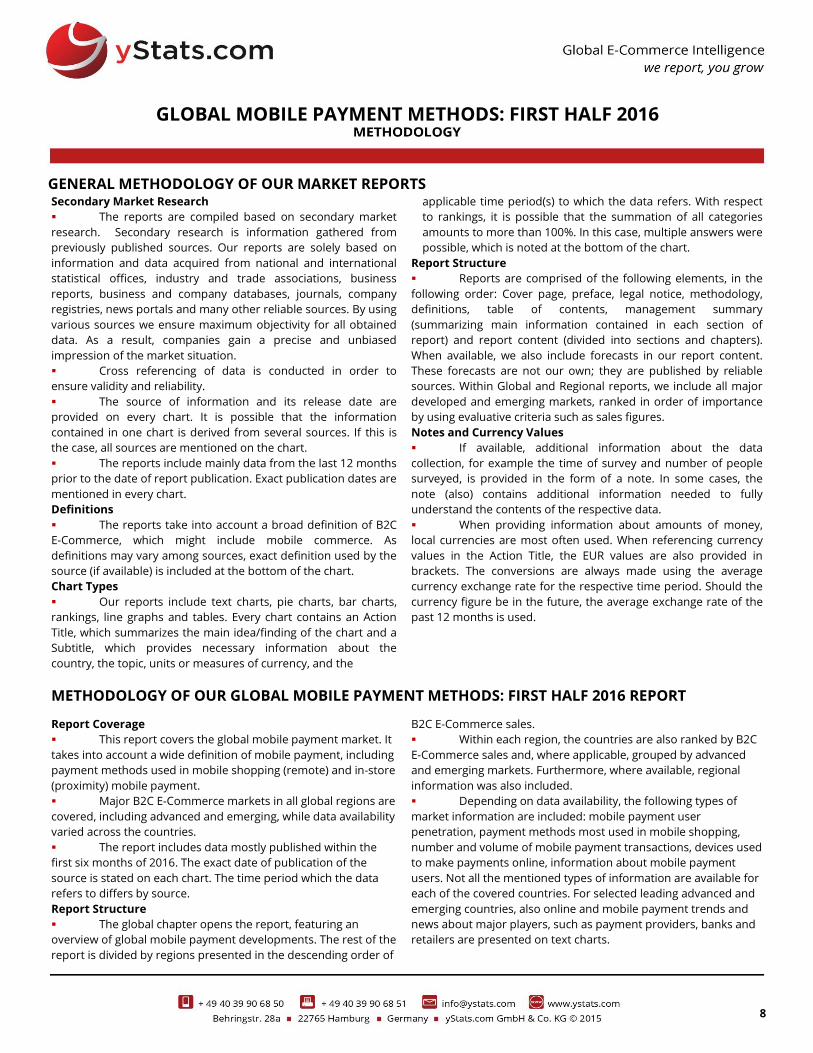
GENERAL METHODOLOGY OF OUR MARKET REPORTS Secondary Market Research
The reports are compiled based on secondary market
research. Secondary research is information gathered from
previously published sources. Our reports are solely based on
information and data acquired from national and international
statistical offices, industry and trade associations, business
reports, business and company databases, journals, company
registries, news portals and many other reliable sources. By using
various sources we ensure maximum objectivity for all obtained
data. As a result, companies gain a precise and unbiased
impression of the market situation.
Cross referencing of data is conducted in order to
ensure validity and reliability.
The source of information and its release date are
provided on every chart. It is possible that the information
contained in one chart is derived from several sources. If this is
the case, all sources are mentioned on the chart.
The reports include mainly data from the last 12 months
prior to the date of report publication. Exact publication dates are
mentioned in every chart.
Definitions
The reports take into account a broad definition of B2C
E-Commerce, which might include mobile commerce. As
definitions may vary among sources, exact definition used by the
source (if available) is included at the bottom of the chart.
Chart Types
Our reports include text charts, pie charts, bar charts,
rankings, line graphs and tables. Every chart contains an Action
Title, which summarizes the main idea/finding of the chart and a
Subtitle, which provides necessary information about the
country, the topic, units or measures of currency, and the
applicable time period(s) to which the data refers. With respect
to rankings, it is possible that the summation of all categories
amounts to more than 100%. In this case, multiple answers were
possible, which is noted at the bottom of the chart.
Report Structure
Reports are comprised of the following elements, in the
following order: Cover page, preface, legal notice, methodology,
definitions, table of contents, management summary
(summarizing main information contained in each section of
report) and report content (divided into sections and chapters).
When available, we also include forecasts in our report content.
These forecasts are not our own; they are published by reliable
sources. Within Global and Regional reports, we include all major
developed and emerging markets, ranked in order of importance
by using evaluative criteria such as sales figures.
Notes and Currency Values
If available, additional information about the data
collection, for example the time of survey and number of people
surveyed, is provided in the form of a note. In some cases, the
note (also) contains additional information needed to fully
understand the contents of the respective data.
When providing information about amounts of money,
local currencies are most often used. When referencing currency
values in the Action Title, the EUR values are also provided in
brackets. The conversions are always made using the average
currency exchange rate for the respective time period. Should the
currency figure be in the future, the average exchange rate of the
past 12 months is used.
METHODOLOGY OF OUR GLOBAL MOBILE PAYMENT METHODS: FIRST HALF 2016 REPORT
Report Coverage
This report covers the global mobile payment market. It
takes into account a wide definition of mobile payment, including
payment methods used in mobile shopping (remote) and in-store
(proximity) mobile payment.
Major B2C E-Commerce markets in all global regions are
covered, including advanced and emerging, while data availability
varied across the countries.
The report includes data mostly published within the
first six months of 2016. The exact date of publication of the
source is stated on each chart. The time period which the data
refers to differs by source.
Report Structure
The global chapter opens the report, featuring an
overview of global mobile payment developments. The rest of the
report is divided by regions presented in the descending order of
B2C E-Commerce sales.
Within each region, the countries are also ranked by B2C
E-Commerce sales and, where applicable, grouped by advanced
and emerging markets. Furthermore, where available, regional
information was also included.
Depending on data availability, the following types of
market information are included: mobile payment user
penetration, payment methods most used in mobile shopping,
number and volume of mobile payment transactions, devices used
to make payments online, information about mobile payment
users. Not all the mentioned types of information are available for
each of the covered countries. For selected leading advanced and
emerging countries, also online and mobile payment trends and
news about major players, such as payment providers, banks and
retailers are presented on text charts.
GLOBAL MOBILE PAYMENT METHODS: FIRST HALF 2016
8
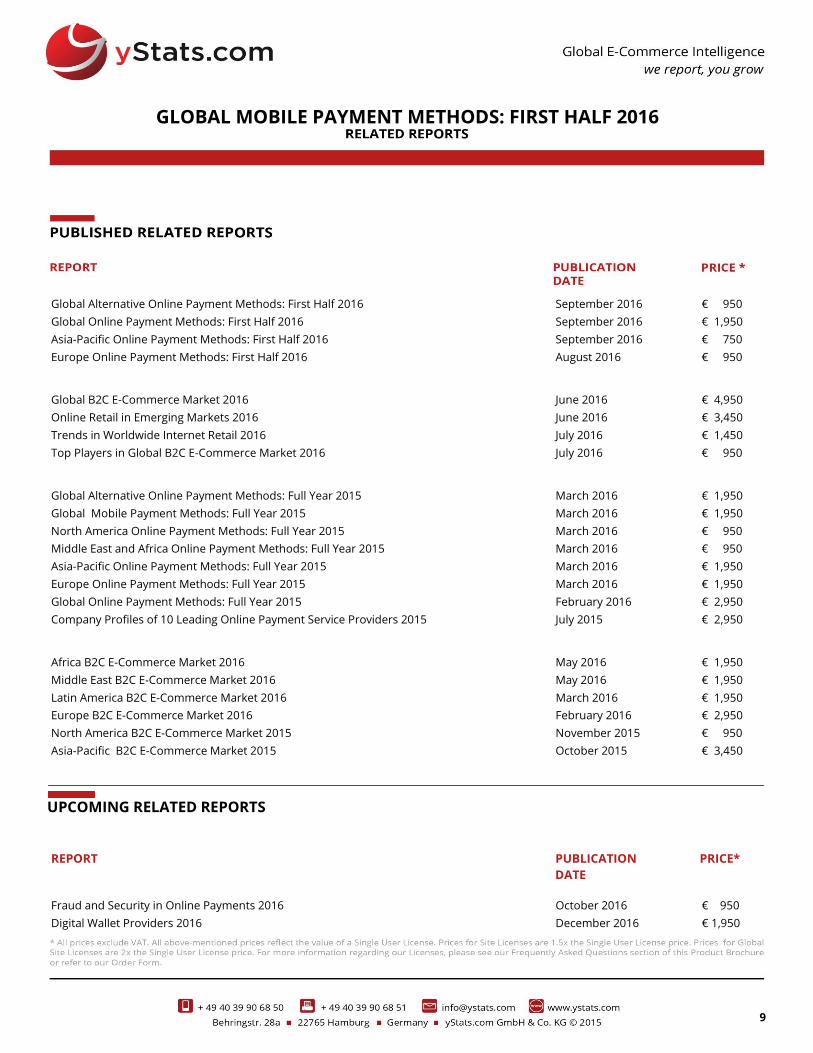
UPCOMING RELATED REPORTS
Global Alternative Online Payment Methods: First Half 2016 September 2016 € 950
Global Online Payment Methods: First Half 2016 September 2016 € 1,950
Asia-Pacific Online Payment Methods: First Half 2016
Europe Online Payment Methods: First Half 2016
September 2016
August 2016
€ 750
€ 950
Global B2C E-Commerce Market 2016 June 2016 € 4,950
Online Retail in Emerging Markets 2016 June 2016 € 3,450
Trends in Worldwide Internet Retail 2016 July 2016 € 1,450
Top Players in Global B2C E-Commerce Market 2016 July 2016 € 950
Global Alternative Online Payment Methods: Full Year 2015 March 2016 € 1,950
Global Mobile Payment Methods: Full Year 2015 March 2016 € 1,950
North America Online Payment Methods: Full Year 2015 March 2016 € 950
Middle East and Africa Online Payment Methods: Full Year 2015 March 2016 € 950
Asia-Pacific Online Payment Methods: Full Year 2015 March 2016 € 1,950
Europe Online Payment Methods: Full Year 2015 March 2016 € 1,950
Global Online Payment Methods: Full Year 2015 February 2016 € 2,950
Company Profiles of 10 Leading Online Payment Service Providers 2015 July 2015 € 2,950
Africa B2C E-Commerce Market 2016 May 2016 € 1,950
Middle East B2C E-Commerce Market 2016 May 2016 € 1,950
Latin America B2C E-Commerce Market 2016 March 2016 € 1,950
Europe B2C E-Commerce Market 2016 February 2016 € 2,950
North America B2C E-Commerce Market 2015 November 2015 € 950
Asia-Pacific B2C E-Commerce Market 2015 October 2015 € 3,450
REPORT
PUBLICATION
DATE
PRICE*
Fraud and Security in Online Payments 2016
Digital Wallet Providers 2016
October 2016
December 2016
€ 950
€ 1,950
GLOBAL MOBILE PAYMENT METHODS: FIRST HALF 2016
9
10
11
12
13
14