Embed Size (px)
Citation preview
GLOBAL ONLINE PAYMENT METHODS: SECOND HALF 2016 PUBLICATION DATE: JANUARY 2017
PAGE 2 GENERAL INFORMATION I PAGE 3 KEY FINDINGS I PAGE 4-9 TABLE OF CONTENTS I PAGE 10 REPORT-SPECIFIC SAMPLE
CHARTS I PAGE 11 METHODOLOGY I PAGE 12 RELATED REPORTS I PAGE 13 CLIENTS I PAGE 14-15 FREQUENTLY ASKED QUESTIONS
PAGE 16 ORDER FORM I PAGE 17 TERMS AND CONDITIONS
2
2
PRODUCT DETAILS Title:
Type of Product:
Category:
Covered Regions:
Covered Countries:
Language:
Formats:
Number of Charts:
Global Online Payment Methods: Second Half 2016
Report
Online Payment
Africa, Asia-Pacific, Europe, Latin America, Middle East, North
America
Australia, Brazil, Canada, China, Colombia, France, Germany, India,
Indonesia, Italy, Japan, Kenya, Mexico, Nigeria, Poland, Russia, Saudi
Arabia, South Africa, South Korea, Spain, Sweden, Turkey, UAE, UK,
USA
English
PDF & PowerPoint
140
PRICES* Single User License:
Site License:
Global Site License:
€ 1,950 (exc. VAT)
€ 2,925 (exc. VAT)
€ 3,900 (exc. VAT)
We occasionally offer a discount on selected reports as newer reports are published.
Please see the most up-to-date pricing on our website www.ystats.com.
QUESTIONS
ANSWERED
IN THIS REPORT
What are the top payment methods used by online shoppers worldwide?
How do online shoppers’ preferences for payment options differ from country to country?
What are the most important alternative online payment methods?
What are the top online and mobile payment trends around the world?
How are mobile payments evolving?
SECONDARY MARKET
RESEARCH
Our reports are exclusively based on secondary market research. Our researchers derive
information and data from a variety of reliable published sources and compile the data into
understandable and easy-to-use formats.
ADVANTAGES Maximum Objectivity
Reliable Sources
Up-To-Date Analysis
Boardroom-Ready PowerPoint Presentations
Guidance For Strategic Company Decisions
GLOBAL ONLINE PAYMENT METHODS: SECOND HALF 2016
EMERGING MARKETS LEADING THE GLOBAL ONLINE PAYMENT TRANSFORMATION
The preferences of online shoppers with regard to payment methods continue to
differ worldwide. Having accepted this fact, two thirds of online retailers now offer at least 3
different payment options, according to an international survey from 2016 cited in the
yStats.com report. Although credit and debit cards still account for the highest share of
global E-Commerce sales compared to other individual payment methods, the combined
share of alternative payment methods now outweighs bank card payments and accounts
for more than 50% of global online retail payments.
The fast growing emerging markets stand behind this global trend. Lower bank card
penetration in these countries compared to advanced markets encourages the search for
new alternatives, thus facilitating payment innovation. This is best seen in proliferation of
mobile payments: consumers in regions such as Latin America and Asia-Pacific rank above
the global average for willingness to use mobile payments, according to recent research
cited in the yStats.com publication. Another 2016 survey suggests that smartphone owners
in India, South Korea, South Africa and the UAE are more likely to be using mobile wallets
than those in the USA, the UK or Germany.
Whether in emerging or advanced markets, payment security is one of online
shoppers’ top considerations when paying for purchases. While established online payment
security measures like 3D Secure authentication remain valid, new authentication methods
are being developed to answer the demand for increased payments safety. As the
yStats.com report reveals, fingerprint ID is one of the top innovative measures that online
shoppers are willing to use in the near future.
GLOBAL ONLINE PAYMENT METHODS: SECOND HALF 2016
3
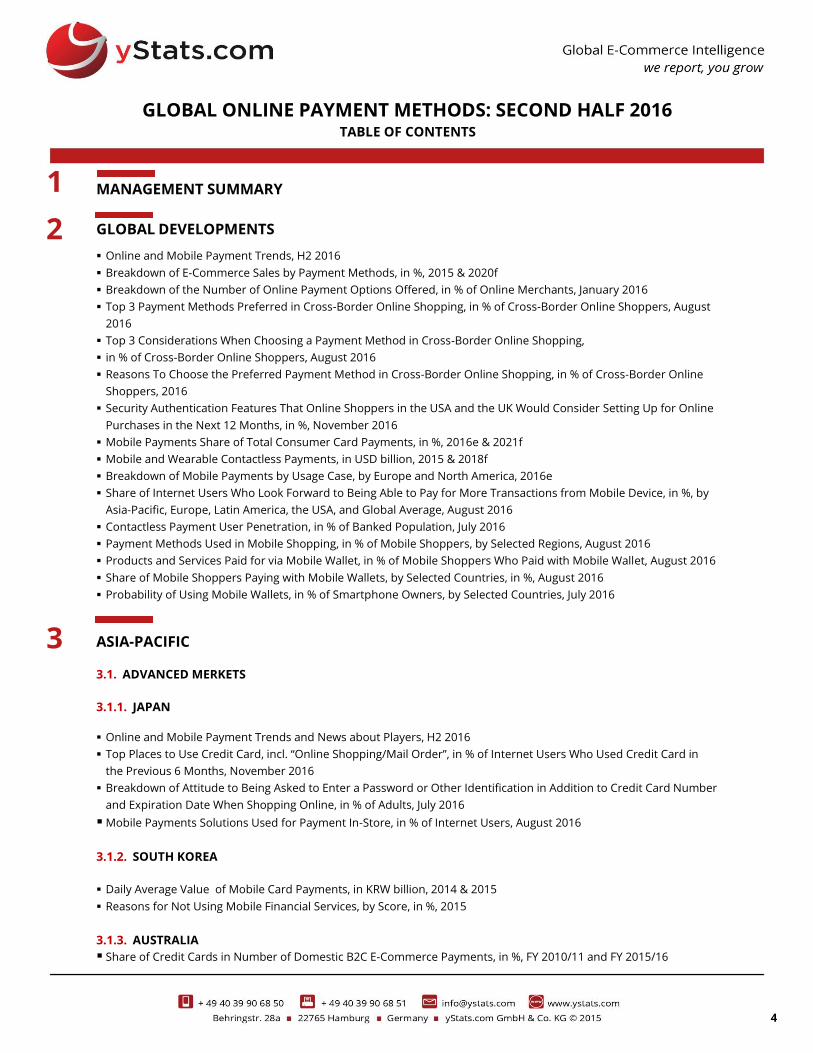
MANAGEMENT SUMMARY
GLOBAL DEVELOPMENTS
Online and Mobile Payment Trends, H2 2016
Breakdown of E-Commerce Sales by Payment Methods, in %, 2015 & 2020f
Breakdown of the Number of Online Payment Options Offered, in % of Online Merchants, January 2016
Top 3 Payment Methods Preferred in Cross-Border Online Shopping, in % of Cross-Border Online Shoppers, August
2016
Top 3 Considerations When Choosing a Payment Method in Cross-Border Online Shopping,
in % of Cross-Border Online Shoppers, August 2016
Reasons To Choose the Preferred Payment Method in Cross-Border Online Shopping, in % of Cross-Border Online
Shoppers, 2016
Security Authentication Features That Online Shoppers in the USA and the UK Would Consider Setting Up for Online
Purchases in the Next 12 Months, in %, November 2016
Mobile Payments Share of Total Consumer Card Payments, in %, 2016e & 2021f
Mobile and Wearable Contactless Payments, in USD billion, 2015 & 2018f
Breakdown of Mobile Payments by Usage Case, by Europe and North America, 2016e
Share of Internet Users Who Look Forward to Being Able to Pay for More Transactions from Mobile Device, in %, by
Asia-Pacific, Europe, Latin America, the USA, and Global Average, August 2016
Contactless Payment User Penetration, in % of Banked Population, July 2016
Payment Methods Used in Mobile Shopping, in % of Mobile Shoppers, by Selected Regions, August 2016
Products and Services Paid for via Mobile Wallet, in % of Mobile Shoppers Who Paid with Mobile Wallet, August 2016
Share of Mobile Shoppers Paying with Mobile Wallets, by Selected Countries, in %, August 2016
Probability of Using Mobile Wallets, in % of Smartphone Owners, by Selected Countries, July 2016
ASIA-PACIFIC
3.1. ADVANCED MERKETS
3.1.1. JAPAN
Online and Mobile Payment Trends and News about Players, H2 2016
Top Places to Use Credit Card, incl. “Online Shopping/Mail Order”, in % of Internet Users Who Used Credit Card in
the Previous 6 Months, November 2016
Breakdown of Attitude to Being Asked to Enter a Password or Other Identification in Addition to Credit Card Number
and Expiration Date When Shopping Online, in % of Adults, July 2016
Mobile Payments Solutions Used for Payment In-Store, in % of Internet Users, August 2016
3.1.2. SOUTH KOREA
Daily Average Value of Mobile Card Payments, in KRW billion, 2014 & 2015
Reasons for Not Using Mobile Financial Services, by Score, in %, 2015
3.1.3. AUSTRALIA
Share of Credit Cards in Number of Domestic B2C E-Commerce Payments, in %, FY 2010/11 and FY 2015/16
3
2
GLOBAL ONLINE PAYMENT METHODS: SECOND HALF 2016 TABLE OF CONTENTS
4
1
5
5
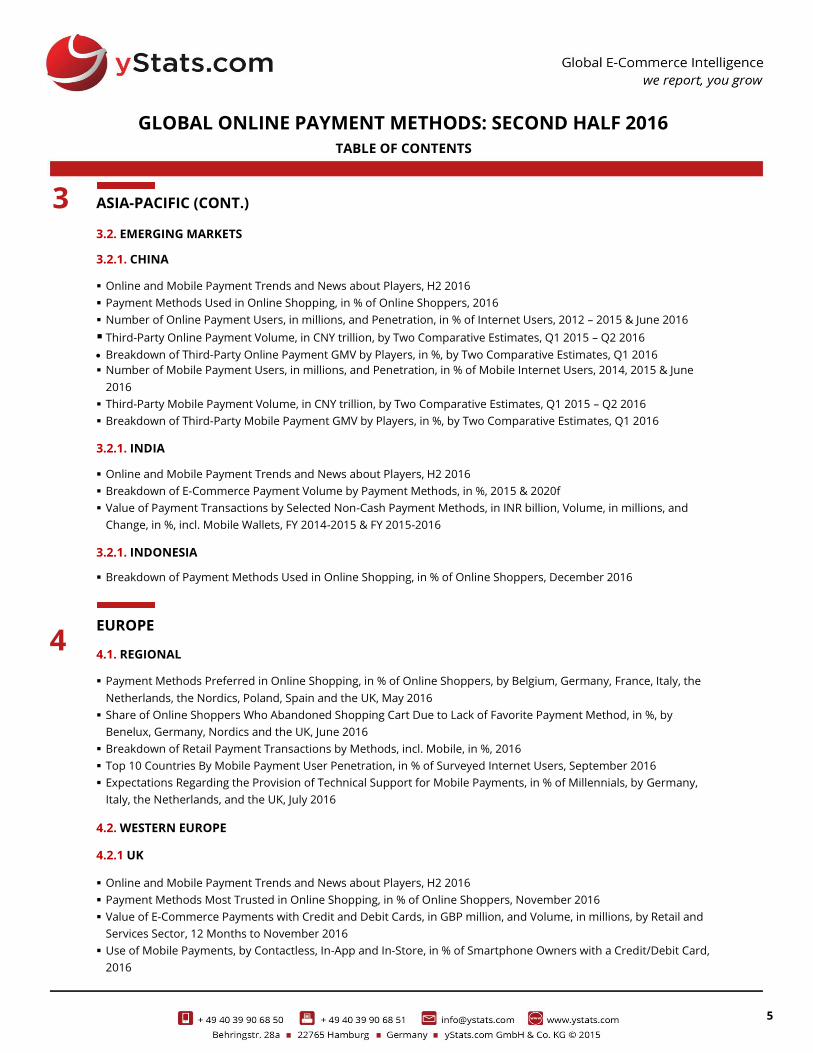
ASIA-PACIFIC (CONT.)
3.2. EMERGING MARKETS
3.2.1. CHINA
Online and Mobile Payment Trends and News about Players, H2 2016
Payment Methods Used in Online Shopping, in % of Online Shoppers, 2016
Number of Online Payment Users, in millions, and Penetration, in % of Internet Users, 2012 – 2015 & June 2016
Third-Party Online Payment Volume, in CNY trillion, by Two Comparative Estimates, Q1 2015 – Q2 2016 Breakdown of Third-Party Online Payment GMV by Players, in %, by Two Comparative Estimates, Q1 2016
Number of Mobile Payment Users, in millions, and Penetration, in % of Mobile Internet Users, 2014, 2015 & June
2016
Third-Party Mobile Payment Volume, in CNY trillion, by Two Comparative Estimates, Q1 2015 – Q2 2016
Breakdown of Third-Party Mobile Payment GMV by Players, in %, by Two Comparative Estimates, Q1 2016
3.2.1. INDIA
Online and Mobile Payment Trends and News about Players, H2 2016
Breakdown of E-Commerce Payment Volume by Payment Methods, in %, 2015 & 2020f
Value of Payment Transactions by Selected Non-Cash Payment Methods, in INR billion, Volume, in millions, and
Change, in %, incl. Mobile Wallets, FY 2014-2015 & FY 2015-2016
3.2.1. INDONESIA
Breakdown of Payment Methods Used in Online Shopping, in % of Online Shoppers, December 2016
EUROPE
4.1. REGIONAL
Payment Methods Preferred in Online Shopping, in % of Online Shoppers, by Belgium, Germany, France, Italy, the
Netherlands, the Nordics, Poland, Spain and the UK, May 2016
Share of Online Shoppers Who Abandoned Shopping Cart Due to Lack of Favorite Payment Method, in %, by
Benelux, Germany, Nordics and the UK, June 2016
Breakdown of Retail Payment Transactions by Methods, incl. Mobile, in %, 2016
Top 10 Countries By Mobile Payment User Penetration, in % of Surveyed Internet Users, September 2016
Expectations Regarding the Provision of Technical Support for Mobile Payments, in % of Millennials, by Germany,
Italy, the Netherlands, and the UK, July 2016
4.2. WESTERN EUROPE
4.2.1 UK
Online and Mobile Payment Trends and News about Players, H2 2016
Payment Methods Most Trusted in Online Shopping, in % of Online Shoppers, November 2016
Value of E-Commerce Payments with Credit and Debit Cards, in GBP million, and Volume, in millions, by Retail and
Services Sector, 12 Months to November 2016
Use of Mobile Payments, by Contactless, In-App and In-Store, in % of Smartphone Owners with a Credit/Debit Card,
2016
GLOBAL ONLINE PAYMENT METHODS: SECOND HALF 2016
TABLE OF CONTENTS
3
4
6
6
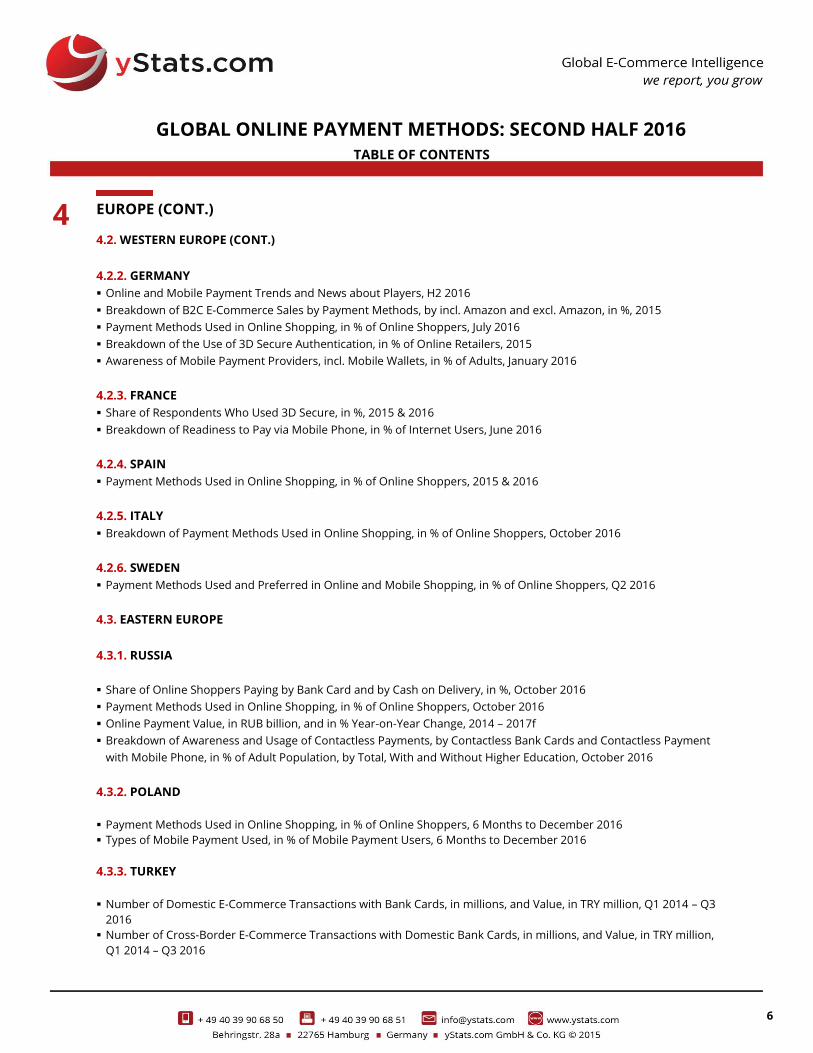
EUROPE (CONT.)
4.2. WESTERN EUROPE (CONT.)
4.2.2. GERMANY
Online and Mobile Payment Trends and News about Players, H2 2016
Breakdown of B2C E-Commerce Sales by Payment Methods, by incl. Amazon and excl. Amazon, in %, 2015
Payment Methods Used in Online Shopping, in % of Online Shoppers, July 2016
Breakdown of the Use of 3D Secure Authentication, in % of Online Retailers, 2015
Awareness of Mobile Payment Providers, incl. Mobile Wallets, in % of Adults, January 2016
4.2.3. FRANCE
Share of Respondents Who Used 3D Secure, in %, 2015 & 2016
Breakdown of Readiness to Pay via Mobile Phone, in % of Internet Users, June 2016
4.2.4. SPAIN
Payment Methods Used in Online Shopping, in % of Online Shoppers, 2015 & 2016
4.2.5. ITALY
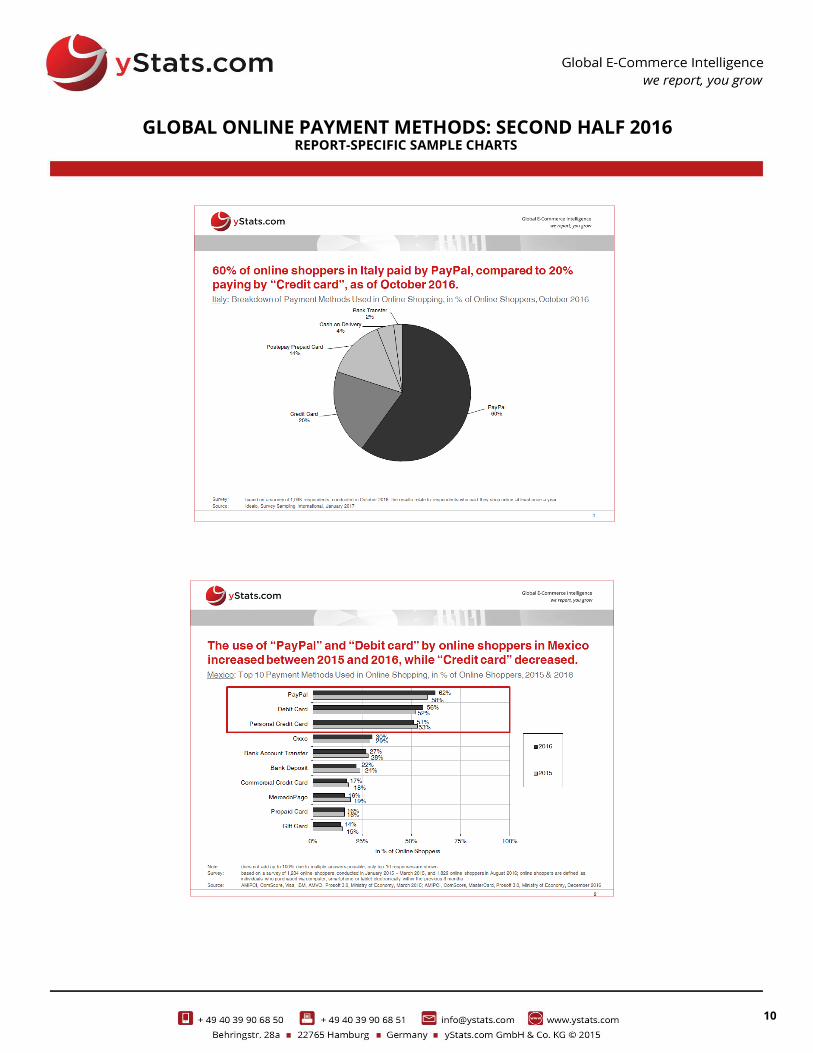
Breakdown of Payment Methods Used in Online Shopping, in % of Online Shoppers, October 2016
4.2.6. SWEDEN
Payment Methods Used and Preferred in Online and Mobile Shopping, in % of Online Shoppers, Q2 2016
4.3. EASTERN EUROPE
4.3.1. RUSSIA
Share of Online Shoppers Paying by Bank Card and by Cash on Delivery, in %, October 2016
Payment Methods Used in Online Shopping, in % of Online Shoppers, October 2016
Online Payment Value, in RUB billion, and in % Year-on-Year Change, 2014 – 2017f
Breakdown of Awareness and Usage of Contactless Payments, by Contactless Bank Cards and Contactless Payment
with Mobile Phone, in % of Adult Population, by Total, With and Without Higher Education, October 2016
4.3.2. POLAND
Payment Methods Used in Online Shopping, in % of Online Shoppers, 6 Months to December 2016
Types of Mobile Payment Used, in % of Mobile Payment Users, 6 Months to December 2016
4.3.3. TURKEY
Number of Domestic E-Commerce Transactions with Bank Cards, in millions, and Value, in TRY million, Q1 2014 – Q3
2016
Number of Cross-Border E-Commerce Transactions with Domestic Bank Cards, in millions, and Value, in TRY million,
Q1 2014 – Q3 2016
4
GLOBAL ONLINE PAYMENT METHODS: SECOND HALF 2016
TABLE OF CONTENTS
7
7
NORTH AMERICA
5.1. REGIONAL
Digital Payment Methods Used at Least Weekly, by Current Use and Future Use, in % of Consumers, July 2016
5.2. USA
Online and Mobile Payment Trends and News about Players, H2 2016
Top 3 Payment Methods Preferred in Online Shopping, in % of Online Shoppers, 2015 & 2016
Payment Methods Perceived as Safest for In-Store and Online Purchases, in % of Consumers, 2016
Payment Methods Most Trusted in Online Shopping, in % of Online Shoppers, November 2016
Mobile Payments, by Mobile App/Browser and Mobile Proximity Payments, in USD billion, 2013 – 2020f
Breakdown of Retail Payment Transactions by Methods, incl. Mobile, in %, 2016
Proximity Mobile Payment Transaction Value, in USD billion, and Breakdown by Transaction Value, in %, 2015 – 2020f
Breakdown of Proximity Mobile Payment Users by Age Group, in %, 2016
Breakdown of Attitude to Using Mobile Device to Pay for Transactions at a Store Checkout Counter, in % of
Consumers, October 2016
Factors that Make Consumers Hesitant to Use Mobile Payment Services, in % of Internet Users, February 2016
Digital Wallets Used, in % of Internet Users, August 2016
Volume of In-Store Payments with Android Pay, Apple Pay and Samsung Pay in the USA, in USD billion, 2016e
Number of In-Store Monthly Users of Android Pay, Apple Pay and Samsung Pay in the USA, in millions, 2016e
Selected Data Related to Usage of Android Pay, Apple Pay and Samsung Pay in the USA, incl. Awareness, Usage for
Purchase, Frequency of Usage, Average Number of Cards Loaded, and Satisfaction Rating, June 2016
5.3. CANADA
Breakdown of E-Commerce Transaction Value by Payment Method, in %, 2015
Breakdown of Frequency of Using Mobile Phone as a Payment Device, in % of Consumers, 2014 - 2016
Companies Most Trusted with Providing a Mobile Payment Service, in % of Consumers, July 2016
Circumstances That Would Make Internet Users in Canada More Likely to Use a Mobile Wallet, in % of Internet Users,
April 2016
LATIN AMERICA
6.1. REGIONAL
Payment Methods Used in Online Shopping, in % of Online Shoppers With Bank Account, July 2016
Penetration and Usage of Contactless Cards and Mobile Payment, in % of Consumers With Bank Account, July 2016
6.2. BRAZIL
Online and Mobile Payment Trends and News About Players, H2 2016
Breakdown of B2C E-Commerce Sales by Payment Methods, in %, 2015
Breakdown of Online Shoppers’ Preference for Payment in Installments, in %, H1 2016
5
6
GLOBAL ONLINE PAYMENT METHODS: SECOND HALF 2016 TABLE OF CONTENTS
8
8
LATIN AMERICA (CONT.)
6.3. MEXICO
Top 10 Payment Methods Used in Online Shopping, in % of Online Shoppers, 2015 & 2016
Online Payment Methods Used in Online Shopping, by Device Used, in % of Online Shoppers, August 2016
Offline Payment Methods Used in Online Shopping, by Device Used, in % of Online Shoppers, August 2016
Reasons for Not Storing Credit/Debit Card Information With Online Shops, in % of Online Shoppers, 2015 & 2016
Number of Authorized Payment Transactions on E-Commerce Websites, in millions, Value, in MXN billion, and
Authorization Rate, in % of Transactions and in % of Transaction Value, by Credit Cards and Debit Cards, Q1 2015 –
Q3 2016
Chargeback Rate, in % of Number of Authorized Payment Transactions on E-Commerce Websites and in % of Their
Value, by Credit Cards and Debit Cards, Q1 2015 – Q3 2016
6.4. COLOMBIA
Share of Online Shoppers Preferring to Pay by Credit Card, in %, June 2016
Breakdown of Online Payment Made Through Payment Gateways by Credit Cards, Debit to Bank Account and
Others, 2014 & 2015
MIDDLE EAST
7.1. REGIONAL
• Share of Online Shoppers in MENA Who Prefer to Pay with Cash on Delivery, in %, March 2016
• Breakdown of Share of Cash On Delivery, in % of E-Commerce Companies in MENA, October 2016
• Share of Cash On Delivery in Total Online Shopping in the Middle East, in %, 2015
• Devices Preferred for Mobile Payment in the Middle East and Africa, in % of Internet Users with Bank Accounts,
Summer 2016
• Breakdown of Attitude to Mobile Payment and Shopping-Related Activities, in % of Online Shoppers in MENA, March
2016
7.2. UAE
• Breakdown of Online Shoppers by Shoppers Who Prefer to Pay Online and Who Prefer to Pay On Delivery, in %,
November 2016
7.3. SAUDI ARABIA
Top Payment Method Preferred in Online Shopping, by Selected Product Categories, in % of Millennial Online
Shoppers, 2015
6
7
GLOBAL ONLINE PAYMENT METHODS: SECOND HALF 2016 TABLE OF CONTENTS
9
9
AFRICA
8.1. REGIONAL
Payment Methods Most Used in Online Shopping, in % of Online Shoppers, by Ghana, Kenya, South Africa, Uganda,
December 2016
8.2. SOUTH AFRICA
• Breakdown of Payment Methods Preferred in Online Shopping, in % of Online Shoppers, March 2016
• Share of Online Shoppers Who Would be Motivated to Shop Online More by Availability of the “On Delivery” Payment
Method, in % of Online Shoppers, March 2016
• Top Improvements That Would Make Online Shoppers Buy Online More, in % of Online Shoppers, March 2016
8.3. NIGERIA
• Breakdown of Payment Methods Preferred in Online Shopping, in % of Online Shoppers
8.4. KENYA
Mobile Payment Statistics, incl. Number of Transactions, in millions, Value of Transactions, in KES billion, Number of
Customers, in millions, and Number of Agents, in thousands, 2008 – 2015 & First Nine Months of 2016
Purposes of Using Mobile Money Services, in % of Mobile Money Users, October 2016
8
GLOBAL ONLINE PAYMENT METHODS: SECOND HALF 2016 TABLE OF CONTENTS
10
10
GLOBAL ONLINE PAYMENT METHODS: SECOND HALF 2016
REPORT-SPECIFIC SAMPLE CHARTS
GENERAL METHODOLOGY OF OUR MARKET REPORTS Secondary Market Research
The reports are compiled based on secondary market research.
Secondary research is information gathered from previously published
sources. Our reports are solely based on information and data acquired
from national and international statistical offices, industry and trade
associations, business reports, business and company databases,
journals, company registries, news portals and many other reliable
sources. By using various sources we ensure maximum objectivity for all
obtained data. As a result, companies gain a precise and unbiased
impression of the market situation.
Cross referencing of data is conducted in order to ensure
validity and reliability.
The source of information and its release date are provided on
every chart. It is possible that the information contained in one chart is
derived from several sources. If this is the case, all sources are mentioned
on the chart.
The reports include mainly data from the last 12 months prior
to the date of report publication. Exact publication dates are mentioned in
every chart.
Definitions
The reports take into account a broad definition of B2C E-
Commerce, which might include mobile commerce. As definitions may
vary among sources, exact definition used by the source (if available) is
included at the bottom of the chart.
Chart Types
Our reports include text charts, pie charts, bar charts, rankings,
line graphs and tables. Every chart contains an Action Title, which
summarizes the main idea/finding of the chart and a Subtitle, which
provides necessary information about the country, the topic, units or
measures of currency, and the applicable time period(s) to which the data
refers. With respect to rankings, it is possible that the summation of all
categories amounts to more than 100%. In this case, multiple answers were
possible, which is noted at the bottom of the chart.
Report Structure
Reports are comprised of the following elements, in the following
order: Cover page, preface, legal notice, methodology, definitions, table of
contents, management summary (summarizing main information
contained in each section of report) and report content (divided into
sections and chapters). When available, we also include forecasts in our
report content. These forecasts are not our own; they are published by
reliable sources. Within Global and Regional reports, we include all major
developed and emerging markets, ranked in order of importance by using
evaluative criteria such as sales figures.
Notes and Currency Values
If available, additional information about the data collection, for
example the time of survey and number of people surveyed, is provided in
the form of a note. In some cases, the note (also) contains additional
information needed to fully understand the contents of the respective data.
When providing information about amounts of money, local
currencies are most often used. When referencing currency values in the
Action Title, the EUR values are also provided in brackets. The conversions
are always made using the average currency exchange rate for the
respective time period. Should the currency figure be in the future, the
average exchange rate of the past 12 months is used.
METHODOLOGY OF OUR GLOBAL ONLINE PAYMENT METHODS: SECOND HALF 2016
Report Coverage
This report covers the global online payment market. It takes
into account a wide definition of online payment, including payment
methods used in online shopping and mobile payment, such as remote
and proximity payments.
Major B2C E-Commerce markets in all global regions are
covered, including advanced and emerging, while data availability varied
across the countries.
The report includes data mostly published within the last six
months of 2016. The exact date of publication of the source is stated on
each chart. The time period which the data refers to differs by source.
Report Structure
The global chapter opens the report, featuring an overview of
global online and mobile payment developments. The rest of the report is
divided by regions presented in the descending order of B2C E-Commerce
sales.
Within each region, the countries are also ranked by B2C E-
Commerce sales and, where applicable, grouped by advanced and
emerging markets. Furthermore, where available, regional information was
also included.
Depending on data availability, the following types of market
information are included: the most used and/or most preferred payment
methods among online and mobile shoppers, information about online and
mobile payment users, such as security perceptions, breakdown of E-
Commerce sales by payment methods, number and value of online/mobile
payment transactions.
Not all the mentioned types of information are available for each
of the covered countries. For selected leading advanced and emerging
countries, also online and mobile payment trends and news about major
players, such as payment providers, banks and retailers are presented on
text charts.
GLOBAL ONLINE PAYMENT METHODS: SECOND HALF 2016
11
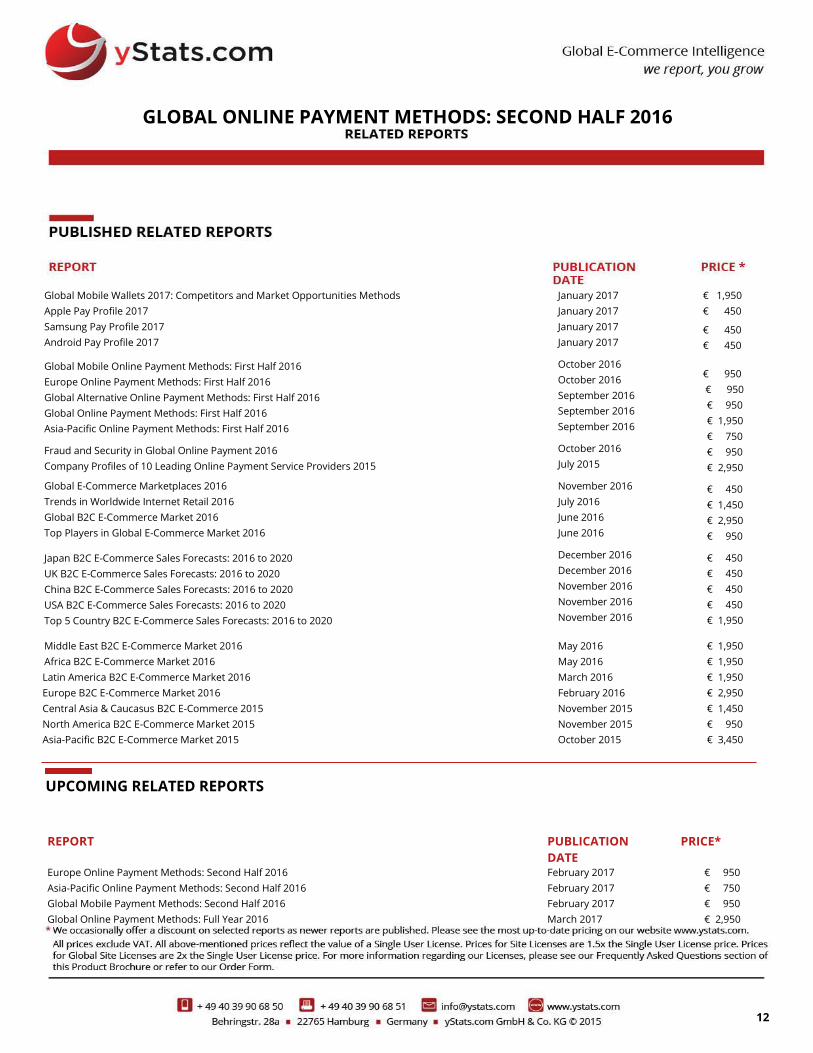
Global Mobile Wallets 2017: Competitors and Market Opportunities Methods
Apple Pay Profile 2017
January 2017
January 2017
€ 1,950
€ 450
Samsung Pay Profile 2017
Android Pay Profile 2017
January 2017
January 2017
€ 450
€ 450
Global Mobile Online Payment Methods: First Half 2016
Europe Online Payment Methods: First Half 2016
Global Alternative Online Payment Methods: First Half 2016
Global Online Payment Methods: First Half 2016
Asia-Pacific Online Payment Methods: First Half 2016
Fraud and Security in Global Online Payment 2016
Company Profiles of 10 Leading Online Payment Service Providers 2015
October 2016
October 2016
September 2016
September 2016
September 2016
October 2016
July 2015
€ 950
€ 950
€ 950
€ 1,950
€ 750
€ 950
€ 2,950
Global E-Commerce Marketplaces 2016
Trends in Worldwide Internet Retail 2016
Global B2C E-Commerce Market 2016
Top Players in Global E-Commerce Market 2016
November 2016
July 2016
June 2016
June 2016
€ 450
€ 1,450
€ 2,950
€ 950
Japan B2C E-Commerce Sales Forecasts: 2016 to 2020
UK B2C E-Commerce Sales Forecasts: 2016 to 2020
China B2C E-Commerce Sales Forecasts: 2016 to 2020
USA B2C E-Commerce Sales Forecasts: 2016 to 2020
Top 5 Country B2C E-Commerce Sales Forecasts: 2016 to 2020
December 2016
December 2016
November 2016
November 2016
November 2016
€ 450
€ 450
€ 450
€ 450
€ 1,950
Middle East B2C E-Commerce Market 2016 May 2016 € 1,950
Africa B2C E-Commerce Market 2016 May 2016 € 1,950
Latin America B2C E-Commerce Market 2016
Europe B2C E-Commerce Market 2016
Central Asia & Caucasus B2C E-Commerce 2015
North America B2C E-Commerce Market 2015
Asia-Pacific B2C E-Commerce Market 2015
March 2016
February 2016
November 2015
November 2015
October 2015
€ 1,950
€ 2,950
€ 1,450
€ 950
€ 3,450
UPCOMING RELATED REPORTS
REPORT PUBLICATION
DATE
PRICE*
Europe Online Payment Methods: Second Half 2016
Asia-Pacific Online Payment Methods: Second Half 2016
Global Mobile Payment Methods: Second Half 2016
Global Online Payment Methods: Full Year 2016
February 2017
February 2017
February 2017
March 2017
€ 950
€ 750
€ 950
€ 2,950
GLOBAL ONLINE PAYMENT METHODS: SECOND HALF 2016
12
13
14
15
16
17