Embed Size (px)
Citation preview
Second Quarter 2016 Earnings Presentation August 4, 2016
Disclaimer
This presentation and any related statements contain certain “forward-looking statements” about MPG’s financial results and estimates and business prospects within the meaning of the Private Securities Litigation Reform Act of 1995. Forward-looking statements may be identified by words such as “expects,” “intends,” “anticipates,” “plans,” “projects,” “believes,” “seeks,” “targets,” “forecasts,” “estimates,” “will” or other words of similar meaning and include, but are not limited to, statements regarding the outlook for the Company’s future business, prospects and financial performance; the industry outlook, our backlog and our 2016 financial guidance. Forward-looking statements are based on management’s current expectations and assumptions, which are subject to inherent uncertainties, risks and changes in circumstances that are difficult to predict. Actual outcomes and results may differ materially due to global political, economic, business, competitive, market, regulatory, and other factors and risks, among them being: volatility in the global economy impacting demand for new vehicles and our products; a decline in vehicle production levels, particularly with respect to platforms for which we are a significant supplier, or the financial distress of any of our major customers; cyclicality and seasonality in the light vehicle, industrial and commercial vehicle markets; our significant competition; our dependence on large-volume customers for current and future sales; a reduction in outsourcing by our customers, the loss or discontinuation of material production or programs, or a failure to secure sufficient alternative programs; our failure to offset continuing pressure from our customers to reduce our prices; our inability to realize all of the sales expected from awarded business or fully recover pre-production costs; our failure to increase production capacity or over-expanding our production in times of overcapacity; our reliance on key machinery and tooling to manufacture components for powertrain and suspension l systems that cannot be easily replicated; program launch difficulties; a disruption in our supply or delivery chain which causes one or more of our customers to halt production; the damage to or termination of our relationships with key third-party suppliers; work stoppages or production limitations at one or more of our customer’s facilities; a catastrophic loss of one of our key manufacturing facilities; failure to protect our know-how and intellectual property; the disruption or harm to our business as a result of any acquisitions or joint ventures we make; a significant increase in the prices of raw materials and commodities we use; our failure to maintain our cost structure; the incurrence of significant costs if we close any of our manufacturing facilities; potential significant costs at our facility in Sandusky, Ohio; the incurrence of significant costs, liabilities, and obligations as a result of environmental requirements and other regulatory risks; extensive and growing governmental regulations; the incurrence of material costs related to legal proceedings; our inability to recruit and retain key personnel; any failure to maintain satisfactory labor relations; pension and other postretirement benefit obligations; risks related to our global operations; competitive threats posed by global operations and entering new markets; foreign exchange rate fluctuations; our substantial indebtedness; our inability, or the inability of our customers or our suppliers, to obtain and maintain sufficient debt financing, including working capital lines; our exposure to a number of different tax uncertainties; the mix of profits and losses in various jurisdictions adversely affecting our tax rate. For the reasons described above, we caution you against relying on any forward-looking statements, which should also be read in conjunction with the other cautionary statements that are included elsewhere in this press release and in our public filings, including under the heading “Risk Factors” in our filings that we make from time to time with the Securities and Exchange Commission. You should not consider any list of such factors to be an exhaustive statement of all the risks, uncertainties, or potentially inaccurate assumptions that could cause our current expectations or beliefs to change. Further, any forward-looking statement speaks only as of the date on which it is made, and we undertake no obligation to update or revise any forward-looking statement to reflect events or circumstances after the date on which the statement is made or to reflect the occurrence of unanticipated events, except as otherwise may be required by law.
2
Non-GAAP Financial Measures
Combined Net Sales We define Combined Net Sales as the Net Sales of MPG plus the Net Sales of Grede prior to our acquisition of Grede. We present Combined Net Sales because our management considers it to be a useful, supplemental indicator of our performance when comparing periods before and after our acquisition of Grede. For a reconciliation of Combined Net Sales to Net Sales, the most directly comparable U.S. generally accepted accounting principles “GAAP” measure, see Appendix to this presentation.
Adjusted EBITDA and Combined Adjusted EBITDA We define Adjusted EBITDA as net income (loss) before interest expense, provision for (benefit from) income taxes and depreciation and amortization, with further adjustments to reflect the additions and eliminations of certain income statement items, including (i) gains and losses on foreign currency and fixed assets and debt transaction expenses, (ii) stock-based compensation and other non-cash charges, (iii) sponsor management fees and other income and expense items that we consider to be not indicative of our ongoing operations, (iv) specified non-recurring items and (v) other adjustments. We define Combined Adjusted EBITDA as Adjusted EBITDA plus the Adjusted EBITDA of Grede prior to our acquisition of Grede. We believe Adjusted EBITDA is used by investors as a supplemental measure to evaluate the overall operating performance of companies in our industry. Management uses Adjusted EBITDA (i) as a measurement used in comparing our operating performance on a consistent basis, (ii) to calculate incentive compensation for our employees, (iii) for planning purposes, including the preparation of our internal annual operating budget, (iv) to evaluate the performance and effectiveness of our operational strategies and (v) to assess compliance with various metrics associated with our agreements governing our indebtedness. Accordingly, we believe that Adjusted EBITDA provides useful information to investors and others in understanding and evaluating our operating performance in the same manner as our management. We present Combined Adjusted EBITDA because our management considers it to be a useful, supplemental indicator of our performance when comparing periods before and after our acquisition of Grede. For a reconciliation of Adjusted EBITDA and Combined Adjusted EBITDA to income before tax, the most directly comparable measure determined under GAAP, see Appendix to this presentation.
Adjusted Free Cash Flow
We define Adjusted Free Cash Flow as Adjusted EBITDA less capital expenditures. Capital expenditures are on an accrual basis of accounting and can be calculated by taking the capital expenditures found in the investing section of our consolidated statements of cash flows and adjusting for the change in the period of the capital expenditure in accounts payables found in the supplemental cash flow information on our consolidated statements of cash flows. We present Adjusted Free Cash Flow because our management considers it to be a useful, supplemental indicator of our performance. When measured over time, Adjusted Free Cash Flow provides supplemental information to investors concerning our results of operations and our ability to generate cash flows to satisfy mandatory debt service requirements and make other non-discretionary expenditures. For a reconciliation of Adjusted Free Cash Flow to income before tax, the most directly comparable GAAP measure, see Appendix to this presentation.
Free Cash Flow We define Free Cash Flow as net cash provided by operating activities, as stated on the Company’s condensed consolidated statement of cash flows, less capital expenditures, as stated on the Company’s condensed consolidated statement of cash flows.
Adjusted EPS We define Adjusted EPS as Adjusted Net Income Attributable to Stockholders, defined as net income attributable to stockholders before the after-tax impact of (i) gains and losses on foreign currency transactions, including the re-measurement of the Company’s Euro denominated term loan (the “Euro Term Loan”), (ii) specific non-recurring items, and (iii) other adjustments, divided by the weighted average number of shares outstanding for the period on a diluted basis. For a reconciliation of Adjusted EPS to diluted EPS, the most directly comparable measure determined under GAAP, see "RECONCILIATION OF ADJUSTED EPS TO US GAAP DILUTED EPS”.
3
Agenda
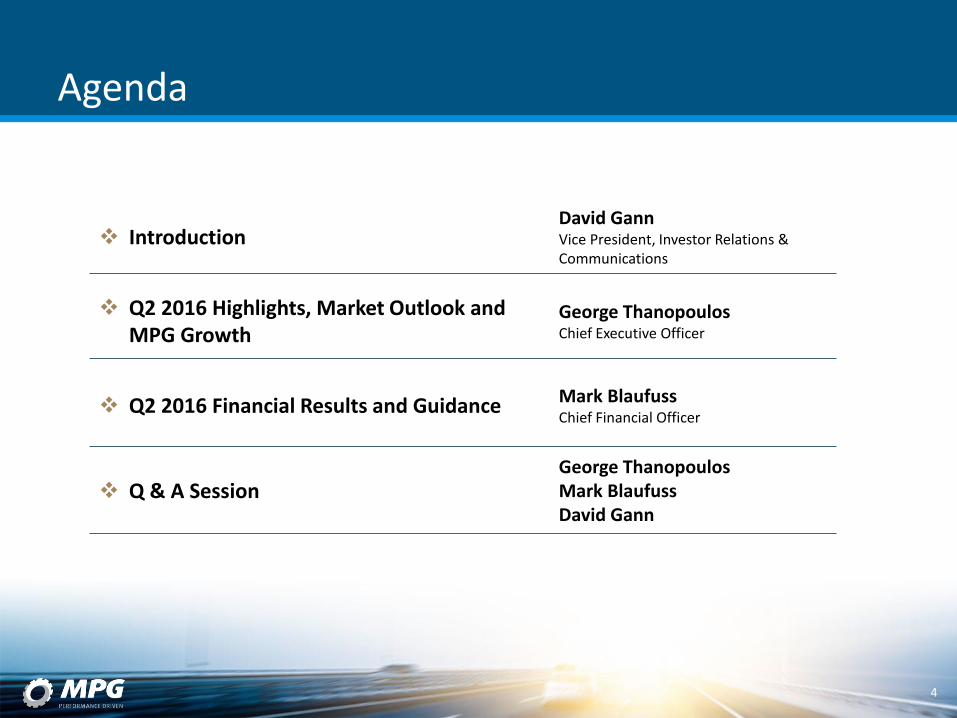
Introduction David Gann Vice President, Investor Relations & Communications
Q2 2016 Highlights, Market Outlook and MPG Growth
George Thanopoulos Chief Executive Officer
Q2 2016 Financial Results and Guidance Mark Blaufuss Chief Financial Officer
Q & A Session George Thanopoulos Mark Blaufuss David Gann
4

Q2 2016 HIGHLIGHTS
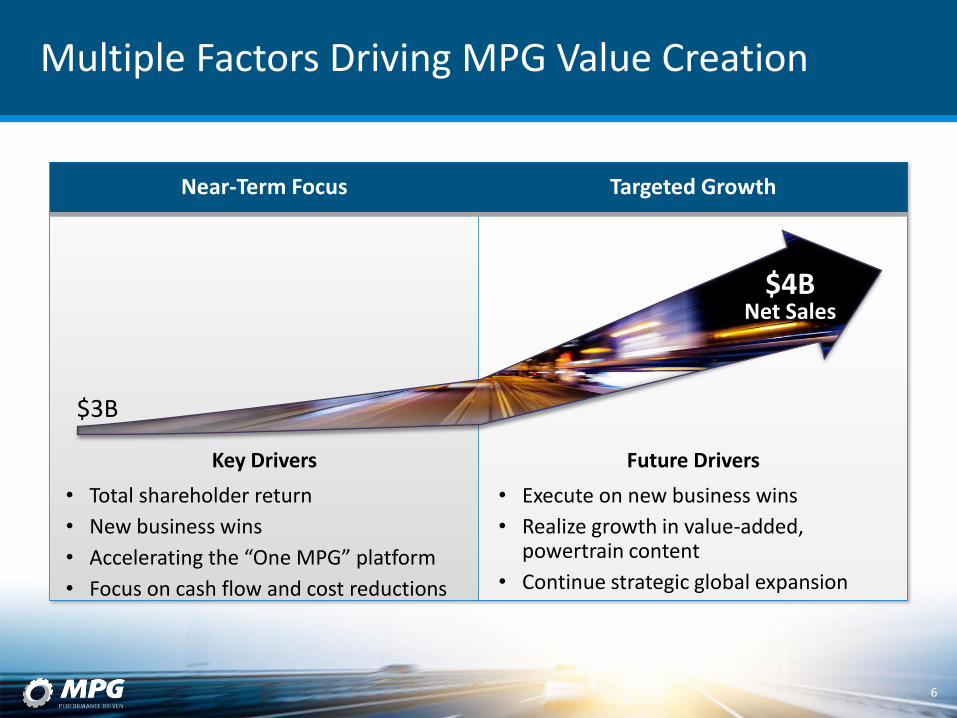
Multiple Factors Driving MPG Value Creation
6
Near-Term Focus Targeted Growth
$4B Net Sales
$3B
• Total shareholder return
• New business wins
• Accelerating the “One MPG” platform
• Focus on cash flow and cost reductions
• Execute on new business wins
• Realize growth in value-added, powertrain content
• Continue strategic global expansion
Key Drivers Future Drivers
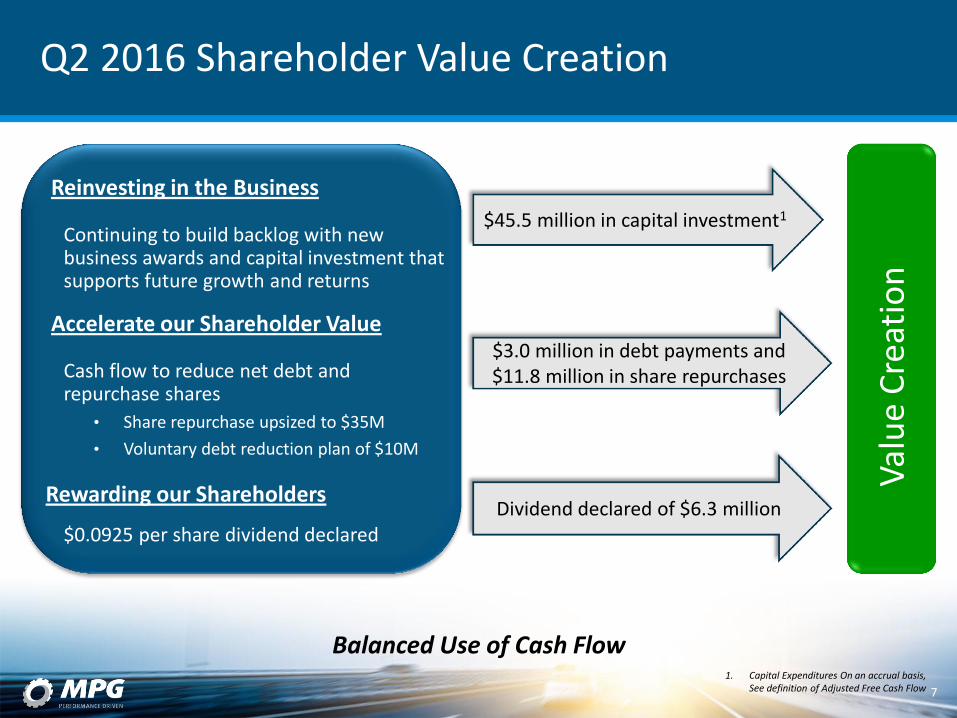
Reinvesting in the Business
Continuing to build backlog with new business awards and capital investment that supports future growth and returns
Accelerate our Shareholder Value
Cash flow to reduce net debt and repurchase shares
• Share repurchase upsized to $35M
• Voluntary debt reduction plan of $10M
Rewarding our Shareholders
$0.0925 per share dividend declared
$3.0 million in debt payments and $11.8 million in share repurchases
$45.5 million in capital investment1
Dividend declared of $6.3 million
Balanced Use of Cash Flow
7
Q2 2016 Shareholder Value Creation
Val
ue
Cre
atio
n
1. Capital Expenditures On an accrual basis, See definition of Adjusted Free Cash Flow
1. Combined Adjusted EBITDA / Combined Net Sales (Non-GAAP) 2. See reconciliation in Appendix 3. See definition of Adjusted Free Cash Flow 4. Net cash provided by operating activities less capital expenditures
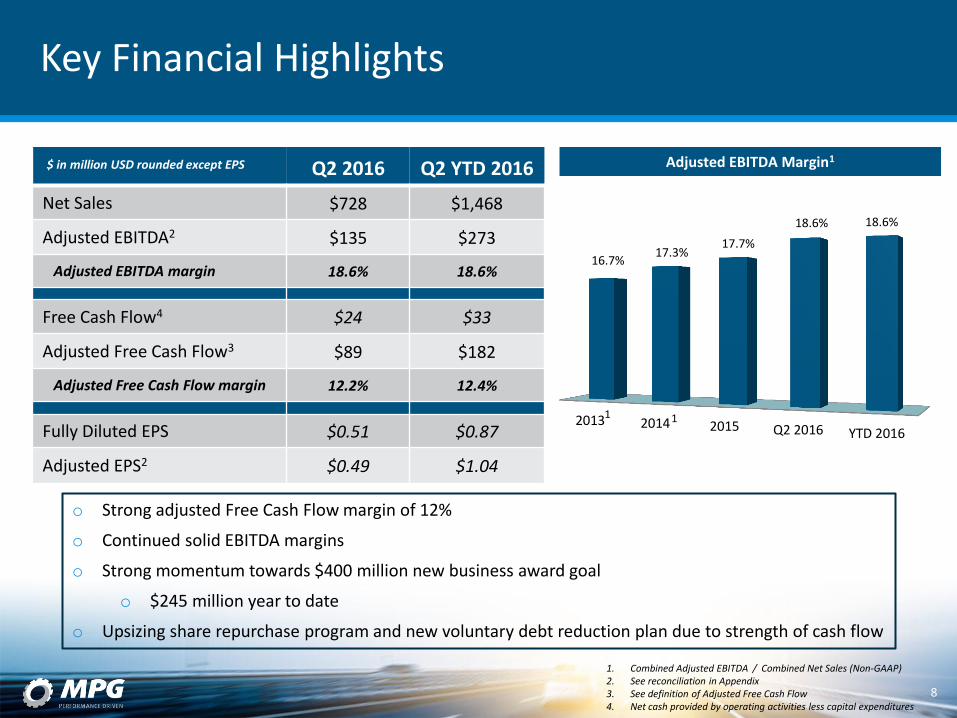
Q2 2016 Q2 YTD 2016
Net Sales $728 $1,468
Adjusted EBITDA2 $135 $273
Adjusted EBITDA margin 18.6% 18.6%
Free Cash Flow4 $24 $33
Adjusted Free Cash Flow3 $89 $182
Adjusted Free Cash Flow margin 12.2% 12.4%
Fully Diluted EPS $0.51 $0.87
Adjusted EPS2 $0.49 $1.04
$ in million USD rounded except EPS
o Strong adjusted Free Cash Flow margin of 12%
o Continued solid EBITDA margins
o Strong momentum towards $400 million new business award goal
o $245 million year to date
o Upsizing share repurchase program and new voluntary debt reduction plan due to strength of cash flow
8
Key Financial Highlights
Adjusted EBITDA Margin1
2013 2014 2015 Q2 2016 YTD 2016
16.7% 17.3%
17.7%
18.6% 18.6%
1 1
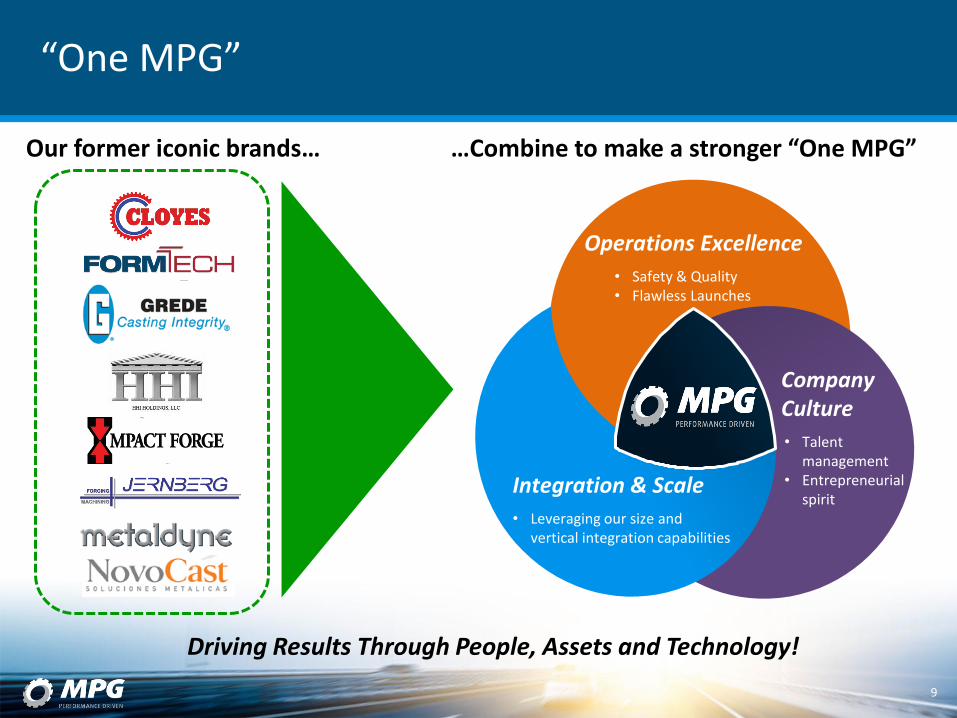
“One MPG”
Driving Results Through People, Assets and Technology!
9
Company Culture
• Talent management
• Entrepreneurial spirit
Integration & Scale
• Leveraging our size and vertical integration capabilities
Operations Excellence
• Safety & Quality • Flawless Launches
Our former iconic brands… …Combine to make a stronger “One MPG”
MARKET OUTLOOK AND MPG GROWTH
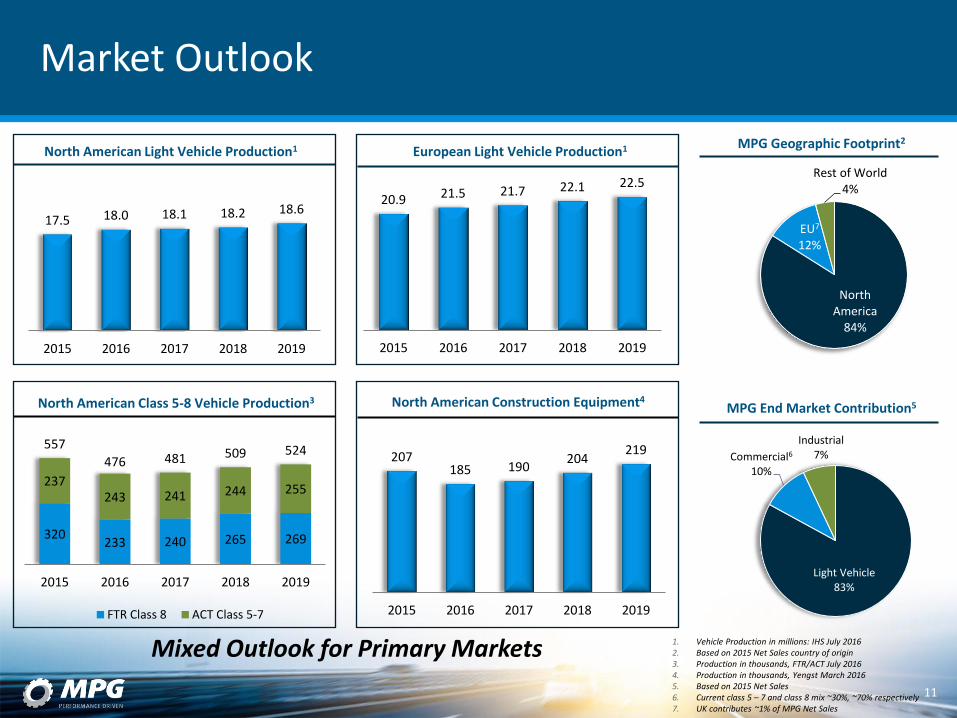
320 233 240 265 269
237 243 241 244 255
557
476 481 509 524
2015 2016 2017 2018 2019
FTR Class 8 ACT Class 5-7
17.5 18.0 18.1 18.2 18.6
2015 2016 2017 2018 2019
20.9 21.5 21.7 22.1 22.5
2015 2016 2017 2018 2019
Mixed Outlook for Primary Markets 1. Vehicle Production in millions: IHS July 2016 2. Based on 2015 Net Sales country of origin 3. Production in thousands, FTR/ACT July 2016 4. Production in thousands, Yengst March 2016 5. Based on 2015 Net Sales 6. Current class 5 – 7 and class 8 mix ~30%, ~70% respectively 7. UK contributes ~1% of MPG Net Sales
MPG Geographic Footprint2
North American Light Vehicle Production1 European Light Vehicle Production1
Market Outlook
North America
84%
EU7 12%
Rest of World 4%
North American Construction Equipment4 North American Class 5-8 Vehicle Production3
Light Vehicle 83%
Commercial6 10%
Industrial 7%
MPG End Market Contribution5
11
207 185 190
204 219
2015 2016 2017 2018 2019
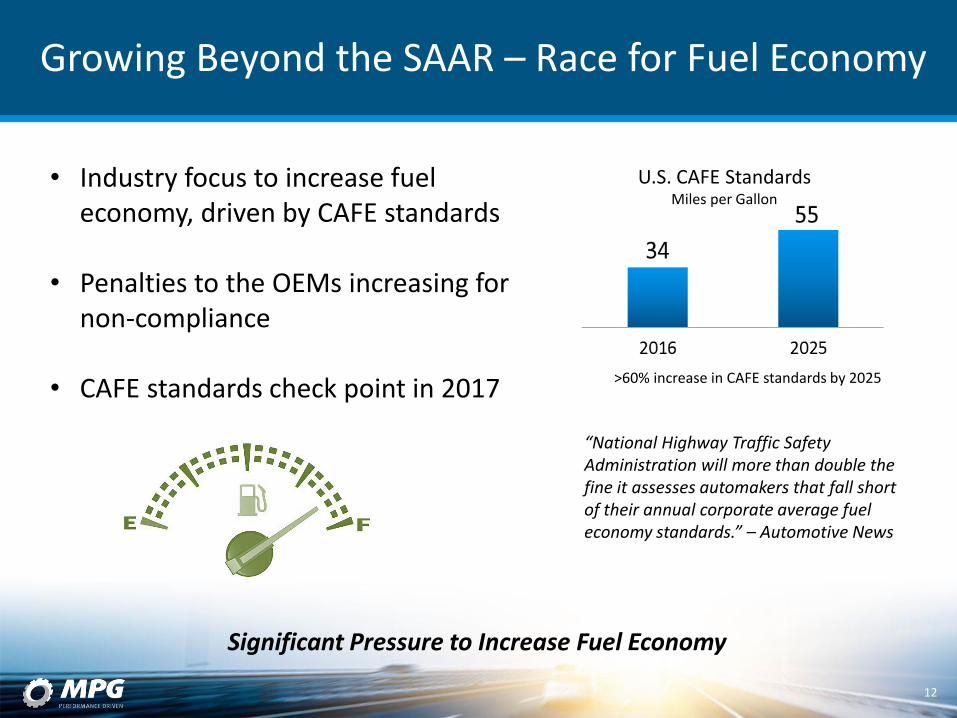
Growing Beyond the SAAR – Race for Fuel Economy
12
U.S. CAFE Standards Miles per Gallon
“National Highway Traffic Safety Administration will more than double the fine it assesses automakers that fall short of their annual corporate average fuel economy standards.” – Automotive News
Significant Pressure to Increase Fuel Economy
• Industry focus to increase fuel economy, driven by CAFE standards
• Penalties to the OEMs increasing for non-compliance
• CAFE standards check point in 2017 >60% increase in CAFE standards by 2025
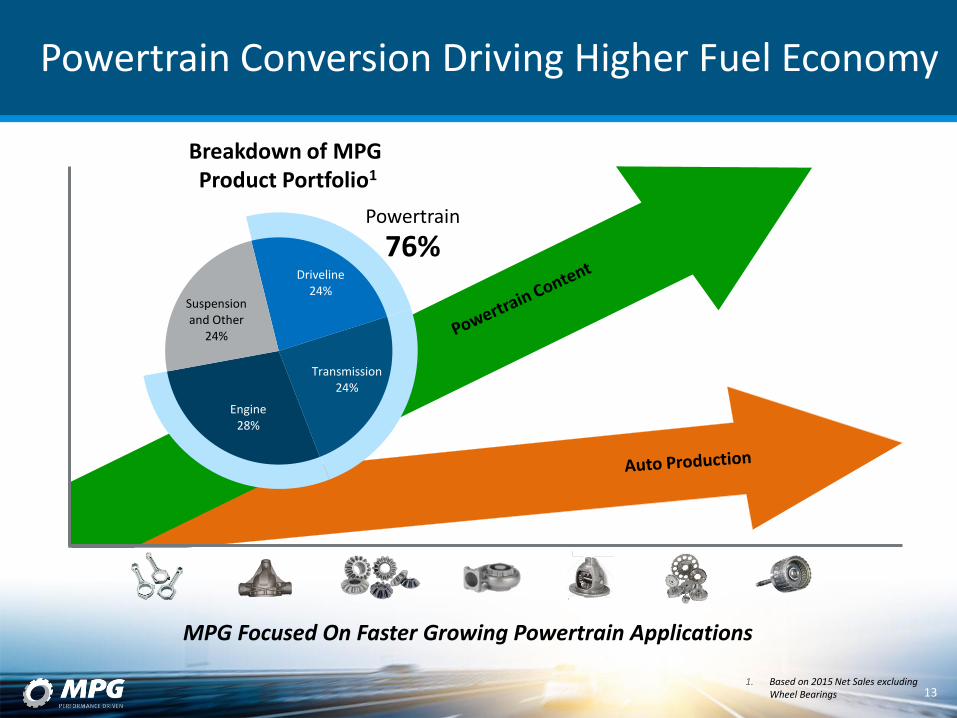
Driveline 24%
Transmission 24%
Engine 28%
Suspension and Other
24%
1. Based on 2015 Net Sales excluding Wheel Bearings
Powertrain Conversion Driving Higher Fuel Economy
Breakdown of MPG Product Portfolio1
Powertrain
76%
13
MPG Focused On Faster Growing Powertrain Applications
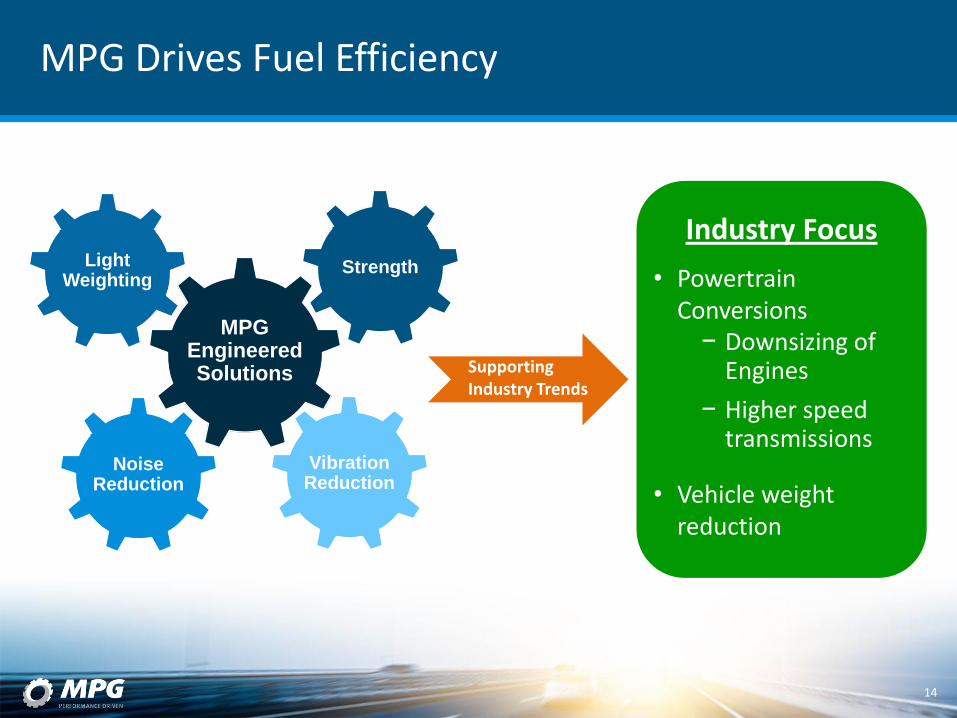
MPG Drives Fuel Efficiency
14
Light Weighting
Vibration Reduction
Noise Reduction
Strength
MPG Engineered Solutions
• Powertrain Conversions − Downsizing of
Engines
− Higher speed transmissions
• Vehicle weight reduction
Supporting Industry Trends
Industry Focus
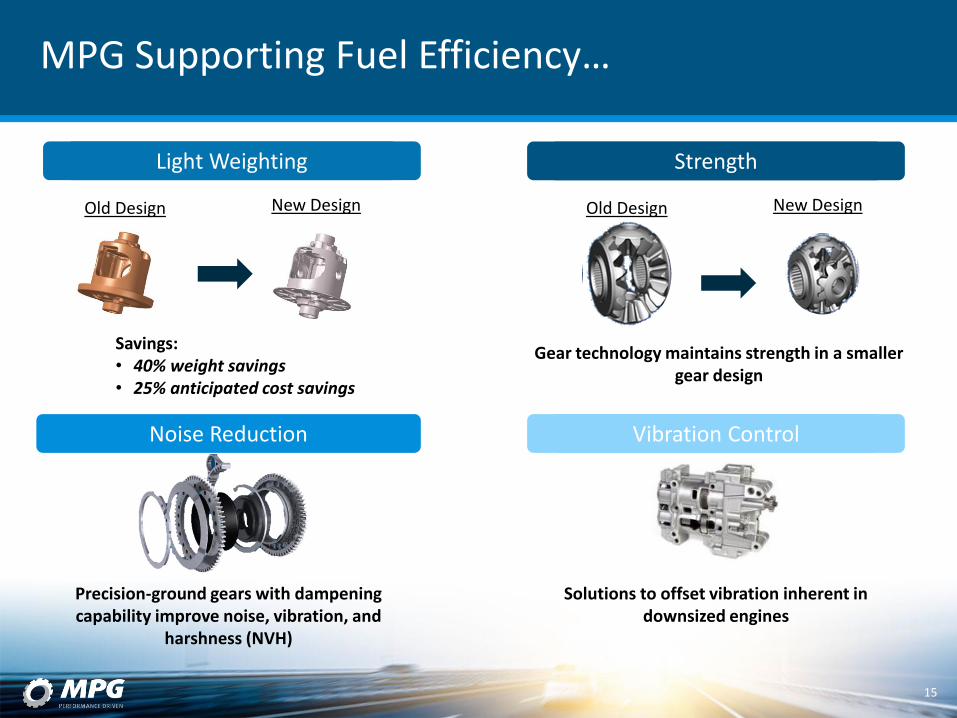
MPG Supporting Fuel Efficiency…
15
Old Design New Design
Savings: • 40% weight savings • 25% anticipated cost savings
Light Weighting
Solutions to offset vibration inherent in downsized engines
Precision-ground gears with dampening capability improve noise, vibration, and
harshness (NVH)
Vibration Control Noise Reduction
Strength
Old Design New Design
Gear technology maintains strength in a smaller gear design
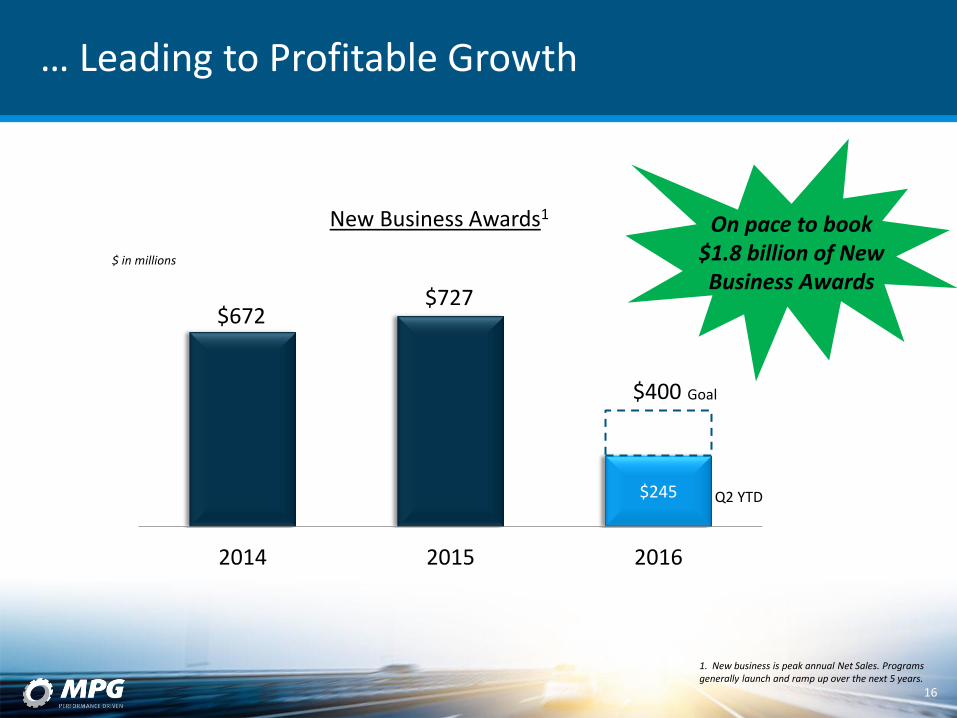
… Leading to Profitable Growth
$672 $727
$245
$400
2014 2015 2016
Q2 YTD
1. New business is peak annual Net Sales. Programs generally launch and ramp up over the next 5 years.
New Business Awards1
$ in millions
Goal
On pace to book $1.8 billion of New Business Awards
16
Q2 2016 FINANCIAL RESULTS AND GUIDANCE
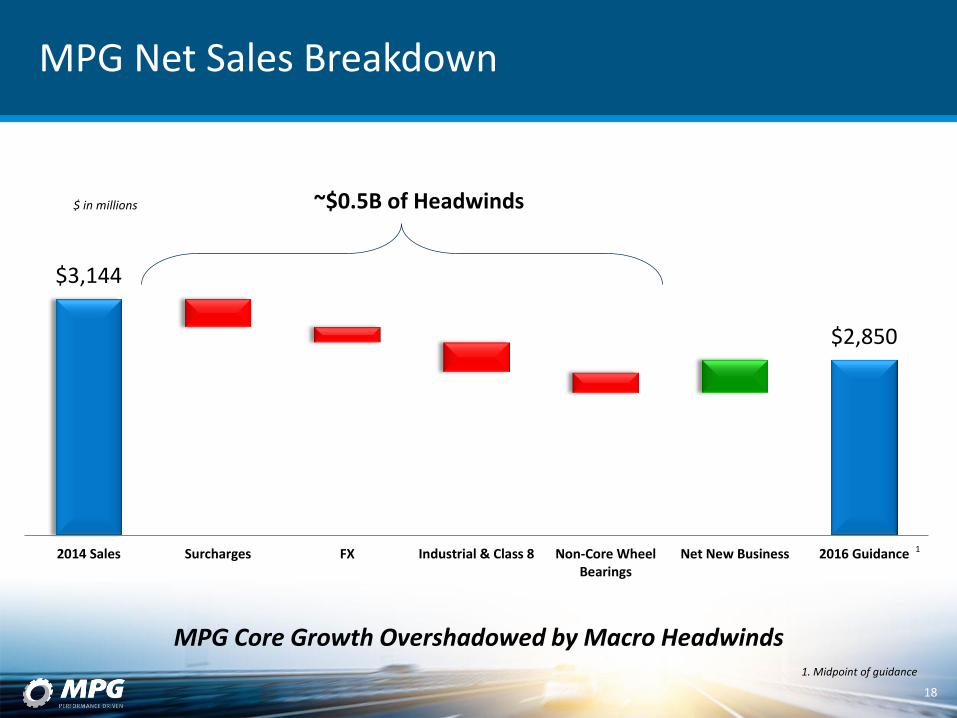
MPG Net Sales Breakdown
$3,144
$2,850
2014 Sales Surcharges FX Industrial & Class 8 Non-Core WheelBearings
Net New Business 2016 Guidance
~$0.5B of Headwinds
18
MPG Core Growth Overshadowed by Macro Headwinds 1. Midpoint of guidance
1
$ in millions
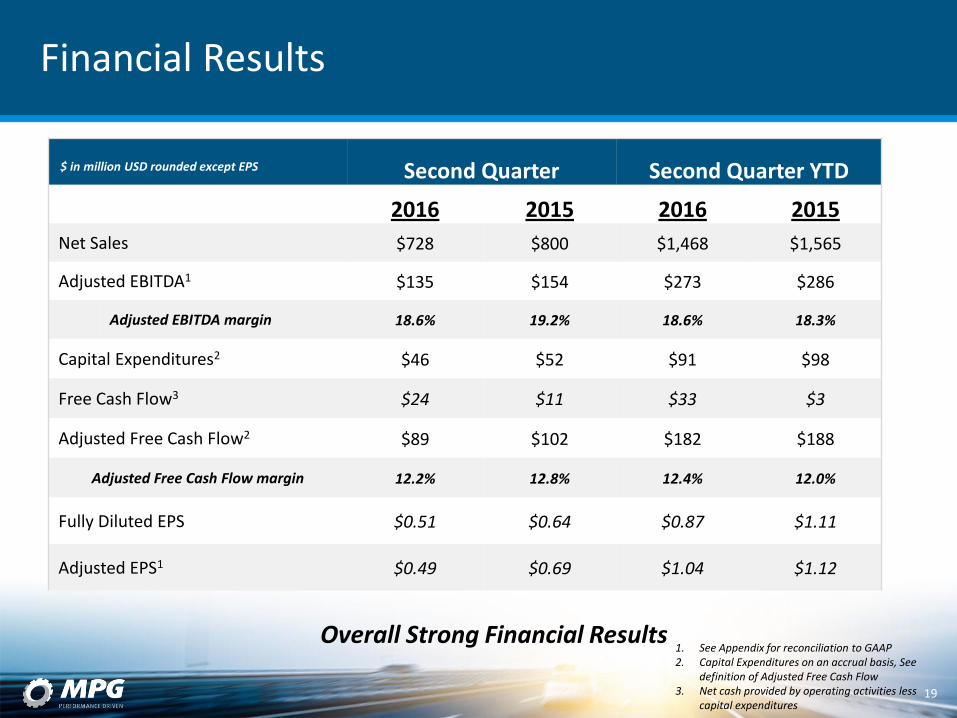
Financial Results
Second Quarter Second Quarter YTD
2016 2015 2016 2015
Net Sales $728 $800 $1,468 $1,565
Adjusted EBITDA1 $135 $154 $273 $286
Adjusted EBITDA margin 18.6% 19.2% 18.6% 18.3%
Capital Expenditures2 $46 $52 $91 $98
Free Cash Flow3 $24 $11 $33 $3
Adjusted Free Cash Flow2 $89 $102 $182 $188
Adjusted Free Cash Flow margin 12.2% 12.8% 12.4% 12.0%
Fully Diluted EPS $0.51 $0.64 $0.87 $1.11
Adjusted EPS1 $0.49 $0.69 $1.04 $1.12
1. See Appendix for reconciliation to GAAP 2. Capital Expenditures on an accrual basis, See
definition of Adjusted Free Cash Flow 3. Net cash provided by operating activities less
capital expenditures
19
Overall Strong Financial Results
$ in million USD rounded except EPS
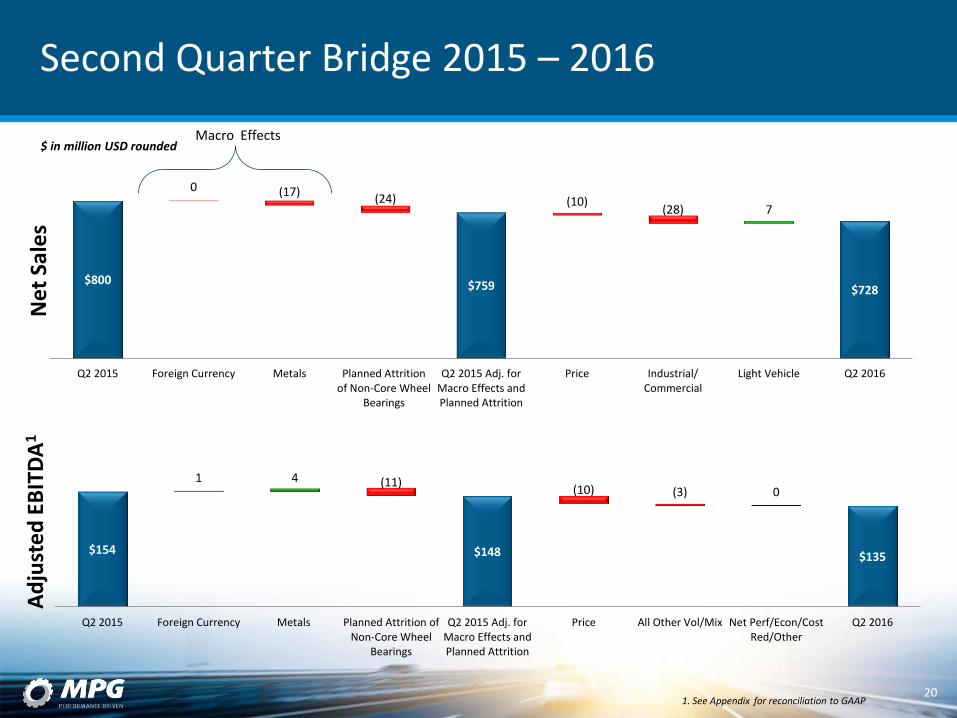
$800 $759 $728
0 (17) (24) (10)
(28) 7
Q2 2015 Foreign Currency Metals Planned Attritionof Non-Core Wheel
Bearings
Q2 2015 Adj. forMacro Effects andPlanned Attrition
Price Industrial/Commercial
Light Vehicle Q2 2016
Second Quarter Bridge 2015 – 2016 N
et S
ale
s A
dju
ste
d E
BIT
DA
1
20
Macro Effects
$154 $148 $135
1 4 (11) (10) (3) 0
Q2 2015 Foreign Currency Metals Planned Attrition ofNon-Core Wheel
Bearings
Q2 2015 Adj. forMacro Effects andPlanned Attrition
Price All Other Vol/Mix Net Perf/Econ/CostRed/Other
Q2 2016
1. See Appendix for reconciliation to GAAP
$ in million USD rounded
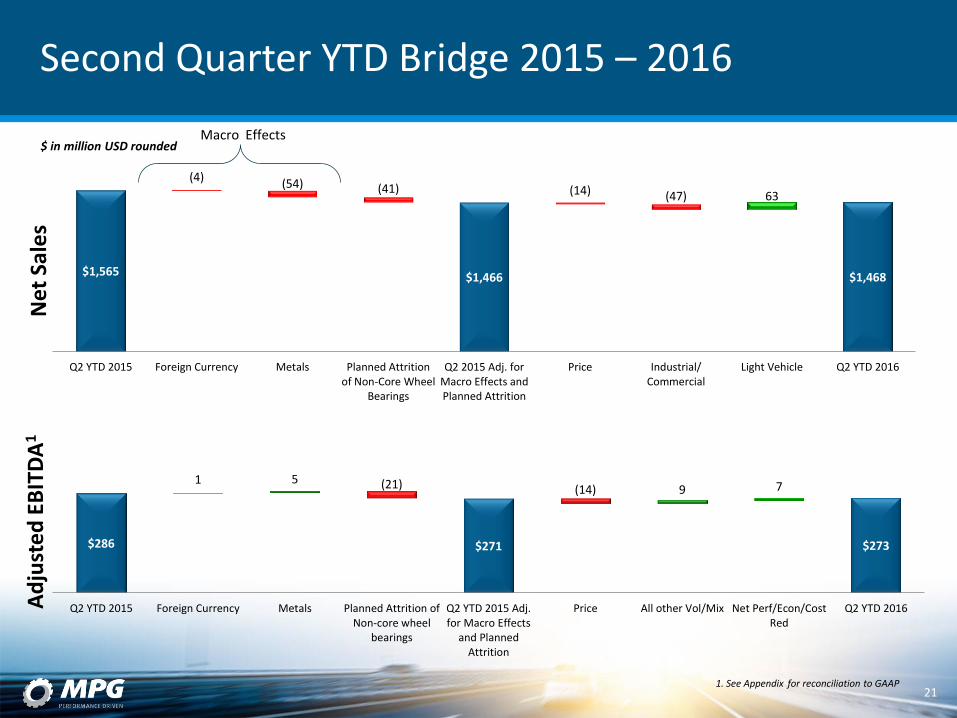
$1,565 $1,466 $1,468
(4) (54) (41) (14) (47) 63
Q2 YTD 2015 Foreign Currency Metals Planned Attritionof Non-Core Wheel
Bearings
Q2 2015 Adj. forMacro Effects andPlanned Attrition
Price Industrial/Commercial
Light Vehicle Q2 YTD 2016
Second Quarter YTD Bridge 2015 – 2016 N
et S
ale
s A
dju
ste
d E
BIT
DA
1
21
Macro Effects
$286 $271 $273
1 5 (21) (14) 9 7
Q2 YTD 2015 Foreign Currency Metals Planned Attrition ofNon-core wheel
bearings
Q2 YTD 2015 Adj.for Macro Effects
and PlannedAttrition
Price All other Vol/Mix Net Perf/Econ/CostRed
Q2 YTD 2016
1. See Appendix for reconciliation to GAAP
$ in million USD rounded
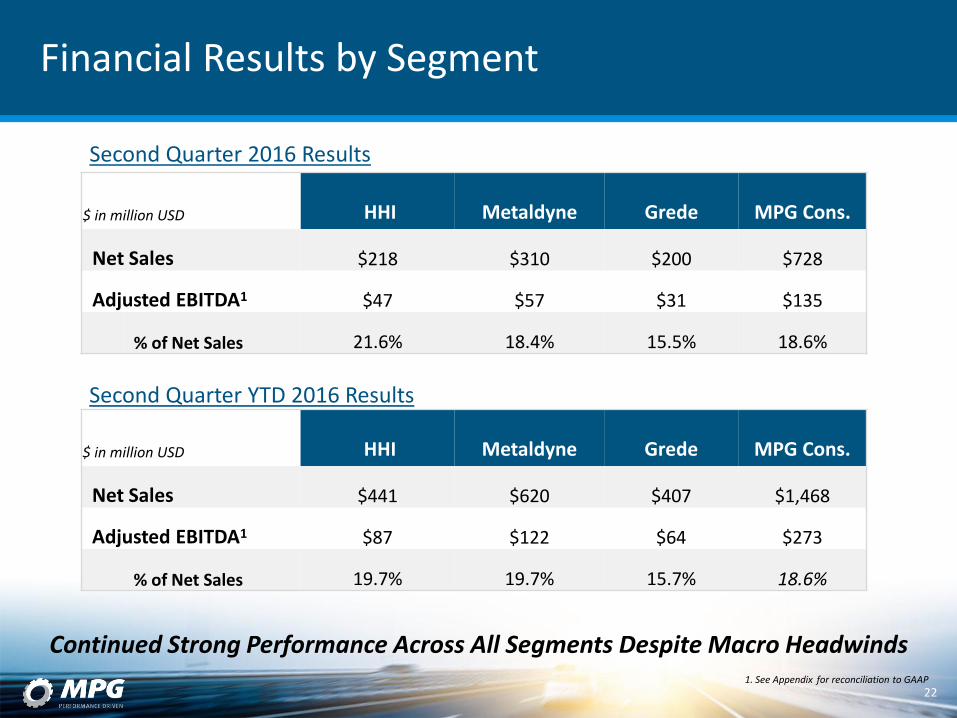
Financial Results by Segment
$ in million USD HHI Metaldyne Grede MPG Cons.
Net Sales $218 $310 $200 $728
Adjusted EBITDA1 $47 $57 $31 $135
% of Net Sales 21.6% 18.4% 15.5% 18.6%
1. See Appendix for reconciliation to GAAP
22
Second Quarter 2016 Results
Continued Strong Performance Across All Segments Despite Macro Headwinds
$ in million USD HHI Metaldyne Grede MPG Cons.
Net Sales $441 $620 $407 $1,468
Adjusted EBITDA1 $87 $122 $64 $273
% of Net Sales 19.7% 19.7% 15.7% 18.6%
Second Quarter YTD 2016 Results
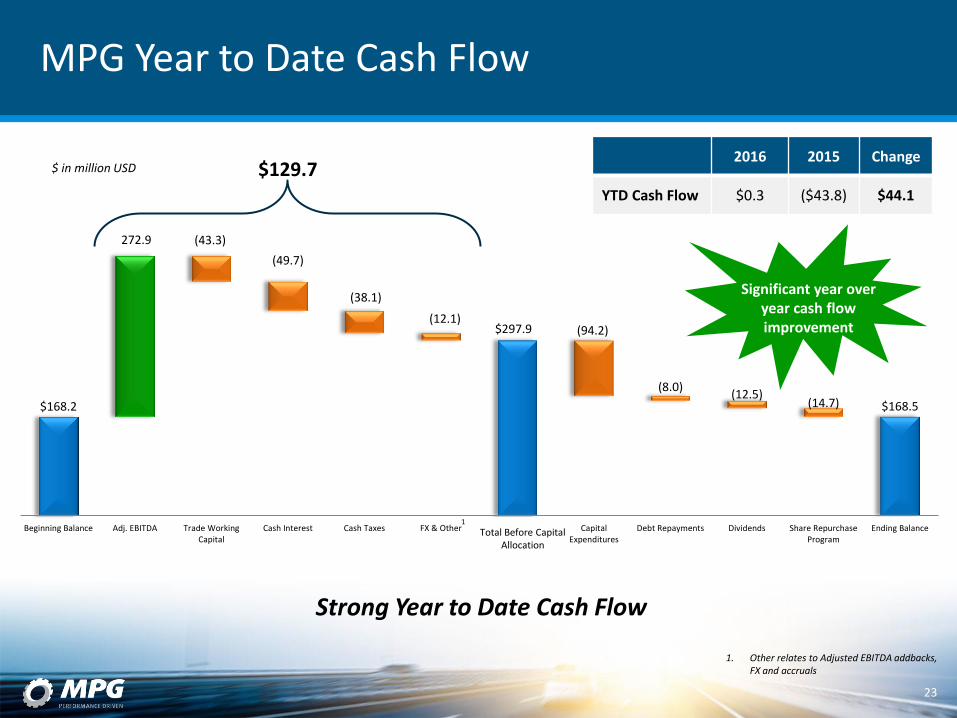
$168.2
$297.9
$168.5
272.9 (43.3)
(49.7)
(38.1)
(12.1) (94.2)
(8.0) (12.5)
(14.7)
Beginning Balance Adj. EBITDA Trade WorkingCapital
Cash Interest Cash Taxes FX & Other CapitalExpenditures
Debt Repayments Dividends Share RepurchaseProgram
Ending Balance
MPG Year to Date Cash Flow
23
$129.7
1. Other relates to Adjusted EBITDA addbacks, FX and accruals
Total Before Capital Allocation
1
Strong Year to Date Cash Flow
2016 2015 Change
YTD Cash Flow $0.3 ($43.8) $44.1
Significant year over year cash flow improvement
$ in million USD
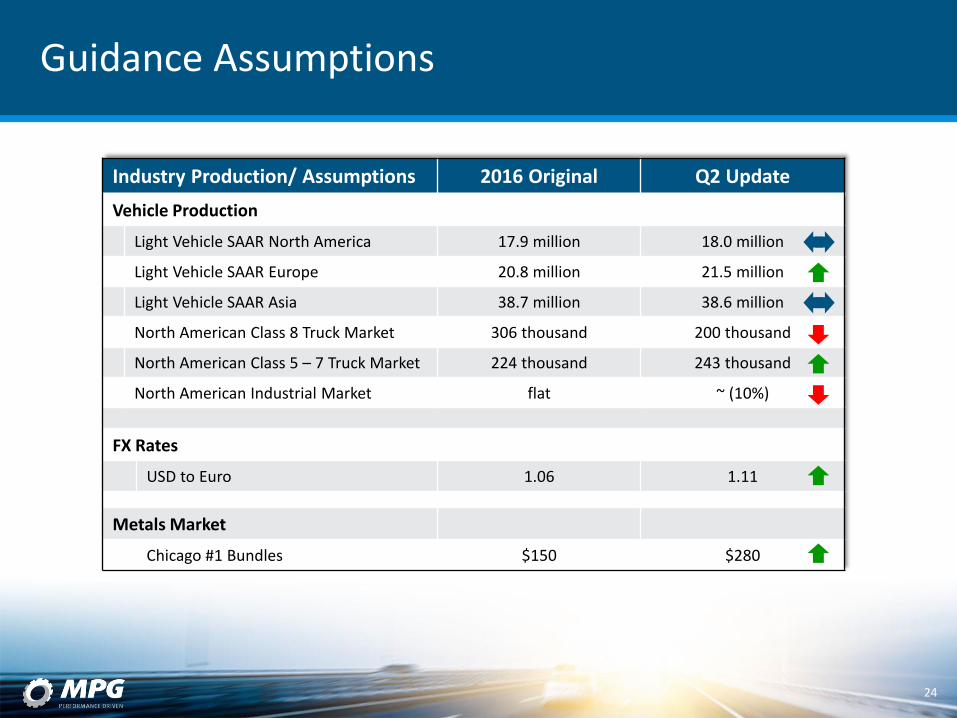
Guidance Assumptions
Industry Production/ Assumptions 2016 Original Q2 Update
Vehicle Production
Light Vehicle SAAR North America 17.9 million 18.0 million
Light Vehicle SAAR Europe 20.8 million 21.5 million
Light Vehicle SAAR Asia 38.7 million 38.6 million
North American Class 8 Truck Market 306 thousand 200 thousand
North American Class 5 – 7 Truck Market 224 thousand 243 thousand
North American Industrial Market flat ~ (10%)
FX Rates
USD to Euro 1.06 1.11
Metals Market
Chicago #1 Bundles $150 $280
24
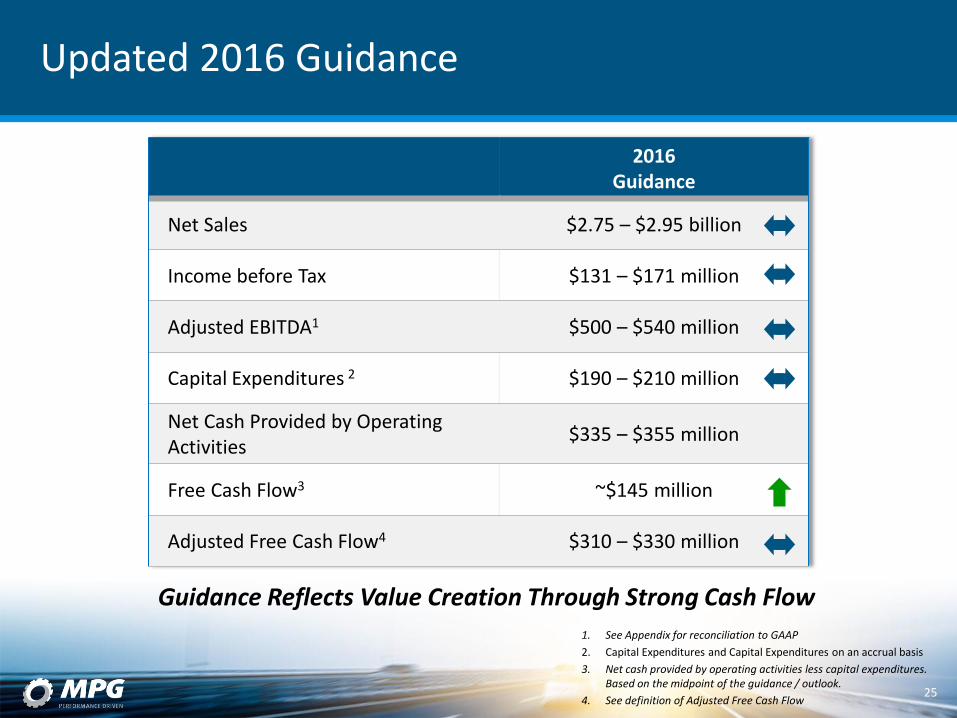
Updated 2016 Guidance
2016 Guidance
Net Sales $2.75 – $2.95 billion
Income before Tax $131 – $171 million
Adjusted EBITDA1 $500 – $540 million
Capital Expenditures 2 $190 – $210 million
Net Cash Provided by Operating Activities $335 – $355 million
Free Cash Flow3 ~$145 million
Adjusted Free Cash Flow4 $310 – $330 million
1. See Appendix for reconciliation to GAAP
2. Capital Expenditures and Capital Expenditures on an accrual basis
3. Net cash provided by operating activities less capital expenditures. Based on the midpoint of the guidance / outlook.
4. See definition of Adjusted Free Cash Flow 25
Guidance Reflects Value Creation Through Strong Cash Flow
Why Invest in MPG – Continued Shareholder Value Creation and Long-Term Growth
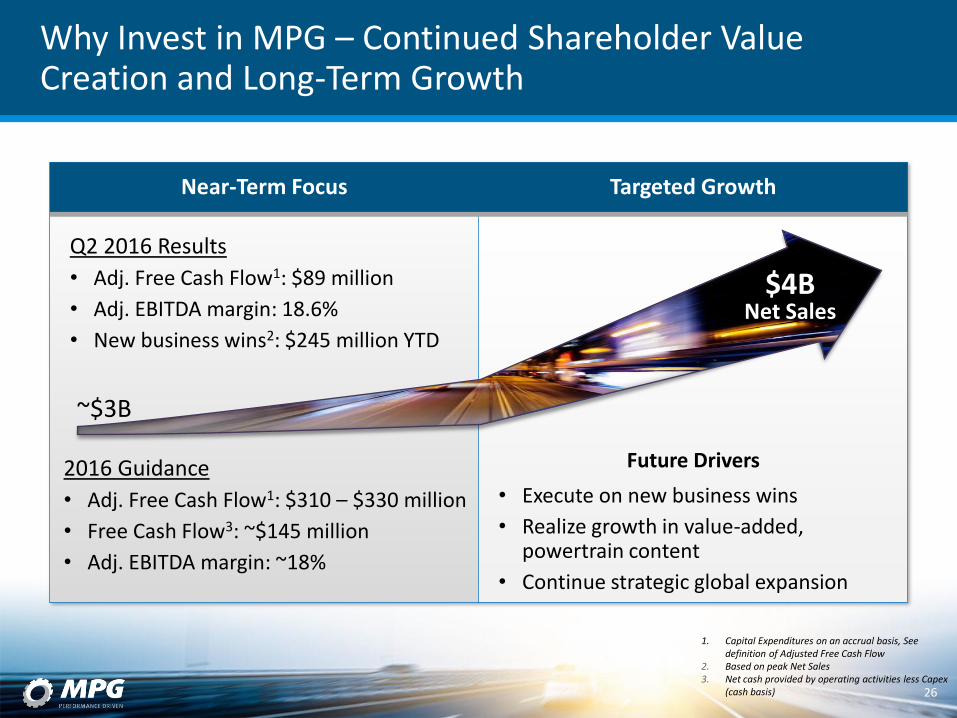
~$3B
2016 Guidance
• Adj. Free Cash Flow1: $310 – $330 million
• Free Cash Flow3: ~$145 million
• Adj. EBITDA margin: ~18%
26
Q2 2016 Results
• Adj. Free Cash Flow1: $89 million
• Adj. EBITDA margin: 18.6%
• New business wins2: $245 million YTD
Near-Term Focus
1. Capital Expenditures on an accrual basis, See definition of Adjusted Free Cash Flow
2. Based on peak Net Sales 3. Net cash provided by operating activities less Capex
(cash basis)
Targeted Growth
$4B Net Sales
• Execute on new business wins
• Realize growth in value-added, powertrain content
• Continue strategic global expansion
Future Drivers

Q&A

APPENDIX
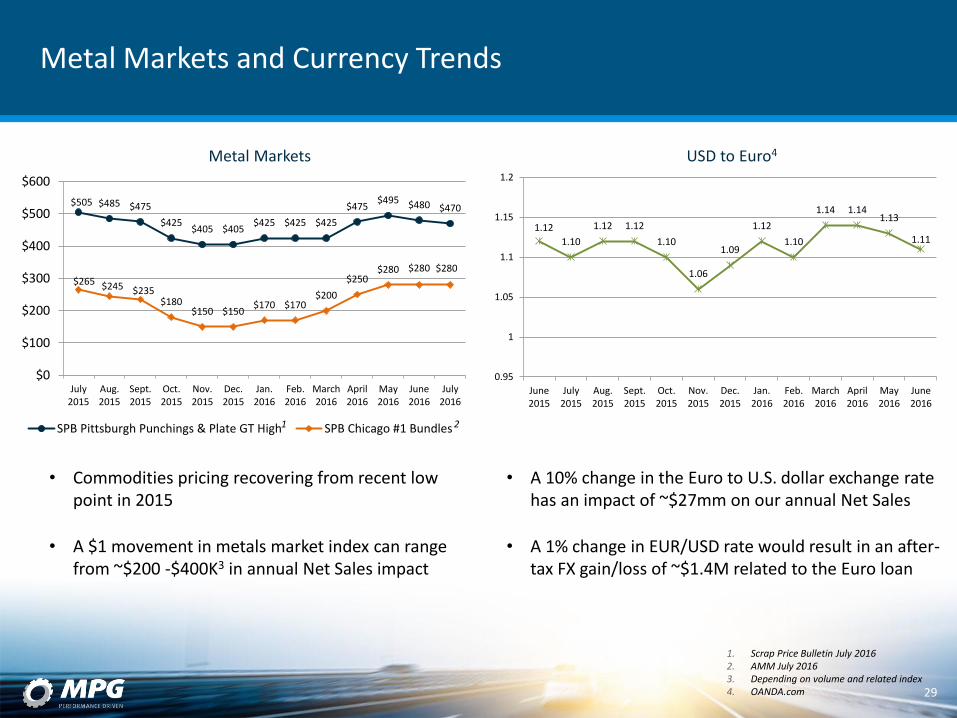
Metal Markets and Currency Trends
29
1. Scrap Price Bulletin July 2016 2. AMM July 2016 3. Depending on volume and related index 4. OANDA.com
Metal Markets USD to Euro4
$505 $485 $475
$425 $405 $405
$425 $425 $425
$475 $495 $480 $470
$265 $245 $235 $180
$150 $150 $170 $170
$200
$250 $280 $280 $280
$0
$100
$200
$300
$400
$500
$600
July2015
Aug.2015
Sept.2015
Oct.2015
Nov.2015
Dec.2015
Jan.2016
Feb.2016
March2016
April2016
May2016
June2016
July2016
SPB Pittsburgh Punchings & Plate GT High SPB Chicago #1 Bundles
1.12
1.10
1.12 1.12
1.10
1.06
1.09
1.12
1.10
1.14 1.14 1.13
1.11
0.95
1
1.05
1.1
1.15
1.2
June2015
July2015
Aug.2015
Sept.2015
Oct.2015
Nov.2015
Dec.2015
Jan.2016
Feb.2016
March2016
April2016
May2016
June2016
1 2
• Commodities pricing recovering from recent low point in 2015
• A $1 movement in metals market index can range from ~$200 -$400K3 in annual Net Sales impact
• A 10% change in the Euro to U.S. dollar exchange rate has an impact of ~$27mm on our annual Net Sales
• A 1% change in EUR/USD rate would result in an after-tax FX gain/loss of ~$1.4M related to the Euro loan
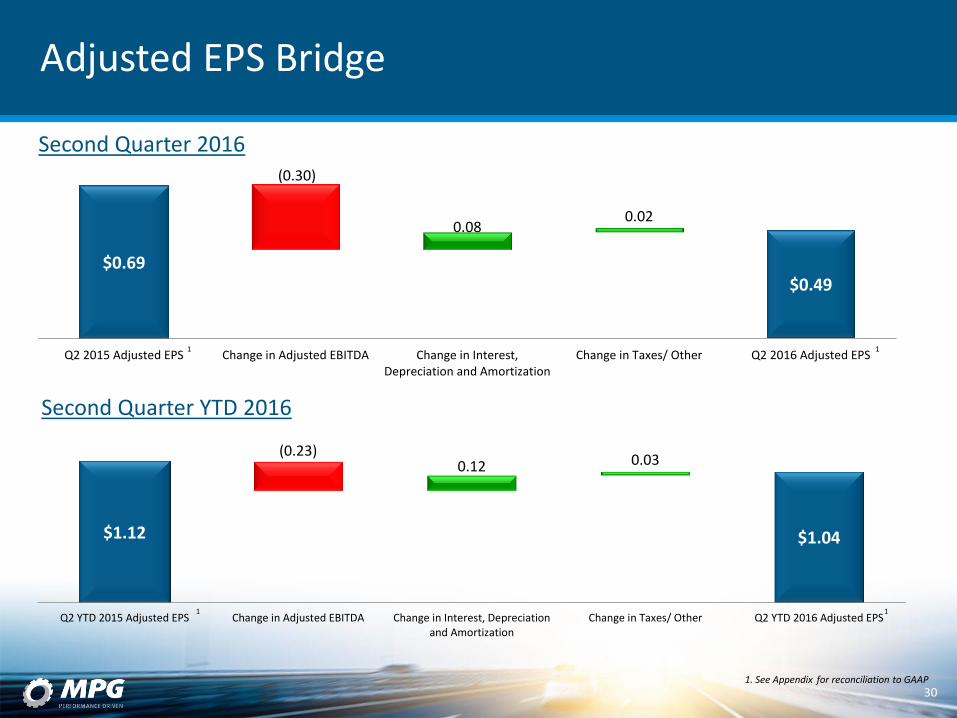
$1.12 $1.04
(0.23) 0.12 0.03
Q2 YTD 2015 Adjusted EPS Change in Adjusted EBITDA Change in Interest, Depreciationand Amortization
Change in Taxes/ Other Q2 YTD 2016 Adjusted EPS
Adjusted EPS Bridge
30
$0.69 $0.49
(0.30)
0.08 0.02
Q2 2015 Adjusted EPS Change in Adjusted EBITDA Change in Interest,Depreciation and Amortization
Change in Taxes/ Other Q2 2016 Adjusted EPS1 1
1 1
Second Quarter 2016
Second Quarter YTD 2016
1. See Appendix for reconciliation to GAAP
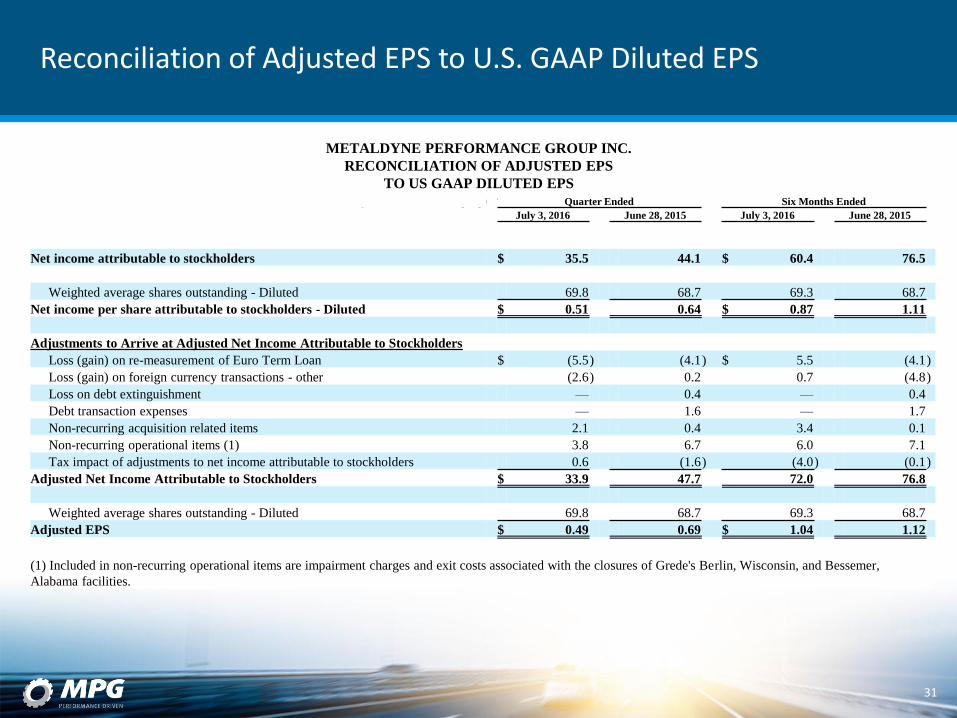
Reconciliation of Adjusted EPS to U.S. GAAP Diluted EPS
31
METALDYNE PERFORMANCE GROUP INC.
RECONCILIATION OF ADJUSTED EPS
TO US GAAP DILUTED EPS
(In millions except per share amounts) Quarter Ended Six Months Ended
July 3, 2016 June 28, 2015 July 3, 2016 June 28, 2015
Net income attributable to stockholders $ 35.5 44.1 $ 60.4 76.5
Weighted average shares outstanding - Diluted 69.8 68.7 69.3 68.7
Net income per share attributable to stockholders - Diluted $ 0.51 0.64 $ 0.87 1.11
Adjustments to Arrive at Adjusted Net Income Attributable to Stockholders
Loss (gain) on re-measurement of Euro Term Loan $ (5.5 ) (4.1 ) $ 5.5 (4.1 )
Loss (gain) on foreign currency transactions - other (2.6 ) 0.2 0.7 (4.8 )
Loss on debt extinguishment — 0.4 — 0.4
Debt transaction expenses — 1.6 — 1.7
Non-recurring acquisition related items 2.1 0.4 3.4 0.1
Non-recurring operational items (1) 3.8 6.7 6.0 7.1
Tax impact of adjustments to net income attributable to stockholders 0.6 (1.6 ) (4.0 ) (0.1 )
Adjusted Net Income Attributable to Stockholders $ 33.9 47.7 72.0 76.8
Weighted average shares outstanding - Diluted 69.8 68.7 69.3 68.7
Adjusted EPS $ 0.49 0.69 $ 1.04 1.12
(1) Included in non-recurring operational items are impairment charges and exit costs associated with the closures of Grede's Berlin, Wisconsin, and Bessemer,
Alabama facilities.
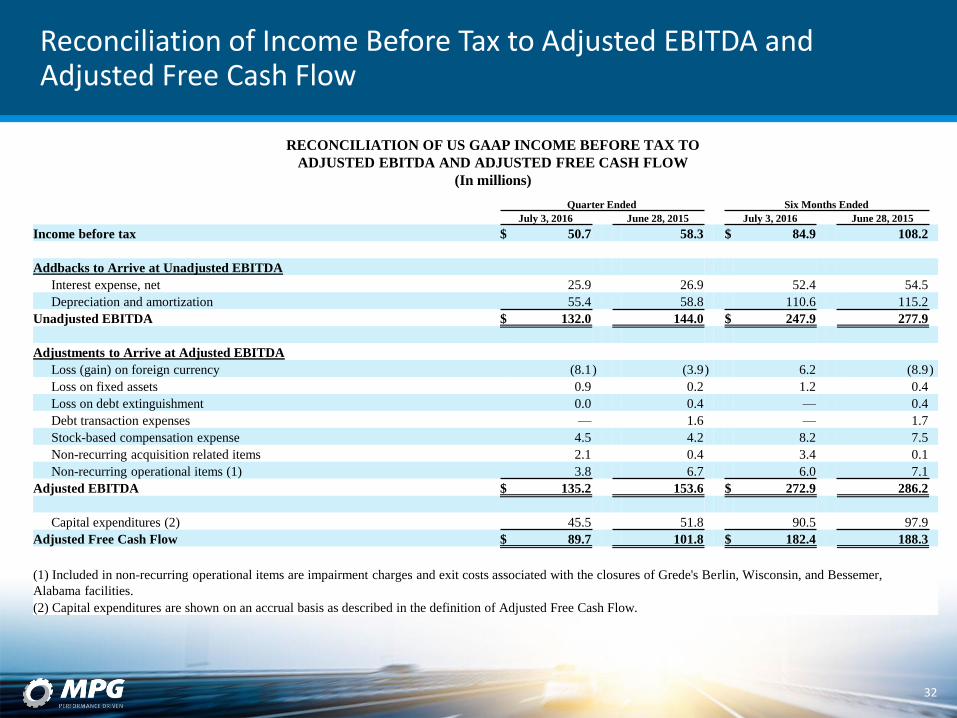
Reconciliation of Income Before Tax to Adjusted EBITDA and Adjusted Free Cash Flow
32
RECONCILIATION OF US GAAP INCOME BEFORE TAX TO
ADJUSTED EBITDA AND ADJUSTED FREE CASH FLOW
(In millions)
Quarter Ended Six Months Ended
July 3, 2016 June 28, 2015 July 3, 2016 June 28, 2015
Income before tax $ 50.7 58.3 $ 84.9 108.2
Addbacks to Arrive at Unadjusted EBITDA
Interest expense, net 25.9 26.9 52.4 54.5
Depreciation and amortization 55.4 58.8 110.6 115.2
Unadjusted EBITDA $ 132.0 144.0 $ 247.9 277.9
Adjustments to Arrive at Adjusted EBITDA
Loss (gain) on foreign currency (8.1 ) (3.9 ) 6.2 (8.9 )
Loss on fixed assets 0.9 0.2 1.2 0.4
Loss on debt extinguishment 0.0 0.4 — 0.4
Debt transaction expenses — 1.6 — 1.7
Stock-based compensation expense 4.5 4.2 8.2 7.5
Non-recurring acquisition related items 2.1 0.4 3.4 0.1
Non-recurring operational items (1) 3.8 6.7 6.0 7.1
Adjusted EBITDA $ 135.2 153.6 $ 272.9 286.2
Capital expenditures (2) 45.5 51.8 90.5 97.9
Adjusted Free Cash Flow $ 89.7 101.8 $ 182.4 188.3
(1) Included in non-recurring operational items are impairment charges and exit costs associated with the closures of Grede's Berlin, Wisconsin, and Bessemer,
Alabama facilities.
(2) Capital expenditures are shown on an accrual basis as described in the definition of Adjusted Free Cash Flow.
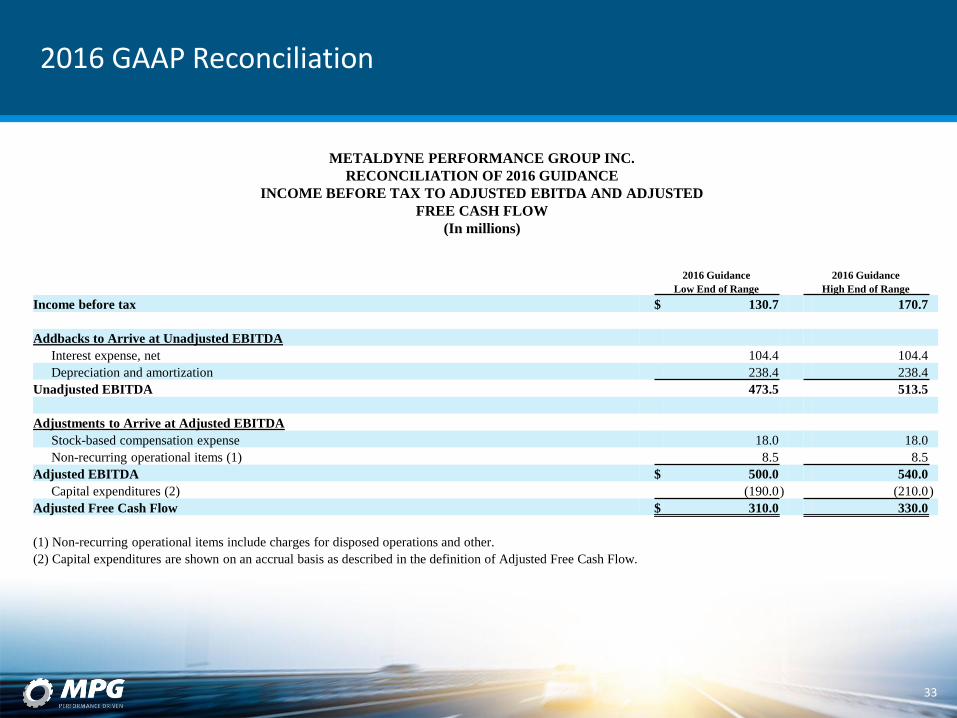
2016 GAAP Reconciliation
33
METALDYNE PERFORMANCE GROUP INC.
RECONCILIATION OF 2016 GUIDANCE
INCOME BEFORE TAX TO ADJUSTED EBITDA AND ADJUSTED
FREE CASH FLOW
(In millions)
2016 Guidance 2016 Guidance
Low End of Range High End of Range
Income before tax $ 130.7 170.7
Addbacks to Arrive at Unadjusted EBITDA
Interest expense, net 104.4 104.4
Depreciation and amortization 238.4 238.4
Unadjusted EBITDA 473.5 513.5
Adjustments to Arrive at Adjusted EBITDA
Stock-based compensation expense 18.0 18.0
Non-recurring operational items (1) 8.5 8.5
Adjusted EBITDA $ 500.0 540.0
Capital expenditures (2) (190.0 ) (210.0 )
Adjusted Free Cash Flow $ 310.0 330.0
(1) Non-recurring operational items include charges for disposed operations and other.
(2) Capital expenditures are shown on an accrual basis as described in the definition of Adjusted Free Cash Flow.
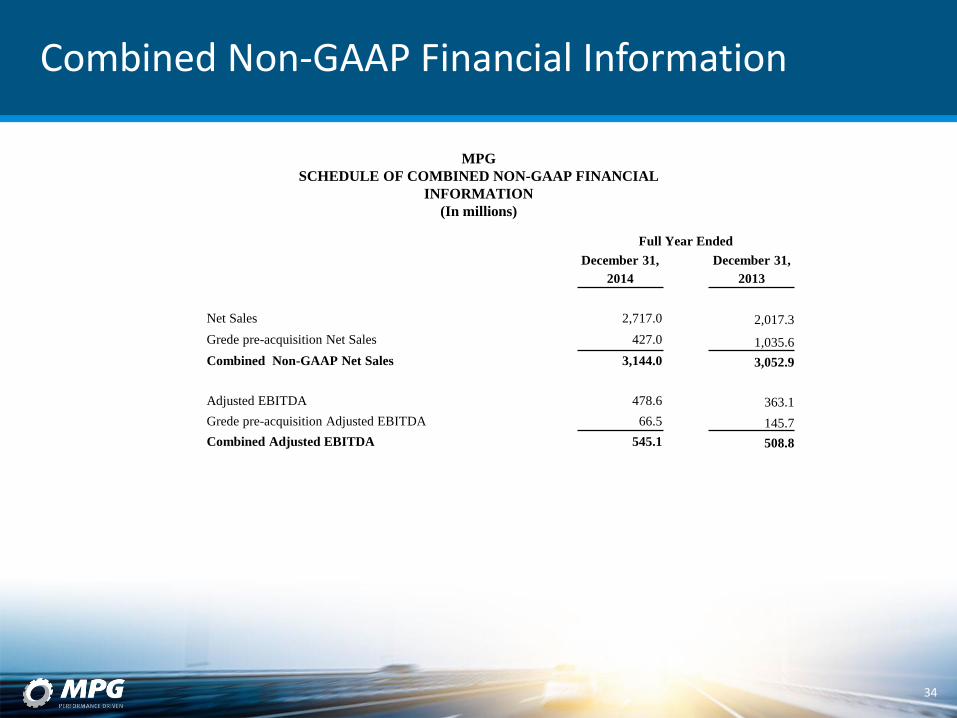
Combined Non-GAAP Financial Information
MPG
SCHEDULE OF COMBINED NON-GAAP FINANCIAL
INFORMATION
(In millions)
34
Full Year Ended
December 31,
2014
December 31,
2013
Net Sales 2,717.0 2,017.3
Grede pre-acquisition Net Sales 427.0 1,035.6
Combined Non-GAAP Net Sales 3,144.0 3,052.9
Adjusted EBITDA 478.6 363.1
Grede pre-acquisition Adjusted EBITDA 66.5 145.7
Combined Adjusted EBITDA 545.1 508.8