Embed Size (px)
Citation preview
PRESENTING
QUALITATIVE FINDINGS
Using NVivo Output to Tell the Story
Philip Adu, Ph.D.Methodology Expert National Center for Academic & Dissertation Excellence (NCADE)The Chicago School of Professional [email protected]@drphilipadu
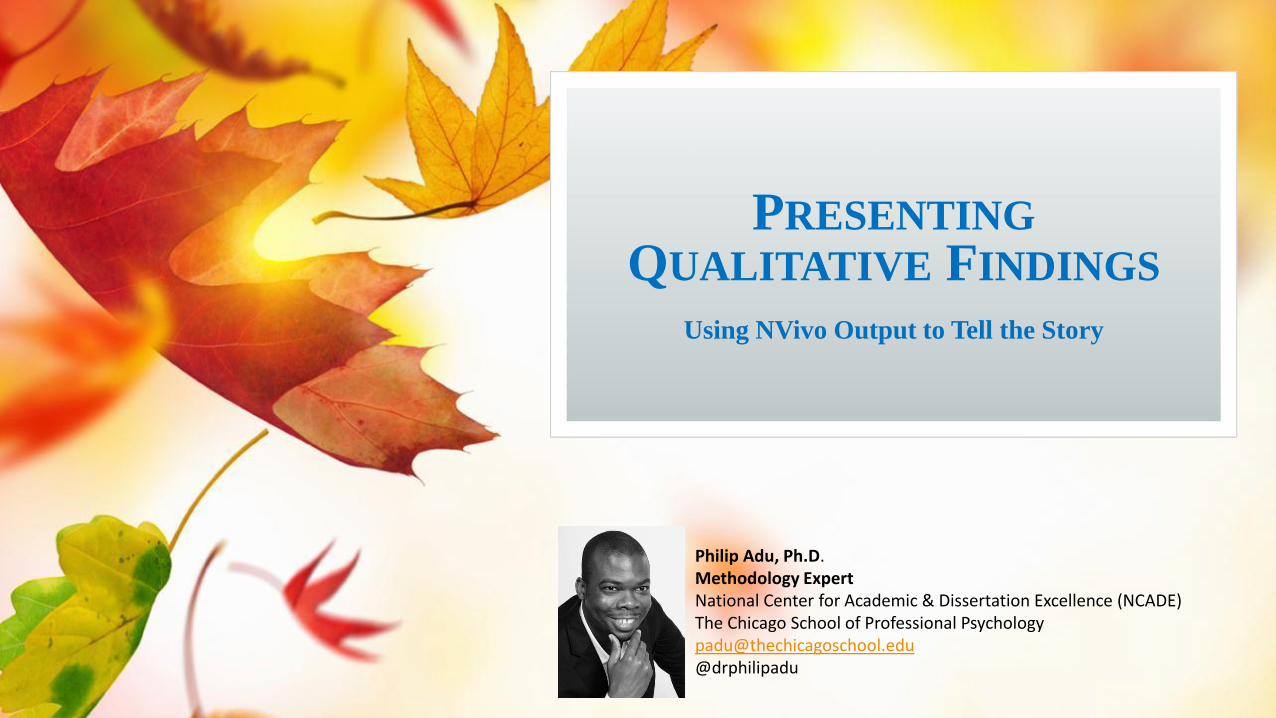
SURVIVING IN A CLASS WITH THE “MOST
DIFFICULT OF PROFESSORS”
IT IS AVAILABLE ON
Amazon
Barnes and Noble
Xulon Press
This is a tangible and practical guide that can be used by any student to improve the way in which they learn, and handle challenges that are faced when dealing with difficult courses and professors.
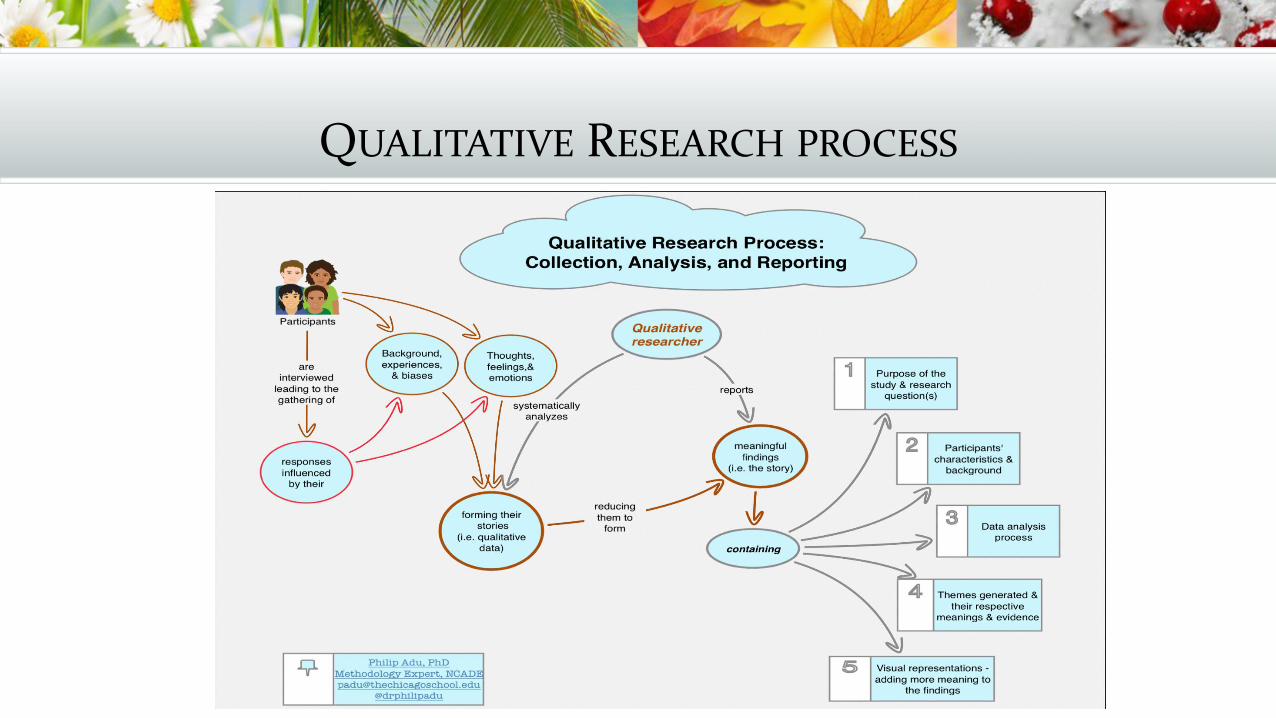
QUALITATIVE RESEARCH PROCESS
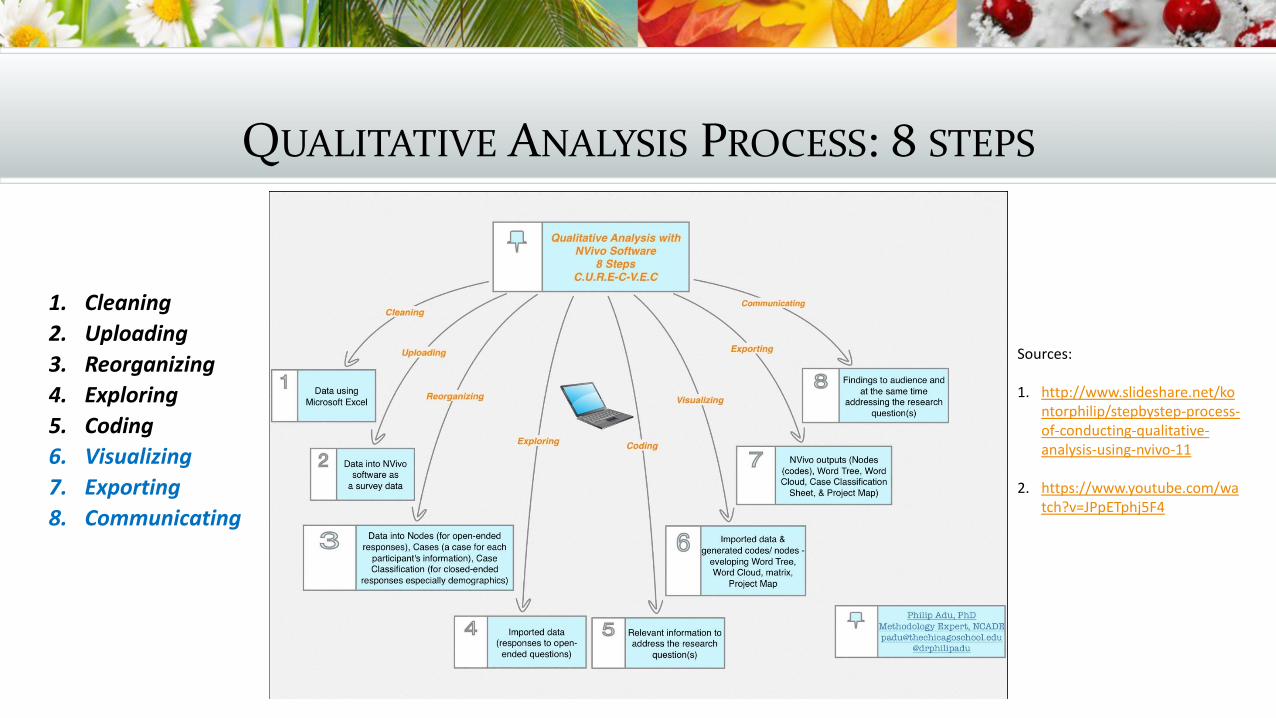
QUALITATIVE ANALYSIS PROCESS: 8 STEPS
1. Cleaning
2. Uploading
3. Reorganizing
4. Exploring
5. Coding
6. Visualizing
7. Exporting
8. Communicating
Sources:
1. http://www.slideshare.net/kontorphilip/stepbystep-process-of-conducting-qualitative-analysis-using-nvivo-11
2. https://www.youtube.com/watch?v=JPpETphj5F4
CHAPTER FOUR SECTIONS
1. Overview
2. Participants’ characteristics
3. Data analysis process
4. Qualitative results/main findings
5. Summary
Presenting the qualitative findings
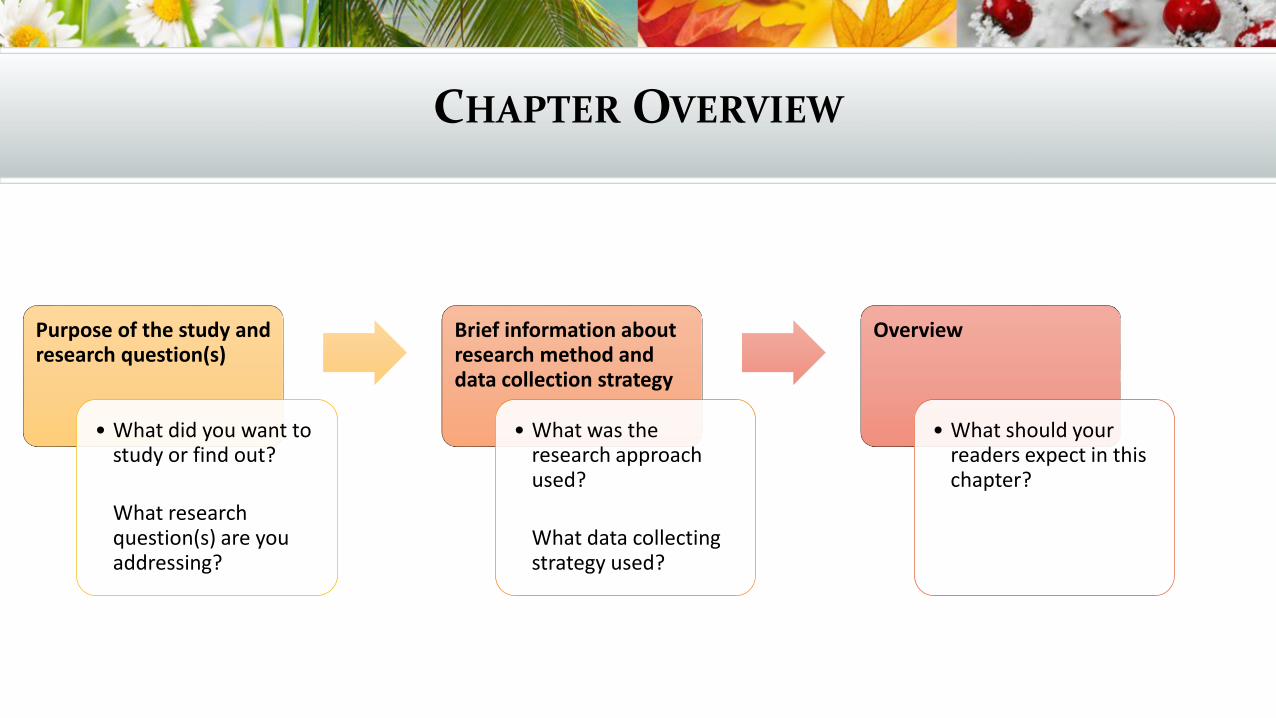
CHAPTER OVERVIEW
Purpose of the study and research question(s)
• What did you want to study or find out?
What research question(s) are you addressing?
Brief information about research method and data collection strategy
• What was the research approach used?
What data collecting strategy used?
Overview
• What should your readers expect in this chapter?
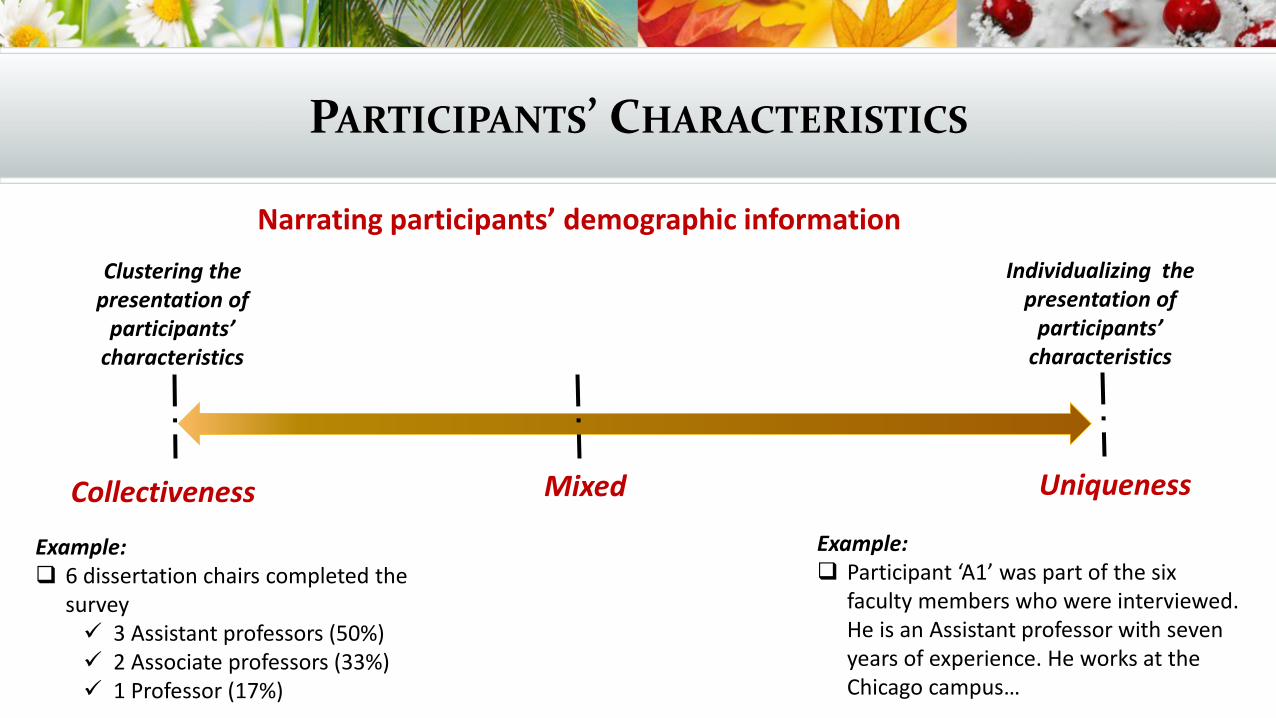
PARTICIPANTS’ CHARACTERISTICS
Collectiveness Uniqueness
Example: 6 dissertation chairs completed the
survey 3 Assistant professors (50%) 2 Associate professors (33%) 1 Professor (17%)
Example: Participant ‘A1’ was part of the six
faculty members who were interviewed. He is an Assistant professor with seven years of experience. He works at the Chicago campus…
Clustering the presentation of
participants’ characteristics
Individualizing the presentation of
participants’ characteristics
Mixed
Narrating participants’ demographic information
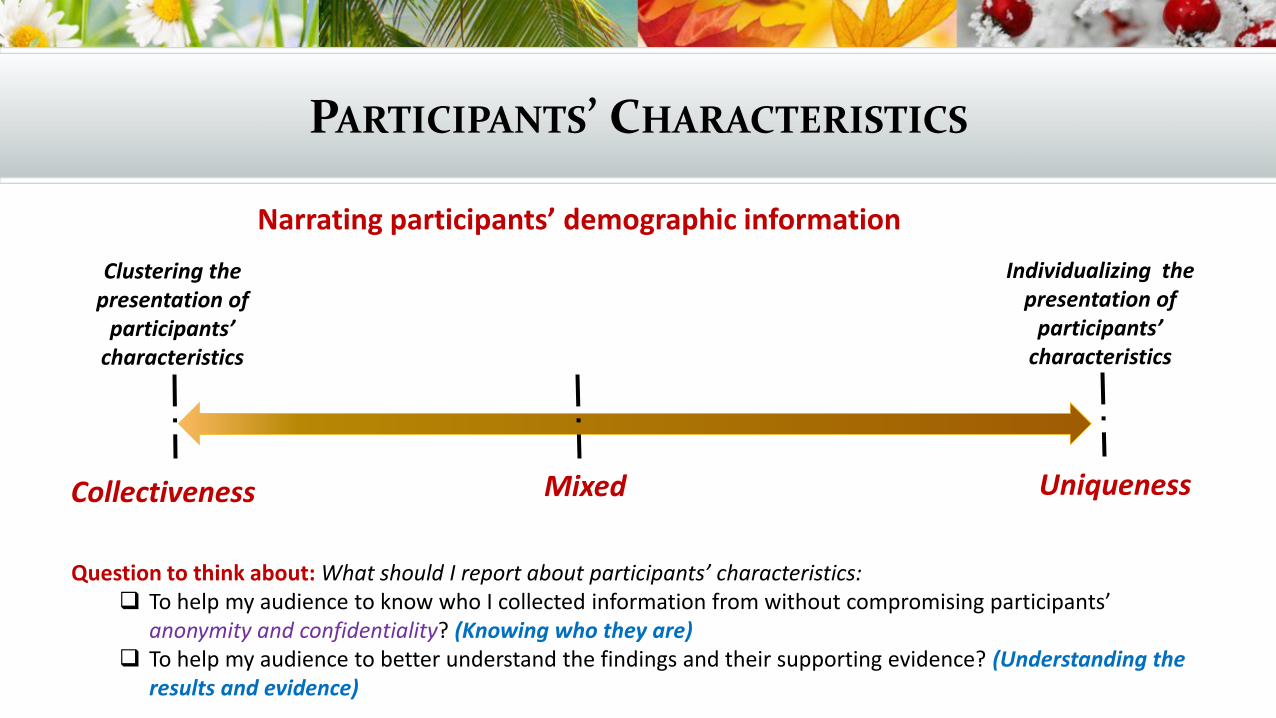
PARTICIPANTS’ CHARACTERISTICS
Collectiveness Uniqueness
Clustering the presentation of
participants’ characteristics
Individualizing the presentation of
participants’ characteristics
Mixed
Narrating participants’ demographic information
Question to think about: What should I report about participants’ characteristics: To help my audience to know who I collected information from without compromising participants’
anonymity and confidentiality? (Knowing who they are) To help my audience to better understand the findings and their supporting evidence? (Understanding the
results and evidence)
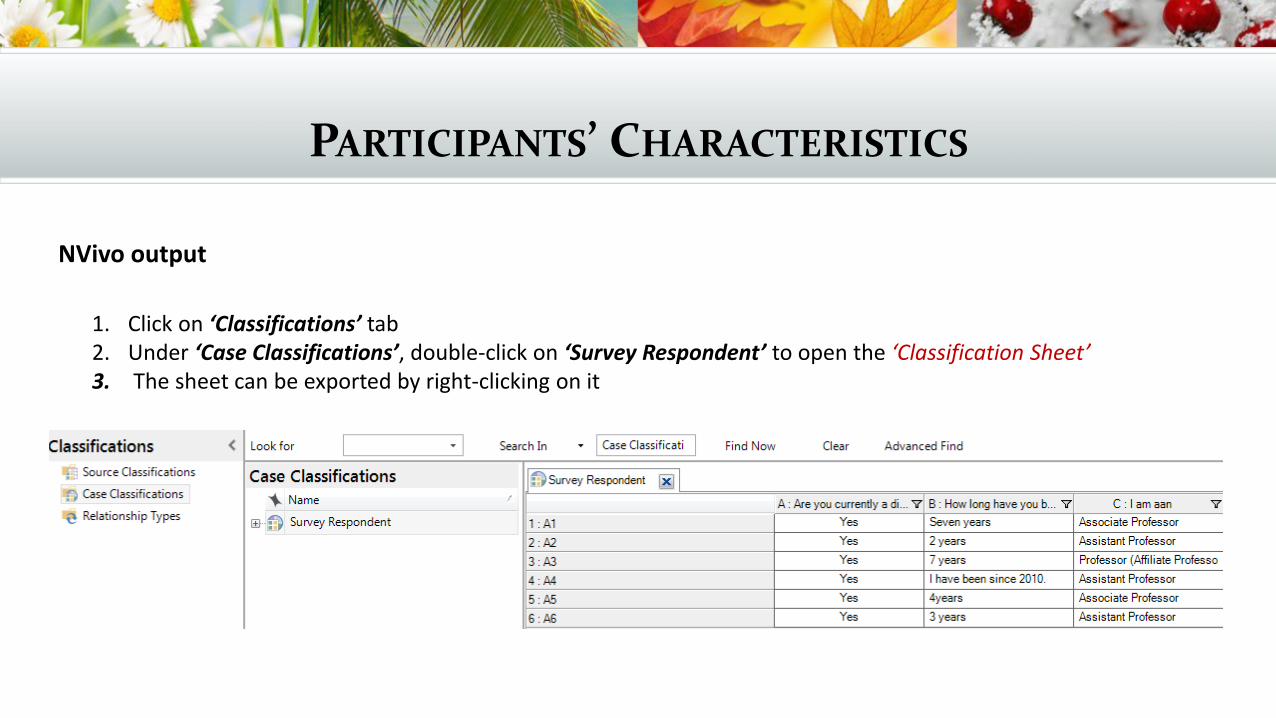
PARTICIPANTS’ CHARACTERISTICS
NVivo output
1. Click on ‘Classifications’ tab2. Under ‘Case Classifications’, double-click on ‘Survey Respondent’ to open the ‘Classification Sheet’3. The sheet can be exported by right-clicking on it
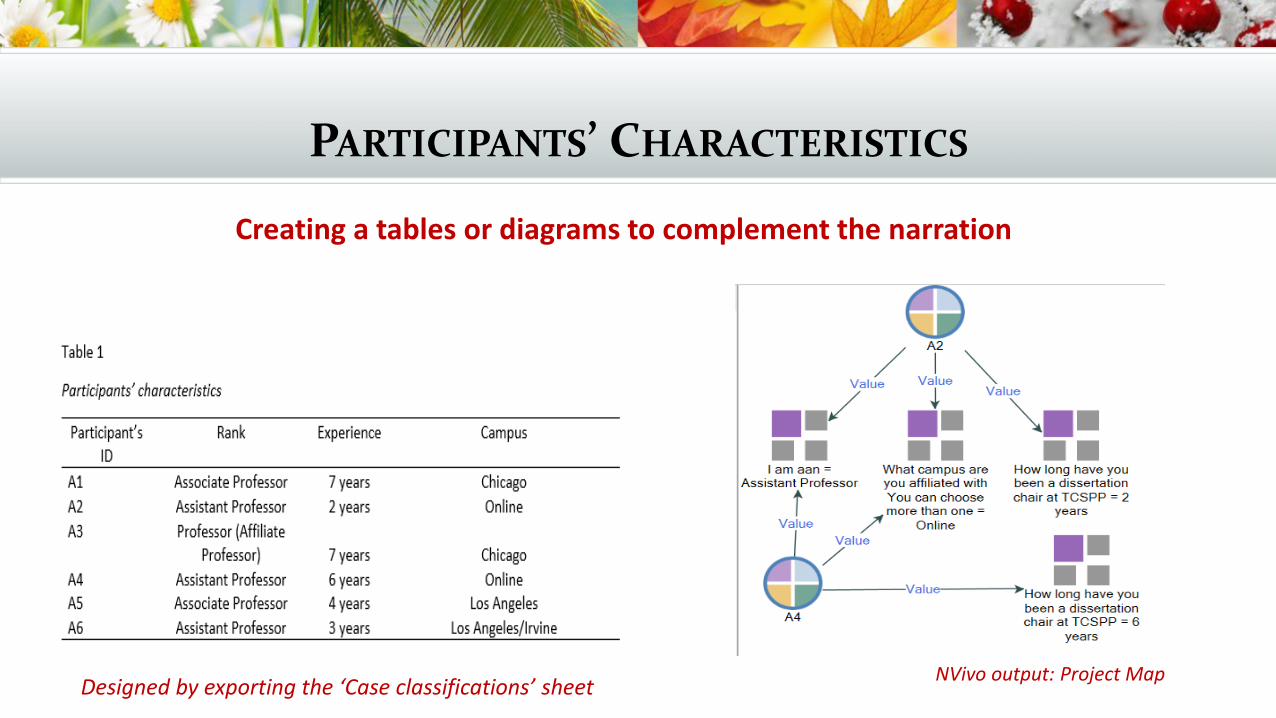
PARTICIPANTS’ CHARACTERISTICS
Creating a tables or diagrams to complement the narration
NVivo output: Project MapDesigned by exporting the ‘Case classifications’ sheet
DATA ANALYSIS PROCESS
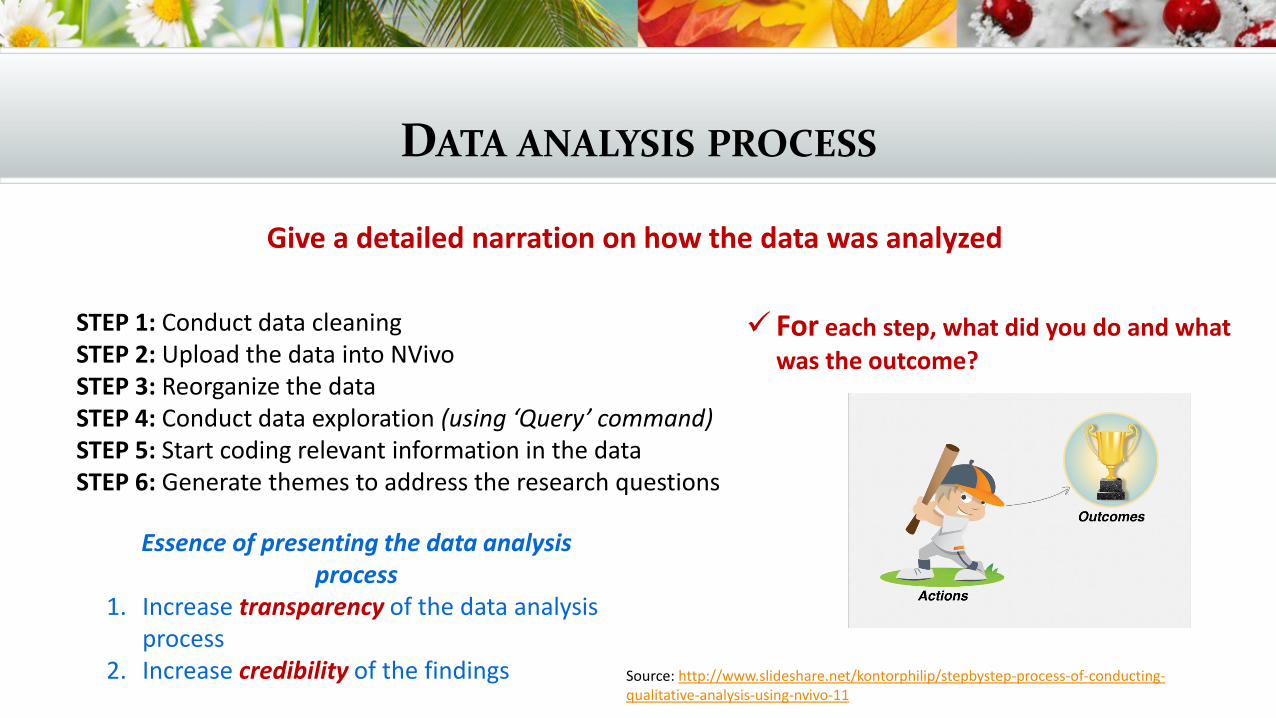
Give a detailed narration on how the data was analyzed
STEP 1: Conduct data cleaningSTEP 2: Upload the data into NVivoSTEP 3: Reorganize the dataSTEP 4: Conduct data exploration (using ‘Query’ command)STEP 5: Start coding relevant information in the dataSTEP 6: Generate themes to address the research questions
For each step, what did you do and what
was the outcome?
Essence of presenting the data analysis process
1. Increase transparency of the data analysis process
2. Increase credibility of the findings Source: http://www.slideshare.net/kontorphilip/stepbystep-process-of-conducting-qualitative-analysis-using-nvivo-11
DATA ANALYSIS PROCESS
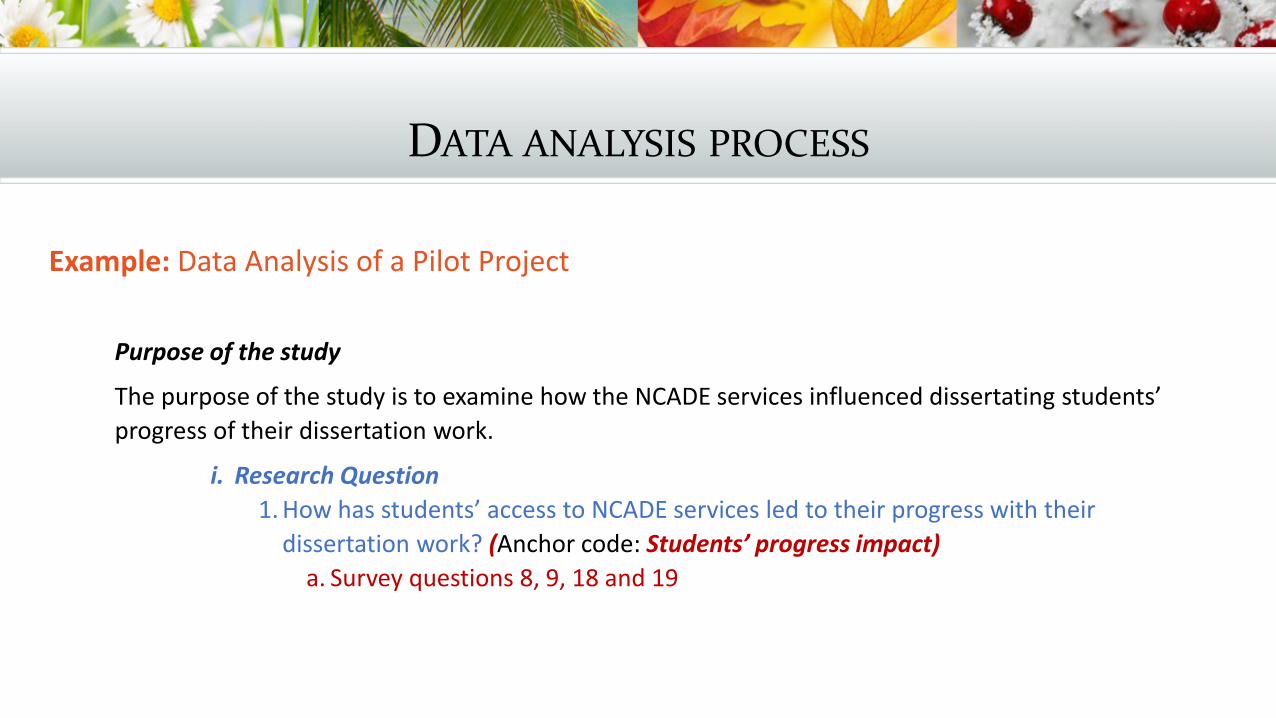
Example: Data Analysis of a Pilot Project
Purpose of the study
The purpose of the study is to examine how the NCADE services influenced dissertating students’
progress of their dissertation work.
i. Research Question
1. How has students’ access to NCADE services led to their progress with their
dissertation work? (Anchor code: Students’ progress impact)
a. Survey questions 8, 9, 18 and 19
DATA ANALYSIS PROCESS
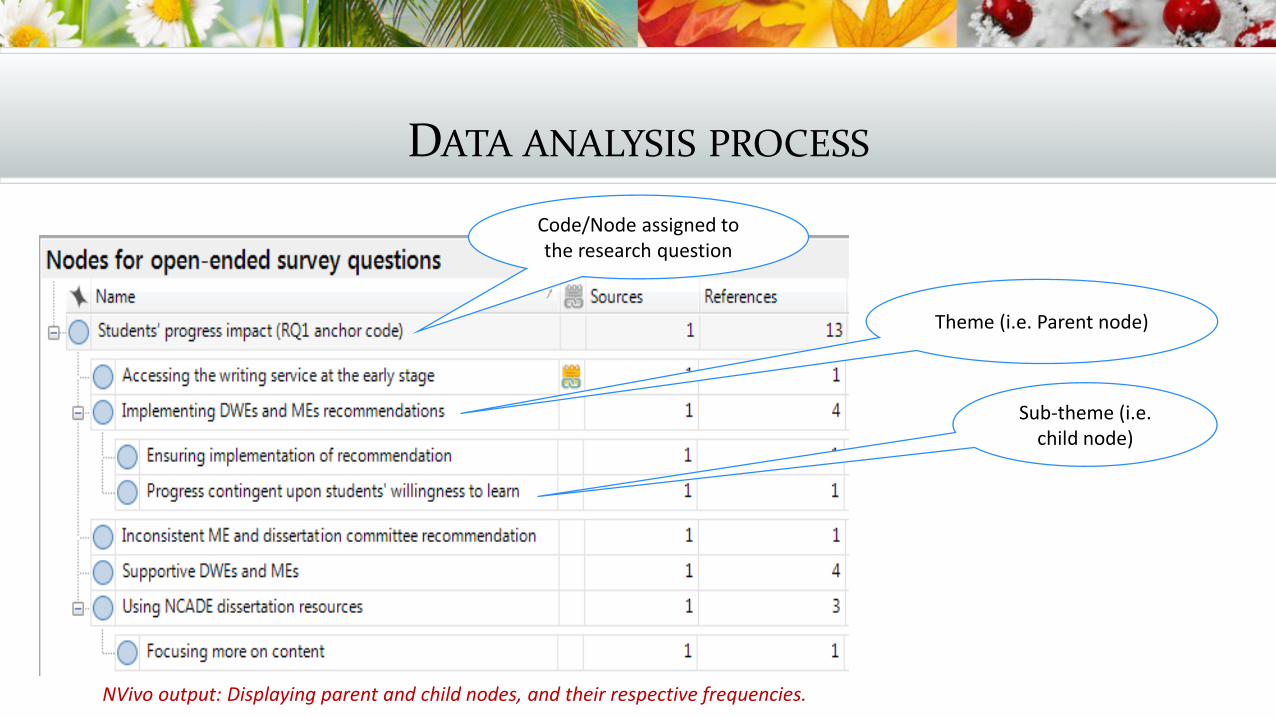
NVivo output: Displaying parent and child nodes, and their respective frequencies.
Code/Node assigned to the research question
Theme (i.e. Parent node)
Sub-theme (i.e. child node)
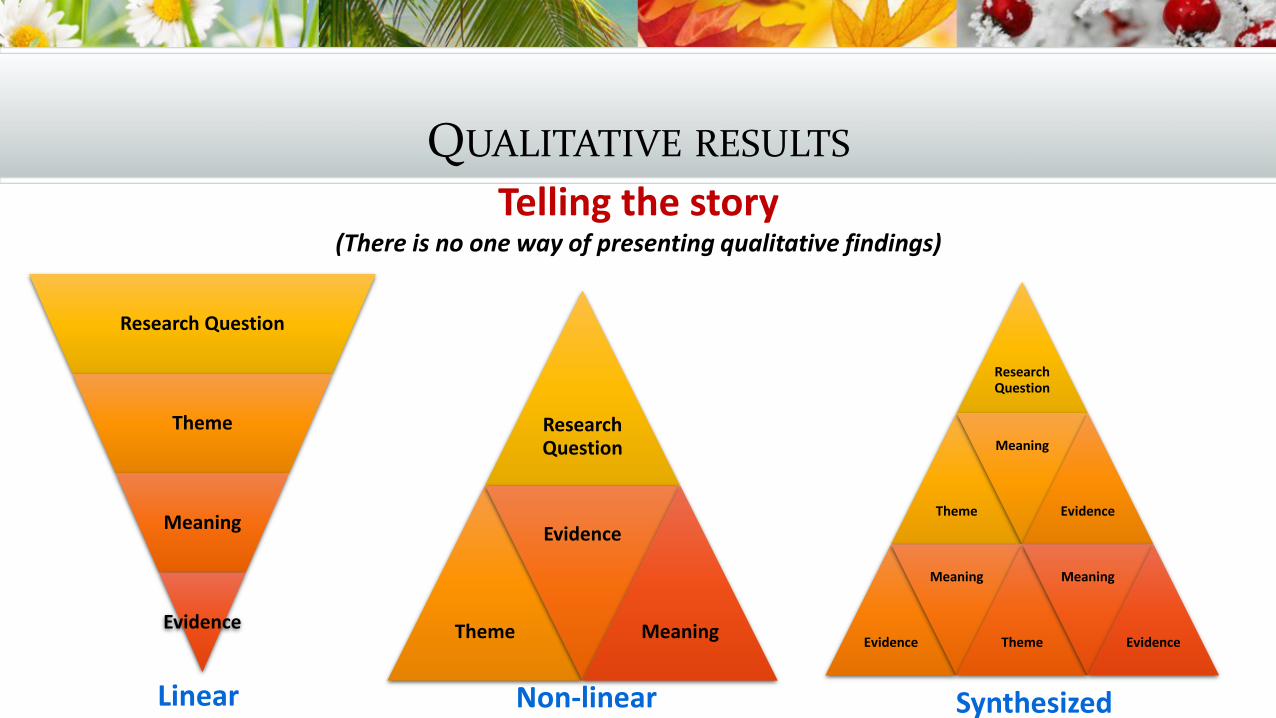
QUALITATIVE RESULTS
Telling the story(There is no one way of presenting qualitative findings)
Research Question
Theme
Meaning
Evidence
Research Question
Theme
Meaning
Evidence
Evidence
Meaning
Theme
Meaning
Evidence
Research Question
Theme
Evidence
Meaning
Linear Non-linear Synthesized
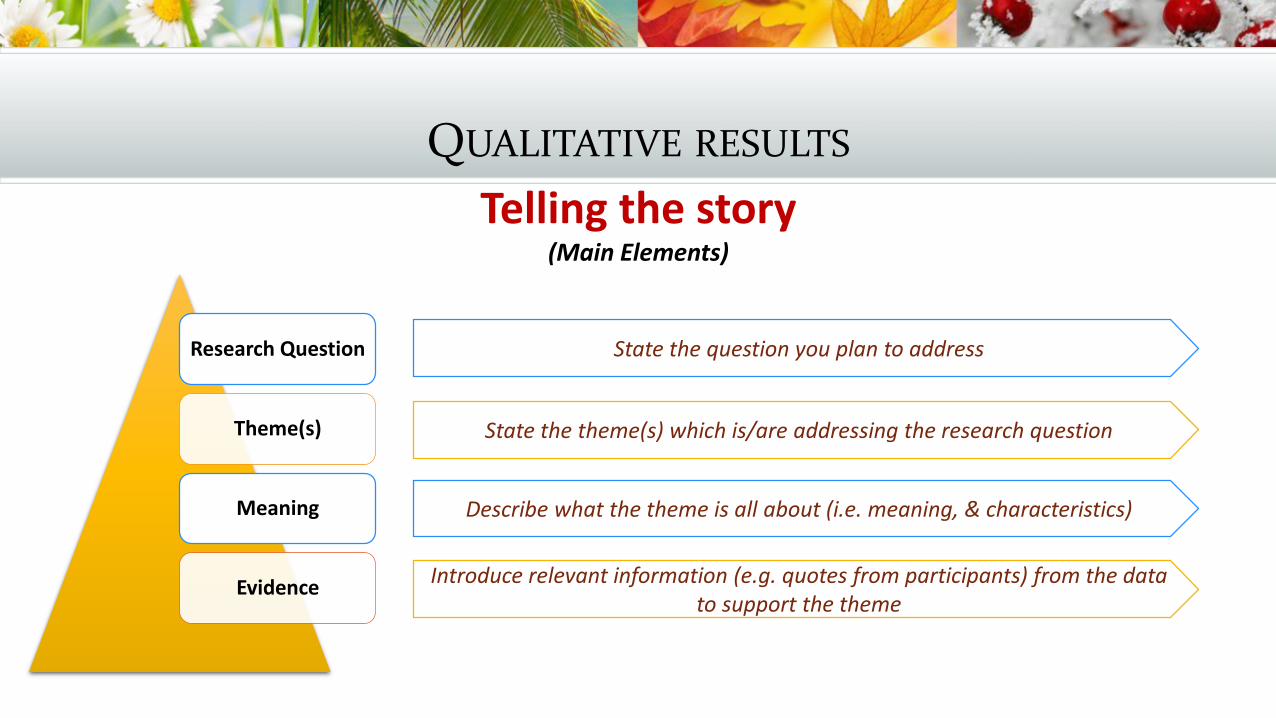
QUALITATIVE RESULTS
Telling the story(Main Elements)
Research Question
Theme(s)
Meaning
Evidence
State the question you plan to address
State the theme(s) which is/are addressing the research question
Describe what the theme is all about (i.e. meaning, & characteristics)
Introduce relevant information (e.g. quotes from participants) from the data to support the theme
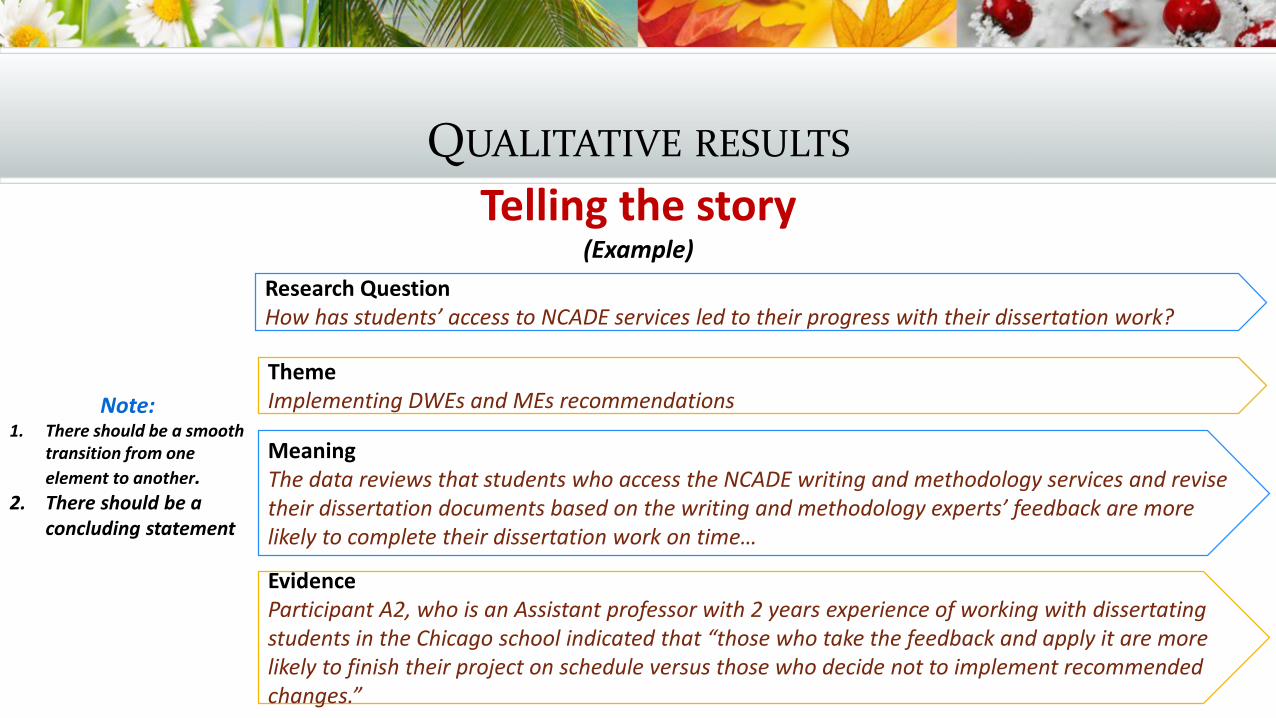
QUALITATIVE RESULTS
Telling the story(Example)
Research QuestionHow has students’ access to NCADE services led to their progress with their dissertation work?
ThemeImplementing DWEs and MEs recommendations
MeaningThe data reviews that students who access the NCADE writing and methodology services and revise their dissertation documents based on the writing and methodology experts’ feedback are more likely to complete their dissertation work on time…
EvidenceParticipant A2, who is an Assistant professor with 2 years experience of working with dissertating students in the Chicago school indicated that “those who take the feedback and apply it are more likely to finish their project on schedule versus those who decide not to implement recommended changes.”
Note: 1. There should be a smooth
transition from one
element to another. 2. There should be a
concluding statement
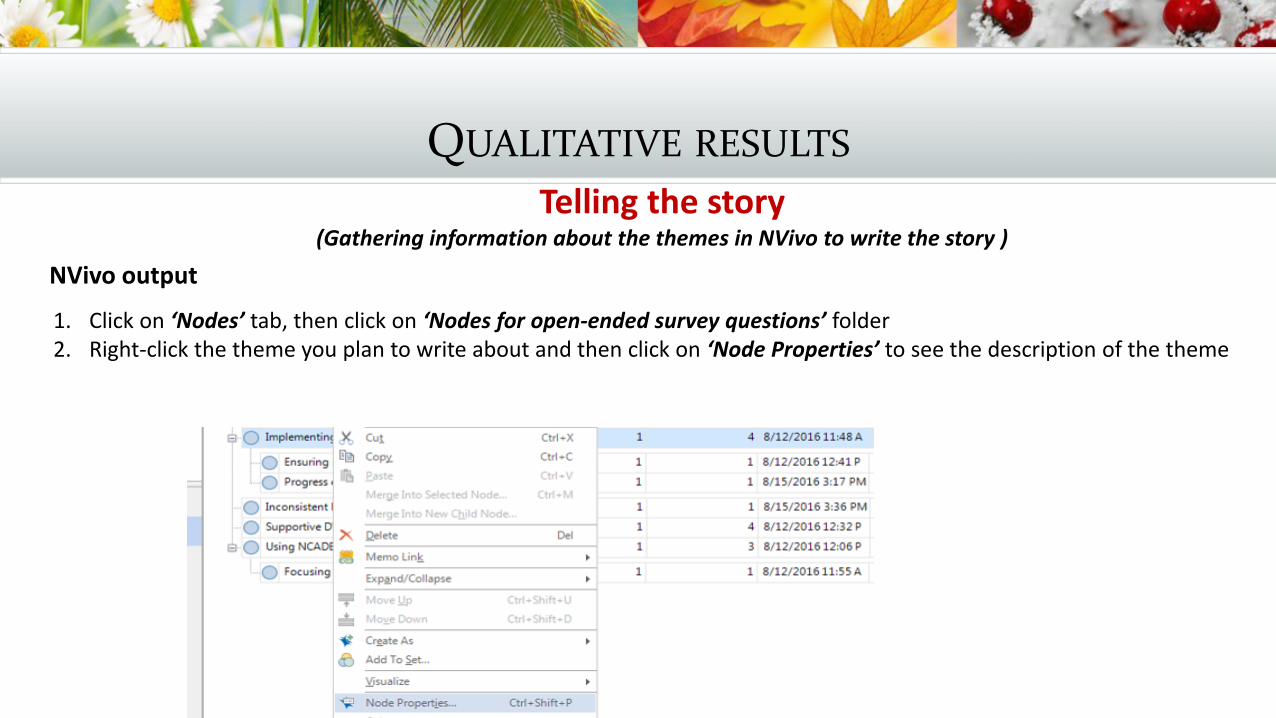
QUALITATIVE RESULTS
Telling the story(Gathering information about the themes in NVivo to write the story )
NVivo output
1. Click on ‘Nodes’ tab, then click on ‘Nodes for open-ended survey questions’ folder2. Right-click the theme you plan to write about and then click on ‘Node Properties’ to see the description of the theme
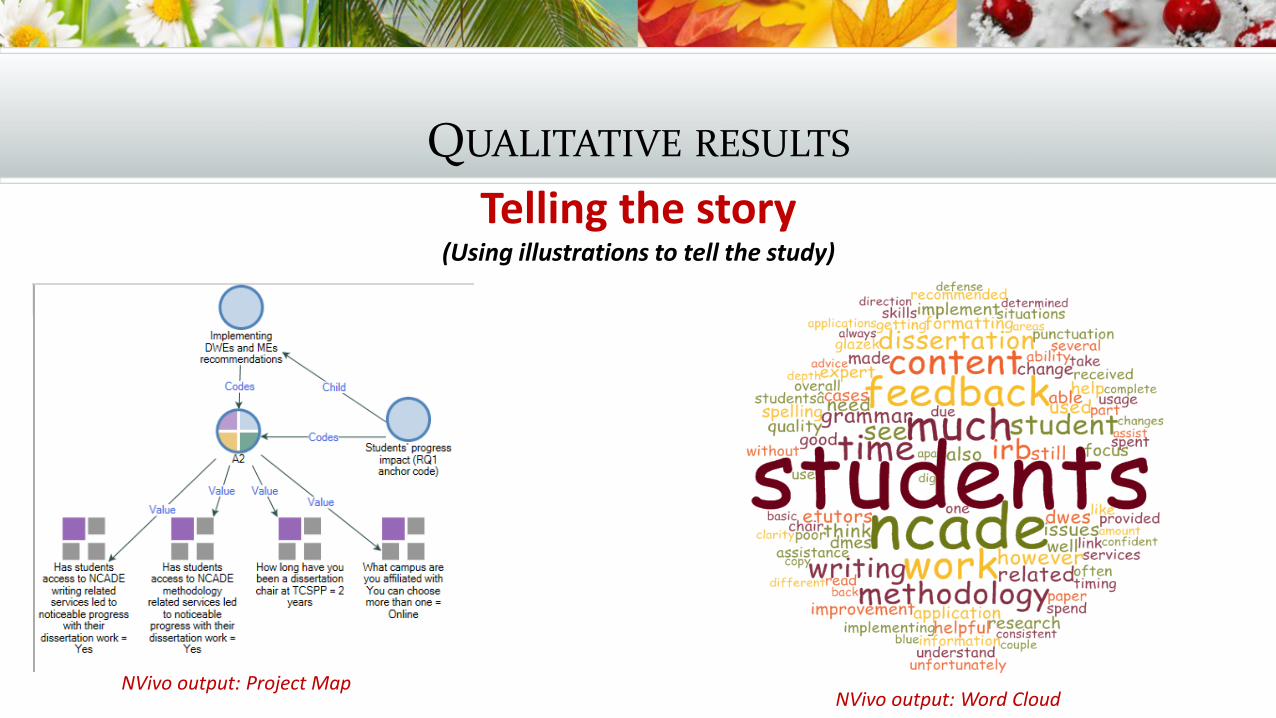
QUALITATIVE RESULTS
Telling the story(Using illustrations to tell the study)
NVivo output: Word CloudNVivo output: Project Map
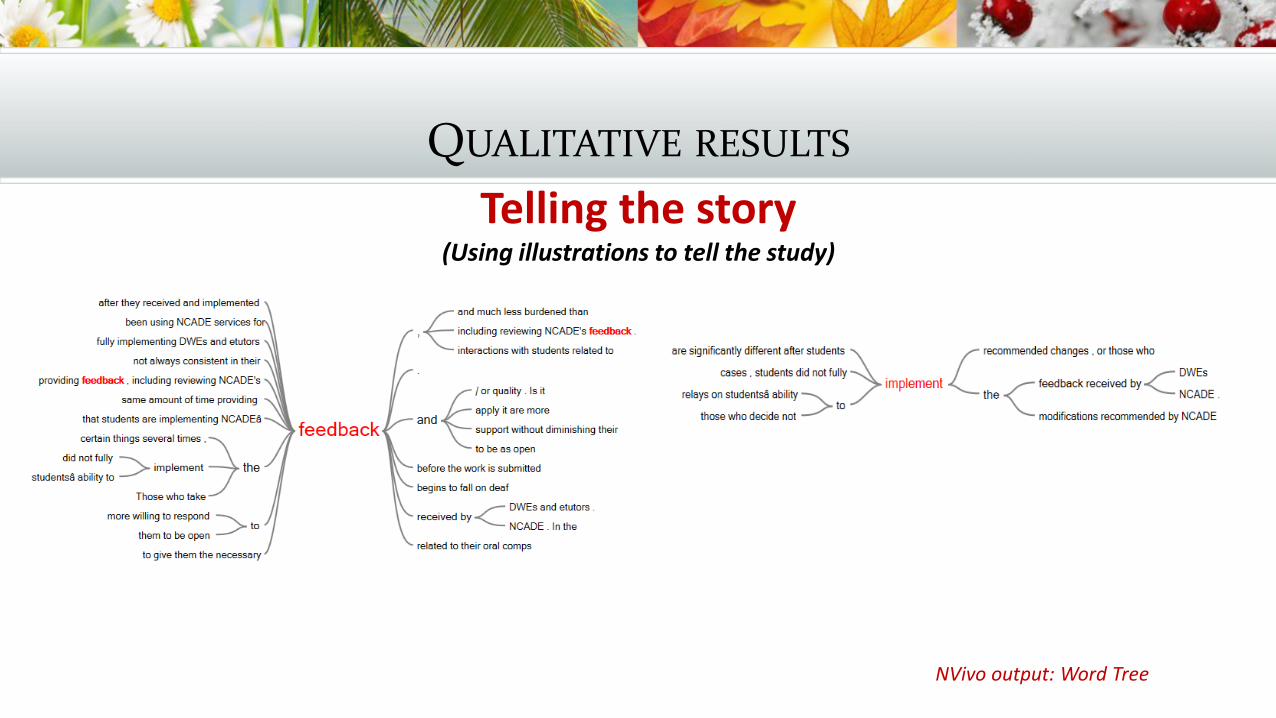
QUALITATIVE RESULTS
Telling the story(Using illustrations to tell the study)
NVivo output: Word Tree
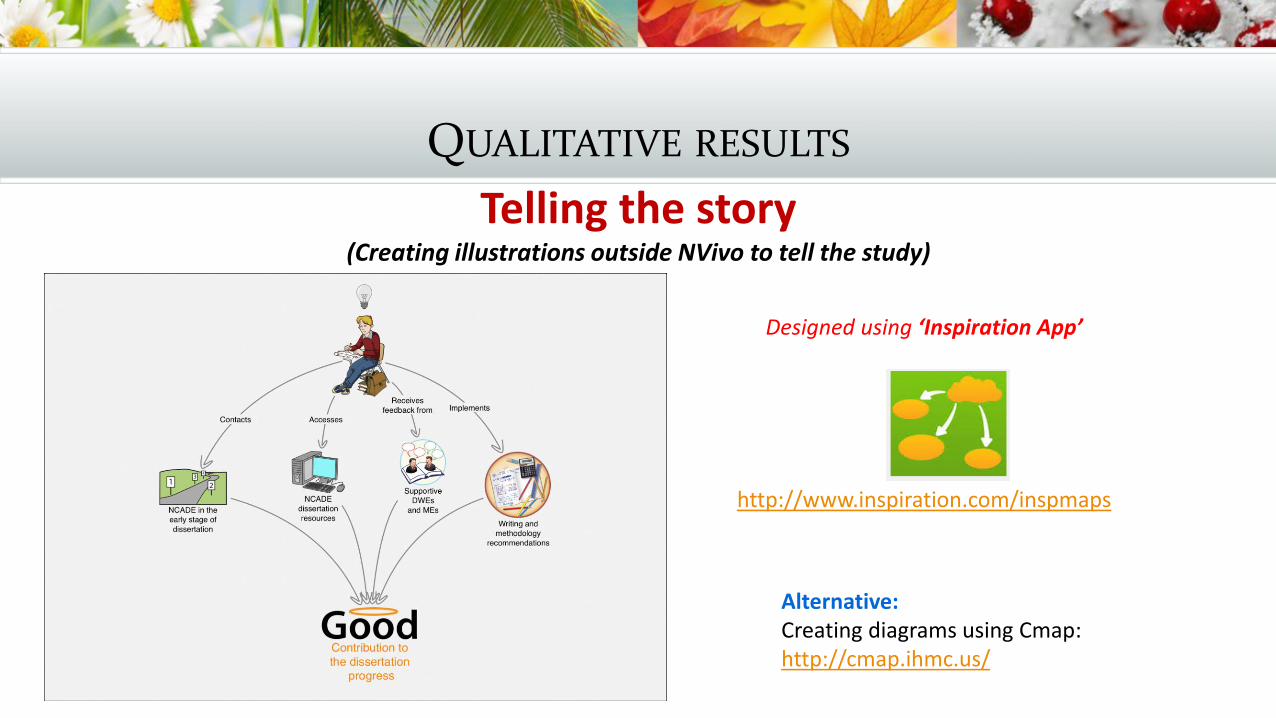
QUALITATIVE RESULTS
Telling the story(Creating illustrations outside NVivo to tell the study)
Designed using ‘Inspiration App’
http://www.inspiration.com/inspmaps
Alternative:Creating diagrams using Cmap: http://cmap.ihmc.us/
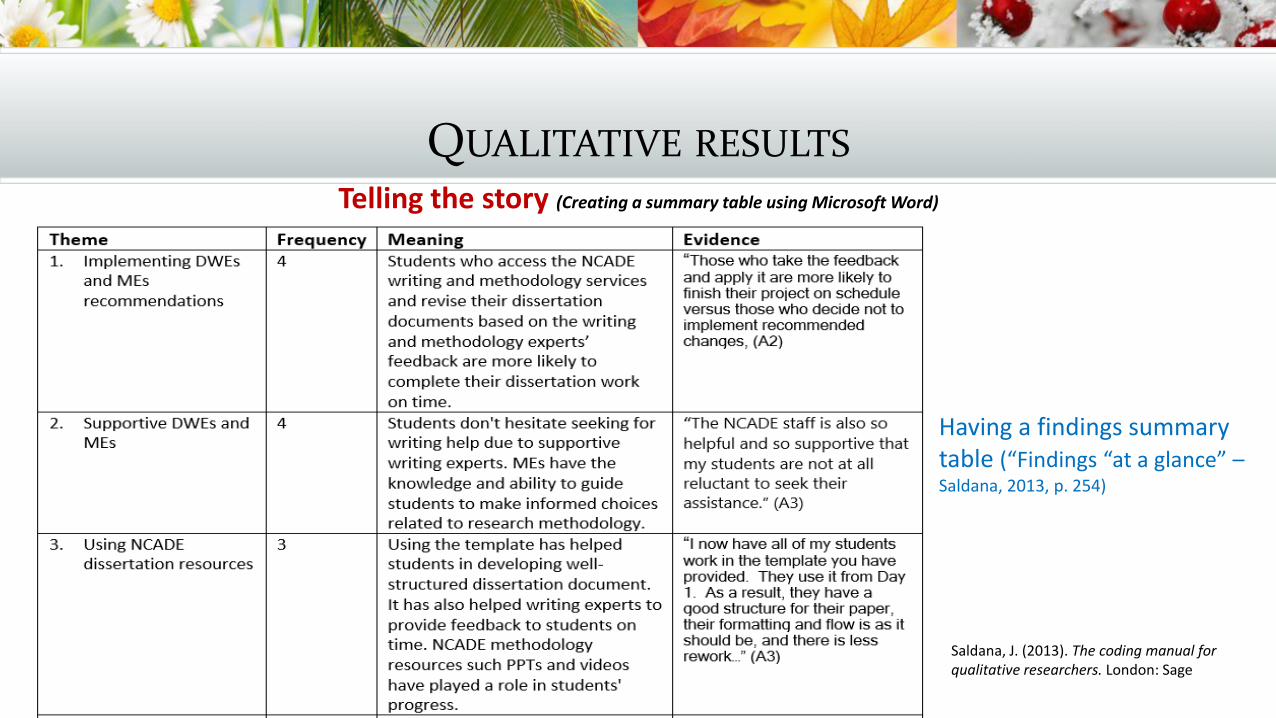
QUALITATIVE RESULTS
Telling the story (Creating a summary table using Microsoft Word)
Having a findings summary table (“Findings “at a glance” –Saldana, 2013, p. 254)
Saldana, J. (2013). The coding manual for qualitative researchers. London: Sage
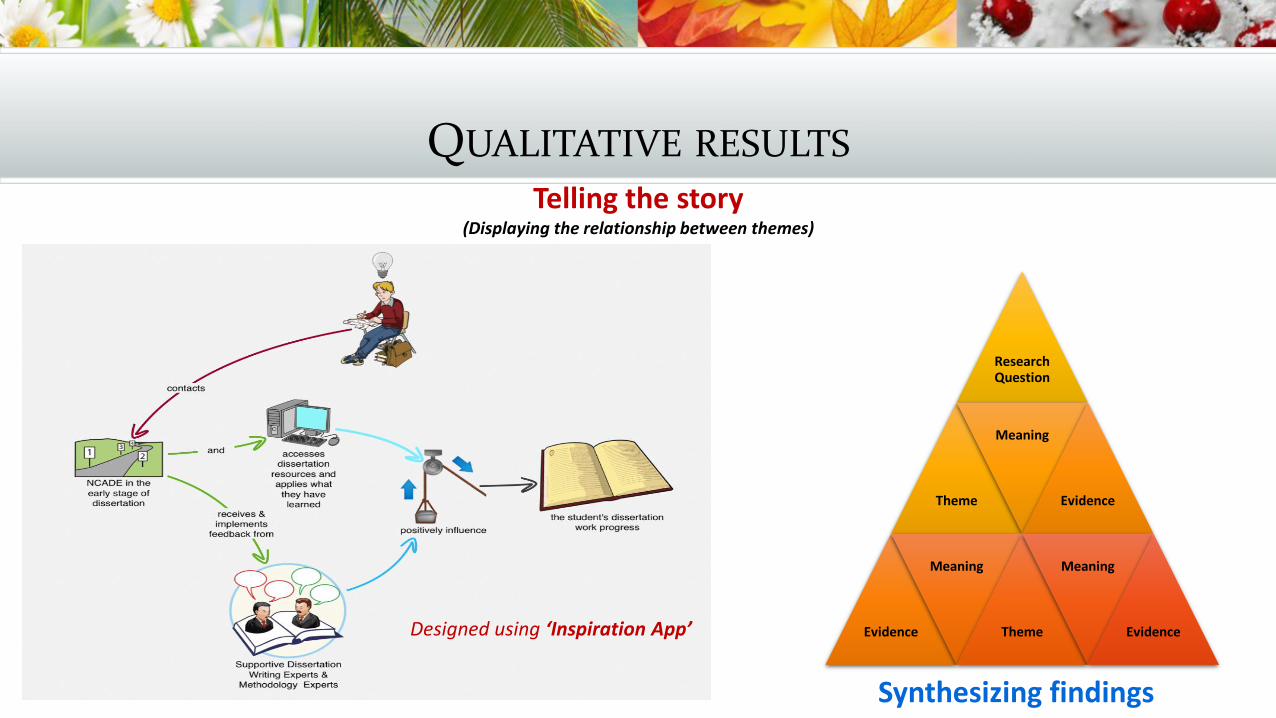
QUALITATIVE RESULTS
Telling the story(Displaying the relationship between themes)
Research Question
Theme
Meaning
Evidence
Evidence
Meaning
Theme
Meaning
Evidence
Synthesizing findings
Designed using ‘Inspiration App’
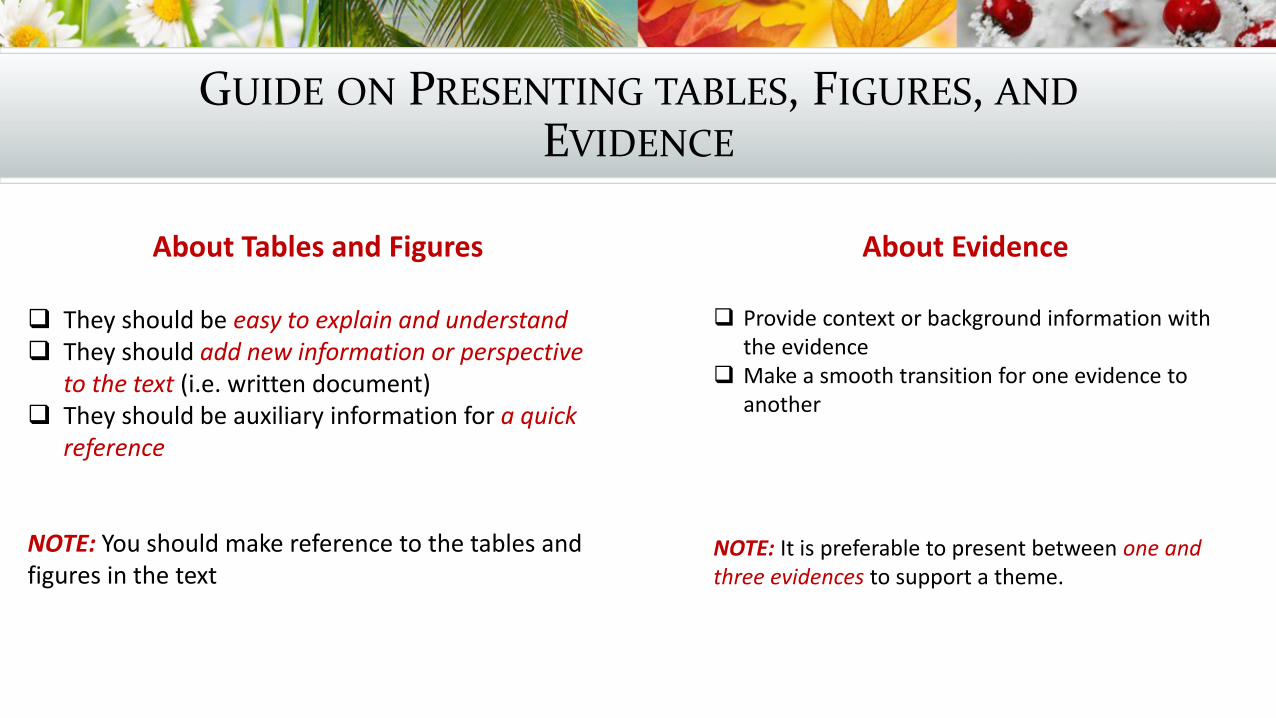
GUIDE ON PRESENTING TABLES, FIGURES, AND
EVIDENCE
About Tables and Figures
They should be easy to explain and understand They should add new information or perspective
to the text (i.e. written document) They should be auxiliary information for a quick
reference
NOTE: You should make reference to the tables and figures in the text
About Evidence
Provide context or background information with the evidence
Make a smooth transition for one evidence to another
NOTE: It is preferable to present between one and three evidences to support a theme.
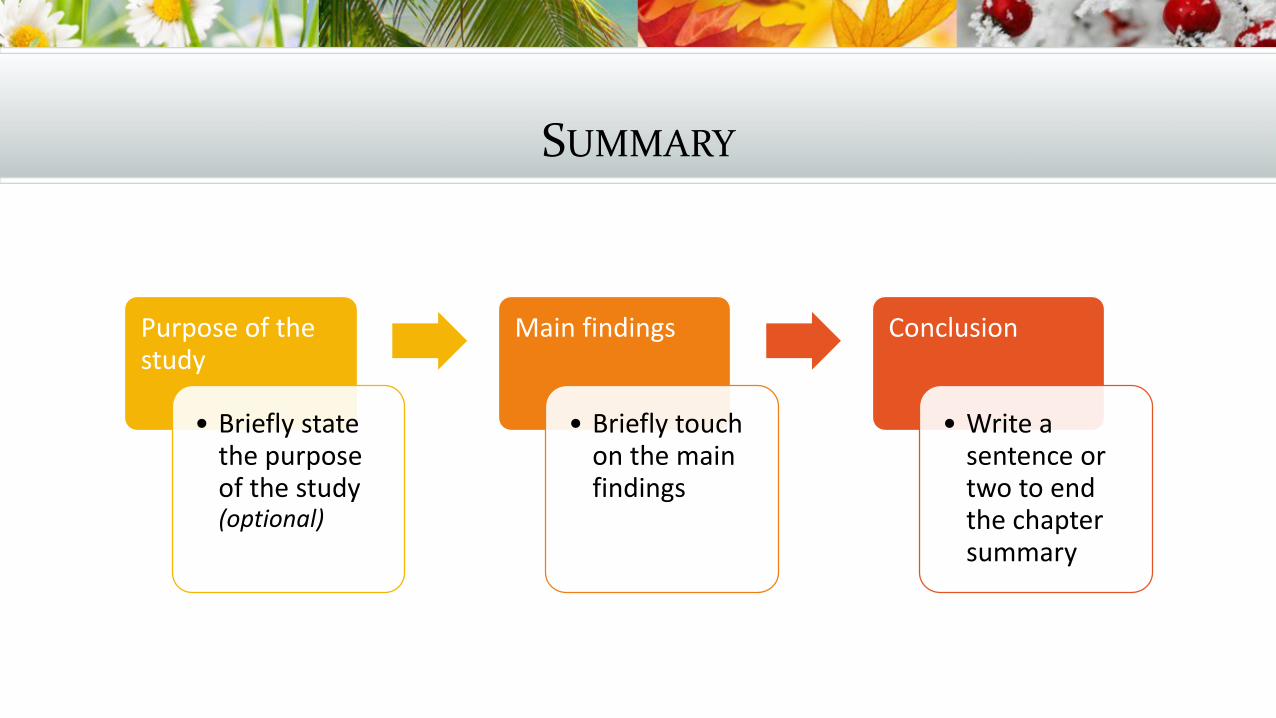
SUMMARY
Purpose of the study
• Briefly state the purpose of the study (optional)
Main findings
• Briefly touch on the main findings
Conclusion
• Write a sentence or two to end the chapter summary
Philip Adu, Ph.D.
Methodology Expert
National Center for Academic & Dissertation Excellence (NCADE)
The Chicago School of Professional Psychology
You could reach me at [email protected] and @drphilipadu on twitter.
To cite this document, copy the following:
Adu, P. (2016, August 8). Presenting Qualitative Findings: Using NVivo Output to Tell the Story. Retrieved from http://www.slideshare.net/kontorphilip/presenting-qualitative-findings-using-nvivo-output-to-tell-the-story