Embed Size (px)
Citation preview

Data Analysis Process of a Social Media (Twitter) Data
Using NVivo 11
STEP 1: Gather Twitter data
1. Review your research questions
o Example:
What should be done to combat mental health stigma?
How do twitter users perceive mental health stigma?
2. Determine what kind of data you need from the social media (Twitter)
o Example:
Tweets which focus on mental health, mental health stigma, and mental
illness
3. Come up key words/phrases that you would use to search for the information you need
from Twitter
o Example:
Mental health
Mental health stigma
Mental illness
Mental health awareness
Mental health care
4. Search with key words/phrases using a pound sign (#)
o Example:
#Mentalhealth
#Mentalhealthstigma
#Mentalillness
#Mentalhealthawareness
#Mentalhealthcare
5. Review the search results to determine the richness of the data in addressing your
research questions
6. Click on the ‘NCapture’ icon to download the data
NOTE: You need to install the ‘NCapture’ icon on your web browser
For an ‘Internet Explorer’ browser, go to: http://help-
ncapture.qsrinternational.com/desktop/topics/install_ncapture_for_internet_
explorer.htm

For a ‘Chrome’ browser, go to: http://help-
ncapture.qsrinternational.com/desktop/topics/install_ncapture_for_chrome.htm
STEP 2: Conduct data cleaning
1. Import the data into NVivo
a. Clicking on ‘DATA’ b. Going to and click on ‘From Other Sources’ c. Clicking on ‘From NCapture…’ to import the twitter data
2. Export the data in Excel format
a. Right-clicking on the spreadsheet
b. Click on ‘Export Dataset…’ to export the data in Excel format
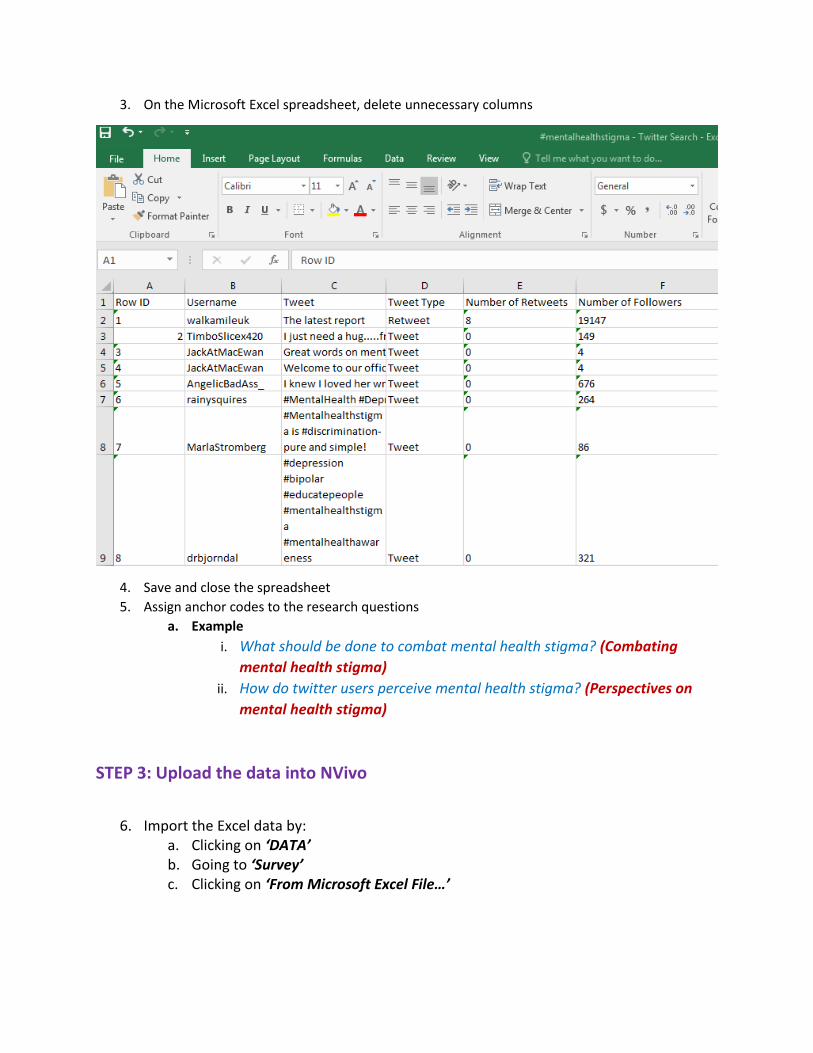
3. On the Microsoft Excel spreadsheet, delete unnecessary columns
4. Save and close the spreadsheet
5. Assign anchor codes to the research questions
a. Example
i. What should be done to combat mental health stigma? (Combating
mental health stigma)
ii. How do twitter users perceive mental health stigma? (Perspectives on
mental health stigma)
STEP 3: Upload the data into NVivo
6. Import the Excel data by:
a. Clicking on ‘DATA’ b. Going to ‘Survey’ c. Clicking on ‘From Microsoft Excel File…’

STEP 4: Reorganize the data
7. Select the data (from your computer) you plan to import and following the instructions
a. There are three main files/storages (‘containers’) the NVivo software would create:
i.‘Case’ storage: This contains characteristics associated with each tweet – each compartment contains information about each tweet. So if there are 92 tweets, there will be 92 compartments. Each compartment is called a ‘Case’.
ii. ‘Case classifications’: It contains variables/attributes associated with the
tweets that will not be coded. They are similar to demographic information of participants.
1. In NVivo, ‘attributes’ are the categorical variables and ‘values’ are groups under attributes.
a. Example

i. ‘Tweet Type’ (i.e. ‘Attribute’) ii. ‘Retweet’ (i.e. ‘value’)
iii. ‘Nodes’: They are containers that keep actual tweets which will be coded. In this case, one container was created called ‘Tweet’ which contains all the 92 tweets. To see the list of tweets in the container, you could double click the ‘Tweet’ node (1) and click on ‘Dataset’ (2) on the right-hand side of your screen.
STEP 5: Conduct data exploration (using ‘Query’ command)
8. Run a Query (requesting information – thus conducting an initial analysis)
i. Click on ‘Query’ tab and go to ‘Word Frequency’
1. Start by clicking on ‘Word Frequency’
2. On the ‘Word Frequency’ dialog box, adjust the ‘Finding matches’ –
from ‘Exact’ to ‘Similar’
3. Click on ‘Select items’
a. Go to ‘Nodes’ and click on it
b. Check the items you plan to analyze
4. Click on ‘Run’
1 2

5. Click on the ‘Word Cloud’ on the right-side bar
ii. Click on ‘Query’ tab and go to ‘Text Search’
1. Start by clicking on ‘Text Search’
2. On the ‘Text Search’ dialog box, type the word you plan to search (eg.
‘ashamed’)
3. On the dialog, adjust the ‘Finding matches’ – from ‘Exact’ to ‘Similar’
4. Click on ‘Select items’
a. Go to ‘Nodes’ and click on it
b. Check the items you plan to analyze
5. Click on ‘Run’

6. Click on the ‘Word Tree’ on the right-side bar
STEP 6: Start coding relevant information in the data
9. Under ‘Nodes’, create a folder a. Right-click on the ‘Nodes’ tab and select ‘New Folder’
b. Example: ‘Nodes about Mental Health Stigma’
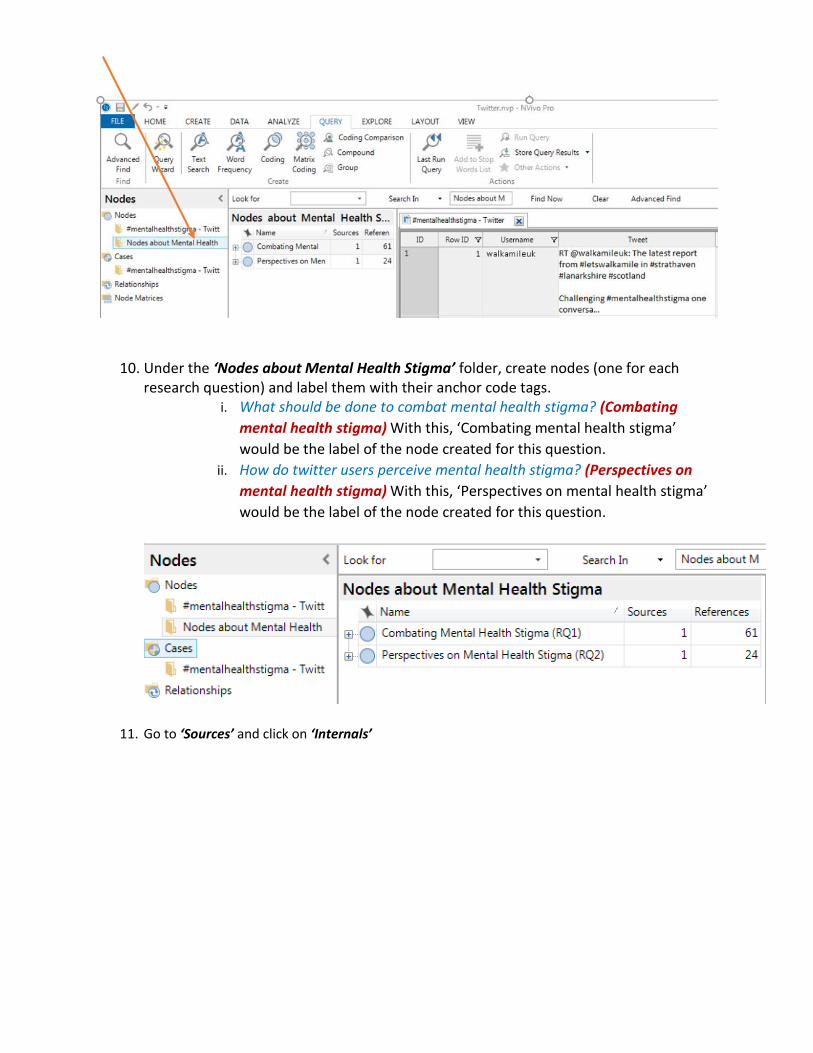
10. Under the ‘Nodes about Mental Health Stigma’ folder, create nodes (one for each research question) and label them with their anchor code tags.
i. What should be done to combat mental health stigma? (Combating
mental health stigma) With this, ‘Combating mental health stigma’
would be the label of the node created for this question.
ii. How do twitter users perceive mental health stigma? (Perspectives on
mental health stigma) With this, ‘Perspectives on mental health stigma’
would be the label of the node created for this question.
11. Go to ‘Sources’ and click on ‘Internals’
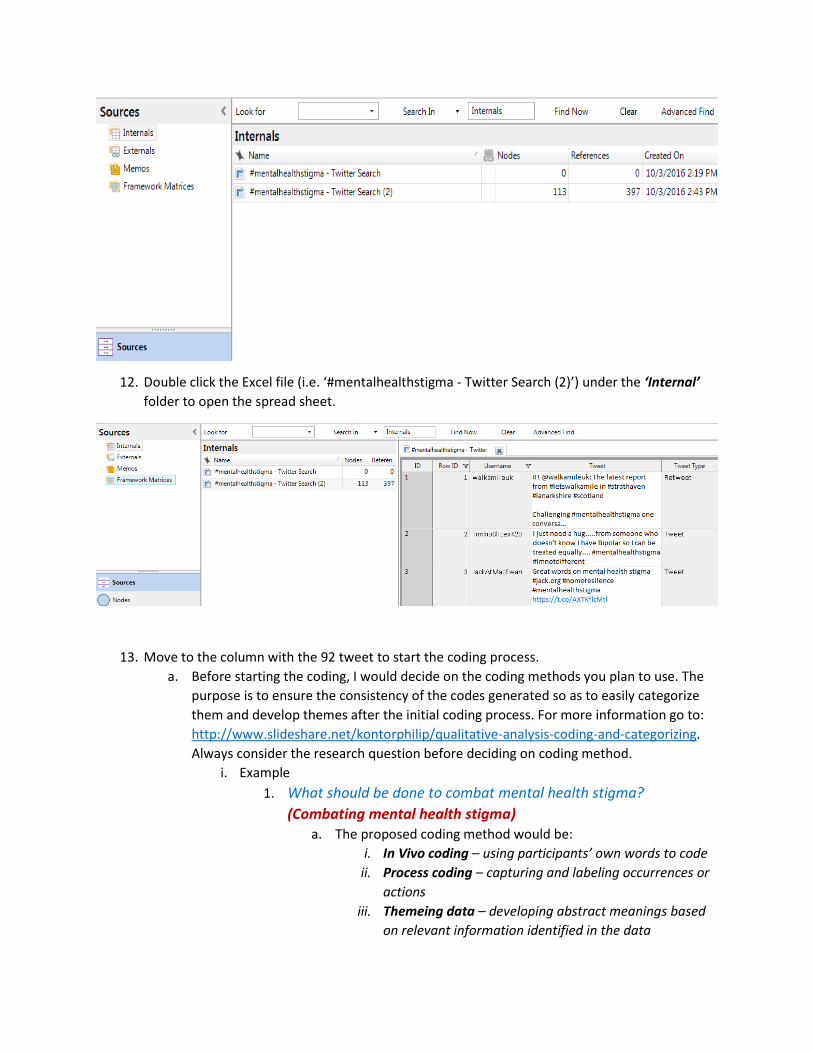
12. Double click the Excel file (i.e. ‘#mentalhealthstigma - Twitter Search (2)’) under the ‘Internal’
folder to open the spread sheet.
13. Move to the column with the 92 tweet to start the coding process.
a. Before starting the coding, I would decide on the coding methods you plan to use. The
purpose is to ensure the consistency of the codes generated so as to easily categorize
them and develop themes after the initial coding process. For more information go to:
http://www.slideshare.net/kontorphilip/qualitative-analysis-coding-and-categorizing.
Always consider the research question before deciding on coding method.
i. Example
1. What should be done to combat mental health stigma?
(Combating mental health stigma) a. The proposed coding method would be:
i. In Vivo coding – using participants’ own words to code
ii. Process coding – capturing and labeling occurrences or
actions
iii. Themeing data – developing abstract meanings based
on relevant information identified in the data
Source: Saldana, J. (2013). The coding manual for qualitative researchers.
London: Sage
14. Using the coding method and with the research questions in mind, code the data into their
respective anchor codes.
a. Select the relevant information
b. Right click the selected portion
c. Go to ‘Code’ to create a new node
d. To code it into an existing node, you just select and drop it into the respective node in
the left side of the screen.
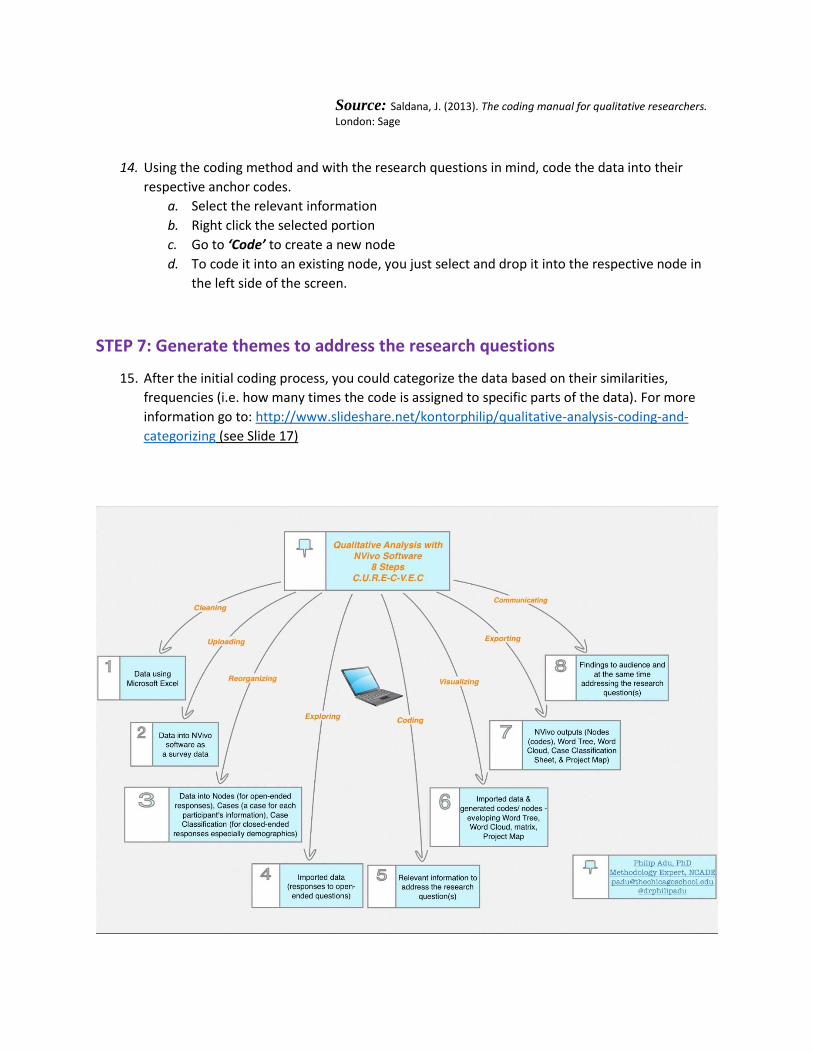
STEP 7: Generate themes to address the research questions
15. After the initial coding process, you could categorize the data based on their similarities,
frequencies (i.e. how many times the code is assigned to specific parts of the data). For more
information go to: http://www.slideshare.net/kontorphilip/qualitative-analysis-coding-and-
categorizing (see Slide 17)
Philip Adu, PhD The Chicago school of Professional Psychology Methodology Expert [email protected] Twitter: @drphilipadu To cite this document, copy the following:
Adu, P. (2016, October 22). Conducting Qualitative Analysis of Social Media (Twitter) Data
Using NVivo 11. Retrieved from http://www.slideshare.net/kontorphilip/conducting-qualitative-analysis-of-social-media-twitter-data-using-nvivo-11