Embed Size (px)
Citation preview
Logo grupo
Perfluorinated compounds in L’Albufera Natural Park
Yolanda Pico1, Matthias Onghena1, Marinella Farré2, Cristina Blasco1 and Damià Barceló2,3,4
1 Nutrition and Bromatology Laboratory, University of Valencia, Valencia, Spain.2 Department of Environmental Chemistry, IDAEA-CSIC, Barcelona, Spain3Catalan Institute for Water Research (ICRA), Girona, Spain4 King Saud University, Riyadh, Saudi Arabia
Analysis, fate and risks of organic contaminants in river basinsunder water scarcity
Valencia, 7-8 February 2011
Logo grupo
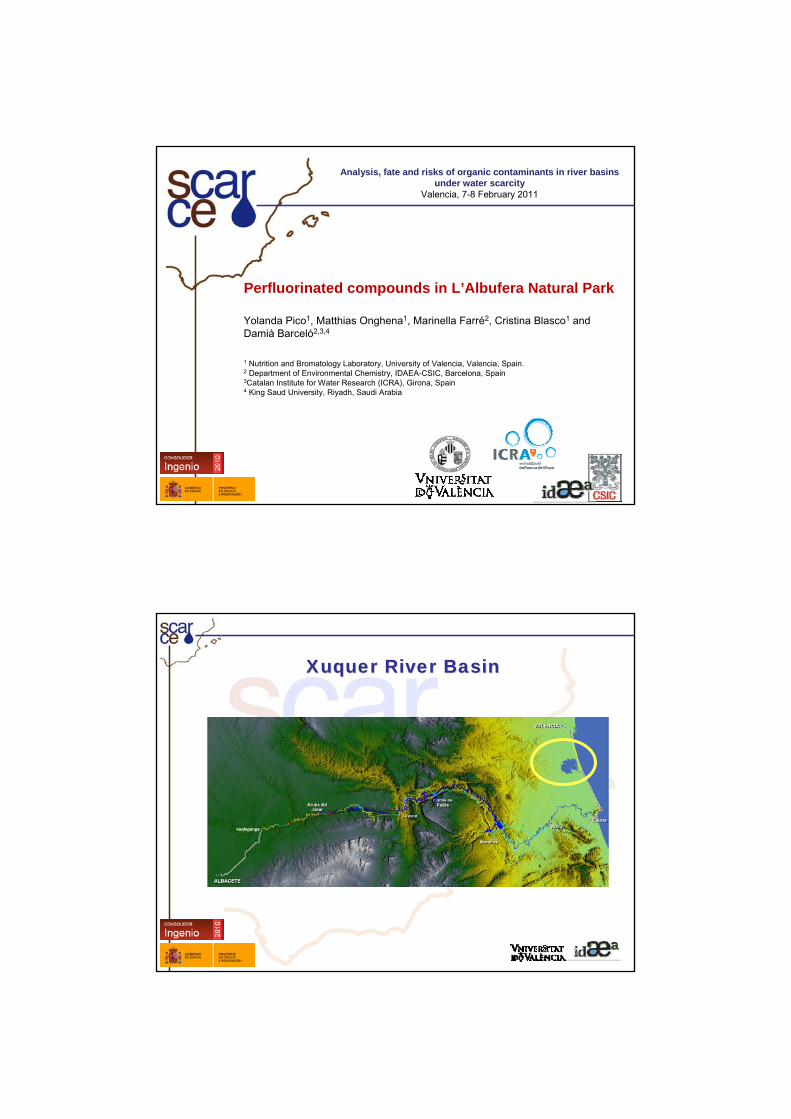
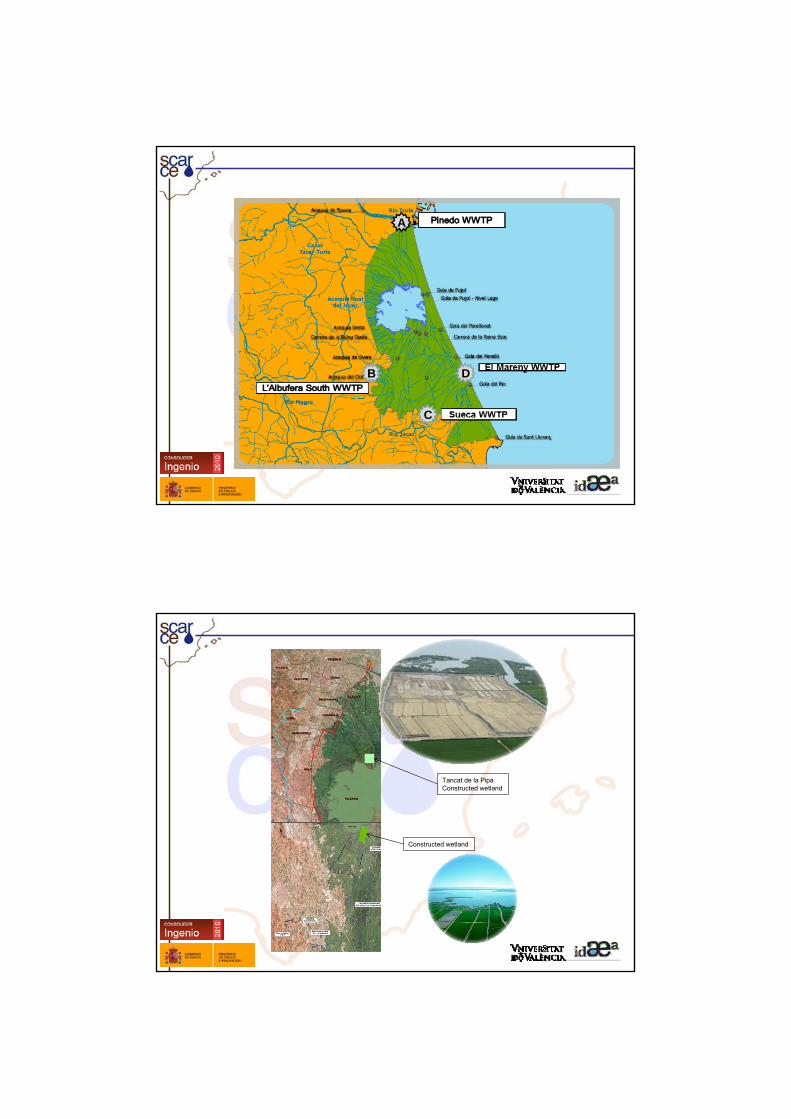
Xuquer River BasinXuquer River Basin
Logo grupo
Logo grupo
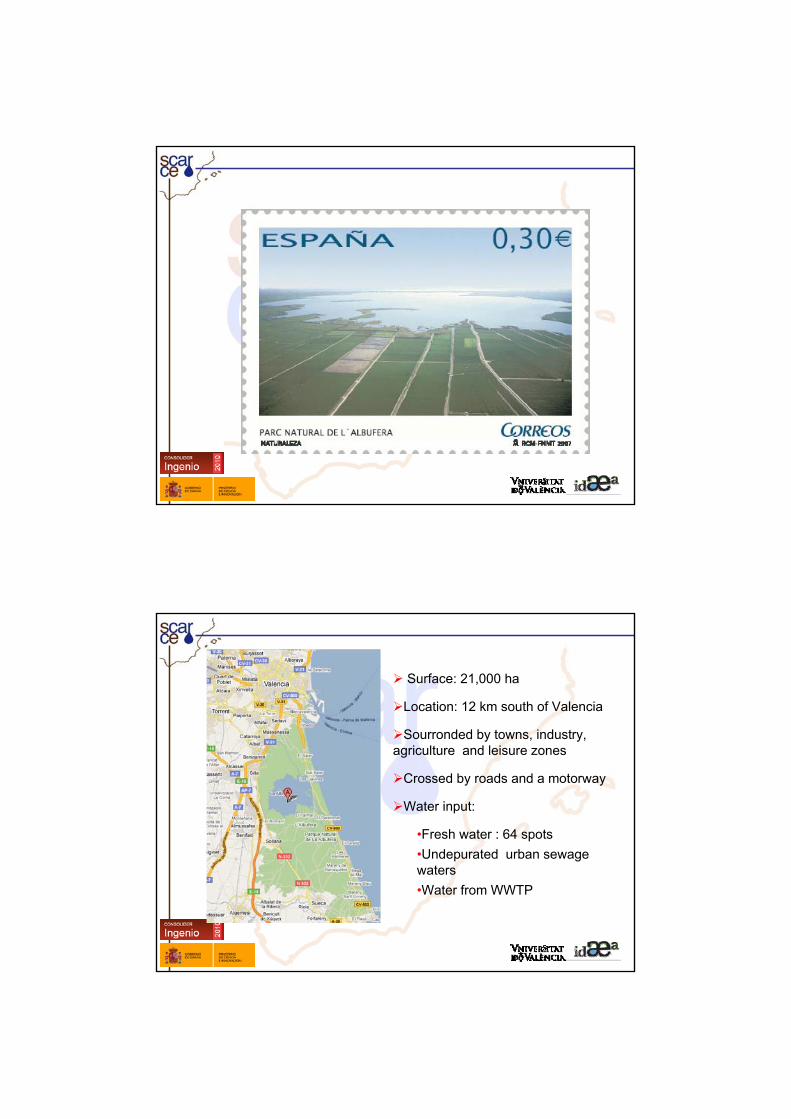
Surface: 21,000 ha
Location: 12 km south of Valencia
Sourronded by towns, industry, agriculture and leisure zones
Crossed by roads and a motorway
Water input:
•Fresh water : 64 spots•Undepurated urban sewage waters•Water from WWTP
Logo grupo
A
B
C
D
Logo grupo
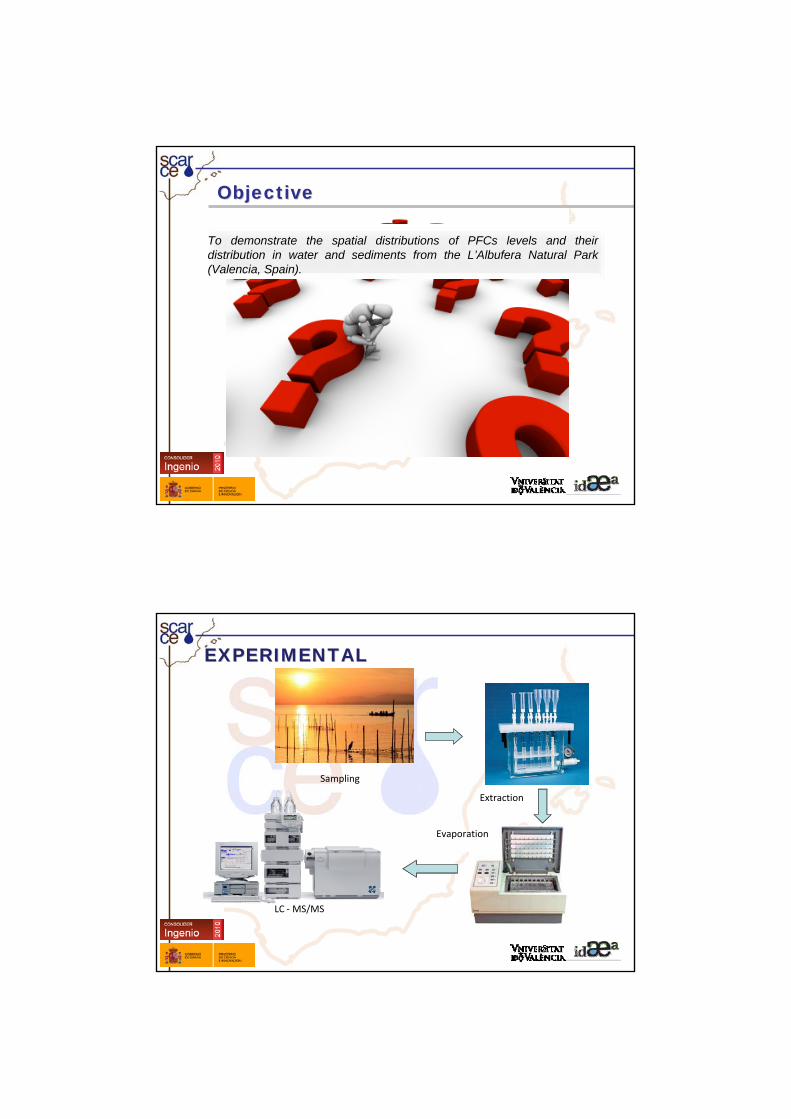
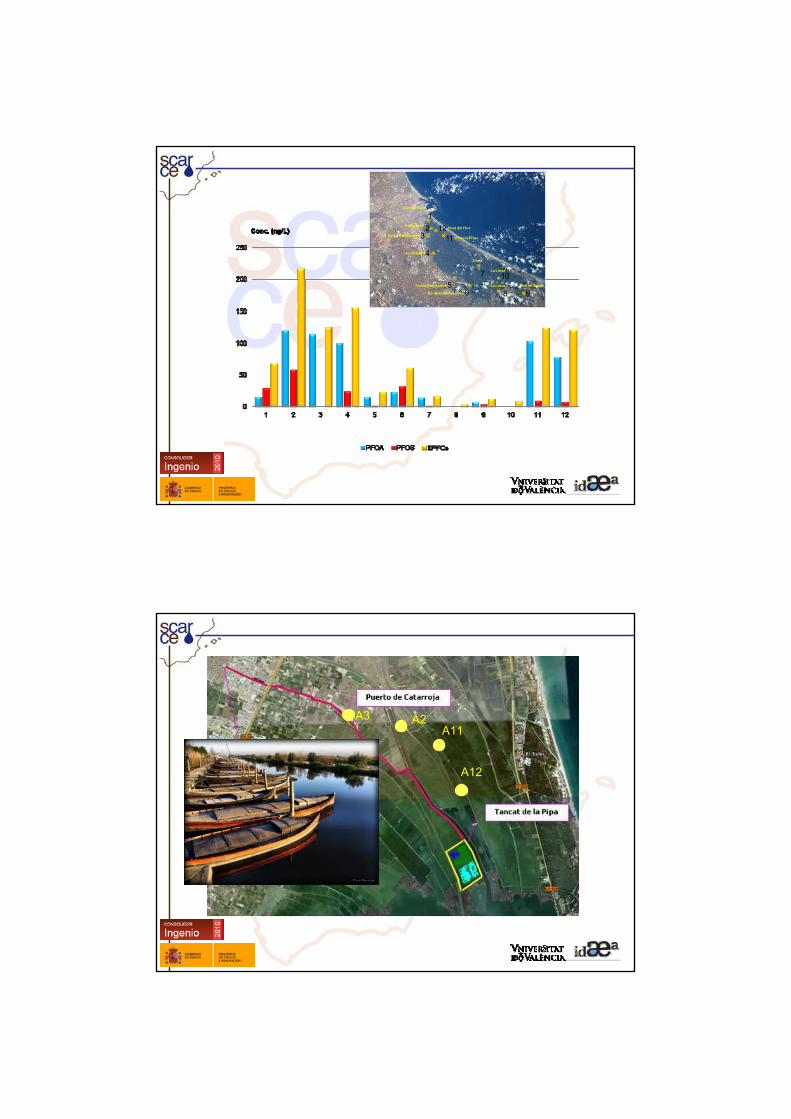
Tancat de la PipaConstructed wetland
Constructed wetland
Logo grupo
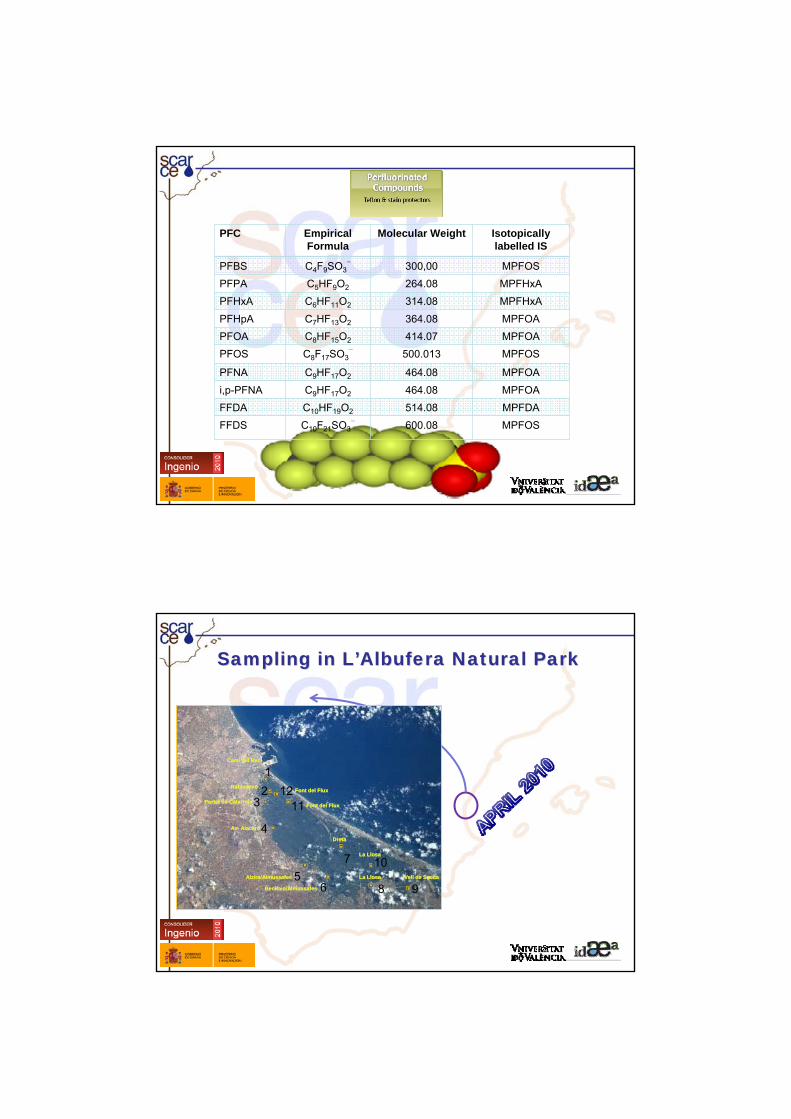
ObjectiveObjective
To demonstrate the spatial distributions of PFCs levels and their distribution in water and sediments from the L’Albufera Natural Park (Valencia, Spain).
Logo grupo
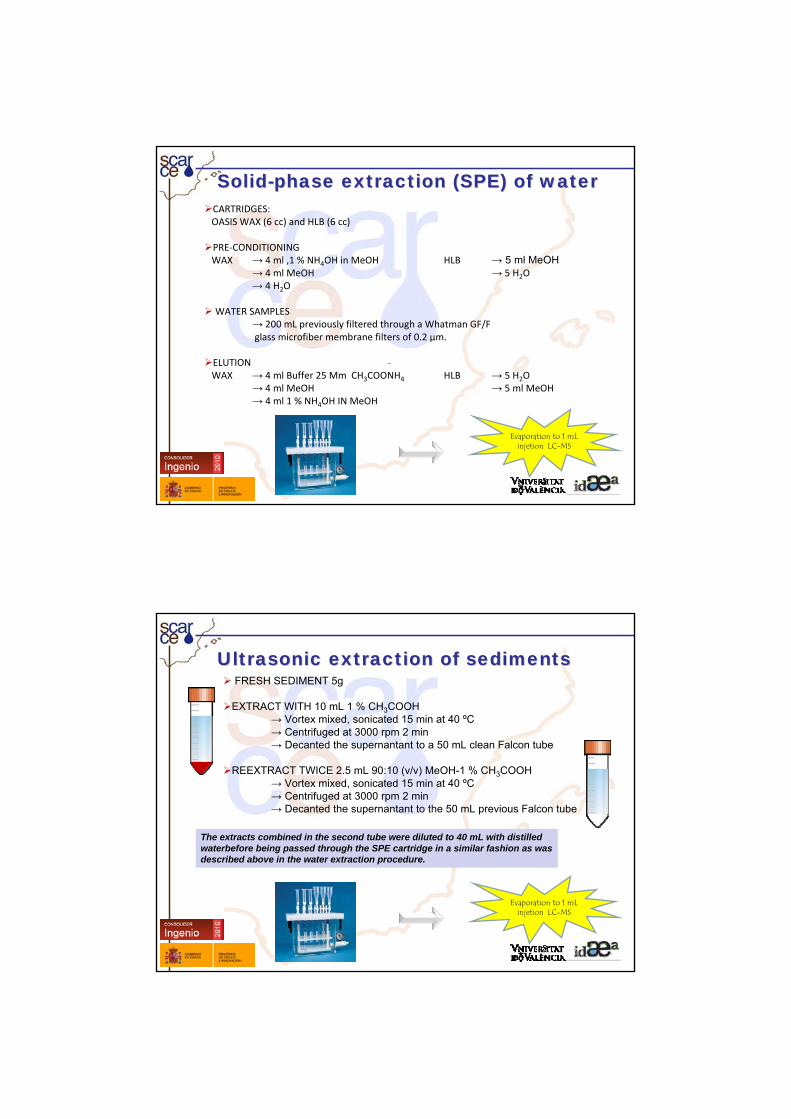
EXPERIMENTALEXPERIMENTAL
Extraction
LC ‐MS/MS
Sampling
Evaporation
Logo grupo
PFC Empirical Formula
Molecular Weight Isotopically labelled IS
PFBS C4F9SO3− 300,00 MPFOS
PFPA C5HF9O2 264.08 MPFHxAPFHxA C6HF11O2 314.08 MPFHxAPFHpA C7HF13O2 364.08 MPFOAPFOA C8HF15O2 414.07 MPFOAPFOS C8F17SO3
− 500.013 MPFOS
PFNA C9HF17O2 464.08 MPFOAi,p-PFNA C9HF17O2 464.08 MPFOAFFDA C10HF19O2 514.08 MPFDAFFDS C10F21SO3
− 600.08 MPFOS
Logo grupo
Sampling in LSampling in L’’Albufera Natural ParkAlbufera Natural Park
12
3
4
56
7
8 9
10
1112
CamCamíí del Recdel Rec
Portet de CatarrojaPortet de Catarroja
RabisanxoRabisanxoFont del FluxFont del Flux
Font del FluxFont del Flux
Av. AlacantAv. Alacant
Alzira/AlmussafesAlzira/Almussafes
Benifaio/AlmussafesBenifaio/Almussafes
DretaDreta
La LlosaLa Llosa Vell de SuecaVell de Sueca
La LlosaLa Llosa
Logo grupo
CARTRIDGES:OASIS WAX (6 cc) and HLB (6 cc)
PRE‐CONDITIONINGWAX → 4 ml ,1 % NH4OH in MeOH HLB → 5 ml MeOH
→ 4 ml MeOH → 5 H2O→ 4 H2O
WATER SAMPLES→ 200 mL previously filtered through a Whatman GF/Fglass microfiber membrane filters of 0.2 µm.
ELUTIONWAX → 4 ml Buffer 25 Mm CH3COONH4 HLB → 5 H2O
→ 4 ml MeOH → 5 ml MeOH→ 4 ml 1 % NH4OH IN MeOH
Evaporation to 1 mL injetion LC-MS
-
SolidSolid--phase extraction (SPE) of waterphase extraction (SPE) of water
Logo grupo
FRESH SEDIMENT 5g
EXTRACT WITH 10 mL 1 % CH3COOH→ Vortex mixed, sonicated 15 min at 40 ºC→ Centrifuged at 3000 rpm 2 min→ Decanted the supernantant to a 50 mL clean Falcon tube
REEXTRACT TWICE 2.5 mL 90:10 (v/v) MeOH-1 % CH3COOH→ Vortex mixed, sonicated 15 min at 40 ºC→ Centrifuged at 3000 rpm 2 min→ Decanted the supernantant to the 50 mL previous Falcon tube
Evaporation to 1 mL injetion LC-MS
4 -
Ultrasonic extraction of sedimentsUltrasonic extraction of sediments
The extracts combined in the second tube were diluted to 40 mL with distilled waterbefore being passed through the SPE cartridge in a similar fashion as was described above in the water extraction procedure.
Logo grupo
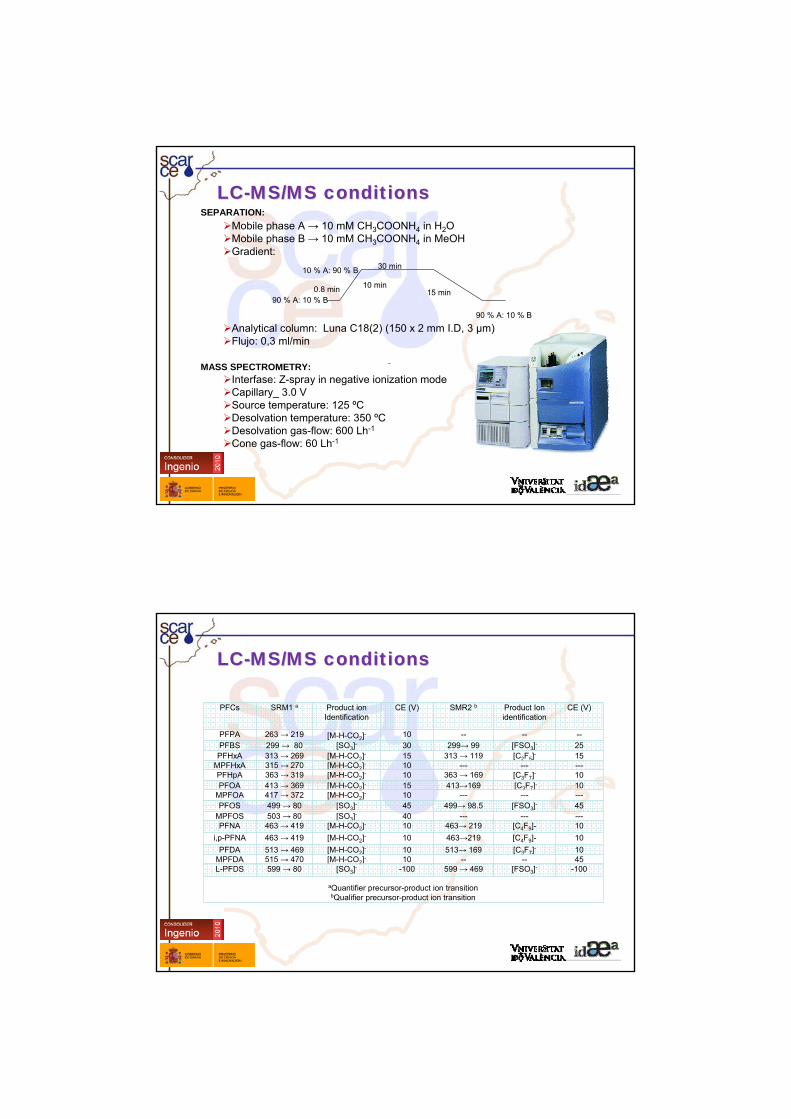
Mobile phase A → 10 mM CH3COONH4 in H2OMobile phase B → 10 mM CH3COONH4 in MeOHGradient:
Analytical column: Luna C18(2) (150 x 2 mm I.D, 3 µm)Flujo: 0,3 ml/min
Interfase: Z-spray in negative ionization modeCapillary_ 3.0 VSource temperature: 125 ºCDesolvation temperature: 350 ºCDesolvation gas-flow: 600 Lh-1
Cone gas-flow: 60 Lh-1
4 -
LCLC--MS/MS conditionsMS/MS conditions
90 % A: 10 % B0.8 min 10 min
10 % A: 90 % B 30 min
90 % A: 10 % B
15 min
SEPARATION:
MASS SPECTROMETRY:
Logo grupo
LCLC--MS/MS conditionsMS/MS conditions
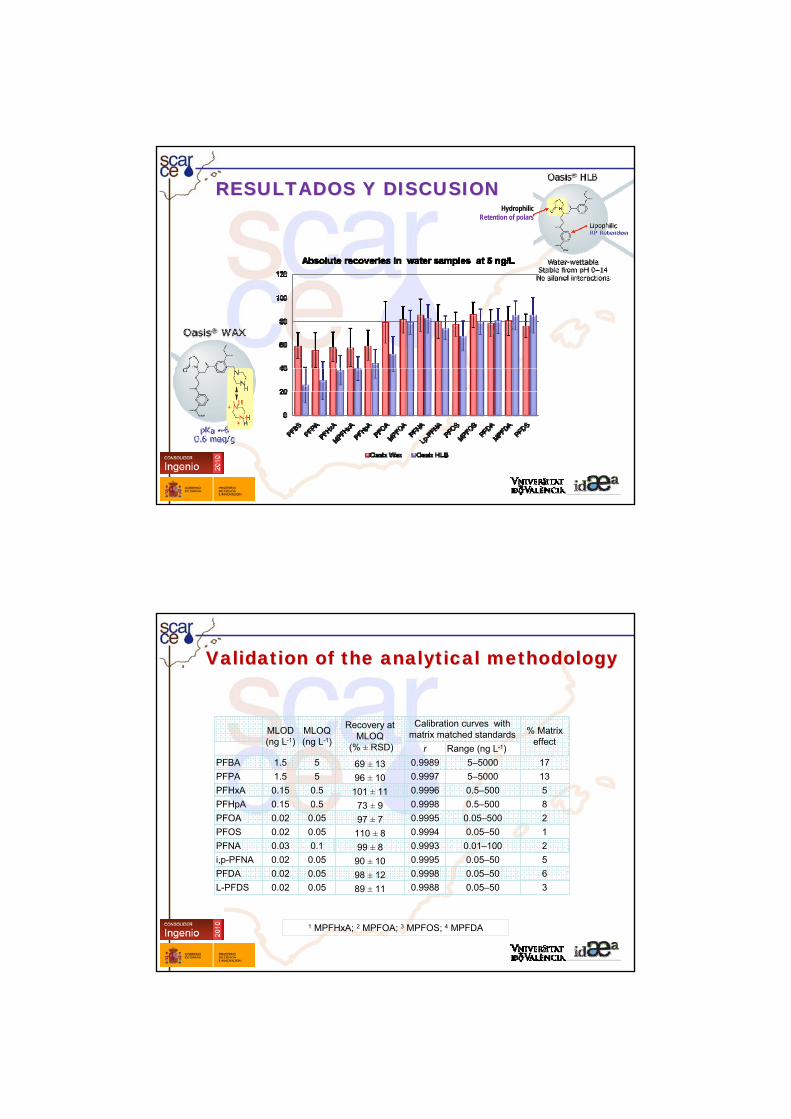
PFCs SRM1 a Product ion Identification
CE (V) SMR2 b Product Ion identification
CE (V)
PFPA 263 → 219 [M-H-CO2]- 10 -- -- --PFBS 299 → 80 [SO3]- 30 299→ 99 [FSO3]- 25PFHxA 313 → 269 [M-H-CO2]- 15 313 → 119 [C2F5]- 15
MPFHxA 315 → 270 [M-H-CO2]- 10 --- --- ---PFHpA 363 → 319 [M-H-CO2]- 10 363 → 169 [C3F7]- 10PFOA 413 → 369 [M-H-CO2]- 15 413→169 [C3F7]- 10
MPFOA 417 → 372 [M-H-CO2]- 10 --- --- ---PFOS 499 → 80 [SO3]- 45 499→ 98.5 [FSO3]- 45
MPFOS 503 → 80 [SO3]- 40 --- --- ---PFNA 463 → 419 [M-H-CO2]- 10 463→ 219 [C4F9]- 10
i,p-PFNA 463 → 419 [M-H-CO2]- 10 463→219 [C4F9]- 10PFDA 513 → 469 [M-H-CO2]- 10 513→ 169 [C3F7]- 10
MPFDA 515 → 470 [M-H-CO2]- 10 -- -- 45L-PFDS 599 → 80 [SO3]- -100 599 → 469 [FSO3]- -100
aQuantifier precursor-product ion transitionbQualifier precursor-product ion transition
Logo grupo15
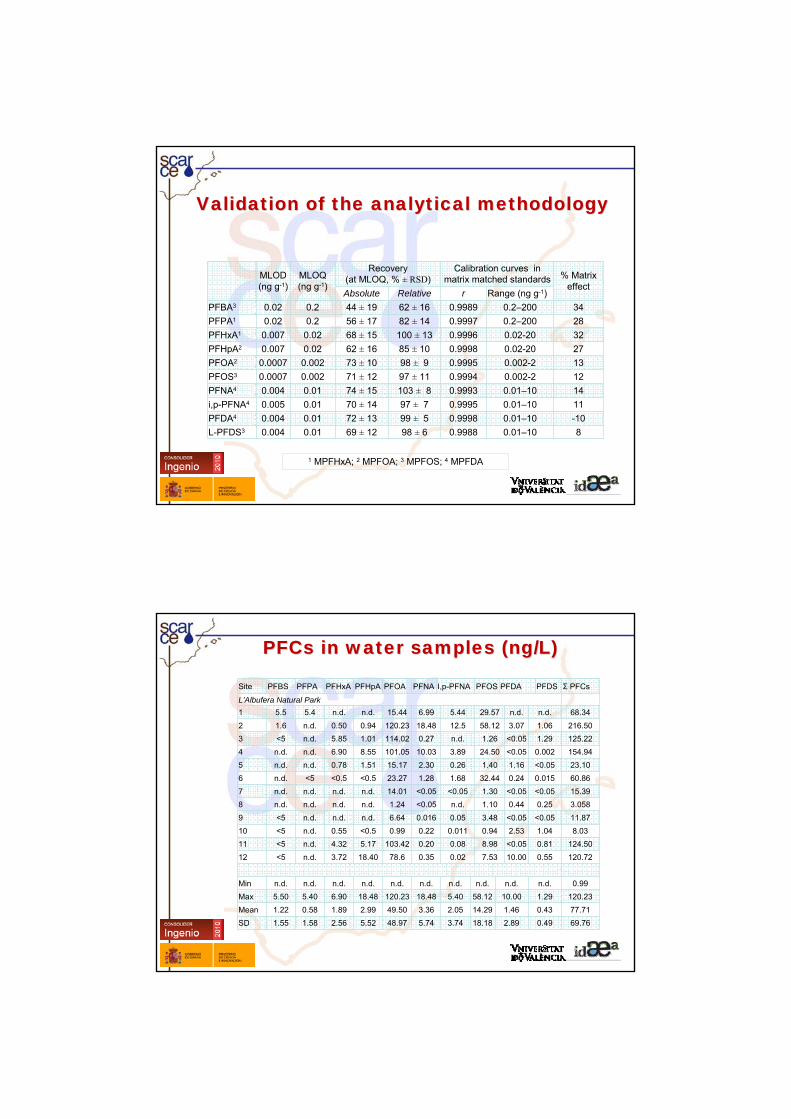
HydrophilicRetention of polars
RESULTADOS Y DISCUSIONRESULTADOS Y DISCUSION
Logo grupo
MLOD (ng L-1)
MLOQ (ng L-1)
Recovery at MLOQ
(% ± RSD)
Calibration curves with matrix matched standards % Matrix
effectr Range (ng L-1)
PFBA 1.5 5 69 ± 13 0.9989 5–5000 17PFPA 1.5 5 96 ± 10 0.9997 5–5000 13PFHxA 0.15 0.5 101 ± 11 0.9996 0.5–500 5PFHpA 0.15 0.5 73 ± 9 0.9998 0.5–500 8PFOA 0.02 0.05 97 ± 7 0.9995 0.05–500 2PFOS 0.02 0.05 110 ± 8 0.9994 0.05–50 1PFNA 0.03 0.1 99 ± 8 0.9993 0.01–100 2i,p-PFNA 0.02 0.05 90 ± 10 0.9995 0.05–50 5PFDA 0.02 0.05 98 ± 12 0.9998 0.05–50 6L-PFDS 0.02 0.05 89 ± 11 0.9988 0.05–50 3
a Validation of the analytical methodologyValidation of the analytical methodology
1 MPFHxA; 2 MPFOA; 3 MPFOS; 4 MPFDA
Logo grupo
MLOD (ng g-1)
MLOQ (ng g-1)
Recovery (at MLOQ, % ± RSD)
Calibration curves in matrix matched standards % Matrix
effectAbsolute Relative r Range (ng g-1)
PFBA3 0.02 0.2 44 ± 19 62 ± 16 0.9989 0.2–200 34PFPA1 0.02 0.2 56 ± 17 82 ± 14 0.9997 0.2–200 28PFHxA1 0.007 0.02 68 ± 15 100 ± 13 0.9996 0.02-20 32PFHpA2 0.007 0.02 62 ± 16 85 ± 10 0.9998 0.02-20 27PFOA2 0.0007 0.002 73 ± 10 98 ± 9 0.9995 0.002-2 13PFOS3 0.0007 0.002 71 ± 12 97 ± 11 0.9994 0.002-2 12PFNA4 0.004 0.01 74 ± 15 103 ± 8 0.9993 0.01–10 14i,p-PFNA4 0.005 0.01 70 ± 14 97 ± 7 0.9995 0.01–10 11PFDA4 0.004 0.01 72 ± 13 99 ± 5 0.9998 0.01–10 -10L-PFDS3 0.004 0.01 69 ± 12 98 ± 6 0.9988 0.01–10 8
17
Validation of the analytical methodologyValidation of the analytical methodology
1 MPFHxA; 2 MPFOA; 3 MPFOS; 4 MPFDA
Logo grupo
Site PFBS PFPA PFHxA PFHpA PFOA PFNA I,p-PFNA PFOS PFDA PFDS Σ PFCs
L’Albufera Natural Park1 5.5 5.4 n.d. n.d. 15.44 6.99 5.44 29.57 n.d. n.d. 68.342 1.6 n.d. 0.50 0.94 120.23 18.48 12.5 58.12 3.07 1.06 216.503 <5 n.d. 5.85 1.01 114.02 0.27 n.d. 1.26 <0.05 1.29 125.224 n.d. n.d. 6.90 8.55 101.05 10.03 3.89 24.50 <0.05 0.002 154.945 n.d. n.d. 0.78 1.51 15.17 2.30 0.26 1.40 1.16 <0.05 23.106 n.d. <5 <0.5 <0.5 23.27 1.28 1.68 32.44 0.24 0.015 60.867 n.d. n.d. n.d. n.d. 14.01 <0.05 <0.05 1.30 <0.05 <0.05 15.398 n.d. n.d. n.d. n.d. 1.24 <0.05 n.d. 1.10 0.44 0.25 3.0589 <5 n.d. n.d. n.d. 6.64 0.016 0.05 3.48 <0.05 <0.05 11.8710 <5 n.d. 0.55 <0.5 0.99 0.22 0.011 0.94 2.53 1.04 8.0311 <5 n.d. 4.32 5.17 103.42 0.20 0.08 8.98 <0.05 0.81 124.5012 <5 n.d. 3.72 18.40 78.6 0.35 0.02 7.53 10.00 0.55 120.72
Min n.d. n.d. n.d. n.d. n.d. n.d. n.d. n.d. n.d. n.d. 0.99Max 5.50 5.40 6.90 18.48 120.23 18.48 5.40 58.12 10.00 1.29 120.23Mean 1.22 0.58 1.89 2.99 49.50 3.36 2.05 14.29 1.46 0.43 77.71SD 1.55 1.58 2.56 5.52 48.97 5.74 3.74 18.18 2.89 0.49 69.76
PFCs in water samples (ng/L)PFCs in water samples (ng/L)
Logo grupo
12
3
4
56
7
8 9
10
1112
Camí del Rec
Portet de catarroja
Rabisanxo Font del Flux
Font del Flux
Av. Alacant
Alzira/Almussafes
Benifaio/Almussafes
Dreta
La Llosa Vell de Sueca
La Llosa
Logo grupo
A12
A11A2A3
Logo grupo
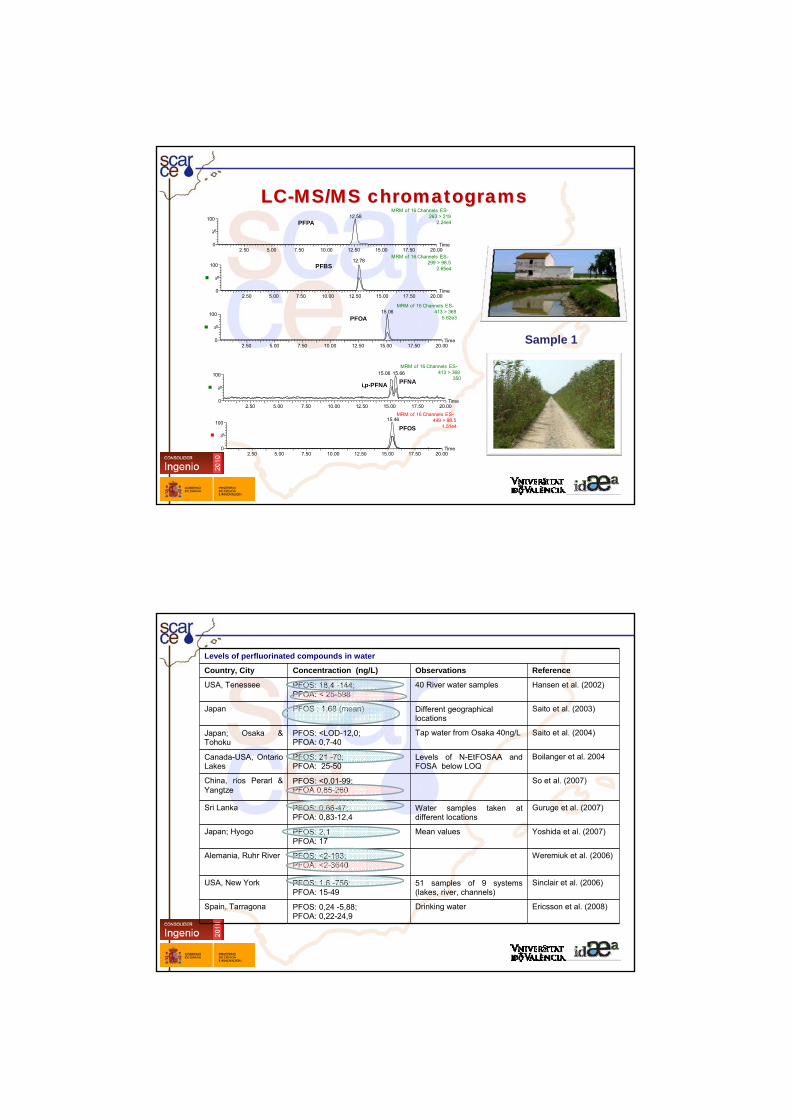
LCLC--MS/MS chromatogramsMS/MS chromatograms
21
Time2.50 5.00 7.50 10.00 12.50 15.00 17.50 20.00
%
0
100
MRM of 16 Channels ES-299 > 98.5
2.65e412.78
Time2.50 5.00 7.50 10.00 12.50 15.00 17.50 20.00
%
0
100
MRM of 16 Channels ES-263 > 219
2.24e412.58
Time2.50 5.00 7.50 10.00 12.50 15.00 17.50 20.00
%
0
100
MRM of 16 Channels ES-413 > 369
5.62e3
Time2.50 5.00 7.50 10.00 12.50 15.00 17.50 20.00
%
0
100
MRM of 16 Channels ES-413 > 369
35015.06 15.66
Time2.50 5.00 7.50 10.00 12.50 15.00 17.50 20.00
%
0
100
MRM of 16 Channels ES-499 > 98.5
1.51e415.46
15.06
PFPA
PFBS
PFOA
i,p-PFNA PFNA
PFOS
Sample 1
Logo grupo
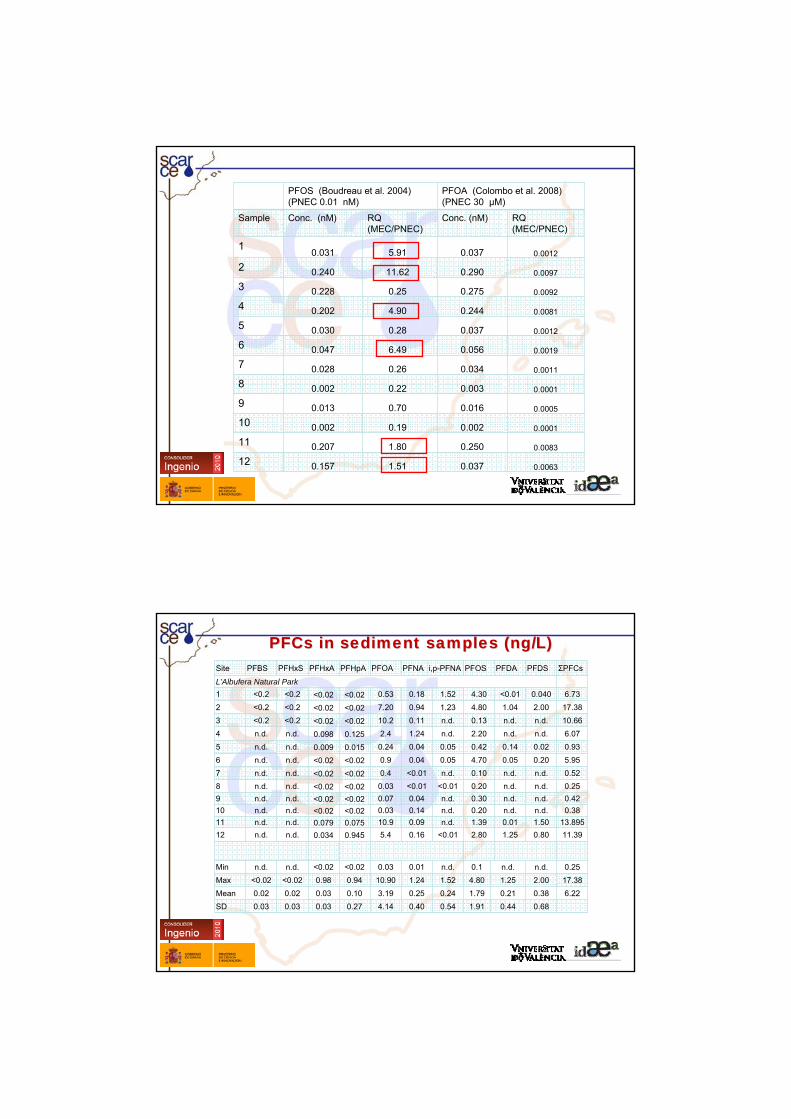
Levels of perfluorinated compounds in water
Country, City Concentraction (ng/L) Observations Reference
USA, Tenessee PFOS: 18,4 -144; PFOA: < 25-598
40 River water samples Hansen et al. (2002)
Japan PFOS : 1,68 (mean) Different geographical locations
Saito et al. (2003)
Japan; Osaka & Tohoku
PFOS: <LOD-12,0; PFOA: 0,7-40
Tap water from Osaka 40ng/L Saito et al. (2004)
Canada-USA, Ontario Lakes
PFOS: 21 -70; PFOA: 25-50
Levels of N-EtFOSAA and FOSA below LOQ
Boilanger et al. 2004
China, ríos Perarl & Yangtze
PFOS: <0,01-99; PFOA 0,85-260
So et al. (2007)
Sri Lanka PFOS: 0,66-47; PFOA: 0,83-12,4
Water samples taken at different locations
Guruge et al. (2007)
Japan; Hyogo PFOS: 2,1 PFOA: 17
Mean values Yoshida et al. (2007)
Alemania, Ruhr River PFOS: <2-193; PFOA: <2-3640
Weremiuk et al. (2006)
USA, New York PFOS: 1,6 -756; PFOA: 15-49
51 samples of 9 systems (lakes, river, channels)
Sinclair et al. (2006)
Spain, Tarragona PFOS: 0,24 -5,88; PFOA: 0,22-24,9
Drinking water Ericsson et al. (2008)
22
Logo grupo23
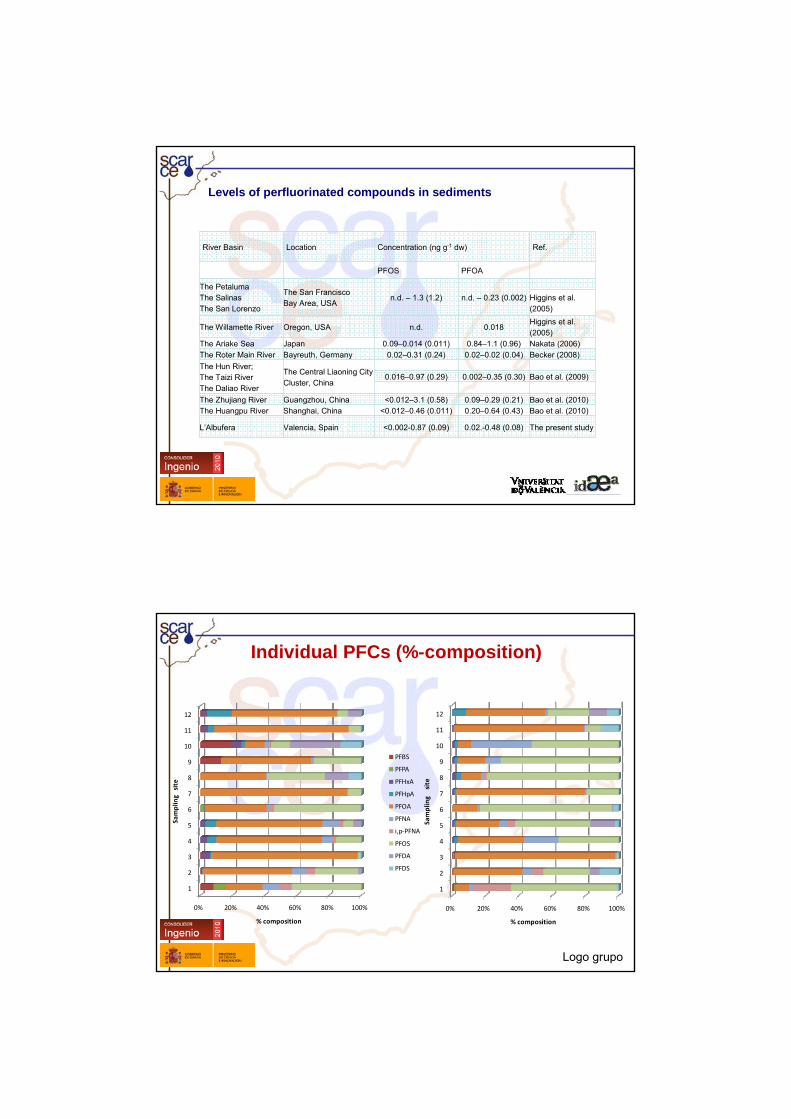
PFOS (Boudreau et al. 2004)(PNEC 0.01 nM)
PFOA (Colombo et al. 2008)(PNEC 30 µM)
Sample Conc. (nM) RQ (MEC/PNEC)
Conc. (nM) RQ (MEC/PNEC)
1 0.031 5.91 0.037 0.0012
2 0.240 11.62 0.290 0.0097
3 0.228 0.25 0.275 0.0092
4 0.202 4.90 0.244 0.0081
5 0.030 0.28 0.037 0.0012
6 0.047 6.49 0.056 0.0019
7 0.028 0.26 0.034 0.0011
8 0.002 0.22 0.003 0.0001
9 0.013 0.70 0.016 0.0005
10 0.002 0.19 0.002 0.0001
11 0.207 1.80 0.250 0.0083
12 0.157 1.51 0.037 0.0063
Logo grupo
PFCs in sediment samples (ng/L)PFCs in sediment samples (ng/L)Site PFBS PFHxS PFHxA PFHpA PFOA PFNA i,p-PFNA PFOS PFDA PFDS ΣPFCs
L’Albufera Natural Park1 <0.2 <0.2 <0.02 <0.02 0.53 0.18 1.52 4.30 <0.01 0.040 6.732 <0.2 <0.2 <0.02 <0.02 7.20 0.94 1.23 4.80 1.04 2.00 17.383 <0.2 <0.2 <0.02 <0.02 10.2 0.11 n.d. 0.13 n.d. n.d. 10.664 n.d. n.d. 0.098 0.125 2.4 1.24 n.d. 2.20 n.d. n.d. 6.075 n.d. n.d. 0.009 0.015 0.24 0.04 0.05 0.42 0.14 0.02 0.936 n.d. n.d. <0.02 <0.02 0.9 0.04 0.05 4.70 0.05 0.20 5.957 n.d. n.d. <0.02 <0.02 0.4 <0.01 n.d. 0.10 n.d. n.d. 0.528 n.d. n.d. <0.02 <0.02 0.03 <0.01 <0.01 0.20 n.d. n.d. 0.259 n.d. n.d. <0.02 <0.02 0.07 0.04 n.d. 0.30 n.d. n.d. 0.4210 n.d. n.d. <0.02 <0.02 0.03 0.14 n.d. 0.20 n.d. n.d. 0.3811 n.d. n.d. 0.079 0.075 10.9 0.09 n.d. 1.39 0.01 1.50 13.89512 n.d. n.d. 0.034 0.945 5.4 0.16 <0.01 2.80 1.25 0.80 11.39
Min n.d. n.d. <0.02 <0.02 0.03 0.01 n.d. 0.1 n.d. n.d. 0.25Max <0.02 <0.02 0.98 0.94 10.90 1.24 1.52 4.80 1.25 2.00 17.38Mean 0.02 0.02 0.03 0.10 3.19 0.25 0.24 1.79 0.21 0.38 6.22SD 0.03 0.03 0.03 0.27 4.14 0.40 0.54 1.91 0.44 0.68
Logo grupo
River Basin Location Concentration (ng g-1 dw) Ref.
PFOS PFOA
The Petaluma The Salinas The San Lorenzo
The San FranciscoBay Area, USA
n.d. – 1.3 (1.2) n.d. – 0.23 (0.002) Higgins et al. (2005)
The Willamette River Oregon, USA n.d. 0.018Higgins et al. (2005)
The Ariake Sea Japan 0.09–0.014 (0.011) 0.84–1.1 (0.96) Nakata (2006)The Roter Main River Bayreuth, Germany 0.02–0.31 (0.24) 0.02–0.02 (0.04) Becker (2008)The Hun River;The Taizi RiverThe Daliao River
The Central Liaoning City Cluster, China
0.016–0.97 (0.29) 0.002–0.35 (0.30) Bao et al. (2009)
The Zhujiang River Guangzhou, China <0.012–3.1 (0.58) 0.09–0.29 (0.21) Bao et al. (2010)The Huangpu River Shanghai, China <0.012–0.46 (0.011) 0.20–0.64 (0.43) Bao et al. (2010)
L’Albufera Valencia, Spain <0.002-0.87 (0.09) 0.02.-0.48 (0.08) The present study
Levels of perfluorinated compounds in sediments
Logo grupo
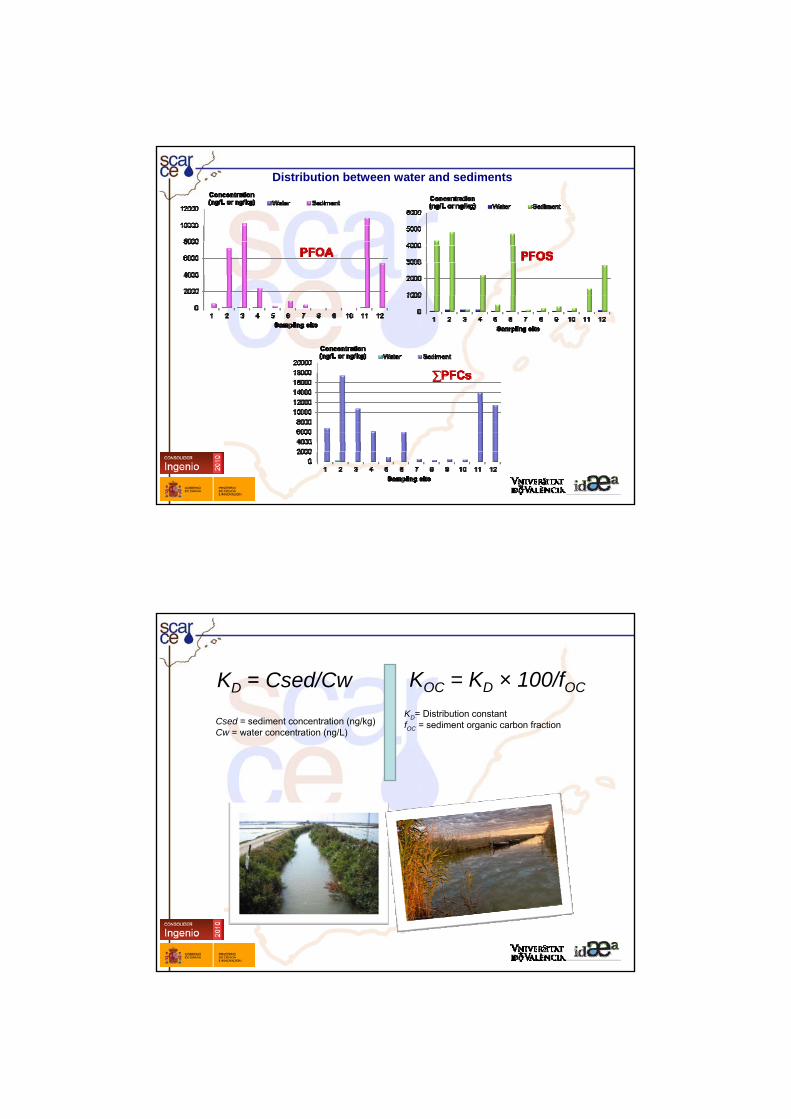
Individual PFCs (%-composition)
0% 20% 40% 60% 80% 100%
1
2
3
4
5
6
7
8
9
10
11
12
% composition
Sampling site
PFBS
PFPA
PFHxA
PFHpA
PFOA
PFNA
i,p‐PFNA
PFOS
PFDA
PFDS
0% 20% 40% 60% 80% 100%
1
2
3
4
5
6
7
8
9
10
11
12
% composition
Sampling site
Logo grupo
Distribution between water and sediments
Logo grupo
Csed = sediment concentration (ng/kg) Cw = water concentration (ng/L)
KD = Csed/Cw KOC = KD × 100/fOC
KD= Distribution constant fOC = sediment organic carbon fraction
Logo grupo
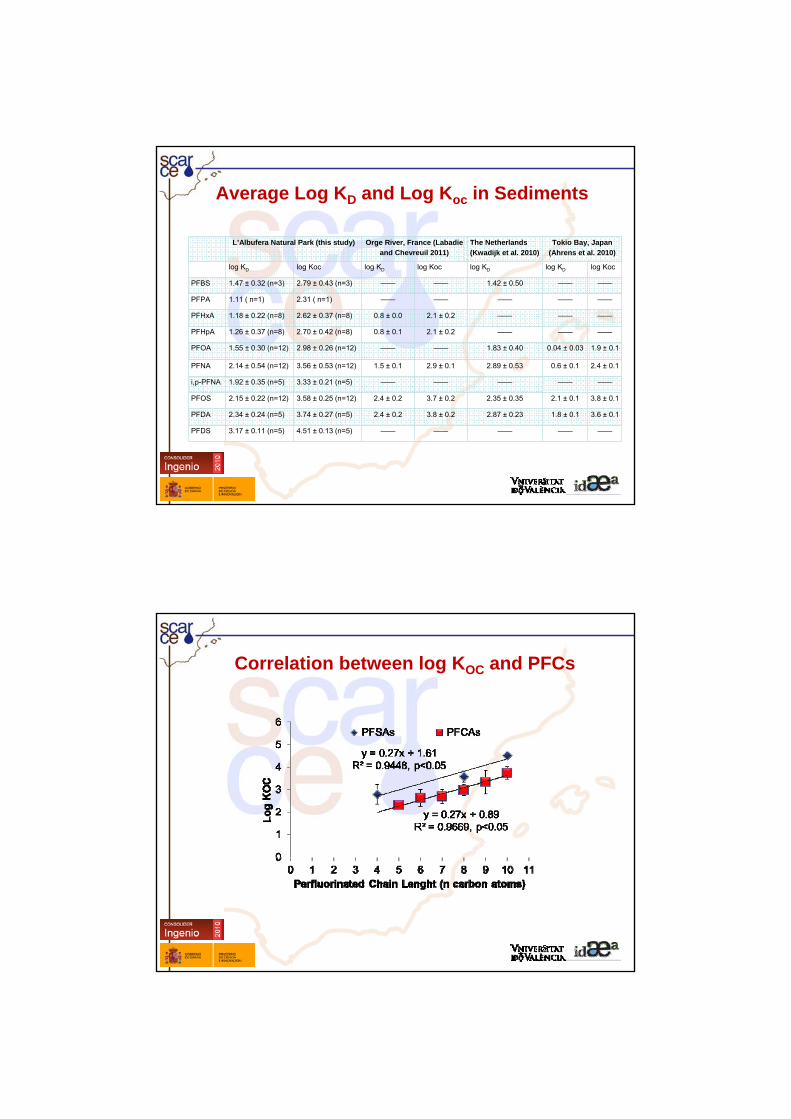
L’Albufera Natural Park (this study) Orge River, France (Labadie and Chevreuil 2011)
The Netherlands(Kwadijk et al. 2010)
Tokio Bay, Japan(Ahrens et al. 2010)
log KD log Koc log KD log Koc log KD log KD log Koc
PFBS 1.47 ± 0.32 (n=3) 2.79 ± 0.43 (n=3) —— —— 1.42 ± 0.50 —— ——
PFPA 1.11 ( n=1) 2.31 ( n=1) —— —— —— —— ——
PFHxA 1.18 ± 0.22 (n=8) 2.62 ± 0.37 (n=8) 0.8 ± 0.0 2.1 ± 0.2 —— —— ——
PFHpA 1.26 ± 0.37 (n=8) 2.70 ± 0.42 (n=8) 0.8 ± 0.1 2.1 ± 0.2 —— —— ——
PFOA 1.55 ± 0.30 (n=12) 2.98 ± 0.26 (n=12) —— —— 1.83 ± 0.40 0.04 ± 0.03 1.9 ± 0.1
PFNA 2.14 ± 0.54 (n=12) 3.56 ± 0.53 (n=12) 1.5 ± 0.1 2.9 ± 0.1 2.89 ± 0.53 0.6 ± 0.1 2.4 ± 0.1
i,p-PFNA 1.92 ± 0.35 (n=5) 3.33 ± 0.21 (n=5) —— —— —— —— ——
PFOS 2.15 ± 0.22 (n=12) 3.58 ± 0.25 (n=12) 2.4 ± 0.2 3.7 ± 0.2 2.35 ± 0.35 2.1 ± 0.1 3.8 ± 0.1
PFDA 2.34 ± 0.24 (n=5) 3.74 ± 0.27 (n=5) 2.4 ± 0.2 3.8 ± 0.2 2.87 ± 0.23 1.8 ± 0.1 3.6 ± 0.1
PFDS 3.17 ± 0.11 (n=5) 4.51 ± 0.13 (n=5) —— —— —— —— ——
Average Log KD and Log Koc in Sediments
Logo grupo
Correlation between log KOC and PFCs
Logo grupo31
CONCLUSIONSCONCLUSIONS
Concentrations of PFCs in the Jucar River Basin of Spain were similar as those reported in other European, American and Asian countries.
Among 12 target PFCs measured, PFOA and PFOS were consistently found at the greatest concentrations throughout the environmental media.
Occurrence and spatial distribution of detected PFCs in water and sediment between upstream and downstream indicated the input from existing PFCs sources in Spain,
Concentrations of PFOS or PFOA found at some locations were sufficient to potentially cause adverse effects to some wildlife, thus monitoring effort of such PFCs should be of great attention in Spain.
Logo grupo
AcknowledgementAcknowledgement
32
“Assessing and predicting effects on water quantity andquality in Iberian rivers caused by global change”
Consolider-Ingenio 2010 (CSD2009-00065)
http://www.idaea.csic.es/scarceconsolider
Logo grupo33
Thank You for Your Attention
Logo grupo
Any Question?
34