Embed Size (px)
Citation preview

welcome you to our webcast: Destination Brazil: Evaluating and Sourcing the Hottest M&A Deals
and
Introduction
Moderator:
Suzanne Miller Senior Writer The Deal LLC
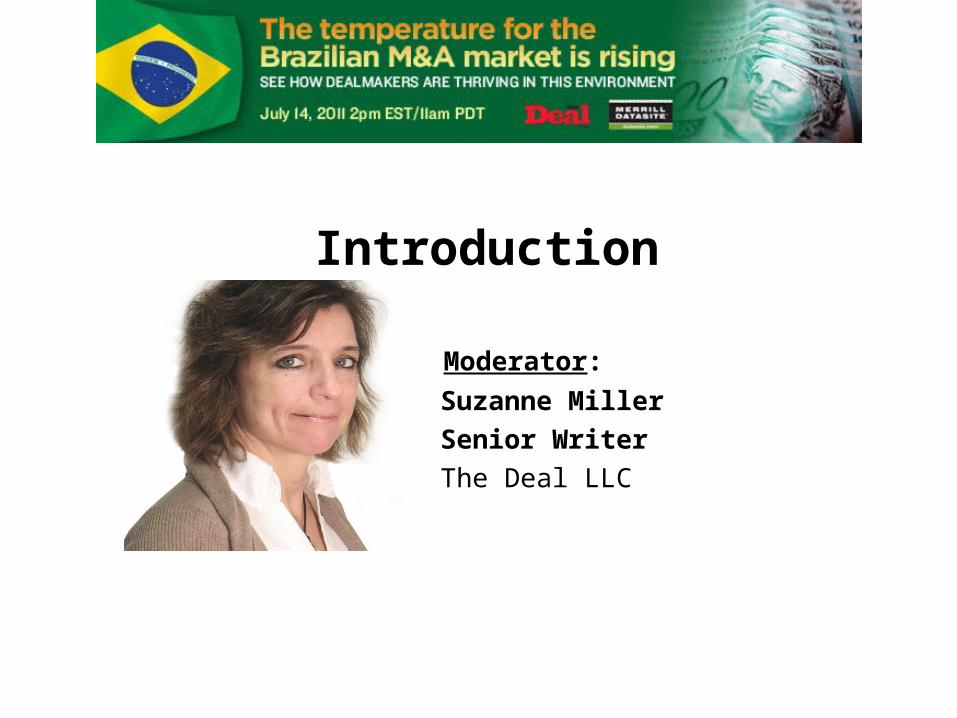
REMINDER:
The audience is in listen-only mode
Please e-mail questions via the Q&A panel box
Select questions will be answered during the last 10 minutes of the
program
Please answer poll questions
Webex customer support at 866-229-3239
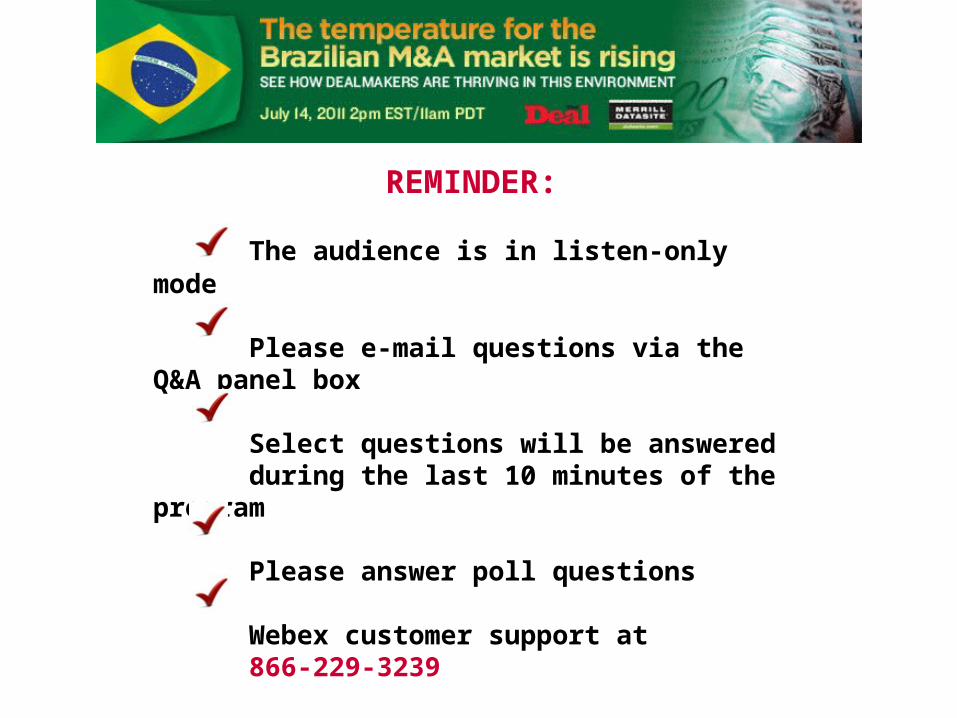
Marcelo Di LorenzoPartner, Managing Director and
Head of Brazil3i Group plc
EXPERT PANEL
Karyn KoiffmanPartner
Kirkland & Ellis LLP
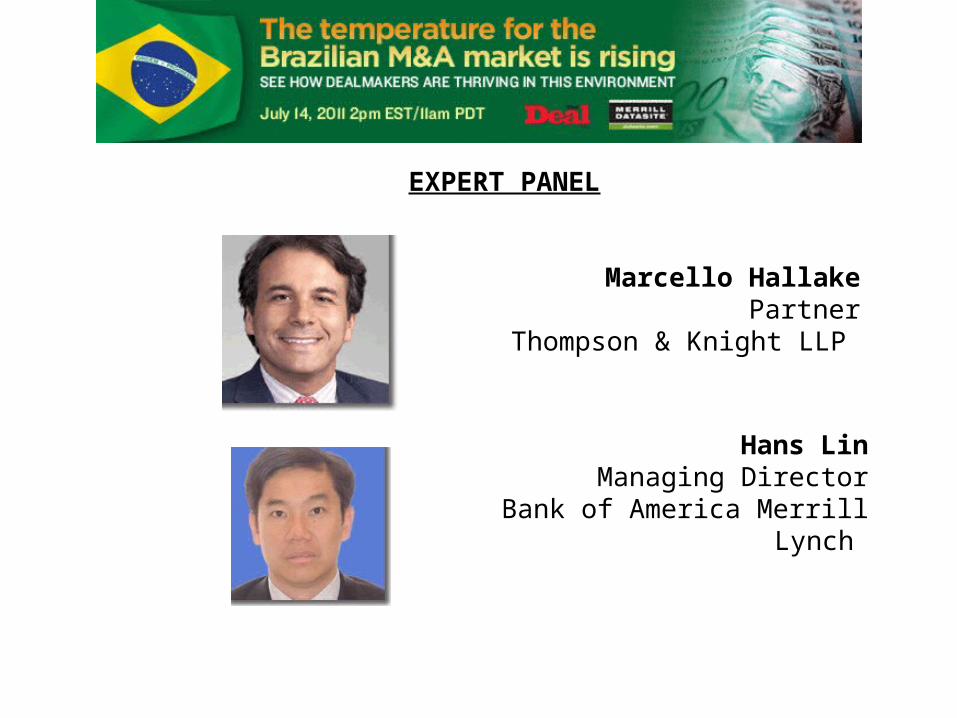
Marcello HallakePartner
Thompson & Knight LLP
EXPERT PANEL
Hans LinManaging Director
Bank of America Merrill Lynch
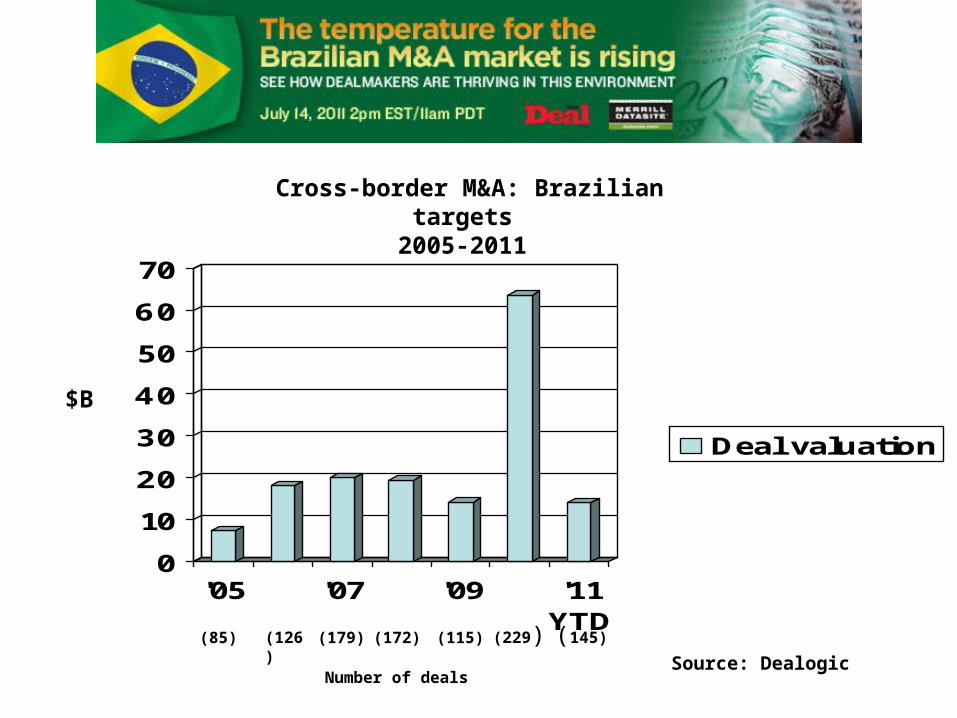
Source: Dealogic
Cross-border M&A: Brazilian targets
2005-2011
0
10
20
30
40
50
60
70
'05 '07 '09 '11YTD
Deal valuation
(85) (126)
(179) (172) (115) (229) (145)
Number of deals
$B
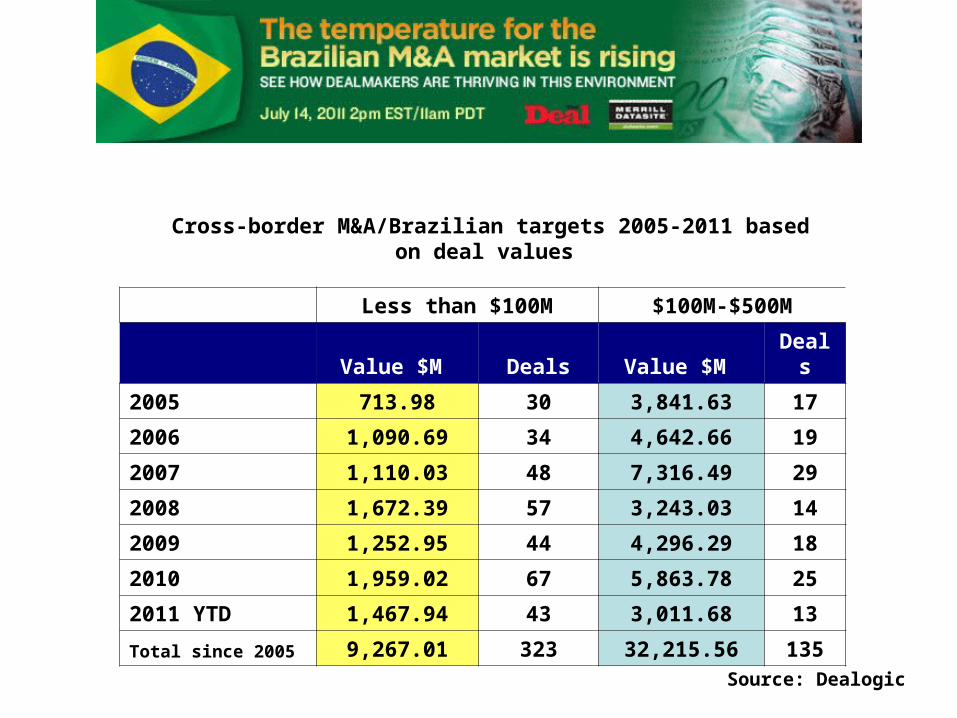
Cross-border M&A/Brazilian targets 2005-2011 based on deal values
Less than $100M $100M-$500M
Value $M Deals Value $M Deal
s
2005 713.98 30 3,841.63 17
2006 1,090.69 34 4,642.66 19
2007 1,110.03 48 7,316.49 29
2008 1,672.39 57 3,243.03 14
2009 1,252.95 44 4,296.29 18
2010 1,959.02 67 5,863.78 25
2011 YTD 1,467.94 43 3,011.68 13
Total since 2005 9,267.01 323 32,215.56 135Source: Dealogic
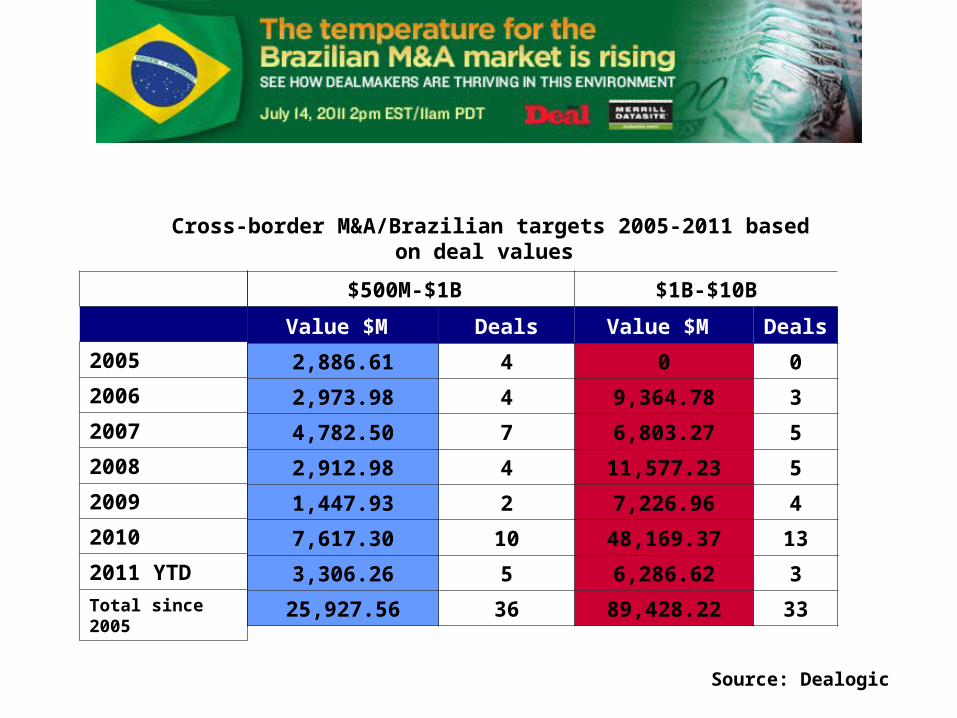
Cross-border M&A/Brazilian targets 2005-2011 based on deal values
Source: Dealogic
$500M-$1B $1B-$10B
Value $M Deals Value $M Deal
s
2,886.61 4 0 0
2,973.98 4 9,364.78 3
4,782.50 7 6,803.27 5
2,912.98 4 11,577.23 5
1,447.93 2 7,226.96 4
7,617.30 10 48,169.37 13
3,306.26 5 6,286.62 3
25,927.56 36 89,428.22 33
2005
2006
2007
2008
2009
2010
2011 YTD
Total since 2005
AUDIENCE POLL QUESTION
How many deals does your firm expect to conduct in Brazil over
the next 12 months?
A. 1-2B. 3-4C. 5 or moreD. None
Keys to sourcing and finding deals in Brazil
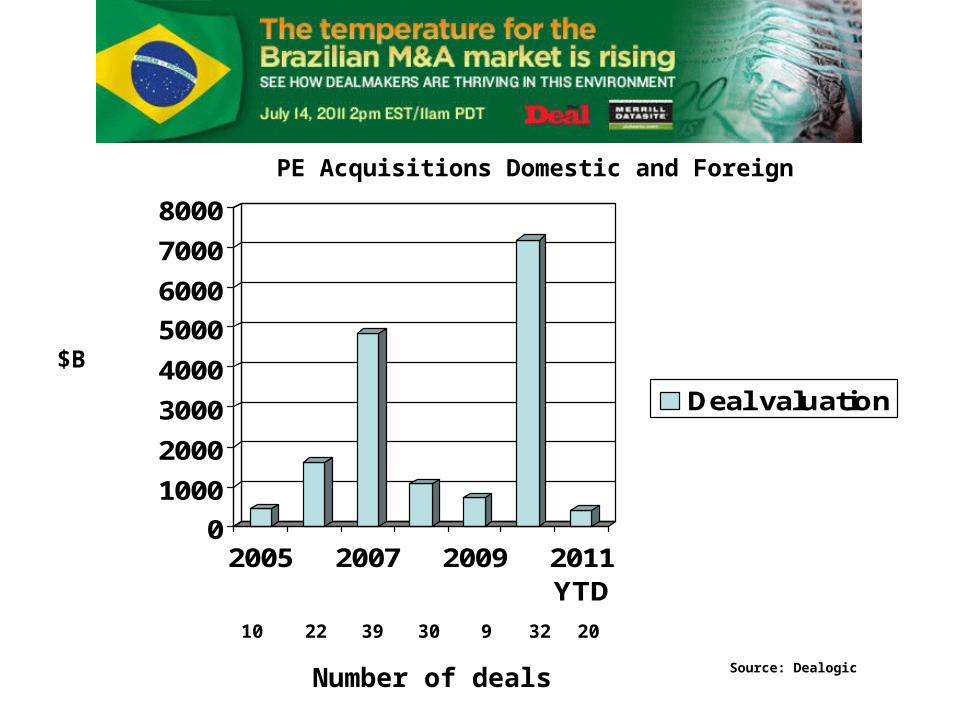
0
1000
2000
3000
4000
5000
6000
7000
8000
2005 2007 2009 2011YTD
Deal valuation
Source: Dealogic
PE Acquisitions Domestic and Foreign
10 22
39 30 9 32 20
Number of deals
$B
AUDIENCE POLL QUESTION
What is the greatest perceived risk in conducting M&A in Brazil?
A. Appreciation of the realB. Ability to conduct proper due
diligenceC. Government uncertainty D. Premium valuationsE. InflationF. Other
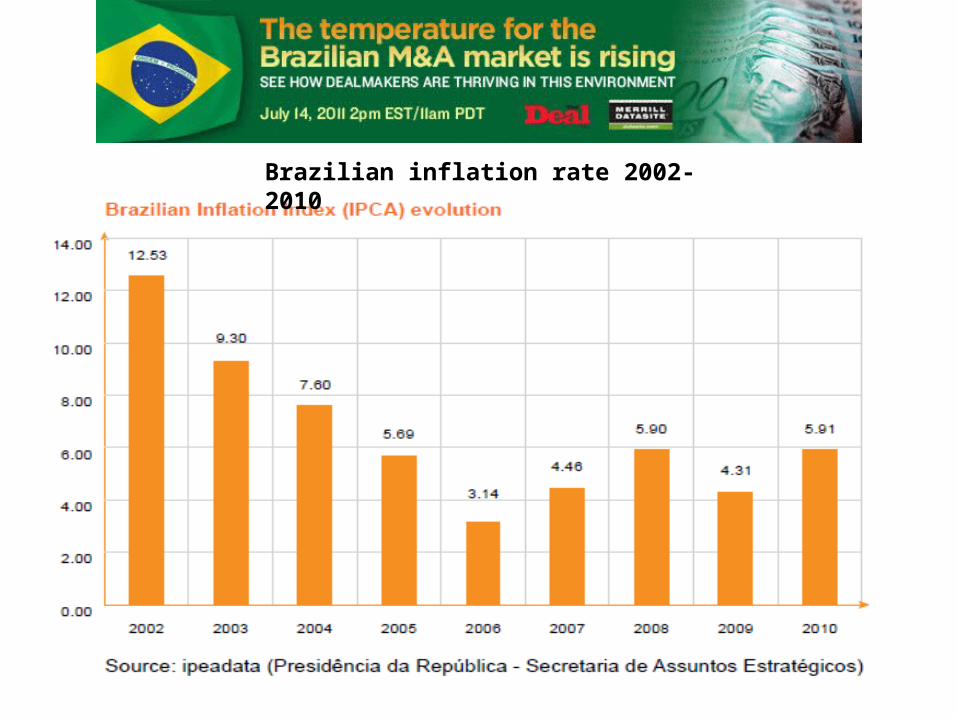
Brazilian inflation rate 2002-2010

Near-term outlook for dealmaking in Brazil
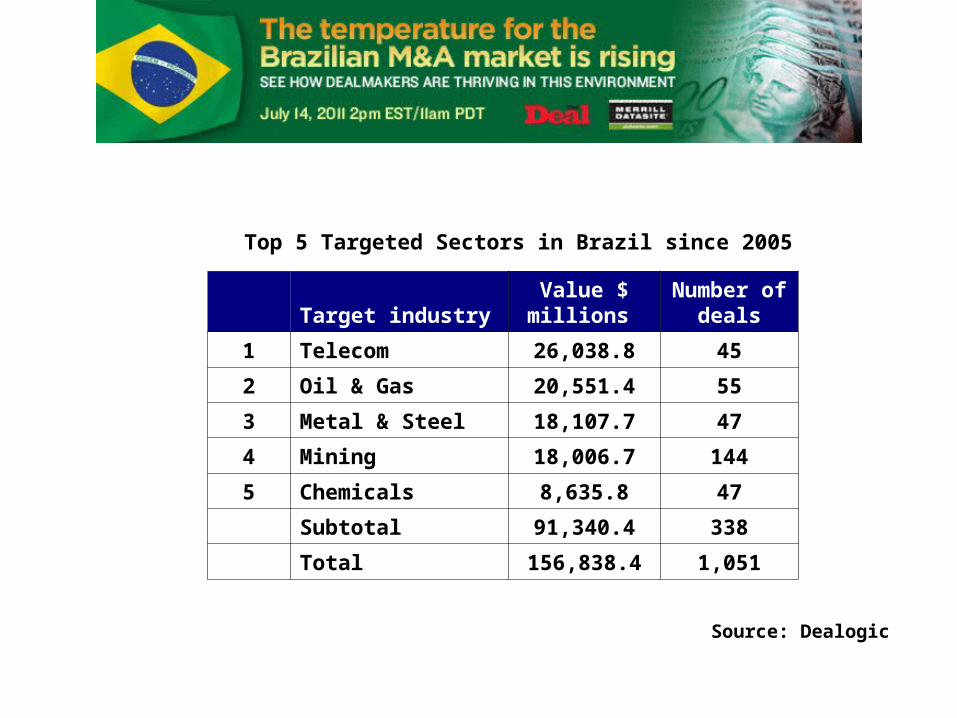
Top 5 Targeted Sectors in Brazil since 2005
Target industry Value $ millions
Number of deals
1 Telecom 26,038.8 45
2 Oil & Gas 20,551.4 55
3 Metal & Steel 18,107.7 47
4 Mining 18,006.7 144
5 Chemicals 8,635.8 47
Subtotal 91,340.4 338
Total 156,838.4 1,051
Source: Dealogic

AUDIENCE POLL QUESTION
What sector do you expect will experience the highest level of M&A activity in Brazil over the next 12-18
months? A. Natural resourcesB. EnergyC. AgricultureD. Financial servicesE. Technology, media and telecomF. Construction and infrastructureG. Other
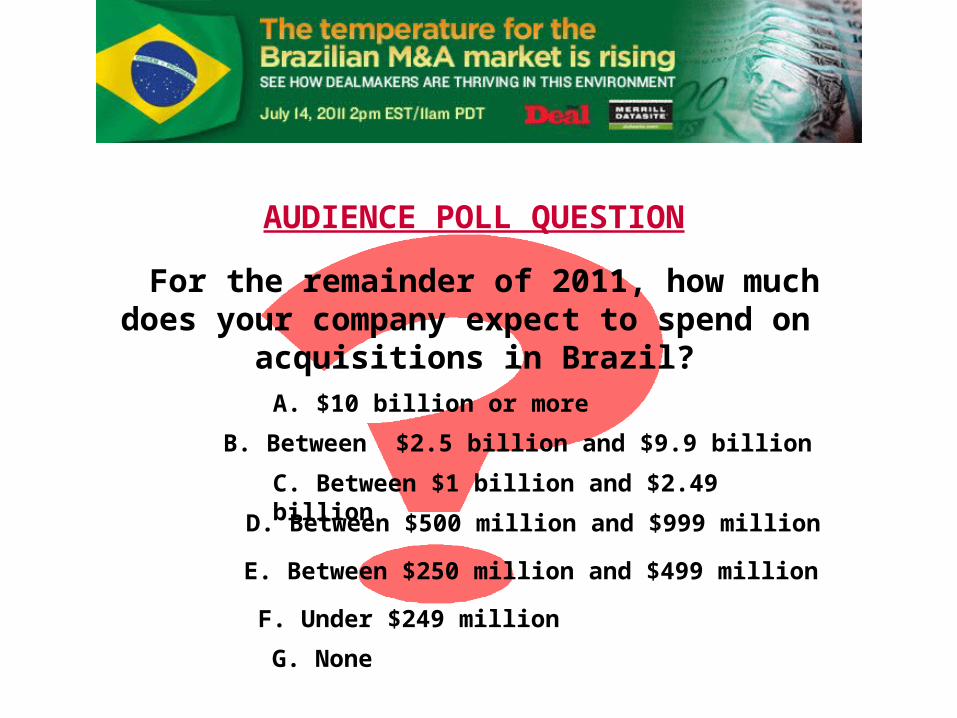
AUDIENCE POLL QUESTION
For the remainder of 2011, how much does your company expect to spend on
acquisitions in Brazil?A. $10 billion or more
B. Between $2.5 billion and $9.9 billion
C. Between $1 billion and $2.49 billionD. Between $500 million and $999 million
E. Between $250 million and $499 million
F. Under $249 million
G. None
AUDIENCE Q&A

•thank you for joining our webcast
and


![ANSYS IT Solutions Webcast Series€¦ · •Smart Computing • Rethink Sourcing Approaches. [Look at Extended Lead Times as a source of cost.] • Optimize Engineering Resources](https://img.pdfslide.us/doc/110x75/5eca476cce74ca60fc41e39b/ansys-it-solutions-webcast-series-asmart-computing-a-rethink-sourcing-approaches.jpg)


![Automate your Sourcing: The Ins and Outs of Recruiter [Webcast]](https://img.pdfslide.us/doc/110x75/58edeba71a28abca5d8b460f/automate-your-sourcing-the-ins-and-outs-of-recruiter-webcast.jpg)