Embed Size (px)
Citation preview

1
The Smart Grid …
Lunch and Learn
GE Energy
Session 3: The Smart Grid –
The Distribution View
Session 3 of a 5 Part Series on the Smart Grid
2
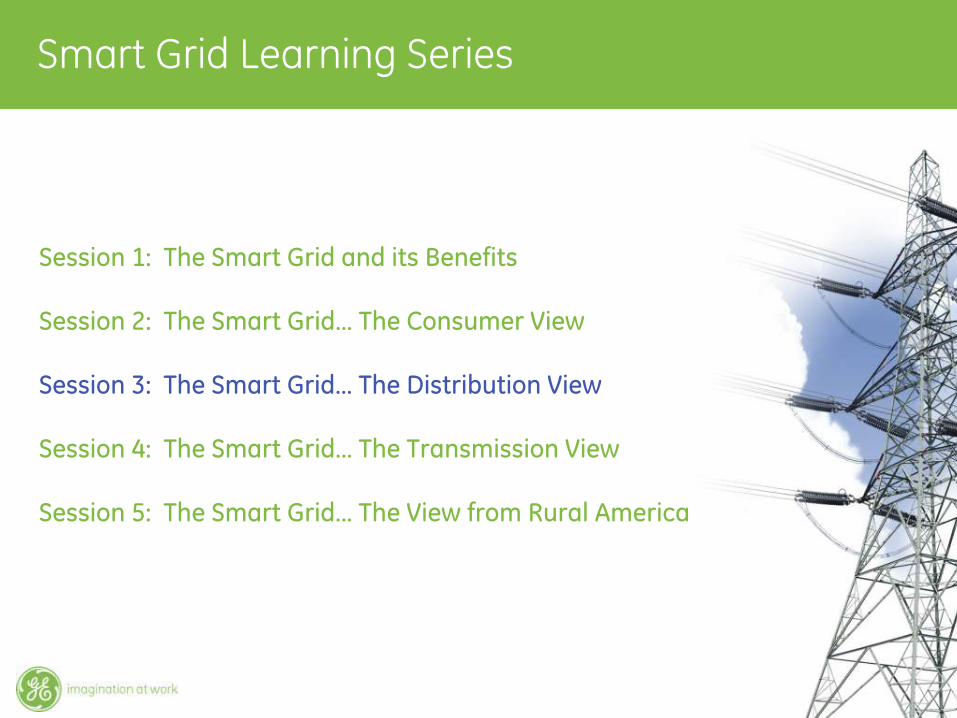
Smart Grid Learning Series
Session 1: The Smart Grid and its Benefits
Session 2: The Smart Grid…
The Consumer View
Session 3: The Smart Grid…
The Distribution View
Session 4: The Smart Grid…
The Transmission View
Session 5: The Smart Grid…
The View from Rural America

3
Session 3: The Smart Grid and The Distribution View
Topics:Smart Grid Overview
•
Industry challenges•
Transformation of the grid•
Benefits OverviewMore Focus on the Distribution System –
a “Smarter”
GridImpact of Green Generation on DistributionImprovement Options for Smart Distribution
•
Reliability•
Efficiency •
Advanced Distribution Management SystemsImpact of Policy Discussion

4
Soaring energy demand•
World energy consumption will triple by 2050
Power outages financial impact•
Cost of power disturbances in US ~ $100B a year
Green energy takes center stage•
Generation of electricity in US accounts for ~ 40% of CO2
emission
Electricity prices on the rise•
U.S. sees 6.5% spike in ’09 electric bills
Aging infrastructure / workforce•
The average US transformer age is just under 40 years old
•
50% of US utility workers are within 7 years of retirement
Industry Challenges

Transformation of the Grid
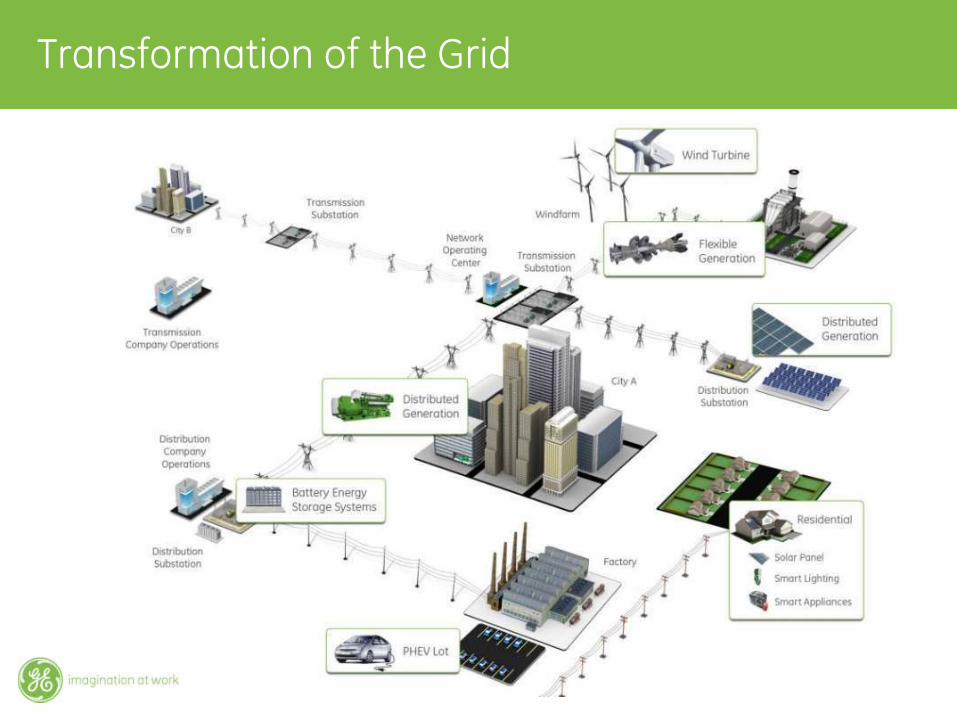
Transformation of the Grid

Wide-AreaProtection &Automation
Wide-AreaMonitoring
& Control
DeliveryOptimization
AssetOptimization
DemandOptimization
RenewablesForecasting
RenewablesSmoothing
Flexibility for Emerging Capabilities

8
The integration of electrical and information infrastructures, and the incorporation of automation and information technologies with our existing electrical network.
Comprehensive solutions that:Improve the utility’s power reliability, operational performance and overall productivityDeliver increases in energy efficiencies and decreases in carbon emissionsEmpower consumers to manage their energy usage and save money without compromising their lifestyleOptimize renewable energy integration and enabling broader penetration
That deliver meaningful, measurable and sustainable benefits to the utility, the consumer, the economy and the Environment
More Focus on the Distribution SystemAnd Consumer Interface
Electrical infrastructure
Information infrastructure
A Smarter Grid

9
EconomyStimulus
Operational Efficiency
“Green” AgendaCustomer Satisfaction
Energy Efficiency
•
Reduce system and line losses
•
Enable DSM offerings
•
Improve load and VAR management
•
Comply with state energy efficiency policies
•
Reduce outage frequency and duration
•
Improve power quality
•
Enable customer self-service
•
Reduce customer energy costs
•
Reduce GHG emission via DSM and “peak shaving”
•
Integrate renewable generating assets
•
Comply with Carbon/GHG legislation
•
Enable wide adoption of PHEV
•
Integrate distributed generation
•
Optimize network design
•
Enable remote monitoring and diagnostics
•
Improve asset and resource utilization
Smart Grid Benefits

10
What it is Why$16MM/yr, 51K tons of CO2 reduction+
Res. consumer savings up to 10%Based on 1.6% peak load reduction using critical peak pricing resulting in reduction in fuel costs and deferral of generation capacity
Utility Value/MM Customers*
*Utility savings are approximate annual savings per one million customers
+ $85/kW-yr peak generation capacity value
$7MM/yr, 45K tons of CO2 reduction+
Based on 0.2% loss reduction and 0.5% CVR peak load reduction resulting in reduction in fuel costs and deferral of generation capacity
$11MM/yr, ~4.5 yr ROIBased on system-wide deployment of advanced transformer M&D resulting in transformer life extension and reduction in inspection, maintenance & repair costs
Prognostics for proactive equipment maintenance
Reduced outages and focused maintainers
Asset optimization
Reduce delivery losses in distribution systems
Less energy waste and higher profit margins
Delivery optimization
Manage peak via control of power consumption
Defer upgrades, optimize generation &
renewablesDemand optimization
Reliabilityoptimization
Wide Area Protection & Control
Increased network performance & reliability
$7MM/yrBased on the deferral of the capacity upgrade of two 220kV transmission lines for 3 yrs (each line 30 miles long with a cost of upgrade of $1.5MM per mile)
Renewablesoptimization
Use of Forecasting & Smoothing
Compensation for production variability
Key step for meeting RPS targets, especially in areas with weak grids
Roadmap for a Smarter Grid

Delivery Optimization

12
Source: AEP PUC Hearing
Grid Inefficiencies

13
Consider the work to pull a wagon.
Total Pull consists of Forward and Upward Pull
Only the Forward Pull does work to move the wagon
The Forward Pull ~ Watts
The Upward Pull ~ VARs
PowerFactor = Forward/Total = COS(Θ)
Cos(51°) = 0.63
TotalPull
UpwardPull
ForwardPull
Θ=51°
Understand the Fundamentals ….What are VARs?

14
Understand the Fundamentals ….What are Volts & Amps?
Again consider pulling a wagon.
Volts are how hard you pull.
Amps are how fast the wagon goes against the rolling resistance
Pulling force ~ Volts
Speed ~ Amps
Pull Harderto go faster
Speed
Resistance

15
Understand the Fundamentals ….What is IVVC?
VAR Optimization -
Power Factor Correction
Distribution feeder capacitor bank control to provide the benefit of energy loss
reduction by coordinating capacitor banks control.
Conservation Voltage Reduction (CVR)
Coordinating regulator and LTC control to reduce feeder voltage levels to provide
the benefit of load reduction on the feeders and substation.
Integrated Volt/VAR Control (IVVC)
Coordinated Control of substation transformer tap changers, feeder voltage
regulators and capacitor banks to ensure a VAR and voltage profile to optimize
these benefits.
Why Now?
Until recently, the benefits and costs have not been tied together between the
distribution, generation, consumer, etc.

16
Reduced VAR deficiencies
Reduced distribution and system losses
Reduces or delays distribution rebuilds
No need to manually control/inspect banks
Automatic Fuse Detection
-3
0
3
6
9
12
15
18
VAr
Optimization ON
MW
MVAr
IVVC Benefits

17
Reduce voltage at peak for economicsReduce voltage across base to reduce demandMonitoring improves visibility of voltage along circuitSignificant positive PV calculated for Utility and ConsumerReduced CO2 emissions
Average Daily Load Profile
DemandMW
Base Load(8760 hrs per year)
Critical Peak (100 hrs per year)
Peak (1000 hrs per year)
Voltage Control Reduces Load at base load
Voltage Control Reduces Load at Peak
Conservation Voltage Reduction Benefits

18
IVVC Value Proposition
IVVC
• Reduced base & peak generation cost
• Avoided generation & T&D capital
Peak hour (peak load reduction)
Regular hour
Loss Reduction
ConservationVoltage
Reduction
• Reduced peak generation cost
• Capital avoidance for peak generation & T&D equipment
• Reduced generation cost
• Capital avoidance for base load
SGTechnology
Enabled Capability Benefits
O&M Savings
• Cap bank blown fuse detection
• Reduced capacitor bank, LTC and voltage regulator inspections
Reduced CO2Emissions

19
D20 ME
D20 EME
D20 ME
D20 EME
i BOX
SEL 351
i BOX
SEL 351
D25g
NO
FeederSwitch
FeederTie Switch
Sub #1
Sub #2
CB13
CB16
FeederSwitch
LAN
Step 2: FDIR routine communicates with feeder switches to determine fault location and prefault load.
Step 3: FDIR routine determines if capacity exists on alternate feeder.
Step 4: If capacity exists then FDIR routine sends a control to isolate fault by opening feeder #1 switch.
If no capacity: “Unable to restore segment due to lack of capacity on Feeder 2”.
Step 5: FDIR routine sends a control to close feeder tie switch. Power restored to customers on non-faulted feeder section
Feeder Trips to Lockout
Customers Interrupted
No Fault Detected
Prefault Load
Power Restored
Capacity Check
Fault Detected
Open Breaker
Close Tie Switch
Fault Detection Isolation & Service Restoration (FDIR)
Feeder#1
Feeder#2
Fault
Step 1: Fault occurs.

20
FDIR Value Proposition
FDIR
Reduced fault investigation and patrol time
Improved SAIDI
Automated switching
Faster restoration of certain customers
Fault Detection
Fault Isolation & Restoration
Reduced need for manual switching
Improved SAIDI, SAIFI and customer satisfaction
Faster outage detection
SGTechnology Enabled Capability Benefits

21Source: OG&E Study,
Distributech
Conference 2009
$-
$1.00
$2.00
$3.00
$4.00
$5.00
$6.00
Case 1 Case 2 Case 3 Case 4 Case 5 Case 6
Incremental Costs in Dollars per Customer Minute Interrupted (over Base Case)
Base Case –
Manual Operated Disconnects (MOD)Case 1 –
Manual Operated
ReclosersCase 2 –
Reclosers
with Remote ControlCase 3 –
Automatic Fault Detect Isolate Restore (FDIR)Case 4 –
Closed Loop Automation Case 5 –
Distribution Management System Case 6 –
Smart Grid with Meters
Delivery Optimization –
Reliability Benefit Summary Fault Detection Isolation Restoration
StationSeg 2Seg 1 Seg 3
S2 TS1F1
StationSeg 2Seg 1 Seg 3
S2 TS1F1
Typical System

22
Fault occurs
Customers call in to report outage – process starts now
Recloser predicted out by OMS – limited data
Crew dispatched & arrives –prediction may be adjusted
Crew patrols circuit to identify fault location
Fault located and switching takes place until maximum customers restored
Crew repairs fault, closes recloser manually
Manual switching calculations may be be necessary to shift additional load
Outage completed in OMS by dispatchers – when they can
Some customers respond they are still out – process starts over again
Example Outage Scenario –
Today
N.O.
R
R1
T1
F1T3T2
Customer Trouble calls
R

23
MMeters replace customer calls as initial outage notification
OMS predicts probable device – more accurate
As customers call, status available immediately
Advanced DMS used for FDIR using real-time load & voltage data
Load flow analysis is used to determine how best to pick up load from one or more adjacent circuits
Meters are pinged immediately following each switching action toensure all customers in non-faulted section are restored
Crew investigates, repairs, restores
Meters that do not respond are re-processed by OMS prediction
Crew immediately notified to follow-up (nested outage)
N.O.
R
R1
T1
F1T3T2
MeterInformation
R
M M
M M
M
M M
M M
Outage Scenario with AMI/OMS/DMS Integration

Asset Optimization

25
Operational efficiencyReducing O&M expense, more efficient deployment of capital & human resources, and increased productivity
Utility Perspective
The average US transformer age is just under 40 years old
50% of US utility workers are within 7 years of retirement
Source: William Bartley P.E. Hartford Steam Boiler Inspection & Insurance
0%
20%
40%
60%
80%
100%
1 5 9 13 17 21 25 29 33 37 41 45 49 53 57 61 65 69 73 77 81 85 89 93 97
Age in Years
Transformer Failure Rate
Average
Aging Assets & Workforce

26
Detecting signs of failure conditions
Reducing probability of catastrophic failure
Reducing unscheduled outages
Addressing specific unit or population issues
Loading T&D equipment for maximum efficiency
Deferring upgrade capital costs
Managing & extending the life of equipment
Reducing O&M costs
Transformer On-Line Monitoring & Diagnostics?

27
Current Failure rate of 1% is a conservative average for a fleet.
* 60% is an industry accepted effectiveness number for a quality
monitoring system. Failure reduction figure based on a CIGRE and on a KEMA study.
Risk of unexpected Failure can be reduced by 2.5 fold!(.00028 / .0007 = 2.5)
Current failure rate
DetectedFailures before M&D:
Undetected
Faults detected by M&D Systems
30%.003
1%.01
70%.0007
10%.0007
90%.0063
Without
Monitoring
30%.003
1%.01
70%.0007
10%.00028
90%.0025
With
Monitoring
60% *.00042
40%.0028
CatastrophicProportion of faults:
Non-catastrophic
Faults not detected by M&D Systems
Asset Optimization –
On-Line Monitoring & Diagnostics Station Transformer Risk Model

28
M&D
Reduced inspection costCondition based inspection
Condition based maintenance
SGTechnology Enabled Capability Benefits
Early detection of failures
Improved asset life
Improved system throughput
Reduced maintenance cost
Reduced blackout probability
Reduced corrective maintenance cost
Loss revenue during blackout
Less capital spending
Improved power sales
Transformer Asset Optimization Value Proposition

29
From reactive, non-integrated…
To interactive decision support
We Will See Advances in Technology –
“Smarter”
Advanced Distribution Infrastructure
IVVC FDIR
TPDPF SOMCA RPC SCAONR LELM
OCP/OVP DTS
Analytics & Visualization
Meters, PQ, Customer Interface
DG, Micro-Grids, PHEVs,
advanced protection
Asset OptimizationDelivery
Optimization
Demand Optimization
GIS, OMS
Field Devices (switches,
reclosers, cap banks, etc)
Real-time Database &
Network Model
Operational Database
(alarms, trending, load profiles, etc)
Meter Data Management
DG Control, PHEV
Management
Open Standards –
CIM, SOAP, XML, ESB

30
AMI/SG & RPS RPS onlyAMI/SG only
Electric Decoupling
FERC/NARUC Collaborative
Pending Electric Decoupling
Sources: National Council on Electricity Policy, Pew Center on Global Climate Change, NRDC,
Capgemini
Survey of NARUC and CAMPUT (2009)
Tier 1 Tier 2
Smart Grid Policy Momentum

31
Summary
•
Economic and environmental demands are forcing functions
•
Investment in technology can accelerate their adoption
•
The Smart Grid is dynamic and must be viewed as a system
•
Distribution systems will be more in the technology spotlight
•
Policy will drive incentive for delivery optimization

32
Smart Grid Learning Series …
next week
Session 1: The Smart Grid and its Benefits
Session 2: The Smart Grid…
The Consumer View
Session 3: The Smart Grid…
The Distribution View
Session 4: The Smart Grid…
The Transmission View
Session 5: The Smart Grid…
The View from Rural America