Embed Size (px)
Citation preview
The Impact of Institutions on Innovation*
Alexander Donges, Jean-Marie A. Meier, Rui C. Silva�
August 2016
Abstract
This paper studies the impact of institutional reforms on innovation. We use the timing and
geography of the French occupation of di�erent regions of Germany after the French Revolution
of 1789 as an exogenous shock to the institutions of those regions. Combining novel county-
level data on Imperial Germany with data on patents per capita, we show that counties whose
institutions are more inclusive as a result of the French occupation become more innovative.
The institutional reforms that are associated with comparing a county with no occupation to
a county with the longest occupation, result in a 129% increase in the number of patents per
capita. This result is robust to alternative explanations, such as reverse causality, human capital
and �nancial development. Our �ndings point to institutions as a �rst order determinant of
innovation and highlight the role of innovation as a key mechanism through which institutions
may lead to economic growth.
Keywords: Innovation, Patents, Institutions, Institutional Reform, Economic GrowthJEL classi�cation : O31, O43, N43, N13, K40, P16
*Meier and Silva thank the Deloitte Institute of Innovation and Entrepreneurship at London Business School for�nancial support. We thank Taylor Begley, Bo Bian, João Cocco, Maximilian Eber (discussant), Julian Franks,Francisco Gomes, Juanita Gonzalez-Uribe, W. Walker Hanlon, Sebastian Hohmann, Stefan Lewellen, Anton Lines,David Schoenherr, Max-Stephan Schulze, Felix Selgert, Henri Servaes, Jan Starmans, Jochen Streb, Carsten Trenkler,Guo Xu, Moqi Xu, Franz Zobl, and conference and seminar participants at the London Business School, the Universityof Mannheim, the CAGE/HEDG Workshop in Odense, and the TADC for helpful discussions and comments. Wethank Jörg Baten and Jochen Streb for sharing their patent data. We thank Bo Bian, Anna-Sophia Elm, Thilo Kindand David Müller for excellent research assistance.
�Donges (email: [email protected]) is from the University of Mannheim; Meier (email: [email protected])and Silva (email: [email protected]) are from London Business School.
�
The Impact of Institutions on Innovation
�
Abstract
This paper studies the impact of institutional reforms on innovation. We use the timing and
geography of the French occupation of di�erent regions of Germany after the French Revolution
of 1789 as an exogenous shock to the institutions of those regions. Combining novel county-
level data on Imperial Germany with data on patents per capita, we show that counties whose
institutions are more inclusive as a result of the French occupation become more innovative.
The institutional reforms that are associated with comparing a county with no occupation to
a county with the longest occupation, result in a 129% increase in the number of patents per
capita. This result is robust to alternative explanations, such as reverse causality, human capital
and �nancial development. Our �ndings point to institutions as a �rst order determinant of
innovation and highlight the role of innovation as a key mechanism through which institutions
may lead to economic growth.
1 Introduction
Innovation is one of the most critical engines of growth and prosperity (Solow (1957), Mokyr (1992)
and Kogan, Papanikolaou, Seru, and Sto�man (2016)). Because of its importance, corporations and
national governments spend large amounts of resources in designing and implementing practices and
policies with the aim of fostering innovation.1 However, there are still large gaps in our understanding
of what drives innovation.
In this paper, we study the long-run impact of radical institutional reform on innovation. Soci-
eties that operate under extractive institutions create an economic environment that aims to sustain
the status quo and avoid change. In contrast, inclusive institutions allow equal access to economic
opportunities which promotes the development of new ideas and businesses (Acemoglu, Johnson,
and Robinson (2001)). Using a novel hand-collected county-level data set on the German Empire we
�nd an economically large impact of the inclusiveness of local institutions on innovation. Regions
with more inclusive institutions are signi�cantly more innovative than regions with extractive insti-
tutions. This �nding not only highlights institutions as a leading determinant of innovation, but
also points to innovation as a key channel by which institutions may ultimately lead to economic
growth.
We use the timing and geography of French military invasions of di�erent regions in Germany
after the French revolution of 1789 as an exogenous shock to the institutions of those regions (Ace-
moglu, Cantoni, Johnson, and Robinson (2011)). Several aspects of this historical setting make it a
good laboratory to study the impact of institutions on innovation. First, the geography of occupa-
tions was imposed by the French. Second, the motives behind French occupations were military and
geostrategic, not economic. Napoleon wanted to expand the French borders and create a territorial
bu�er between France and his rivals, Austria-Hungary and Prussia. The choice of German areas to
be occupied was thus not driven by the potential for future innovation or future economic growth
of these regions, making subsequent increases in innovation unintended consequences of the French
occupation.
The French promoted institutional change through the implementation of progressive reforms
1For example, in 2015 the White House's Strategy for American Innovation states that �Now is the time for theFederal Government to make the seed investments that will enable the private sector to create the industries andjobs of the future, and to ensure that all Americans are bene�ting from the innovation economy� (National EconomicCouncil and O�ce of Science and Technology Policy (2015)).
1
that ultimately fostered the modernization of the economy and the society in the occupied territories
(Fehrenbach (2008), pp. 82-94). Crucially, the incentives to enact institutional changes in occupied
regions were not driven by economic considerations either. The French wanted to spread their new
political ideas, which had been formed during the French Revolution. Furthermore, they were moti-
vated by the intention to dissolve the power of local elites, in order to ease the control of the newly
gained territories. As a result, regions that were occupied by the French subsequently underwent
major institutional reforms, which eroded the privileges enjoyed by the establishment. Moreover,
German regions that had longer French occupation experienced deeper institutional change and op-
erated under more inclusive institutions, which were characterized by lower barriers to entry and
fewer restrictions on labor and product markets.
These institutional reforms in turn a�ect innovation in the long-run. The creation of an ef-
�cient legal system guaranteeing equal rights through the introduction of the code civil fostered
business creation and increased the incentives to innovate. The dissolution of guilds established an
innovation-friendly and competitive environment, which replaced an obsolete economic system orig-
inating from the medieval times that had prevented the introduction of new production techniques
(Ogilvie (2014)). Likewise, the abolition of serfdom and the implementation of agrarian reforms
increased the potential for innovation by restricting the power of local elites and promoting social
mobility (Blum (1978)). Combing data on patents per capita in 1890, 1900 and 1910 as our measure
of innovation with novel county level data, we document that German counties, whose institutions
were more inclusive due to the French occupation, became more innovative.2 The institutional
reforms that are associated with moving from a county with no occupation to a county with the
longest occupation, result in a 129% increase in patents per capita, when evaluated at the mean.
Second, we investigate the hypothesis that the impact of institutional reforms on innovation
might be weaker in regions where impediments for the e�ective implementation of such reforms
exist. This could be the case in regions that were part of former ecclesiastical states, where even
after the implementation of the reforms, social norms were still dominated by the Catholic Church,
rendering the population and the administration more conservative and backwards (Borutta (2003)).
In support of this hypothesis, we �nd that the institutional reforms which we analyze led to a
2There is no nationwide patent data available before 1877, when a harmonized patent law was introduced in theGerman Empire. A further restriction is the availability of county-level population data from census publications.
2
signi�cantly smaller increase in innovation in areas that were part of former ecclesiastical states.
This result strengthens our identi�cation, since any alternative explanation for our main result also
has to explain why the e�ect of institutional reforms is muted in former ecclesiastical states.
To link the results of the impact of institutions on innovation to the literature on economic
development, we study innovation in high- and low-tech industries separately. Our estimates suggest
that inclusive institutions might be of particular relevance for high-tech innovations, which were those
associated with chemicals and electrical engineering, the booming sectors of the second industrial
revolution (Landes (2003)). The change in institutions associated with comparing a region with no
French occupation to one with the maximum duration of French occupation implies a 288% increase
in high-tech innovation, while the same institutional change leads to a 82% increase in low-tech
innovation.
Finally, we perform a battery of tests to demonstrate that our �ndings are robust to di�erent sub-
samples and alternative speci�cations, including di�erent ways of measuring institutional reforms.
Moreover, we hand-collect additional data to address concerns that other factors correlated with the
French occupation could be driving our results. In particular, we �nd that our �ndings are unlikely to
be determined by reverse-causality through cross-sectional di�erences in local economic development,
French in�uence beyond institutions (such as culture, knowledge or technology transfers), by trade
and market integration, cross sectional di�erences in the level of human capital, and by di�erences
in local �nancial development.
The paper is closely related to three main strands of literature: the literature that studies the
causes and consequences of innovation, the literature that analyzes how institutions shape economic
activity, and the literature on historical economic development and on the long-run persistence of
the e�ects of historical events.
Previous research has analyzed several determinants of innovation. One key determinant of
innovation is the legal environment. In particular, the impact of patent law on innovation has been
the object of many studies. For example, Moser (2005) �nds that patent law a�ects the direction of
innovation through a shift into industries that are more dependent on patent protection, but does
not a�ect the amount of innovation. In contrast, Boldrin and Levine (2008) claim that legalized
monopolies protected by patent law may lead to lower innovation and argue that in industries
where patents are less e�ective, innovation is not lower than in industries where patents are more
3
frequently used. Previous research has also analyzed the role of the legal environment in terms
of bankruptcy codes (Acharya and Subramanian (2009)) and labor laws (Acharya, Baghai, and
Subramanian (2013)). The evidence presented in these papers suggests that excessive liquidation in
bankruptcy may lead �rms to avoid innovation, and that laws that promote stability in �rm-employee
relationships spur innovation.
Another aspect that has been documented to impact innovation is the availability of �nance.
For example, Kortum and Lerner (2000), Gompers and Lerner (2001) and Kerr, Lerner, and Schoar
(2014) study the impact of venture capitalists and angel investors. Overall, these papers illustrate
the positive impact of access to �nance on innovation. Additionally, Tian and Wang (2014) show
that �rms backed by venture capitalists that are more tolerant to failure, innovate more. Hombert
and Matray (2015) document a negative impact of US bank branch deregulation on innovation. In
addition to banks and early stage investors, the equity market also a�ects innovation. Bernstein
(2015) shows that post IPO �rms innovate less internally and are instead more likely to acquire
external innovations. Using cross-country evidence Brown, Martinsson, and Petersen (2013) and
Hsu, Tian, and Xu (2014) reveal that the development of equity markets and greater shareholder
protection positively impact innovation. The relevance of this literature for our setting is supported
by the fact that in Berlin a well-functioning market for new technology stocks already existed in the
period before World War I (Lehmann-Hasemeyer and Streb (2016)).
Concerning more macroeconomic determinants of innovation, Sokolo� (1988) argues that the
location of innovative �rms is determined by geographical factors that allow for market access, in
particular access to waterways. Shane (1993) asserts that cultural aspects including the degree of
risk aversion and of individualism explain di�erences in innovation across countries. Cinnirella and
Streb (2013) suggests that the local provision of human capital has a positive e�ect on patenting
activity. At a microeconomic level, di�erences in organizational structure (Seru (2014)) and incentive
systems (Burhop and Lübbers (2010)) also help to explain the variation in innovation across �rms.
Our paper di�ers from the previous literature by studying the importance of the quality of
institutions as a potential determinant of innovation. Our results indicate that the existence of
institutions that broaden the access to economic gains leads to a large increase in the innovativeness
of a region.
The �ndings in our paper are also relevant for the literature that studies the role of institutions
4
as a determinant of economic development. In particular, our paper relates to the work of North
(1990), who emphasizes the notion that formal and informal institutions may have a signi�cant im-
pact on economic performance. More recently, Hall and Jones (1999) and Acemoglu, Johnson, and
Robinson (2001) analyze global di�erences in output per worker and income per capita, respectively,
and provide evidence that the inclusiveness of institutions is a major determinant of long-run eco-
nomic growth. This view is supported by Acemoglu, Johnson, and Robinson (2002) and Acemoglu,
Johnson, and Robinson (2005). Despite the existence of evidence that links the inclusiveness of in-
stitutions to economic growth, there is scant evidence on the mechanisms through which institutions
operate to create economic prosperity. We propose innovation as one such channel. In this regard,
we di�er from prior work which suggests that extractive institutions and the consequent concentra-
tion of wealth can limit growth by creating barriers to �nancial development (Rajan and Ramcharan
(2011)) or by preventing the expansion of education (Cinnirella and Hornung (2016)). Other chan-
nels linking institutions to growth include foreign direct investment (Alfaro, Kalemli-Ozcan, and
Volosovych (2008)) and market integration (Keller and Shiue (2015)).
Last, our paper contributes to the literature that studies historical economic development and
the long-run persistence of the e�ects of historical events. Becker and Woessmann (2009) test the
famous hypothesis by Max Weber on the Protestant work ethic, which could explain di�erences in
economic prosperity between Protestant and Catholics regions and countries. Using Prussia as their
setting, they �nd a positive relationship between Protestantism and economic prosperity, which is
driven by the higher literacy of Protestants relative to Catholics. Hornung (2014) �nds a positive
e�ect of skilled immigration on �rm productivity in the receiving economy. The crucial role of human
capital as a determinant of economic growth is also highlighted in Cantoni and Yuchtman (2014),
who establish that universities have a positive e�ect on economic activity, and Squicciarini and
Voigtländer (2015), who �nd that upper-tail knowledge raised productivity in innovative industries.
Transportation is another possible determinant of growth (Fogel (1964), Donaldson and Hornbeck
(2016)). Banerjee and Lakshmi (2005) show evidence for long-run legacy e�ects of property rights
on economic outcomes. Michalopoulos and Papaioannou (2013) document the long run e�ects of
ethnic institutions. Nunn (2008) investigates the negative long run e�ect of slave trades on African
development, and Dell (2010) the long run e�ect of a forced mining labor system in Peru and Bolivia.
Finally, Voigtländer and Voth (2012) �nds that Antisemitism persisted in Germany for a 600 year
5
period.
To the best of our knowledge our paper is the �rst to present evidence on the relationship
between inclusive institutions and innovation. Our result, that inclusive institutions lead to a large
increase in innovation, promotes the view that a key channel through which better institutions foster
growth might be through the implementation of an economic environment that is more conducive
to innovation. The e�ect we document is present even after institutions are harmonized across
Germany, which also underscores the ability for historical events to persist in the long run.
The rest of the paper is organized as follows. In the next section we describe the historical
background including the French rule in Germany and discuss the channels by which institutional
reforms can impact innovation. In section 3 we describe our data. In section 4 we present our main
�ndings on the impact of institutions on innovation, and in section 5 we implement additional tests
that allow us to rule out alternative interpretations for our results. Section 6 concludes. Detailed
information on the data can be found in the appendix.
2 Historical Background
2.1 The French Occupation of Germany and Territorial Changes
In the second half of the eighteenth century, the Holy Roman Empire of German Nations was a
loose federation of independent states formally ruled by the Habsburg Emperors.3 Due to the lack
of a central administration, the Empire was a relic of medieval times, consisting of hundreds of
di�erent political entities. The French Revolution, starting in 1789, provoked the ultimate fall of
the Holy Roman Empire. In 1792, the German monarchies joined a military coalition to counter
the revolutionary ideas in France. However, the French revolutionary forces prevailed and turned
into the o�ensive. In order to improve their geo-strategic position, the French occupied all German
territories west of the river Rhine by 1795. The result was a bu�er zone with the Rhine as its natural
border that protected France from potential aggression of its main continental rivals, Prussia and
Austria-Hungary. When Napoleon took over power, the pressure on Germany increased further.
In 1806, Napoleon expanded the French sphere of in�uence by means of diplomacy. He forced the
3See Fehrenbach (2008) and Whaley (2012) for the history of the French occupation of Germany and the territorialchanges.
6
remaining medium-sized German states to establish the Confederation of the Rhine (Rheinbund)
and to form a coalition with France. As a result, the Holy Roman Empire ceased to exist.
Prussia, the most powerful German state, was directly threatened by the Napoleonic expansion
and ultimately declared war against France in the autumn of 1806. However, the French prevailed
once more. Prussia had to accept the disgraceful peace treaty of Tilsit in 1807 that resulted in
signi�cant territorial losses, in particular all provinces west of the river Elbe. Parts of the former
Prussian territories were integrated into the Grand Duchy of Berg and the Kingdom of Westphalia,
French satellite states that were both ruled by relatives of Napoleon. From a strategic perspective,
Berg and Westphalia became French bridgeheads on the Eastern side of the Rhine. Furthermore,
Napoleon occupied the free Imperial cities of Bremen, Hamburg and Lübeck and the remaining
German territories in the North, giving him control over the coast. This was a strategic necessity,
since otherwise the Continental System would have been undermined by contrabandists trading with
Britain (Fehrenbach (2008), pp. 95-101). By 1810, the whole Lower Rhine area, Westphalia, the
North Sea coast, Hanover, and large parts of Hesse were under French control.
The occupation ended with the swift withdrawal of the French army that had su�ered several
military setbacks in the course of the German Campaign of 1813. After Napoleon's �nal defeat in
the battle of Waterloo, the European great powers restored the political order of pre-revolutionary
Europe. The German states however refrained from the re-establishment of the Holy Roman Empire
and the restoration of the old borders.4 As a result of the French expansion and the subsequent
territorial reorganization, all ecclesiastical states, most of the imperial cities, as well as a large
number of small independent territories, were integrated into larger states. These changes were not
revised and consequently most of the remaining states experienced territorial gains.
In absolute terms, Prussia was the big winner since it could increase its in�uence as a leading
German power by enlarging its possessions. In particular, Prussia gained control over the entire
northern Rhineland and Westphalia, but importantly these territories were not its �rst choice. The
Prussian rulers in Berlin pushed for the annexation of the entire Kingdom of Saxony, which had
been a long-standing French ally, but this intention was refused by the United Kingdom and Austria-
Hungary that wanted to preserve the balance of power in Europe (Flockerzie (1991)). The underlying
rationale was that, from the perspective of 1815, Saxony was seen as the most promising region in
4See Fehrenbach (2008) for the process of restoration in German states.
7
terms of economic prospects and was much more developed than the Rhineland or Westphalia.5
Furthermore, it was located in the East, next to the Prussian heartland which would have made it
easier to defend in case of future warfare. By contrast, there was no direct land connection to the
Rhineland and Westphalia at this time, making Prussia thereby more vulnerable in a potential war.
Interestingly, the unwanted occupied regions of Rhineland and Westphalia, turned out to be the
most innovative and economically dynamic part of Germany in the late 19th century. This anecdote
provides additional credibility to our identifying assumption that the occupied territories were on
average not more developed in economic terms than non-occupied regions.
2.2 Institutional Change under French Rule
The French occupation did not only alter the territorial structure of German states, but also had
a widespread economic and social impact. During the years of French rule, the occupied territories
su�ered from the demand for troops and the con�scation of property, food and other goods that
were necessary to supply the French forces (Whaley (2012), pp. 558-559). Furthermore, business
activity was suppressed in times of war, and the economic blockade of Britain restricted trade. In
the short-run, the French occupation might therefore have had a negative impact on innovation.6
However, in the long-run, it had positive consequences as it fostered economic modernization and
social progress.
At the end of the 18th century, economic development and the potential for innovation were
limited by backward institutions which preserved the power and the privileges of a small elite.7
However, along with the French troops, the ideas of the French revolution spread over German
states and induced a considerable institutional change. In the occupied areas, the French forced
substantial reforms which cut down the privileges of the existing elites. These reforms included the
5There are no reliable GDP estimates for this period, but several indicators give strong evidence that Saxony wasfar much developed than other German states, in particular in the leading sectors of the industrial revolution liketextile production. In 1815, 284,000 cotton spindles were used in Saxony compared to an estimated number of 360,000in all German states including Saxony (data from Kiesewetter (2004), p. 175). Saxony could even maintain its leadingrole until the second half of the 19th century (see also section 6.2, where we discuss these regional di�erences).
6The textile �rms in the Rhineland, for example, could not import superior English machinery under the con-tinental blockade. As a consequence, these companies struggled after 1815 due to the antiquated equipment (Kisch(1989), p. 212).
7The nobility dominated Germany both economically and politically, and it had been able to retain far-reachingjuridical privileges, in particular in rural areas where it owned most of the land (Blum (1978)). In the cities, urbanoligarchies limited private entrepreneurship through guilds that formed cartels to prevent market entries. Accordingto Ogilvie (1996) guilds were common in all German states at the end of the 18th century.
8
establishment of commercial freedom by the dissolution of guilds, the introduction of a general code
civil, the the abolition of serfdom and the implementation of agrarian reforms (Acemoglu, Cantoni,
Johnson, and Robinson (2011)).8 Economic motives played only a minor role in the decision to
impose the reforms. Apart from ideological reasons, the French wanted to restrict the power of the
local elites to facilitate the administration of the occupied areas (Acemoglu, Cantoni, Johnson, and
Robinson (2011)), which should serve as bu�er territories between France and its continental rivals.
After the retreat of the French troops and the restoration of the old order, the German sovereigns
recalled some of the Napoleonic reforms in the formerly occupied lands. However, the process of
the so called 'Restoration' varied regionally, depending on the duration of the French occupation.
In territories where the French occupation lasted only a couple of years the push back was much
stronger than in territories with a long period of French rule.9 As a result of regional variation in
the duration of occupation, the inclusiveness of institutions di�ered enormously between and within
German states during the 19th century. In regions where restoration took place as well as in regions
that had not been occupied by the French, extractive institutions remained in place for a long period
of time. In those locations, the rulers later implemented similar reforms. However, this was done
slowly and on average several decades were needed for institutional change to be enacted. Even after
the formation of the German Empire in 1871, there were still signi�cant institutional di�erences that
could be traced back to the French invasion. A manifestation of this is the fact that a unique and
nationwide civil code did not exist until the introduction of the German Civil Code (Bürgerliches
Gesetzbuch) in 1900 (Schubert (1977) and Klippel (1996)).
2.3 How Does Institutional Change Foster Innovation?
The institutional improvements that had been promoted under the French rule created an economic
environment conducive to innovation. One of the reforms that directly increased the potential for
innovation was the establishment of commercial freedom through the abolition of guilds and other
8Reform e�orts also took place in non-occupied German states, but the local elites often prevented its implemen-tation or e�ectively lobbied for exemption clauses to maintain their in�uence. In the Duchy of Nassau and the GrandDuchy of Hesse-Darmstadt, for example, the government discussed the introduction of a code civil, but only lettersof intent were drafted and, �nally, the consultations ended without results in 1813 (Schubert (1977)). In the non-occupied parts of Prussia some reforms were introduced, but the rural nobility could preserve far-reaching privilegesuntil the end of the century, including the right to administer justice (Wagner (2005)).
9In the Rhineland, for example, which was under French control for 19 years, the institutions reforms remainedin place. In contrast, old institutions were almost completely restored in the Northern and central German territoriesthat became under French control between 1807 and 1810.
9
restrictions on trade and production. Originated in the medieval age, guilds were associations of
merchants or artisans formed to control their trades and production.10 In the late 18th century,
guilds were still widespread in all German states (Ogilvie (1996)). On the one hand, guilds ensured
certain quality standards with regard to both the education of their craftsmen and their �nished
products, but on the other hand, they acted as entry barriers and an impediment for change and in-
novation by protecting the interests of the existing members (Ogilvie (2014)). Historical case studies
show that guilds directly prohibited the use of modern production techniques in order to maintain
the status quo. In the 17th century, for example, the use of engine looms for the production of silk
ribbon was e�ectively inhibited in Cologne, Frankfurt and other major centers of textile production
(P�ster (2008)).11 Before the dissolution of guilds, the incentives to generate economically valuable
inventions were very limited since it was not possible to enjoy the resulting economic gains. Further-
more, guilds did not only directly prevent innovation, but also restricted competition. Guilds acted
like cartels controlling local monopolies. Members of the guilds had captive markets and thus little
incentives to innovate. We therefore argue that another channel by which the dissolution of guilds
may have impacted innovation is through its role in creating a more competitive marketplace.12
It is important to point out that not all manufacturing businesses were organized in guilds even
in regions where guilds still dominated in the early 19th century. Capital-intensive industries such as
iron works or porcelain manufactories were typically not part of guilds but required the acquisition
of trading licences instead. The licenses were expensive and only scarcely distributed by the rulers.
Entrepreneurs had to rely on the goodwill of the administration to get a license, but they had no
legal claim. Requests were rejected for various reasons, including when the proposed business plans
challenged the economic interests of incumbents.13 We therefore view the system of trade licenses
to impact innovation in a similar manner as the system of guilds. Because the state decrees on the
dissolution of guilds usually simultaneously also included the weakening of other restrictions such as
10See Ogilvie (2014) for a general overview of the research about the history and the economics of guilds.11In Aachen, where the production and processing of copper had �ourished, restrictive guilds impeded technical
innovations, causing a large decline of production during the 18th century (Kellenbenz (1977), p. 494). Kisch (1989)illustrates how guilds hampered the introduction of modern production techniques in the Rhineland, and Lindberg(2009) argues that guilds prevented the introduction of modern trade organizations in Danzig and Lübeck.
12See Aghion, Bloom, Blundell, Gri�th, and Howitt (2005) for an analysis of the e�ect of competition on innovation.13This can be illustrated by the case of an entrepreneur in the Kingdom of Württemberg who wanted to construct
a cotton spinning mill in the Swabian city of Urach in the mid-18th century, but the o�cials refused his request for alicense to protect the local linen weaver guild (Arns (1986)). Other examples for the Kingdom of Württemberg andthe Grand Duchy of Baden are reported in Arns (1986) and Fischer (1962).
10
an easier access to trade licenses and other improvements in economic freedom (Gewerbefreiheit),
the timing of this reform proxies for a broad lowering of barriers to entry and more democratic access
to economic gains.
Another consequence of the French occupation was the introduction of the code civil. The French
established a legal system that separated the judiciary from the public administration, and by which
all citizens should be treated as equal before the law (Schubert (1977)). Clear rules were set both in
civil and trade law which made it easier to establish a business and therefore increased the potential
for innovation. Before the French invasion, patrimonial jurisdiction (Patrimonialgerichtsbarkeit)
existed in all German states (Werthmann (1995)). The judiciary was not separated from the local
administration under patrimonial jurisdiction. In rural districts, for example, the local lord of the
manor was often not only one of the largest landowner but also the mayor, the judge and the person in
charge of the local police. While the introduction of the code civil revoked patrimonial jurisdiction in
territories under French rule, this practice survived in most of the non-occupied German states for a
long period of time.14 Having a fair judicial system that respects private property is a fundamental
aspect of an innovative society. By contrast, under a system of extracting institutions, lack of
protection for the gains from innovation leads to a low incentive to innovate in the �rst place. The
implementation of a judicial system that enforces property rights can therefore be a tremendous
force in promoting innovation.
A third way in which the French invasions hampered the power of the existing privileged classes
and fostered innovation was trough the abolition of serfdom and the subsequent implementation of
agrarian reforms. At the end of the 18th century, the manorial system still existed in German states
(Blum (1978) and Dipper (1980)). A small group of noblemen, the lords of the manor, owned a
high proportion of the land. Their large estates were subdivided in parcels, which were individually
cultivated by tributary serfs. This system was ended in two steps as a result of the French invasion.
First, serfdom was abolished so that the tributary peasants gained individual freedom, which in
turn increased labor market mobility (Dipper (1980)). However, the peasants were still economically
dependent on the lords of the manor, who owned the land. Therefore, agricultural reforms aimed at
14In 1849, not only the patrimonial courts but also the police powers of the local lords of manor were abolished.However, in some parts of Prussia, alleviated police powers were o�cially reintroduced in 1853 (Werthmann (1995)).At least in the Eastern provinces of Prussia the local lords of the manor dominated both economically and in theadministration up into the 20th century (Wagner (2005)).
11
transferring the ownership of the land to the peasants were subsequently undertaken.
The speci�c design of the agricultural reforms varied across German states, but there was a
common feature: the tributary peasants were allowed to take the ownership of the land that they had
cultivated, but they had to compensate the lord of the manor to some extend, either by installment
payments or by the cession of parts of their newly gained land (Achilles (1993)). Similarly to the
abolition of guilds, agricultural reforms did not only take place in occupied regions. However, in
non-occupied German states the rulers started the process of agricultural reforms on average later
and it took much longer to implement. Furthermore, the way in which the reforms were implemented
di�ered greatly across and within German states. In the Eastern provinces of Prussia, which were
not occupied by the French, the agricultural reforms were less e�ective in breaking the economic
power of the old elites, since the compensation rules were designed more in favor of the lords. As a
result, even after the reforms, a high proportion of land was still owned by a small group of noblemen
(Eddie (2008)). Thus, both the abolition of serfdom and the subsequent agrarian reforms reduced
the power of the local elites.
As a whole, these institutional changes were a revolution in the way local communities operated
and increased the economic incentives and the potential for innovation.
3 Data
To test our hypothesis, that institutional change a�ects innovation, we construct a novel and unique
data set by hand-collecting detailed county-level information on Imperial Germany. Due to restric-
tions on the availability of data, we focus our analysis on three years: 1890, 1900 and 1910. Before
1877 the patent law was not harmonized within Germany and, as such, there is no nationwide patent
data available.15 The selection of our benchmark years is also dictated by the availability of accurate
population �gures extracted from the o�cial population census records. We end our analysis in 1910
to avoid the contamination of our results with potential e�ects caused by the economic and social
disruptions of the World Wars.
During the period of our analysis, the German Empire was constituted by 25 federal states.
Prussia, which accounted for more than half of Germany's population and area, was organized in
15The French patent law was neither incorporated in German states after 1815, nor did it shape the German patentsystems that emerged during the 19th century. See Kurz (2000) for the history of the German patent law.
12
provinces (Provinzen), which were subdivided in regions (Regierungsbezirke), and each region was
subdivided in numerous counties (Kreise). The medium-sized German states only used regions and
counties as organizational units, and the small states were only subdivided in counties. We use data
on the county-level, the smallest unit for which population data is available. After adjusting for
changes in the administrative structure we obtain a �nal sample of 975 counties per year covering
all 25 federal states of the German Empire.16
3.1 Patents
As a proxy for innovation, our object of study, we use high-value patents per million inhabitants.17
We obtain data on high-value patents from Streb, Baten, and Yin (2006), who provide information
regarding the geographic distribution of patents, whether they were �led by an individual or a �rm,
and the technological class of the patent. High-value patents are de�ned as patents with a lifespan
of at least 10 years, with a maximum length of 15 years. Due to the fact that a patentee had to pay
an annual charge to renew a patent, one can assume that these patents represent �nancially valuable
products or production technologies (Streb, Baten, and Yin (2006)). We include patents granted to
both German individuals and �rms. Panel A of Table 1 reports descriptive statistics on patents per
million inhabitants separately for counties that were occupied by the French at the beginning of the
19th century and for non-occupied counties. The mean number of patents per capita is distinctly
higher in occupied counties for all benchmark years.
3.2 Institutional Reforms and French Occupation
We measure the degree of inclusiveness of local institutions with the variable Reforms. This variable
is an index calculated as the average of the number of years between the implementation of a reform
and the year a patent is �led (1890, 1900 or 1910). It takes into account four types of institutional
reforms: (i) the introduction of the code civil that guarantees equality before the law, (ii) the
abolition of serfdom, (iii) the implementation of agrarian reforms, and (iv) the dissolution of guilds.
The Rhineland, for example, has a reform index value of 100.25 for 1900, based on the average of
the following reform scores (year of implementation of the reform in brackets): code civil: 98 (1802);
16See the appendix for further information on the data presented in this section.17For a discussion of patents as a measure of innovation see, for example, Griliches (1990) and Streb (2016). In
section 4.5, we also focus on high-tech patents as those may better capture disruptive innovation.
13
serfdom: 102 (1798); agrarian reform: 96 (1804); guilds: 105 (1795).
This reforms index was introduced by Acemoglu, Cantoni, Johnson, and Robinson (2011) to
study the impact of institutional reforms on urbanization, which they use as proxy for economic
growth. There are two main di�erences between our reforms index and the one they use: First,
they use highly aggregated data, and as a consequence their index is constructed at the level of
German states and at the province-level for Prussia and Bavaria. We, on the other hand, collected
additional data in order to include smaller German states and regions that were not covered in their
paper. Second, we use the data at the county level in order to alleviate measurement error concerns
inherent in a province level analysis. As a consequence, our panel consists of 975 counties per year
instead of the 19 provinces and states used in Acemoglu, Cantoni, Johnson, and Robinson (2011).18
Panel A of Table 1 contains information on the average reforms index in occupied and non-
occupied areas in our sample. Consistent with the view that French occupation led to more inclusive
institutions, we observe that the reforms index is about 12 years higher in occupied than in non-
occupied counties.
In our empirical analysis, we use the variable Years French Occupation as an instrument for
Reforms. Years French Occupation is de�ned in the same way as in Acemoglu, Cantoni, Johnson,
and Robinson (2011). A county is classi�ed as occupied if it was under direct French rule or under
the rule of a French-controlled satellite state. The latter include the Grand Duchy of Berg, the
Kingdom of Westphalia, and the Grand Duchy of Frankfurt, which were ruled by Napoleon's family
members. We use historical maps to obtain information about French occupation in all territories
that are not considered in Acemoglu, Cantoni, Johnson, and Robinson (2011) and to break the data
down to the county-level. The period of French occupation ranges from 0 to 19 years. Summary
statistics for Years French Occupation are reported in Panel B of Table 1.
3.3 Basic Control Variables
In our empirical analysis we include a battery of control variables in order to account for alternative
forces that could be associated with regional variation in innovation.
Population density, measured by the number of inhabitants per square kilometer (Population/Km2),
is used to control for urbanization. We use population density as a proxy for economic prosperity
18In Section 4.6 we show that our results are robust to di�erent ways of measuring institutional reforms.
14
during our sample period (Ciccone and Hall (1996); Acemoglu, Johnson, and Robinson (2002)).
Furthermore, urban areas may obtain better provision of public infrastructure or better allow for
spillover of knowledge, which could then lead to more innovation. Summary statistics for Popula-
tion/Km2 are presented in Panel A of Table 1.
Another potential confounding e�ect is the access to e�cient means of transportation. A county
that is well connected may have a market reach that is larger than one with large transportation
barriers. Indeed, Sokolo� (1988) shows that for the early period of industrialization in the northeast
of the United States there is a signi�cantly positive relationship between patenting activity and local
access to waterways. In the late nineteenth century, waterways played an important role for the
transport of bulk commodities. Inland water transport was much cheaper than railway transport
(Wolf (2009)). Therefore, the production of industrial materials, such as iron and steel works, was
largely located along rivers. Hence, we control for both the local access to navigable rivers and
harbors with the variables River and Harbor, respectively. Counties that had access to both a river
and a harbor might be especially innovative, so we also take the interaction e�ect of river and harbor
into account.
A large endowment of natural resources is an additional factor that we consider. If the French
occupation was purposely or by chance correlated with the existence of natural resources, this could
bias our results. We control for the existence of coal and ore deposits, two of the most important
natural resources at this time, with the variables Coal Deposits and Ore Deposits. Coal Deposits is a
dummy that is equal to one if coal deposits are located in the respective county, and zero otherwise.
Similarly, Ore Deposits is a dummy variable that is equal to one if deposits of iron ore or non-ferrous
metals (e.g. copper) are located in the respective county, and zero otherwise.
We also control for the possibility that foreign culture or international trade opportunities may
drive our results. We do so by including the variables Border and Border France in our regressions.
Border is a dummy that takes the value of 1 if the county is at an external border, and zero otherwise.
Border France is a dummy variable that takes the value of 1 if the county is at the border to France,
and zero otherwise.
In an attempt to account for the degree of innovation prior to the French occupation, we control
for the presence of universities in the county in 1789 with the variable University 1789. Universities
may re�ect an interest in the advances of science and technology, and provide training that could
15
later lead to innovation and economic growth (Cantoni and Yuchtman (2014)). By including this
variable in our regressions we aim to control for di�erences in the local propensity to innovate that
pre-date the Napoleonic invasions.
The level of local innovativeness could also be driven by cultural factors. Max Weber postulated
the famous Protestant work ethic, namely that Protestants are more hard working than Catholics
(Weber (1920)). Becker and Woessmann (2009) �nd for Prussia that Protestant counties are indeed
more prosperous than Catholic counties, although they suggest that this e�ect is not driven by their
work ethic but instead by higher incentives to invest in human capital. To measure a potential e�ect
of Protestantism on innovation, which could be either driven by a better work ethic or better human
capital, we include Protestant %, which measures the share of protestants in each county.
During our sample period, the German Empire included territories where German was not the
native language for a large fraction of the population. Although in total, these minorities represented
only 7% of the German population, there is large cross-sectional variation with non-native speakers
accounting for the majority of population in some counties. In particular, this was the case for
the Polish-speaking population in the Eastern Prussian provinces. To rule out the concern that
the spatial distribution of minorities drives our results, we include data on non-German-speaking
population, which we extracted from the o�cial German population census records. Due to the fact
that the non-native German speakers were clustered in only a small number of counties, we include
the dummy variable Minorities that is equal to one if the fraction of the population whose native
language is not German is above 50 percent, and zero otherwise.
In addition, we control for Prussia (in the borders of 1816) in our baseline speci�cations . This
is akin to including a geography �xed e�ect for Prussia. Note, that Prussia is the only state that
is large enough to have enough within state variation in institutions to allow for such a 'geography
�xed e�ect' as the other German states are usually of the size of a Prussian province, if not smaller.19
Moreover, we include the variable City State as a control, which is a dummy variable that takes
the value of 1 for Hamburg, Bremen and Lübeck (the city states that existed within the German
Empire), and zero otherwise. We control for these states for two reasons. First, Hamburg, Bremen
and Lübeck were major harbor cities. Napoleon essentially occupied these cities in 1806 to maintain
19The reason we take Prussia in 1816 is that the time period from 1816 to 1864 is the longest one for which therewere no major territorial reorganizations in Germany in the 19th century. This suggests that this is the territorialstructure that is most appropriate in our setting.
16
the continental blockade against Great Britain. Second, agricultural reforms were not relevant in
city states, as city states incorporated hardly any agricultural land. As such, in the case of city
states, our index captures only three of the four institutional reforms.
Panel B of Table 1 presents the summary statistics for all time-invariant control variables, which
we use in our basic regressions.
4 Results
In our empirical setting we exploit the timing and geography of the French occupation of parts
of Germany following the French Revolution as an exogenous shock to the inclusiveness of local
institutions. Even though prior to the French occupation German institutions were homogeneous
across counties, there were signi�cant changes ex-post.
4.1 Determinants of French Occupation
In section 2 we argue that the French occupation was not driven by economic, but instead by military
and geo-strategic considerations. We now provide empirical support for this claim. In particular, we
test whether pre-1789 controls including geographic aspects such as the existence of rivers, harbors
coal and ore deposits predict the length of French occupation. If our argument is valid, we would
expect to �nd the coe�cients associated with these variables to be insigni�cant and the R2 to be
close to zero. Our results are presented in Table 2. In addition to the model with equally weighted
observations, reported in column 1, we use a model with weighted observations in column 2 to
account for di�erences in the county size. Since for the early nineteenth century population data is
not available on the county level, we weight the observations by the area size of each county.20 To
account for possible spatial correlations, we cluster standard errors at the regional level. Overall,
the �ndings in both models support our assumption. City State is statistically signi�cant in both
speci�cations. The statistically signi�cant loading on the variable City State can be explained by
the strategic importance of these cities. All three German city states were occupied in November
1806 to enforce the Continental Blockade due to the fact that these cities had important ports that
20An additional argument to weight observations by area is that due to military motives the French occupationmight be in�uenced by the area size of a county. In our subsequent models, where we use data for 1890, 1900 and1910, we weight our observations by county population.
17
had to be controlled in order to avoid the contraband trade with Britain. Furthermore, these three
cities are geographically clustered in one part of Germany so that it is natural that either all of
them or none of them would be occupied. All other variables are insigni�cant, except for Harbor in
column 2. The negative coe�cient of Harbor does not support the view that harbor counties were
on average occupied for a longer period of time. We also note that the R2 of the regression is below
3% which suggest that taken as a whole, these factors that were seen as important determinants
of economic prospects at the time of the French revolution, did not dictate the geography of the
occupations.
4.2 First Stage: The Impact of the French Occupation on Institutions
The �rst step in our empirical analysis is to formally study the impact of the Napoleon occupation
of parts of Germany on the inclusiveness of local institutions. In this �rst stage, we test whether
counties that were occupied the longest by the French were also more likely to implement reforms
that increased the inclusiveness of the local institutions. We thus use the length of the French
occupation as an instrument for Reforms. We also include in our speci�cation other important
controls that vary across counties and could therefore directly a�ect local innovation.
The result, presented in column 1 of Table 3, shows an economically and statistically signi�cant
relationship between Years French Occupation and Reforms. An additional year of French occupa-
tion is associated with an anticipation of institutional reforms by 1.59 years, on average. Moving
from no occupation to the maximum length of French occupation represents a 65% increase in Re-
forms, relative to the average in our sample. The F-statistic for the excluded instrument is 60.52
which attests the strength of the instrument. Having established that the French occupation a�ects
Germany institutions at the county level we proceed to our main task of studying the impact of
institutions on innovation.
4.3 Main Results: The Impact of Institutions on Innovation
In order to test our main hypothesis, that the inclusiveness of institutions impacts innovation, we
study the e�ect of the instrumented Reforms on innovation, which we proxy with patents per capita.
We weight our observations by population to avoid the possibility that a group of small counties
18
(population wise) could bias our estimates.21 The standard errors are clustered at the regional level
to allow for correlation of the error terms within a region across the three years in our sample (1890,
1900 and 1910).22
Column 2 of Table 3 contains the main �nding of the paper. There is a strong relationship
between the inclusiveness of institutions in a county and its innovativeness. The coe�cient of
0.405 implies that, evaluated at the mean, going from 0 to 19 years of French occupation, which
is equivalent to a change from no treatment to maximum treatment, leads to an increase of about
129% in the number of patents per capita through the implied change in institutions. This result is
not only economically large, but is also statistically strong since the p-value of Reforms is 0.00%.
This �nding holds after including year �xed e�ects and controlling for other potential determi-
nants of innovation that could, by chance, be correlated with the Napoleonic invasions. In particular,
in order to account for the possibility that counties that have a harbor or access to a navigable river
may be more active in trade, and in turn, that trade could provide incentives for innovation, we
include Harbor, River and River*Harbor as control variables. The variable River is not statistically
signi�cant (p-value of 10.2%), which shows that access to navigable waterways cannot explain the
spatial distribution of German patenting activity at the end of the 19th century. Both Harbor and
River*Harbor are negative and statistically signi�cant. A potential explanation for this �nding re-
lates to the possible specialization of counties with harbors and both rivers and harbors in trade, at
the expense of other economic activities that could produce more innovations, such as manufactur-
ing. Because agglomeration economies could facilitate the transmission of ideas and as such foster
innovation directly, we include population density (Population/Km2) in our model. Our results
exhibit a positive relation between agglomeration economies and innovation (Chatterji, Glaeser, and
Kerr (2014)). The German border counties were on average signi�cantly less innovative, as the coef-
�cient of our dummy variable Border suggests. In addition, we include Border France, for which the
magnitude of the negative e�ect is even stronger. We therefore conclude that border e�ects between
France and German states do not drive our results. In order to account for potential pre-existing
di�erences in the propensity of di�erent counties to engage in innovation, we also control for whether
a county had a university prior to the French Revolution. We �nd no statistically signi�cant coef-
21However, as we discuss in section 4.6, our results are robust to weighting counties equally in the regression.22The 975 counties used in the analysis are distributed across 80 regions.
19
�cient associated with the variable University 1789. The coe�cient of Protestant %, which we use
to control for the share of Protestants in each county, is positive and statistically signi�cant. This
result is consistent with the �ndings of Becker and Woessmann (2009), who argue that Protestant
regions became more developed than Catholic regions as a result of higher incentives to accumulate
human capital. Minorities has a statistically signi�cant negative e�ect on innovation. This result
re�ects the fact that the counties with a high share of non-German inhabitants were all located in
the rural and less developed counties of the Eastern Prussian provinces. For Prussia 1816, we �nd
a negative coe�cient, which could be driven by the fact that agriculture dominated the economy
in the Eastern Prussian provinces.23 The coe�cient of City state is statistically insigni�cant, which
indicates that Bremen, Hamburg and Lübeck, the old and traditional trade cities, were on average
not more innovative than other places. Finally, we �nd no evidence that natural resources were
crucial for innovation since the coe�cients of Coal Deposits and Ore Deposits are both statistically
insigni�cant.
4.4 The Di�erential Impact of Institutions on Innovation in Ecclesiastical States
Institutional change may have a weaker impact on innovation in regions where impediments for the
e�ective implementation of the reforms exist. This could be the case in territories that were domi-
nated by a more conservative population and a more backward administration for a long period of
time. To test whether the e�ect of reforms is weaker in such territories, we focus on counties that
were part of independent ecclesiastical states until the German mediatization of 1803 (Reichsdeputa-
tionshauptschluÿ), when the French restructured the German lands and abolished the ecclesiastical
states. Because of its prominent role in these states, the Catholic Church was a powerful determinant
of social and economic behavior, even compared to other regions with the same fraction of Catholics
in the local population. The impact of the French occupation on innovation could therefore have
been limited by the fact that even after the formal implementation of the reforms, the church re-
mained an important determinant of social and economic behavior, which limited real improvement
in institutions.
During the Kulturkampf (cultural struggle) in the 19th century, the Catholic Church was opposing
23To rule out that our results are driven by di�erences in the share of agricultural employment, we control forsectoral employment shares in section 5.1.
20
both the separation of the church from the state and the modernization of the society (Clark and
Kaiser (2003)).24 The Catholic Church was able to in�uence the daily lives of its believers through
the local clergy. One prominent example of how the Catholic Church aligned its clergy was the
Antimodernisteneid (Oath against modernism) of 1910, which every Catholic clergyman had to
swear. With this oath, the Catholic Church was iterating on the 1864 papal Syllabus errorum, in
which Catholicism was positioned as the antithesis of modernity (Borutta (2003)).
To identify counties that were part of an ecclesiastical state we hand collect data from historical
maps and registers.25 We then create the dummy variable Ecclesiastical 1789 that takes the value of
1 if the county is an ecclesiastical state in 1789, and zero otherwise. Ecclesiastical principalities were
dominated by a Catholic population, a fact that could drive our result. As in our main regression,
we also include the share of Protestants (Protestants % ) in our model to rule out this concern.
Ecclesiastical states were all located in the Western part of the German Empire. For this reason,
and due to the fact that the Eastern Prussian provinces, East Elbia (Ostelbien), were dominated
by agriculture, we exclude East Elbia from our sample. This ensures that our results do not re�ect
structural di�erences between the West and the East.26 We instrument the variables Reforms and
Reforms *Ecclesiastical 1789 with both the years of French occupation and the interaction of the
years of French occupation with Ecclesiastical 1789.27 The results are presented in Table 4. As be-
fore, the coe�cient associated with Reforms is positive and highly signi�cant, indicating a positive
relationship between the inclusiveness of institutions and innovation. Moreover, the interaction of
Reforms with Ecclesiastical 1789 is signi�cantly negative. This con�rms our hypothesis that former
ecclesiastical states may be less prone to increase innovation following an exogenous improvement in
local institutions. Compared to the mean treatment e�ect, the impact that the French occupation
ultimately had on innovation is on average 71% lower in Ecclesiastical states, where institutional
change was less e�ective. In addition, we �nd that former ecclesiastical territories were not more
24See, for instance, the �Kölner Wirrungen� (�Cologne Turmoil�) in which the Catholic Church was opposingthe traditionally Protestant Prussian government on several issues, including mixed marriages between Catholic-Protestant couples and higher education policies (Keinemann (1974)).
25See Appendix A6 for a detailed description of the data sources.26See Appendix A1.2 for a more detailed description of this sub-sample.27More precisely, we estimate two �rst stage regressions, one for Reforms and another one for Reforms*Ecclesiastical
1789. We use both Years French Occupation and Years French Occupation*Ecclesiastical 1789 as instruments in eachof the two �rst stage regressions. Among the two instruments ,we �nd that Years French Occupation is the predom-inant factor determining Reforms, while Years French Occupation*Ecclesiastical 1789 is the primary determinant ofReforms*Ecclesiastical 1789.
21
innovative than other territories as the coe�cient associated with Ecclesiastical 1789 is statisti-
cally insigni�cant. Interestingly, the coe�cient associated with Protestants % becomes statistically
insigni�cant once we control for ecclesiastical state. This suggests that previously documented dif-
ferences between Protestant and Catholic regions may not be driven by work ethic or human capital
(Becker and Woessmann (2009)), but instead by di�erences in governance, conservatism or other
historical legacies associated with former ecclesiastical states.
This result also strengthens our identifying assumption, that the French occupation a�ected
innovation through its e�ect on the inclusiveness of institutions, and not through any other factors
that may also have been in�uenced by the French occupation. If there is an alternative channel
by which French occupation impacted innovation, it not only has to explain our main result - the
e�ect of institutions on innovation in general - but also the weaker impact of institutions in former
ecclesiastical states.28
4.5 Di�erent Types of Innovation
In addition to our main result, we analyze whether our �ndings di�er between high- and low-tech
industries. This distinction is important, as it allows us to better understand the potential impact
of innovation on growth. High-tech industries di�er from low-tech industries in several dimensions:
�rst, innovation in high-tech requires a larger amount of physical and human capital; second, R&D
investment tends to be much riskier in high-tech industries than in low-tech industries; and third,
when successful, high-tech innovation tends to be more disruptive and more conducive to economic
growth. We categorize patents as high-tech based on their technological class. We de�ne high-
tech patents as those in chemicals or electrical engineering; all remaining patents are categorized
as low-tech.29 Both the chemical and the electrical industry were the two booming sectors of the
second industrial revolution (see Henderson (1975) and Streb, Baten, and Yin (2006)). In columns
1 and 2 of Panel A of Table 5 we divide our sample into high-tech and low-tech patents, and redo
our analysis for each of these categories separately. The �rst aspect to note when analyzing these
models is that our �ndings hold for both types of patents separately. Second, and most importantly,
28In section 5, we address potential alternative explanations in detail.29Chemicals include general chemical processes and applications, textile chemistry, fertilizers and dyestu�s; elec-
trical engineering includes electrical trains and railway equipment and electrical equipment in general. See AppendixA2 for further information about the technology classes used by the Imperial Patent O�ce.
22
the results are economically more signi�cant for high-tech patents. For ease of interpretation, we
present the economic magnitudes implied by these results in Panel B. The change in institutions
associated with going from 0 to 19 years of French occupation implies a 288% increase in high-tech
innovation, while the same institutional change leads to a 82% increase in low-tech innovation, when
evaluated at the mean. These results suggest that formal institutions may be especially relevant for
high-tech innovation.
Next, we test whether the e�ect of institutions di�ers if we separately analyze patents �led by
�rms and patents �led by individual inventors. In columns 3 and 4 of Panel A of Table 5 we show
that our results hold for both groups independently. We �nd that going from 0 to 19 years of
French occupation causes institutional reforms that lead to a 197% increase in corporate innovation
and a 64% increase in patents by individuals. One interpretation of these �ndings is that inclusive
institutions are particularly important for corporate innovations, which require a higher amount of
investment in both physical and human capital.
Finally, in column 5 of Panel A we include only high-tech patents �led by �rms. We do so, because
these patents were the ones most associated with subsequent economic growth (Henderson (1975)).
In that regard, focusing on this subsample allows us to further test the view that an important
channel by which inclusive institutions may lead to economic growth is through the creation of an
environment conducive to innovation. As column 5 of Panel A shows, our e�ect also holds for this
subsample. An increase in Reforms associated with going from 0 to 19 years of French occupation
is associated with an increase in the inclusiveness of institutions that leads to a 359% increase in
the number of corporate high-tech patents per capita.30 This result therefore suggests that inclusive
institutions were important historical preconditions for the rise of the German chemical and electrical
industry at the end of the 19th century.
4.6 Robustness Tests
In order to underscore the general and robust nature of our results we perform a series of tests that
altogether alleviate the concern that the relationship we establish is spurious.
In column 1 of Panel A of Table 6 we repeat our analysis without weighting observations by
30We note that the inclusiveness of institutions also has a positive and signi�cant e�ect on all patents that are nothigh-tech patents �led by corporations (the complementary set of patents for corporate high-tech patents).
23
population. Although this could lead our magnitudes to be unrepresentative of the average e�ect of
institutions on innovation, it allows us to exclude the concern that our results are driven by just a
few heavily populated counties. Our results remain highly statistically signi�cant and economically
large.
In columns 2, 3 and 4 of Panel A of Table 6 we test whether our results hold when we separately
analyze the years 1890, 1900 and 1910. We want to exclude the possibility that the pattern we
document is driven by a single year of data, which could raise doubts about the validity and general
nature of our �ndings. We �nd that our results hold for all the years in our sample. When we contrast
the impact of more inclusive institutions in the counties with the longest occupation with those in
unoccupied counties on innovation, we �nd a 231% increase in patents per capita in 1890. The
magnitudes are 129% in 1900 and 100% in 1910. All e�ects are evaluated at the respective sample
mean. The reason that the results are stronger for earlier years can be explained by the fact that
institutions were harmonized across all Germany in 1900. Thus, in 1890 there are still di�erences
in institutions across di�erent parts of Germany; 1900 is the �rst year with harmonized institutions
and by 1910 all counties already experienced at least 10 years of inclusive institutions. The fact that
we �nd signi�cant e�ects even in 1910 is testament to the long term impact of institutional history
on innovation. This highlights the notion that the e�ect of institutional change on innovation is a
relatively slowly decaying process with long lasting e�ects.
The results of further robustness checks are reported in Panel B of table 6. First, we focus on
sub-regions within Germany.31 In column 1 we exclude East Elbia (Ostelbien) from our sample. East
Elbia represents the Prussian provinces East of the river Elbe that were dominated by agriculture.
Therefore, this part of Germany could be a worse control group for the occupied areas. The e�ect
of Reforms remains economically and statistically signi�cant. Likewise, column 2 shows that our
result holds if we perform our analysis only within Prussia, which accounts for more than half of
the German population. The motivation for this test is that a within state analysis may provide a
more homogeneous sample than the German Empire as a whole. In column 3 we restrict our sample
to the Rhineland, Westphalia and Saxony. While the Rhineland, Westphalia, and the Northern
part of the Prussian province of Saxony had been occupied by the French, the old territories of
the Kingdom of Saxony had not been under French rule. This sample selection is motivated by
31See Appendix A1.2 and A1.3 for a description of our sub-samples.
24
the territorial reorganization of German states resulting from the Congress of Vienna. After the
French defeat, Prussia was attempting to be compensated by gaining the whole territory of the
Kingdom of Saxony, which was at the time considered as one of the - if not the most - prosperous
regions of Germany with a high potential for economic growth.32 The United Kingdom and Austria-
Hungary however did not want to give such an economic powerhouse to Prussia. As a consequence,
Prussia could only annex the economically less important Northern part of Saxony, but not its
prosperous heartland (Flockerzie (1991)). In addition, Prussia was compensated with the major part
of the Rhineland and Westphalia. From a Prussian perspective, these regions were considered both
strategically and economically less attractive than Saxony. Interestingly, the regions of Rhineland
and Westphalia, which Prussia gained against its initial intentions, had been occupied by the French
and thus underwent substantial institutional reforms during the occupation. Our results in column
3 provide evidence that the Rhineland and Westphalia became more innovative ex-post due to the
earlier implementation of institutional reforms, although Saxony seemed to be economically more
promising ex-ante. The longest occupied counties implemented institutions that, on average, cause
a 56% increase in innovation relative to the non-occupied counties in this sub-sample.
Moreover, in column 4 of Panel B of Table 6, we replace our instrument Years French Occupation
with an Occupation dummy. This variable takes the value of one if the county was occupied by
the French, and zero otherwise. The e�ect of Reforms on innovation remains economically and
statistically signi�cant. On average, occupied areas implemented institutional reforms 12 years
earlier than non-occupied areas (�rst-stage). In turn, this led to a 73% increase in patents per
capita, compared to the mean in our sample.
Finally, we vary our measure of institutional reforms in columns 5 and 6 of Panel B of Table 6.
First, we use ln(Reforms), de�ned as the natural logarithm of Reforms, in column 5 in order to allow
for a non-linear impact of Reforms on innovation, which decreases the impact of each additional
year of institutional reforms. Using this alternative speci�cation we �nd that the institutional
reforms associated with going from no occupation to longest occupation leads to a 137% increase
in innovation. Second, column 6 shows that our results also hold when we construct an alternative
reforms index: Alternative Reforms. This alternative index di�ers from our main index in that it
includes an additional reform, the year when patrimonial courts were e�ectively abolished in the
32See Kiesewetter (2004) for several economic indicators that underline this argument.
25
respective county. The end of patrimonial justice was a major step towards a society in which all
people are treated equally before the law. While, in some regions, in particular in the Rhineland
where the French occupation lasted longer, patrimonial justice was abolished with the introduction
of the French code civil, it persisted for a longer period of time in states where the old order had
been restored or states that had not been occupied (Werthmann (1995)). As column 6 shows, the
e�ect of institutions on innovation remains highly signi�cant if we use Alternative Reforms as our
main variable of interest. Furthermore, the magnitude of the e�ect is almost the same as the one we
obtain with our main index, which re�ects the fact that our alternative measure is highly correlated
with the basic index and alleviates concerns that measurement error in our index could be a�ecting
our results.33
One interesting question that we are unable to answer with our research design is related to
the individual impact of each institutional reform on innovation. The reason is that the reforms
are highly correlated with each other. Counties that abolished serfdom early also tended to adopt
agrarian reforms early, for example. Thus, we cannot conduct an instrumental variables analysis
using individual reforms as that would violate the exclusion restriction that the instrument (Years
French Occupation) is correlated with the variable of interest (one individual reform) but uncorre-
lated with any other determinants of the dependent variable (the other three reforms). To identify
which institutional reform is the most important driver of innovation is thus beyond the scope of
our paper. This question remains a fruitful area for future research.
5 Alternative Explanations
The French occupation could have brought about several changes in the German economy that
may not be con�ned to institutions. In addition, although the French were not aiming to select
regions to invade based on local economic prospects, it could be that by chance, the regions that
were desirable for strategic reasons were also those that would fare better even in the absence of
the French occupation. In this section we deal with this possibility and address several alternative
explanations for our results. One challenge for all these alternative explanations however is that
they also have to explain why the e�ect of institutional reforms on innovation is weaker in counties
33See Appendix A3.2 for information on Alternative Reforms and A3.3 for a discussion of further reform measures.
26
that were part of an ecclesiastical state prior to the French Revolution (see section 4.4).34
5.1 Reverse Causality: Economic Growth
One potential concern that we attempt to exclude is the possibility that growth leads to innovation
instead of innovation being an engine of growth. If institutional reforms a�ected growth and in
turn, growth fosters innovation, our �ndings could be a result of growth but not of more inclusive
institutions. In this subsection we provide additional evidence that invalidates this interpretation.
In section 4.6 we perform the �rst test to addresses this concern. We stack the cards against us by
comparing innovation in the non-occupied region of Saxony with that in the occupied Rhineland and
Westphalia (column 3 of Panel B of Table 6). The idea behind this test is that Prussia attempted
to obtain Saxony, but was instead compensated with the Rhineland and Westphalia, against its
will. We �nd that, although in 1815 Saxony was seen as economically more promising, ex-post
the Rhineland and Westphalia regions became more innovative due to the inclusiveness of their
institutions. While we believe this test provides strong evidence to rule out reverse causality in our
setting, we control for local economic development to further address this issue and show that our
results remain economically and statistically signi�cant.
The composition of the workforce is our proxy for economic prosperity. We rely on the notion
that counties with a high share of people employed in manufacturing, mining and services were on
average more prosperous and had grown faster than counties that were still dominated by agriculture
at the end of the 19th century (see, for instance, Kuznets (1971)). In order to capture this, we use
the following additional variables. Manufacturing+Mining Workforce % is computed as the share
of people employed in manufacturing and mining relative to the total number of people employed
in each county. Similarly, we compute Services Workforce % as the share of people employed in the
private service sector relative to the total number of people employed in each county. In addition,
we use Mining County, a dummy variable that is equal to one if the share of employees in mining
and primary metal production relative to total employment in manufacturing and mining is larger
than �ve percent in the respective county. Compared to the baseline control variables that merely
measure the existence of coal and ore deposits, the variable Mining County re�ects actual mining
34See the appendix for information on the data used to address the alternative explanations.
27
and metal production.35 It identi�es counties that were specialized in the extraction and processing
of natural resources. By using this dummy, we take into account that mining was one of the leading
sectors of industrialization in Germany due to the availability of natural resources, in particular
coal (Holtfrerich (1973)). Our data considers only the main individual occupation. We compute the
shares for 1900 and 1910 based on the German employment census of 1895 and 1907, respectively.
In column 1 of Table 7 we add to our baseline set of control variables the variables Manufactur-
ing+Mining Workforce % and Services Workforce %. We �nd that the coe�cients associated with
these variables are positive and highly signi�cant, re�ecting the fact that more prosperous counties
produce on average more innovations. A 10 percentage point increase in Manufacturing+Mining
Workforce % is associated with an increase in innovation that corresponds to 18% of the mean of
patents per capita, and a 10 percentage point increase in Services Workforce % is associated with
an increase in innovation that corresponds to 51% of the mean of patents per capita. On the other
hand, the coe�cient for Mining County, which we add to the speci�cation in column 2 is negative,
albeit with a p-value of 12%.
Importantly, the impact of institutions on innovation remains economically and statistically
signi�cant in all columns after including these additional controls. The coe�cient of 0.27 we �nd in
column 2, when we saturate the regressions with all our controls for economic well-being, indicates
that going from 0 to 19 years of French occupation is associated with an increase in the inclusiveness
of local institutions that in turn leads to a 68% increase in innovation, comparing to an increase
of 110% when estimating our baseline speci�cation for the years 1900 and 1910. We also note
that although our results remain economically important, the economic signi�cance drops with the
inclusion of these additional variables. This is not surprising, as economic prosperity is itself a
function of innovation and as such we may be controlling away part of the e�ect we want to capture.
5.2 French In�uence beyond Institutions: Culture, Technology and Knowledge
Transfers
As we show in our �rst stage regression, the French occupations led to the implementation of
important institutional reforms. However, the in�uence of the French may have extended beyond
institutions. In particular an entrepreneurial culture or knowledge and technology transfers from
35The results are robust to choosing di�erent thresholds for the dummy variable.
28
the French to the Germans are alternative channels by which the occupation may have impacted
the propensity to innovate. We now show that these channels are unlikely to explain our �ndings.
Both the transmission of French culture and the potential for technology and knowledge transfers
should be higher for German counties that border with France. This is not only because border
counties were more likely to be occupied by the French, but also because German-French interactions
should be stronger at the border to France, leading those German border regions to be those most
susceptible to be in�uenced by access to French culture and in the most favorable position to
bene�t from knowledge spillovers. We would thus expect that if our �ndings were driven by culture,
technology or knowledge transfers, we should �nd a positive coe�cient (or at the very least an
insigni�cant one) for the variable Border France. However, we �nd that the impact of Border France
is signi�cantly negative after including Reforms in the second stage regression (column 2 of Table
3). We interpret this as evidence that the increase in innovation, which we document in occupied
areas, is not driven by the import of culture, technology or knowledge.
In addition, our results are robust to separating the sample into high- and low-tech patents.
Both the modern chemical industry and the electrical industry, the high-tech sectors of this period,
expanded at the end of the 19th century, long after the French occupation. By that time, Germany
was the leading producer of dyestu�s, pharmaceuticals and other chemical products, while France
lagged behind in these sectors (Henderson (1975), pp. 186-198). This timing and the fact that our
results are stronger for high-tech patents make it unlikely that the French brought technological
knowledge that fostered innovation. If they did, it had to be technology that would become valuable
for innovation several decades later and in areas where the French did not seem to have a comparative
advantage themselves.
To strengthen our arguments further, we contrast the level of industrial development in 1846
and 1861 for German regions that were occupied by the French relative to unoccupied territories.
We �nd no evidence that occupied regions operated with a technological advantage in the early
and mid 19th century, which again suggests that direct technology transfer or knowledge import is
not a likely driver of our results. Instead, the French created the institutional setting that allowed
occupied areas to be at the forefront of the next wave of innovation, which occurred later in the 19th
century. In Table 8, we report the number of wool weaving looms by German states and Prussian
provinces. We �nd no evidence that according to this metric, occupied territories pro�ted more
29
from textile production technology import from France than non-occupied regions.36 The same
table also reports the number of machine-building factories in absolute and per capita terms. The
most developed regions, according to these �gures, were Saxony, Brandenburg and Wuerttemberg,
which had not been occupied by the French. By contrast, the number of factories was low both in
absolute and relative terms in the regions that had been under French rule. We therefore conclude
that there is no evidence that occupied territories pro�ted more from the transfer of knowledge and
technology than non-occupied regions.
While there is no evidence for technology transfer in high-tech industries, French knowledge could
have been important in sectors related to the early industrial revolution, for example, in the textile
industry. During the Napoleonic Wars, the French textile industry �ourished since British textile
imports were substituted by domestic production as a result of the blockade (Juhász (2015)). In the
Rhineland, which was under French rule, German textile �rms also �ourished in this period (Fehren-
bach (2008), pp. 103-104). Import substitution policy could thus have fostered French technological
transfer in occupied regions. However, there is no evidence that the boom in textile industry during
the occupation had a long-run e�ect on the innovativeness of the regions. By contrast, Kisch (1989)
argues that the textile �rms in the Rhineland su�ered from antiquated machinery after the French
withdrew, since it had been di�cult to keep up with modern British technology during the years of
blockade.
5.3 Trade and Market Integration
Another potential concern relates to the possibility that the French occupied regions could have
experienced a larger increase in international or domestic trade. Because border regions are likely
to be more exposed to international trade, trade but not institutions could be driving the cross-
sectional di�erences in innovation. It is important to note that our baseline speci�cation includes
controls for counties that are at an external border and for counties that have a border with France.
If international trade, and in particular trade with France, was driving our results, we would expect
both of these variables to have a positive coe�cient. However, in column 2 of Table 3 the coe�cients
associated with these variables are negative and statistically signi�cant. Furthermore, import and
export statistics of both the Zollverein (the German customs union pre-dating the Germany uni�-
36We observe the similar pattern, if we take the number of cotton spindles into account.
30
cation in 1871) and the German Empire reveal that France did not dominate German foreign trade.
In 1841, France was only the fourth most important country of origin for German imports, with a
market share of 8.4 percent. This share declined in the following years (Panel A of Table 9). Among
Germany's export destinations, France also ranked fourth with a market share of 11.4 percent in
1841. In addition, the share of German exports destined for France subsequently declined to values
that ranged from 5.4% to 7.3% (Panel B of Table 9). Trade with France was less important than
trade with other European countries like the United Kingdom, Austria-Hungary, Switzerland or the
Netherlands. We therefore argue that there is no empirical evidence that the French occupation
fostered foreign trade with Germany in the long-run nor that such French-German trade could drive
our results.
In addition, as we have shown in section 2.1, the invasions induced a substantial territorial
reorganization that included the dissolution and amalgamation of formerly independent small states.
Against this backdrop, one could be worried that areas that could a�ord to be more politically
fragmented before the French occupation were those with higher economic potential. The territorial
reorganization could then have unleashed economic growth through a positive shock to market
integration (Keller and Shiue (2015)). Failing to control for this factor could bias our estimates if
the geography of territorial reorganizations was correlated with the geography of French occupation.
In Table 10 we address this concern by measuring the degree of potential gains from internal mar-
ket integration using two proxies: Old territories and Old territories/km². Old territories represents
the number of independent territories that existed in 1789 within each region (Regierungsbezirk)
of our sample. We also divide Old territories by squared kilometers to construct the variable Old
territories/km2. We �nd a positive coe�cient associated with the variable Old territories in column
1, and a negative coe�cient associated with the variable Old territories/km² in column 2. Both
coe�cients are however statistically insigni�cant. Our variable of interest, Reforms, remains highly
statistically signi�cant and is of similar economic magnitude as in our baseline speci�cation (Table
3). Moreover, in column 3 we include the variable Internal Border, a dummy variable that is equal
to one if the county was located at an internal border (neighboring state became part of the German
Empire), based on the borders of 1816. In column 4 we control for the membership of a customs
union with the variable Zollverein 1842 (Keller and Shiue (2014)). This variable is a dummy that
equals one if a county was located within a state that belonged to the Zollverein in 1842, and zero
31
otherwise.37 Our results show that belonging to the customs union is associated with a 50% increase
in innovation, when evaluated at the mean of patents per capita. Finally, in columns 5 and 6 we
simultaneously include controls for the number of old territories, borders and customs union. The
variable Reforms which measures the e�ect of institutions on innovation remains highly statistically
signi�cant and the economic magnitudes are similar to those of our baseline speci�cation.
5.4 Human Capital
An additional potential confounding e�ect in our analysis relates to human capital.38 Regions that
were occupied by the French could be better endowed with human capital which would then manifest
itself in more innovation. In our baseline speci�cation we control for the presence of universities
prior to the French occupation. To further address this issue, we include additional controls in our
speci�cation to exclude the possibility that human capital, not institutions, is the driver of more
innovation. In particular, we control for human capital by including three additional variables:
Illiterates 1876 %, University and Technical University.
The variable Illiterates 1876 % is de�ned as the share of illiterates in the conscript age-group of
1875/76, based on the o�cial records of the Imperial Statistical O�ce. The data is only available at
the province level for Prussia and at the state level for all other German territories. Therefore, we
cluster observations at the province-level for all human-capital related speci�cations. University is a
dummy variable that is equal to one if a university was located contemporaneously within a county
in the respective year, and zero otherwise. We include general universities, technical universities,
mining academies, medical universities and higher trade colleges. We also explicitly control for the
presence of technical universities or mining academies as these are the types of universities that
could have a more direct impact on innovation, since they train engineers who may be more likely
to innovate than graduates from non-technical sciences like law or humanities. We therefore include
Technical University as an additional dummy variable that is equal to one if a technical university
or a mining academy existed in a county in the respective year.
The results show a positive correlation between educational attainment and innovation. In
37See the Appendix A7.3 for a detailed explanation of why we choose 1842 as the benchmark year for the Zollverein.Our results are robust to both earlier and later benchmark years.
38Cinnirella and Streb (2013) suggest a positive e�ect of human capital on patenting activity for Prussia. SeeD'Acunto (2014) for another view on the empirical relationship between human capital and innovation.
32
column 1 of Table 11 we �nd that the share of illiterates in a county is negatively correlated with
innovation. A one standard deviation increase in the share of illiterates is associated with a decrease
of 6% of a standard deviation change in patents. In column 2 we �nd that counties with a University
presence were more likely to innovate and in column 3 we �nd a small positive coe�cient associated
with the variable Technical University, although the coe�cients associated with University and
Technical University are not statistically signi�cant. In column 4 we include all three variables in
the same speci�cation and �nd that only Illiterates 1876 % is statistically signi�cant, with a negative
point estimate. Across all four regression models, our variable of interest, Reforms, remains highly
statistically signi�cant and the economic magnitudes are virtually una�ected by the inclusion of the
additional controls for the level of human capital of the local population. The institutional reforms
associated with going from 0 to 19 years of French occupation lead to a 120% increase in innovation
for model 4.
5.5 Financial Development
Finally, we test whether our results are driven by �nancial development. King and Levine (1993)
and Levine and Zervos (1998) provide evidence of a link between �nance and growth with innova-
tion being a central channel. For the case of Germany, Gerschenkron (1962) highlights the strong
relationships between universal banks and large industrial enterprises.39
If the French occupation was correlated with �nancial development, this could be the driver of
the increase in innovation that we document. In Table 12 we add to our baseline speci�cation the
variable Banking Workforce computed as the share of the working population in permille employed
in banking in each county. Like our previously constructed occupational measures, this variable only
takes into account the main occupation. No Banking is a dummy variable that is equal to one for
counties where no one was employed in banking according to this de�nition. As a further robustness
check, we use Banking+Insurance Workforce, which is de�ned as the share of people in permille
employed in banking and insurance. Consequently, No Banking+Insurance Workforce is a dummy
variable that is equal to one for counties where no one was employed in banking or insurance. Our
data is based on the German employment census of 1895 and 1907.
Table 12 shows that both Banking Workforce and Banking+Insurance Workforce have a signi�-
39See Guinnane (2002) for the debate on the role of universal banks in Germany.
33
cantly positive e�ect on innovation. Both No Banking and No Banking+Insurance have a negative
coe�cient, although only No Banking+Insurance is statistically signi�cant. These results con�rm
the importance of �nancial development for innovation. However, the estimate of the impact of
institutions on innovation is barely a�ected by the inclusion of these additional control variables,
which increases our con�dence in our hypothesis that institutions and not �nancial development are
driving innovation in our setting.
6 Conclusion
In this paper, we empirically investigate the impact of institutions on innovation. We use the French
occupation of parts of Germany in the early 19th century as a source of exogenous variation in the
inclusiveness of local institutions. Regions that were occupied longer were early adopters of reforms
that led to more inclusive institutions, creating an economy with fewer barriers to entry and fewer
distortions in local labor and product markets.
These improvements in the quality of institutions in turn a�ected innovation in the long-run.
Our results show that counties that were occupied the longest (19 years), and as a consequence
put in place better institutions earlier on, had 129% more patents per capita than counties with
worse institutions due to zero years of French occupation. We provide evidence that our results
are unlikely to be driven by other potential confounding e�ects that could have been a�ected by
the French occupation. These alternative explanations include reverse causality through economic
growth, French in�uence beyond institutions such as culture or knowledge transfers, trade and market
integration, di�erences in the level of human capital across regions, and �nancial development.
Our results thus point to institutions as a �rst order determinant of innovation. The �ndings
in our paper are also relevant to understand the channel by which institutions may a�ect growth.
Our results support the view that a way through which better institutions may lead to economic
growth is by promoting a free market system and creating an economic environment more conducive
to innovation.
An open question for future research is the identi�cation of 'mediators' between more inclusive
institutions and innovation, or, to put it di�erently, to identify micro-economic channels through
which institutions a�ect innovation. For example, shorter and fairer trials that reduce transactions
34

costs could lead to higher levels of investment in R&D; better institutions could be related to stricter
scrutiny and higher accountability of public o�cials leading to a more e�cient provision of public
goods; and lower frictions in labor markets could lead to a more e�cient allocation of talent in the
economy. Exploring the precise mechanisms that link the inclusiveness of institutions to innovation
remains a fruitful avenue for future research.
35
References
Acemoglu, D., D. Cantoni, S. Johnson, and J. A. Robinson (2011): �The Consequences ofRadical Reform: The French Revolution,� American Economic Review, 101(7), 3286�3307.
Acemoglu, D., S. Johnson, and J. A. Robinson (2001): �The Colonial Origins of ComparativeDevelopment: An Empirical Investigation,� American Economic Review, 91(5), 1369�1401.
(2002): �Reversal of Fortune: Geography and Institutions in the Making of the ModernWorld Income Distribution,� Quarterly Journal of Economics, 117(4), 1231�1294.
(2005): �Institutions as a Fundamental Cause of Long-Run Growth,� in Handbook ofEconomic Growth, ed. by P. Aghion, and S. N. Durlauf, pp. 385�472. Elsevier, Amsterdam.
Acharya, V. V., R. P. Baghai, and K. V. Subramanian (2013): �Labor Laws and Innovation,�Journal of Law and Economics, 56(4), 997�1037.
Acharya, V. V., and K. V. Subramanian (2009): �Bankruptcy Codes and Innovation,� Reviewof Financial Studies, 22(12), 4949�4988.
Achilles, W. (1993): Deutsche Agrargeschichte im Zeitalter der Reformen und der Industrial-isierung. Verlag Eugen Ulmer, Stuttgart.
Aghion, P., N. Bloom, R. Blundell, R. Griffith, and P. Howitt (2005): �Competitionand Innovation: An Inverted-U Relationship,� Quarterly Journal of Economics, 120(2), 701�728.
Alfaro, L., S. Kalemli-Ozcan, and V. Volosovych (2008): �Why Doesn't Capital Flow fromRich to Poor Countries? An Empirical Investigation,� Review of Economics and Statistics, 90(2),347�368.
Arns, G. (1986): Über die Anfänge der Industrie in Baden und Württemberg. DRW-Verlag,Stuttgart.
Banerjee, A., and I. Lakshmi (2005): �History, Insitutions and Economic Performance: TheLegacy of Colonial Land Tenure Systems in India.,� American Economic Review, 95(4), 1190�1213.
Becker, S. O., and L. Woessmann (2009): �Was Weber Wrong? A Human Capital Theory ofProtestant Economic History,� Quarterly Journal of Economics, 124(2), 531�596.
Bernstein, S. (2015): �Does Going Public A�ect Innovation?,� Journal of Finance, 70(4), 1365�1403.
Blum, J. (1978): The End of the Old Order in Rural Europe. Princeton University Press, Princeton.Boldrin, M., and D. K. Levine (2008): Against Intellectual Monopoly. Cambridge UniversityPress, Cambridge.
Borutta, M. (2003): �Enemies at the Gate: the Moabit Klostersturm and the Kulturkampf: Ger-many,� in Culture Wars: Secular-Catholic Con�ict in Nineteenth-Century Europe, ed. by C. Clark,and W. Kaiser, pp. 227�254. Cambridge University Press, Cambridge.
Brown, J. R., G. Martinsson, and B. C. Petersen (2013): �Law, Stock Markets, and Innova-tion,� Journal of Finance, 68(4), 1517�1549.
Burhop, C., and T. Lübbers (2010): �Incentives and Innovation? R&D Management in Ger-many's Chemical and Electrical Engineering Industries around 1900,� Explorations in EconomicHistory, 47(1), 100�111.
Cantoni, D., and N. Yuchtman (2014): �Medieval Universities, Legal Institutions, and theCommercial Revolution,� Quarterly Journal of Economics, 129(2), 823�887.
Chatterji, A., E. L. Glaeser, and W. R. Kerr (2014): �Clusters of Entrepreneurship andInnovation,� in Innovation Policy and the Economy, ed. by J. Lerner, and S. Stern, vol. 14, pp.129�166. University of Chicago Press, Chicago.
Ciccone, A., and R. E. Hall (1996): �Productivity and the Density of Economic Activity,�American Economic Review, 86(1), 54�70.
36
Cinnirella, F., and E. Hornung (2016): �Landownership Concentration and the Expansion ofEducation,� Journal of Development Economics, 121, 135�152.
Cinnirella, F., and J. Streb (2013): �The Role of Human Capital and Innovation in PrussianEconomic Development,� CESifo Working Paper 4391.
Clark, C., andW. Kaiser (2003): Culture Wars: Secular-Catholic Con�ict in Nineteenth-CenturyEurope. Cambridge University Press, Cambridge.
D'Acunto, F. (2014): �Innovating to Invest: The Role of Basic Education,� Working Paper. HaasSchool of Business and UC Berkeley.
Dell, M. (2010): �The Persistent E�ects of Peru's Mining Mita,� Econometrica, 78(6), 1863�1903.Dipper, C. (1980): Die Bauernbefreiung in Deutschland 1790-1850. Kolhammer, Stuttgart.Donaldson, D., and R. Hornbeck (2016): �Railroads and American Economic Growth. A "Mar-ket Access" Approach,� Quarterly Journal of Economics, 131(2), 799�858.
Eddie, S. M. (2008): Landownership in Eastern Germany Before the Great War: A QuantitativeAnalysis. Oxford University Press, Oxford.
Fehrenbach, E. (2008): Vom Ancien Régime zum Wiener Kongress. Oldenbourg Verlag, Olden-burg.
Fischer, W. (1962): Der Staat und die Anfänge der Industrialisierung in Baden, 1800-1850.Duncker & Humblot, Berlin.
Flockerzie, L. J. (1991): �State-Building and Nation-Building in the "Third Germany": Saxonyafter the Congress of Vienna,� Central European History, 24(3), 268�292.
Fogel, R. W. (1964): Railroads and American Economic Growth: Essays in Econometric History.Johns Hopkins Press, Baltimore.
Gerschenkron, A. (1962): Economic Backwardness in Historical Perspective: A Book of Essays.Belknap Press of Harvard University Press, Cambridge.
Gompers, P., and J. Lerner (2001): �The Venture Capital Revolution,� Journal of EconomicPerspectives, 15(2), 145�168.
Griliches, Z. (1990): �Patent Statistics as Economic Indicators: A Survey,� Journal of EconomicLiterature, 28(4), 1661�1707.
Guinnane, T. W. (2002): �Delegated Monitors, Large and Small: Germany's Banking System,1800-1914,� Journal of Economic Literature, 40(1), 73�124.
Hall, R. E., and C. I. Jones (1999): �Why Do Some Countries Produce So Much More OutputPer Worker Than Others?,� Quarterly Journal of Economics, 114(1), 83�116.
Henderson, W. O. (1975): Rise of German Industrial Power, 1834-1914. Maurice Temple Smith,London.
Holtfrerich, C.-L. (1973): Quantitative Wirtschaftsgeschichte des Ruhrkohlenbergbaus im 19.Jahrhundert: Eine Führungssektoranalyse. Gesellschaft für Westfälische Wirtschaftsgeschichte,Dortmund.
Hombert, J., and A. Matray (2015): �The Real E�ects of Lending Relationships on InnovativeFirms and Inventor Mobility,� Working Paper. HEC Paris and Princton University.
Hornung, E. (2014): �Immigration and the Di�usion of Technology: The Huguenot Diaspora inPrussia,� American Economic Review, 104(1), 84�122.
Hsu, P.-H., X. Tian, and Y. Xu (2014): �Financial Development and Innovation: Cross-CountryEvidence,� Journal of Financial Economics, 112(1), 116�135.
Juhász, R. (2015): �Temporary Protection and Technology Adoption: Evidence from theNapoleonic Blockade,� Working Paper. Princeton University and Columbia University.
Keinemann, F. (1974): Das Kölner Ereignis, sein Widerhall in der Rheinprovinz und in Westfalen,Darstellung. Westf. Aschendor�, Münster.
Kellenbenz, H. (1977): �The Organization of Industrial Production,� in The Cambridge Economic
37
History of Europe. 5, The Economic Organization of Early Modern Europe, ed. by E. Rich, andC. Wilson, pp. 462�548. Cambridge University Press, Cambridge.
Keller, W., and C. H. Shiue (2014): �Endogenous Formation of Free Trade Agreements Evidencefrom the Zollverein's Impact on Market Integration,� Journal of Economic History, 74(4), 1168�1204.
(2015): �Market Integration as a Mechanism of Growth,� Working Paper. University ofColorado.
Kerr, W. R., J. Lerner, and A. Schoar (2014): �The Consequences of Entrepreneurial Finance:Evidence from Angel Financings,� Review of Financial Studies, 27(1), 20�55.
Kiesewetter, H. (2004): Industrielle Revolution in Deutschland: Regionen als Wachstumsmo-toren. Franz Steiner Verlag, Stuttgart.
King, R. G., and R. Levine (1993): �Finance, Entrepreneurship and Growth,� Journal of Mone-tary Economics, 32(3), 513�542.
Kisch, H. (1989): From Domestic Manufacture to Industrial Revolution: The Case of the RhinelandTextile. Oxford University Press, New York.
Klippel, D. (1996): Deutsche Rechts- und Gerichtskarte. Keip Verlag, Goldbach.Kogan, L., D. Papanikolaou, A. Seru, and N. Stoffman (2016): �Technological Innovation,Resource Allocation, and Growth,� Quarterly Journal of Economics, forthcoming.
Kortum, S., and J. Lerner (2000): �Assessing the Contribution of Venture Capital to Innovation,�RAND Journal of Economics, 31(4), 674�692.
Kurz, P. (2000): Weltgeschichte des Er�ndungsschutzes: Er�nder und Patente im Spiegel derZeiten; zum Hundertjährigen Jubiläum des Gesetzes betre�end die Patentanwälte vom 21. Mai1900. Heymann, Köln.
Kuznets, S. (1971): Economic Growth of Nations: Total Output and Production Structure. HarvardUniversity Press, Cambridge.
Landes, D. S. (2003): The Unbound Prometheus. Technological Change and Industrial Developmentin Western Europe from 1750 to the present. Cambridge University Press, Cambridge, second edn.
Lehmann-Hasemeyer, S., and J. Streb (2016): �The Berlin Stock Exchange in Imperial Ger-many - A Market for New Technology?,� American Economic Review, forthcoming.
Levine, R., and S. Zervos (1998): �Stock Markets, Banks, and Economic Growth,� AmericanEconomic Review, 88(3), 537�558.
Lindberg, E. (2009): �Club Goods and Ine�cient institutions: Why Danzig and Luebeck Failedin the Early Modern Period,� Economic History Review, 62(3), 604�628.
Michalopoulos, S., and E. Papaioannou (2013): �Pre-Colonial Ethnic Institutions and Con-temporary African Development,� Econometrica, 81(1), 113�152.
Mokyr, J. (1992): The Lever of Riches: Technological Creativity and Economic Progress. OxfordUniversity Press, New York.
Moser, P. (2005): �How Do Patent Laws In�uence Innovation? Evidence from 19th-Century WorldFairs,� American Economic Review, 95(4), 1214�1236.
National Economic Council, and Office of Science and Technology Policy
(2015): �A Strategy for American Innovation,� https://www.whitehouse.gov/sites/default/�les/strategy_for_american_innovation_october_2015.pdf.
North, D. (1990): Institutions, Institutional Change and Economic Performance. Cambridge Uni-versity Press, Cambridge.
Nunn, N. (2008): �The Long Term E�ects of Africa's Slave Trades.,� Quarterly Journal of Eco-nomics, 123(1), 139�176.
Ogilvie, S. (1996): �Proto-Industrialization in Germany,� in European Proto-Industrialization, ed.by S. Ogilvie, and M. Cerman, pp. 118�136. Cambridge University Press, Cambridge.
38
(2014): �The Economics of Guilds,� Journal of Economic Perspectives, 28(4), 169�192.Pfister, U. (2008): �Craft Guilds, the Theory of the Firm, and Early Modern Proto-Industry,� inGuilds, Innovation and the European Economy, 1400-1800, ed. by S. R. Epstein, and M. Prak,pp. 25�51. Cambridge University Press, Cambridge.
Rajan, R., and R. Ramcharan (2011): �Land and Credit: A Study of the Political Economy ofBanking in the United States in the Early 20th Century,� Journal of Finance, 66(6), 1895�1931.
Schubert, W. (1977): Französisches Recht in Deutschland zu Beginn des 19. Jahrhunderts: Zivil-recht, Gerichtsverfassungsrecht und Zivilprozessrecht. Böhlau, Köln.
Seru, A. (2014): �Firm Boundaries Matter: Evidence from Conglomerates and R&D Activity,�Journal of Financial Economics, 111(2), 381�405.
Shane, S. (1993): �Cultural In�uences on National Rates of Innovation,� Journal of BusinessVenturing, 8(1), 59�73.
Sokoloff, K. L. (1988): �Inventive Activity in Early Industrial America: Evidence From PatentRecords, 1790-1846,� Journal of Economic History, 48(4), 813�850.
Solow, R. M. (1957): �Technical Change and the Aggregate Production Function,� Review ofEconomics and Statistics, 39(3), 312�320.
Squicciarini, M. P., and N. Voigtländer (2015): �Human Capital and Industrialization: Evi-dence from the Age of Enlightenment,� Quarterly Journal of Economics, 130(4).
Streb, J. (2016): �The Cliometric Study of Innovations,� in Handbook of Cliometrics, ed. byC. Diebolt, and M. Haupert, pp. 448�468. Springer, Berlin.
Streb, J., J. Baten, and S. Yin (2006): �Technological and Geographical Knowledge Spilloverin the German Empire 1877-1918,� Economic History Review, 59(2), 347�373.
Tian, X., and T. Y. Wang (2014): �Tolerance for Failure and Corporate Innovation,� Review ofFinancial Studies, 27(1), 211�255.
Voigtländer, N., and H. J. Voth (2012): �Persecution Perpetuated: The Medieval Origins ofAnti-Semitic Violence in Nazi Germany,� Quarterly Journal of Economics, 127(3), 1339�1392.
Wagner, P. (2005): Bauern, Junker und Beamte: Lokale Herrschaft und Partizipation im Os-telbien des 19. Jahrhunderts, vol. 9 of Moderne Zeit. Neue Forschungen zur Gesellschafts- undKulturgeschichte des 19. und 20. Jahrhunderts. Wallstein Verlag, Göttingen.
Weber, M. (1920): Gesammelte Aufsätze zur Religionssoziologie. Die Protestantische Ethik undder Geist des Kapitalismus. Mohr, Tübingen.
Werthmann, S. (1995): Vom Ende der Patrimonialgerichtsbarkeit: Ein Beitrag zur DeutschenJustizgeschichte des 19. Jahrhunderts. Vittorio Klostermann, Frankfurt am Main.
Whaley, J. (2012): Germany and the Holy Roman Empire: Volume II: The Peace of Westphaliato the Dissolution of the Reich, 1648-1806, vol. 2. Oxford University Press, Oxford.
Wolf, N. (2009): �Was Germany Ever United? Evidence from Intra- and International Trade1885-1933,� Journal of Economic History, 69(3), 846�881.
39
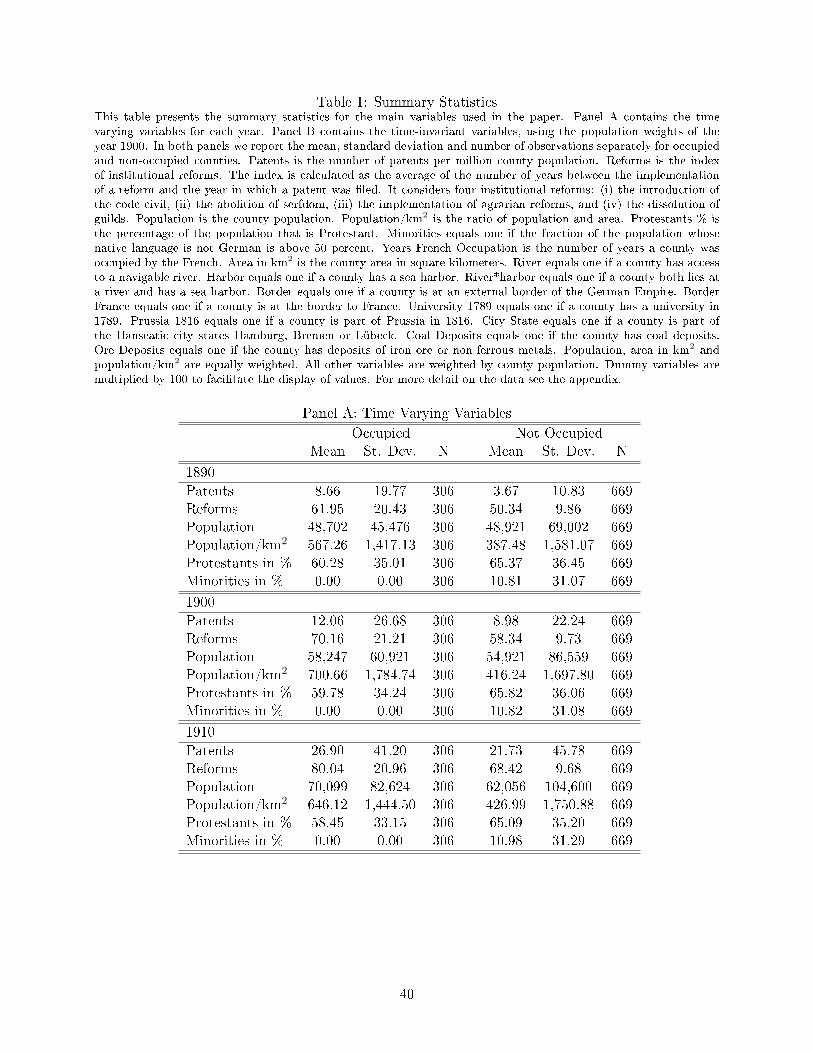
Table 1: Summary StatisticsThis table presents the summary statistics for the main variables used in the paper. Panel A contains the timevarying variables for each year. Panel B contains the time-invariant variables, using the population weights of theyear 1900. In both panels we report the mean, standard deviation and number of observations separately for occupiedand non-occupied counties. Patents is the number of patents per million county population. Reforms is the indexof institutional reforms. The index is calculated as the average of the number of years between the implementationof a reform and the year in which a patent was �led. It considers four institutional reforms: (i) the introduction ofthe code civil, (ii) the abolition of serfdom, (iii) the implementation of agrarian reforms, and (iv) the dissolution ofguilds. Population is the county population. Population/km2 is the ratio of population and area. Protestants % isthe percentage of the population that is Protestant. Minorities equals one if the fraction of the population whosenative language is not German is above 50 percent. Years French Occupation is the number of years a county wasoccupied by the French. Area in km2 is the county area in square kilometers. River equals one if a county has accessto a navigable river. Harbor equals one if a county has a sea harbor. River*harbor equals one if a county both lies ata river and has a sea harbor. Border equals one if a county is at an external border of the German Empire. BorderFrance equals one if a county is at the border to France. University 1789 equals one if a county has a university in1789. Prussia 1816 equals one if a county is part of Prussia in 1816. City State equals one if a county is part ofthe Hanseatic city states Hamburg, Bremen or Lübeck. Coal Deposits equals one if the county has coal deposits.Ore Deposits equals one if the county has deposits of iron ore or non-ferrous metals. Population, area in km2 andpopulation/km2 are equally weighted. All other variables are weighted by county population. Dummy variables aremultiplied by 100 to facilitate the display of values. For more detail on the data see the appendix.
Panel A: Time Varying Variables
�
Occupied Not OccupiedMean St. Dev. N Mean St. Dev. N
1890
Patents 8.66 19.77 306 3.67 10.83 669Reforms 61.95 20.43 306 50.34 9.86 669Population 48,702 45,476 306 48,921 69,002 669Population/km2 567.26 1,417.13 306 387.48 1,581.07 669Protestants in % 60.28 35.01 306 65.37 36.45 669Minorities in % 0.00 0.00 306 10.81 31.07 669
1900
Patents 12.06 26.68 306 8.98 22.24 669Reforms 70.16 21.21 306 58.34 9.73 669Population 58,247 60,921 306 54,921 86,559 669Population/km2 700.66 1,784.74 306 416.24 1,697.80 669Protestants in % 59.78 34.24 306 65.82 36.06 669Minorities in % 0.00 0.00 306 10.82 31.08 669
1910
Patents 26.90 41.20 306 21.73 45.78 669Reforms 80.04 20.96 306 68.42 9.68 669Population 70,099 82,624 306 62,056 104,600 669Population/km2 646.12 1,444.50 306 426.99 1,750.88 669Protestants in % 58.45 33.15 306 65.09 35.20 669Minorities in % 0.00 0.00 306 10.98 31.29 669
40
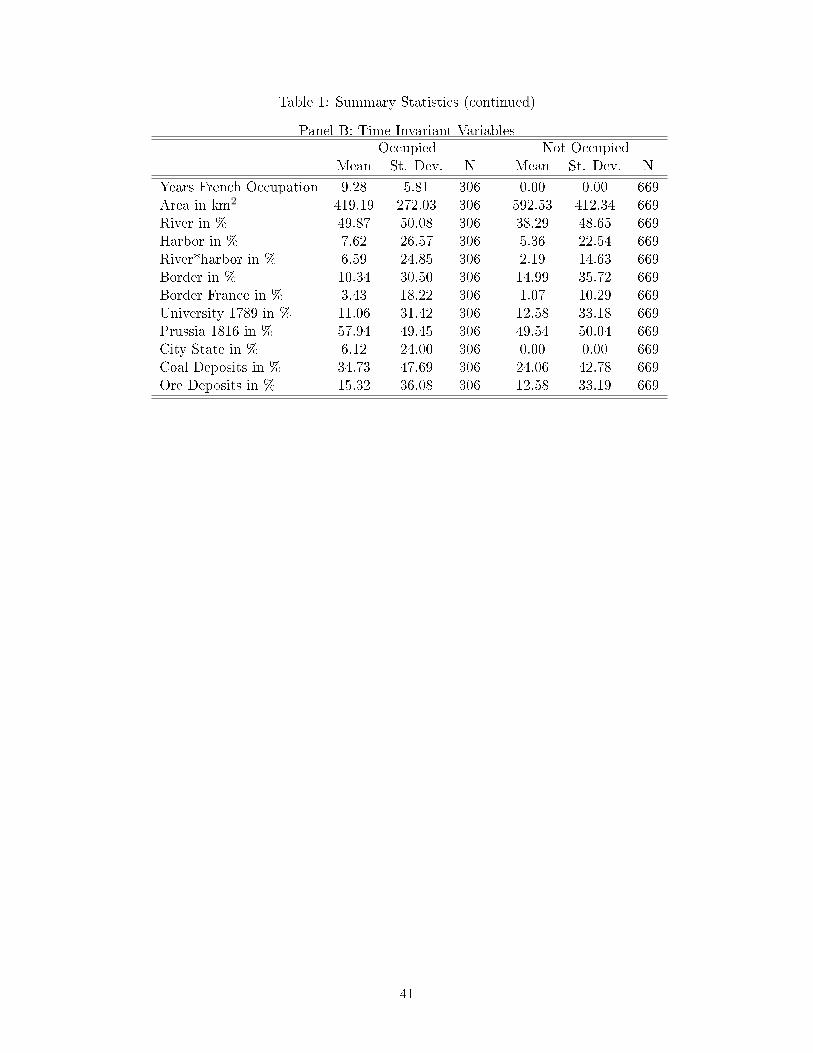
Table 1: Summary Statistics (continued)
Panel B: Time Invariant Variables
�
Occupied Not OccupiedMean St. Dev. N Mean St. Dev. N
Years French Occupation 9.28 5.81 306 0.00 0.00 669Area in km2 419.19 272.03 306 592.53 412.34 669River in % 49.87 50.08 306 38.29 48.65 669Harbor in % 7.62 26.57 306 5.36 22.54 669River*harbor in % 6.59 24.85 306 2.19 14.63 669Border in % 10.34 30.50 306 14.99 35.72 669Border France in % 3.43 18.22 306 1.07 10.29 669University 1789 in % 11.06 31.42 306 12.58 33.18 669Prussia 1816 in % 57.94 49.45 306 49.54 50.04 669City State in % 6.12 24.00 306 0.00 0.00 669Coal Deposits in % 34.73 47.69 306 24.06 42.78 669Ore Deposits in % 15.32 36.08 306 12.58 33.19 669
41
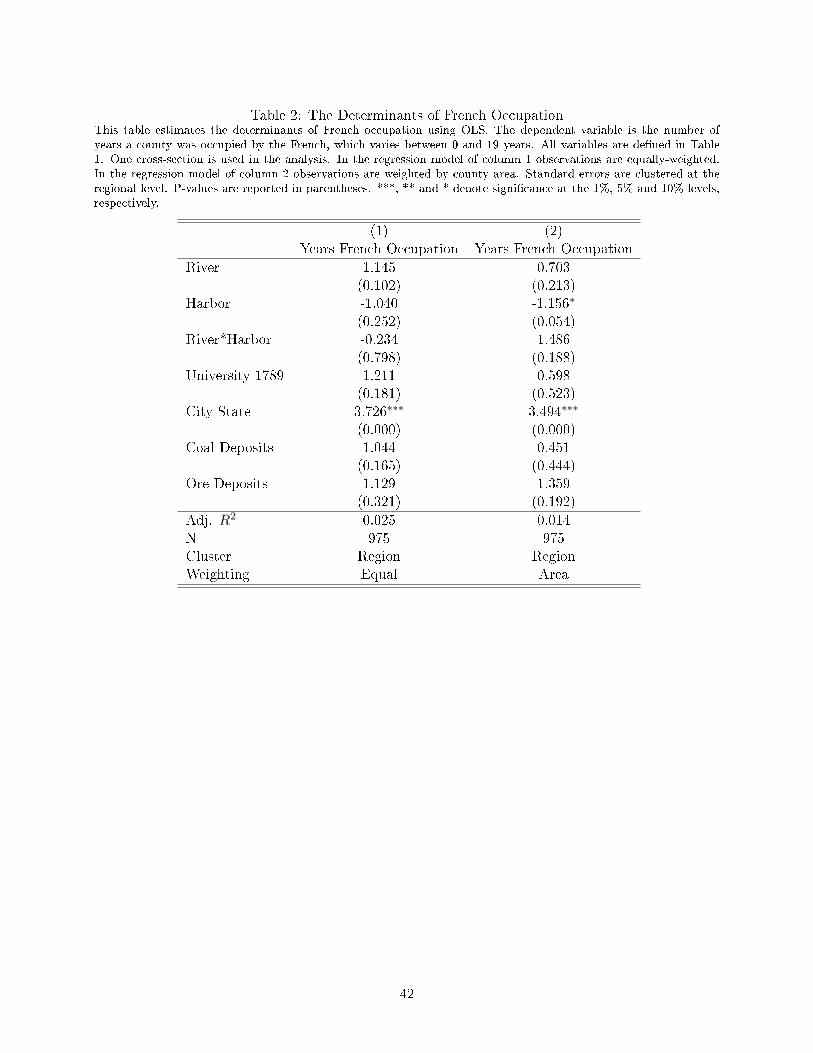
Table 2: The Determinants of French OccupationThis table estimates the determinants of French occupation using OLS. The dependent variable is the number ofyears a county was occupied by the French, which varies between 0 and 19 years. All variables are de�ned in Table1. One cross-section is used in the analysis. In the regression model of column 1 observations are equally-weighted.In the regression model of column 2 observations are weighted by county area. Standard errors are clustered at theregional level. P-values are reported in parentheses. ***, ** and * denote signi�cance at the 1%, 5% and 10% levels,respectively.
�
(1) (2)Years French Occupation Years French Occupation
River 1.145 0.703(0.102) (0.213)
Harbor -1.040 -1.156∗
(0.252) (0.054)River*Harbor -0.234 1.486
(0.798) (0.188)University 1789 1.211 0.598
(0.181) (0.523)City State 3.726∗∗∗ 3.494∗∗∗
(0.000) (0.000)Coal Deposits 1.044 0.451
(0.165) (0.444)Ore Deposits 1.129 1.359
(0.321) (0.192)
Adj. R2 0.025 0.014N 975 975Cluster Region RegionWeighting Equal Area
42
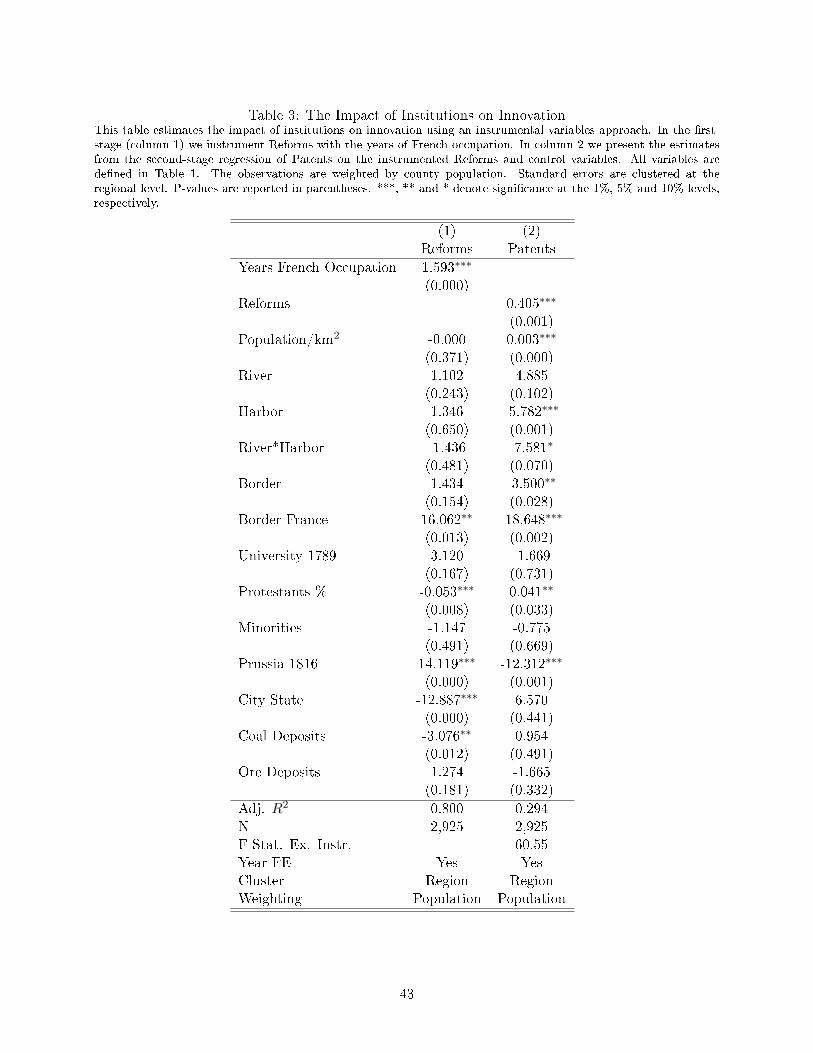
Table 3: The Impact of Institutions on InnovationThis table estimates the impact of institutions on innovation using an instrumental variables approach. In the �rst-stage (column 1) we instrument Reforms with the years of French occupation. In column 2 we present the estimatesfrom the second-stage regression of Patents on the instrumented Reforms and control variables. All variables arede�ned in Table 1. The observations are weighted by county population. Standard errors are clustered at theregional level. P-values are reported in parentheses. ***, ** and * denote signi�cance at the 1%, 5% and 10% levels,respectively.
(1) (2)Reforms Patents
Years French Occupation 1.593∗∗∗
(0.000)Reforms 0.405∗∗∗
(0.001)Population/km2 -0.000 0.003∗∗∗
(0.371) (0.000)River 1.102 4.885
(0.243) (0.102)Harbor 1.346 -5.782∗∗∗
(0.650) (0.001)River*Harbor -1.436 -7.581∗
(0.481) (0.070)Border 1.434 -3.500∗∗
(0.154) (0.028)Border France 16.062∗∗ -18.648∗∗∗
(0.013) (0.002)University 1789 3.120 -1.669
(0.167) (0.731)Protestants % -0.053∗∗∗ 0.041∗∗
(0.008) (0.033)Minorities -1.147 -0.775
(0.491) (0.669)Prussia 1816 14.119∗∗∗ -12.312∗∗∗
(0.000) (0.001)City State -12.887∗∗∗ 6.570
(0.000) (0.441)Coal Deposits -3.076∗∗ 0.954
(0.012) (0.491)Ore Deposits 1.274 -1.665
(0.181) (0.332)
Adj. R2 0.800 0.294N 2,925 2,925F-Stat. Ex. Instr. 60.55Year FE Yes YesCluster Region RegionWeighting Population Population
43
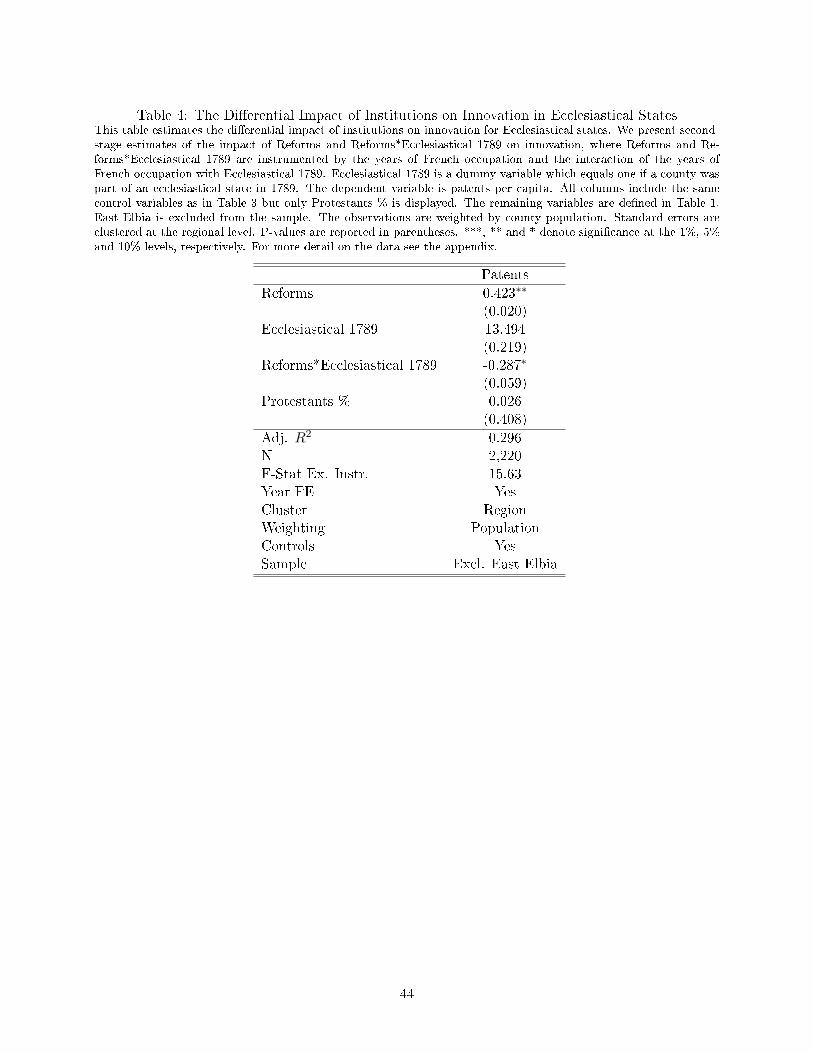
Table 4: The Di�erential Impact of Institutions on Innovation in Ecclesiastical StatesThis table estimates the di�erential impact of institutions on innovation for Ecclesiastical states. We present second-stage estimates of the impact of Reforms and Reforms*Ecclesiastical 1789 on innovation, where Reforms and Re-forms*Ecclesiastical 1789 are instrumented by the years of French occupation and the interaction of the years ofFrench occupation with Ecclesiastical 1789. Ecclesiastical 1789 is a dummy variable which equals one if a county waspart of an ecclesiastical state in 1789. The dependent variable is patents per capita. All columns include the samecontrol variables as in Table 3 but only Protestants % is displayed. The remaining variables are de�ned in Table 1.East Elbia is excluded from the sample. The observations are weighted by county population. Standard errors areclustered at the regional level. P-values are reported in parentheses. ***, ** and * denote signi�cance at the 1%, 5%and 10% levels, respectively. For more detail on the data see the appendix.
�
Patents
Reforms 0.423∗∗
(0.020)Ecclesiastical 1789 13.494
(0.219)Reforms*Ecclesiastical 1789 -0.287∗
(0.059)Protestants % 0.026
(0.408)
Adj. R2 0.296N 2,220F-Stat Ex. Instr. 15.63Year FE YesCluster RegionWeighting PopulationControls YesSample Excl. East Elbia
44
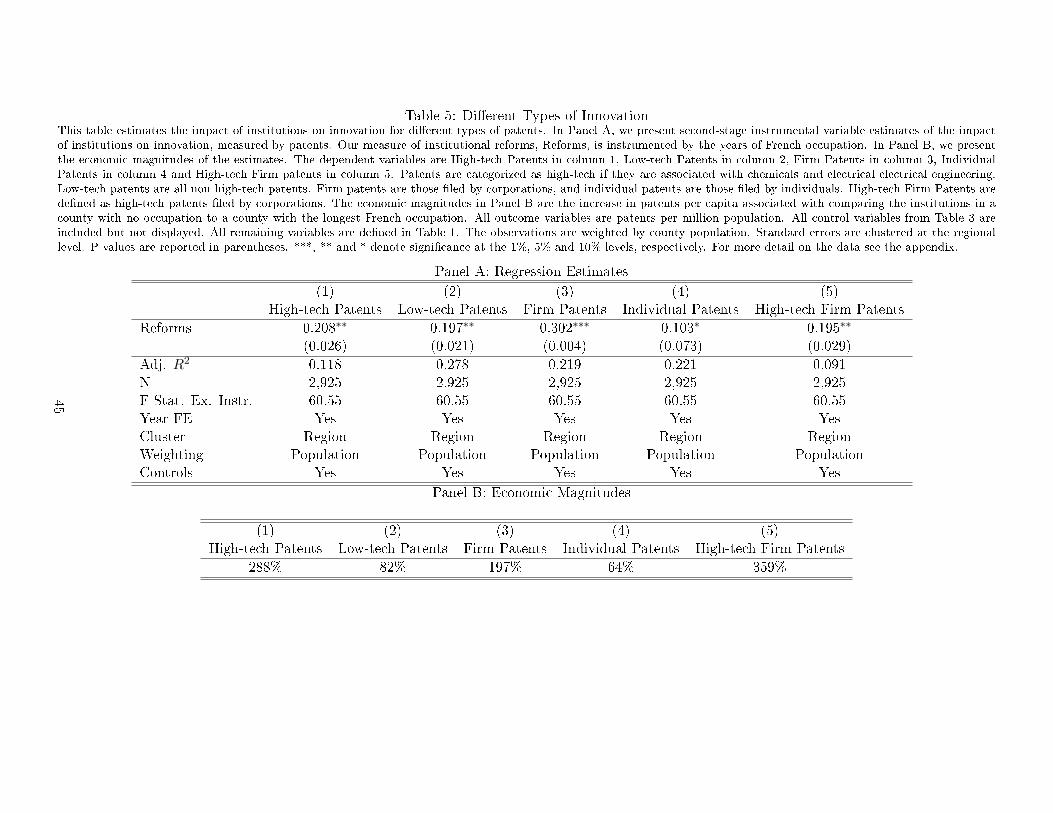
Table 5: Di�erent Types of InnovationThis table estimates the impact of institutions on innovation for di�erent types of patents. In Panel A, we present second-stage instrumental variable estimates of the impactof institutions on innovation, measured by patents. Our measure of institutional reforms, Reforms, is instrumented by the years of French occupation. In Panel B, we presentthe economic magnitudes of the estimates. The dependent variables are High-tech Patents in column 1, Low-tech Patents in column 2, Firm Patents in column 3, IndividualPatents in column 4 and High-tech Firm patents in column 5. Patents are categorized as high-tech if they are associated with chemicals and electrical electrical engineering.Low-tech patents are all non high-tech patents. Firm patents are those �led by corporations, and individual patents are those �led by individuals. High-tech Firm Patents arede�ned as high-tech patents �led by corporations. The economic magnitudes in Panel B are the increase in patents per capita associated with comparing the institutions in acounty with no occupation to a county with the longest French occupation. All outcome variables are patents per million population. All control variables from Table 3 areincluded but not displayed. All remaining variables are de�ned in Table 1. The observations are weighted by county population. Standard errors are clustered at the regionallevel. P-values are reported in parentheses. ***, ** and * denote signi�cance at the 1%, 5% and 10% levels, respectively. For more detail on the data see the appendix.
� Panel A: Regression Estimates
(1) (2) (3) (4) (5)High-tech Patents Low-tech Patents Firm Patents Individual Patents High-tech Firm Patents
Reforms 0.208∗∗ 0.197∗∗ 0.302∗∗∗ 0.103∗ 0.195∗∗
(0.026) (0.021) (0.004) (0.073) (0.029)
Adj. R2 0.118 0.278 0.219 0.221 0.091N 2,925 2,925 2,925 2,925 2,925F-Stat. Ex. Instr. 60.55 60.55 60.55 60.55 60.55Year FE Yes Yes Yes Yes YesCluster Region Region Region Region RegionWeighting Population Population Population Population PopulationControls Yes Yes Yes Yes Yes
� Panel B: Economic Magnitudes
(1) (2) (3) (4) (5)High-tech Patents Low-tech Patents Firm Patents Individual Patents High-tech Firm Patents
288% 82% 197% 64% 359%
45
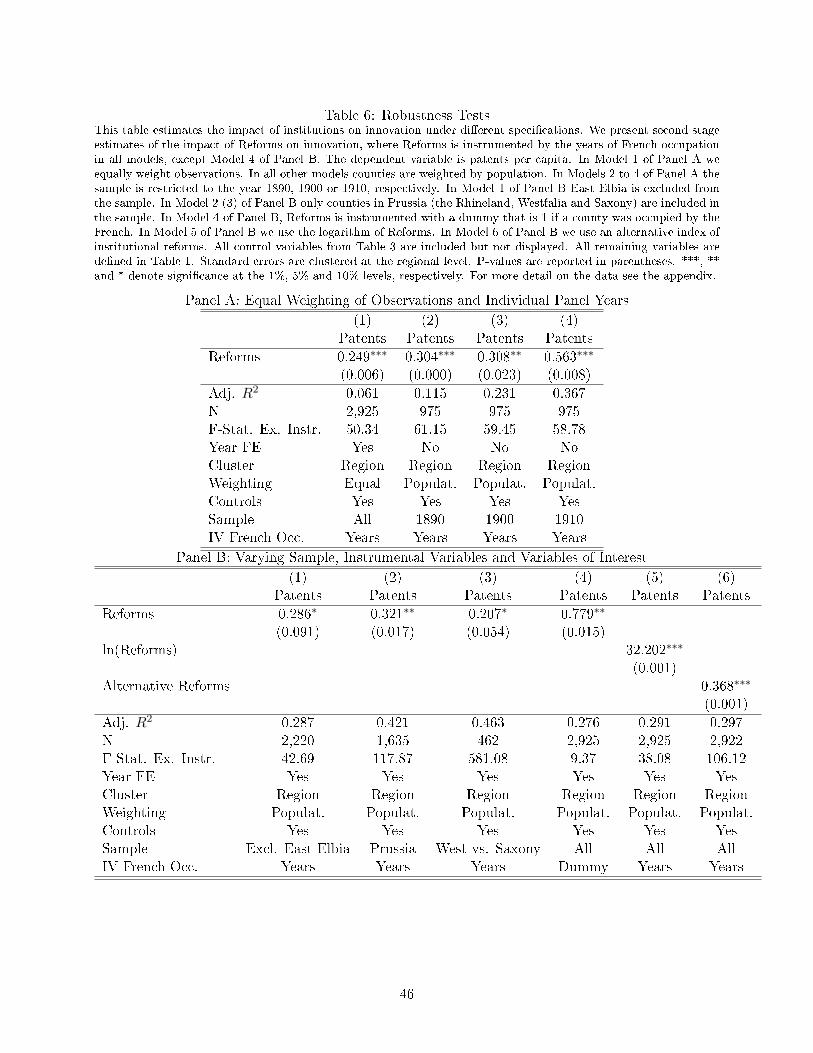
Table 6: Robustness TestsThis table estimates the impact of institutions on innovation under di�erent speci�cations. We present second-stageestimates of the impact of Reforms on innovation, where Reforms is instrumented by the years of French occupationin all models, except Model 4 of Panel B. The dependent variable is patents per capita. In Model 1 of Panel A weequally weight observations. In all other models counties are weighted by population. In Models 2 to 4 of Panel A thesample is restricted to the year 1890, 1900 or 1910, respectively. In Model 1 of Panel B East Elbia is excluded fromthe sample. In Model 2 (3) of Panel B only counties in Prussia (the Rhineland, Westfalia and Saxony) are included inthe sample. In Model 4 of Panel B, Reforms is instrumented with a dummy that is 1 if a county was occupied by theFrench. In Model 5 of Panel B we use the logarithm of Reforms. In Model 6 of Panel B we use an alternative index ofinstitutional reforms. All control variables from Table 3 are included but not displayed. All remaining variables arede�ned in Table 1. Standard errors are clustered at the regional level. P-values are reported in parentheses. ***, **and * denote signi�cance at the 1%, 5% and 10% levels, respectively. For more detail on the data see the appendix.
Panel A: Equal Weighting of Observations and Individual Panel Years
(1) (2) (3) (4)Patents Patents Patents Patents
Reforms 0.249∗∗∗ 0.304∗∗∗ 0.308∗∗ 0.563∗∗∗
(0.006) (0.000) (0.023) (0.008)
Adj. R2 0.061 0.115 0.231 0.367N 2,925 975 975 975F-Stat. Ex. Instr. 50.34 61.15 59.45 58.78Year FE Yes No No NoCluster Region Region Region RegionWeighting Equal Populat. Populat. Populat.Controls Yes Yes Yes YesSample All 1890 1900 1910IV French Occ. Years Years Years Years
� Panel B: Varying Sample, Instrumental Variables and Variables of Interest
(1) (2) (3) (4) (5) (6)Patents Patents Patents Patents Patents Patents
Reforms 0.286∗ 0.321∗∗ 0.207∗ 0.779∗∗
(0.091) (0.017) (0.054) (0.015)ln(Reforms) 32.202∗∗∗
(0.001)Alternative Reforms 0.368∗∗∗
(0.001)
Adj. R2 0.287 0.421 0.463 0.276 0.291 0.297N 2,220 1,635 462 2,925 2,925 2,922F-Stat. Ex. Instr. 42.69 117.87 581.08 9.37 38.08 106.12Year FE Yes Yes Yes Yes Yes YesCluster Region Region Region Region Region RegionWeighting Populat. Populat. Populat. Populat. Populat. Populat.Controls Yes Yes Yes Yes Yes YesSample Excl. East Elbia Prussia West vs. Saxony All All AllIV French Occ. Years Years Years Dummy Years Years
46
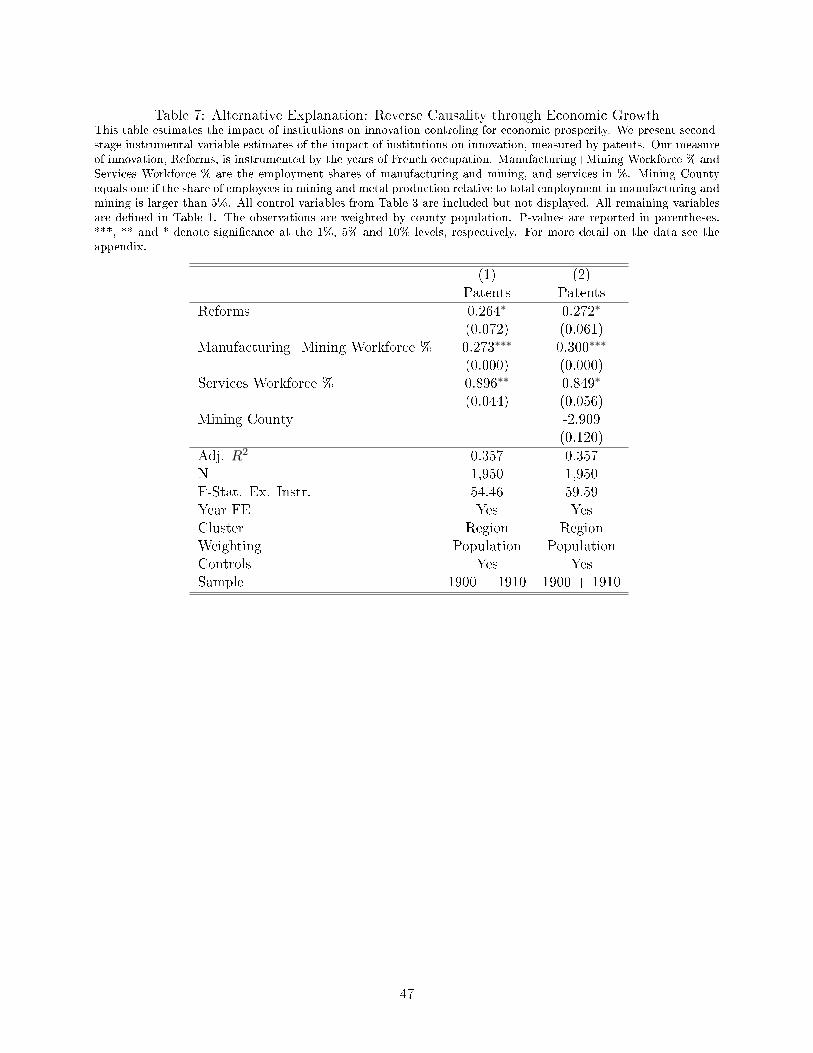
Table 7: Alternative Explanation: Reverse Causality through Economic GrowthThis table estimates the impact of institutions on innovation controling for economic prosperity. We present second-stage instrumental variable estimates of the impact of institutions on innovation, measured by patents. Our measureof innovation, Reforms, is instrumented by the years of French occupation. Manufacturing+Mining Workforce % andServices Workforce % are the employment shares of manufacturing and mining, and services in %. Mining Countyequals one if the share of employees in mining and metal production relative to total employment in manufacturing andmining is larger than 5%. All control variables from Table 3 are included but not displayed. All remaining variablesare de�ned in Table 1. The observations are weighted by county population. P-values are reported in parentheses.***, ** and * denote signi�cance at the 1%, 5% and 10% levels, respectively. For more detail on the data see theappendix.
�
(1) (2)Patents Patents
Reforms 0.264∗ 0.272∗
(0.072) (0.061)Manufacturing+Mining Workforce % 0.273∗∗∗ 0.300∗∗∗
(0.000) (0.000)Services Workforce % 0.896∗∗ 0.849∗
(0.044) (0.056)Mining County -2.909
(0.120)
Adj. R2 0.357 0.357N 1,950 1,950F-Stat. Ex. Instr. 54.46 59.59Year FE Yes YesCluster Region RegionWeighting Population PopulationControls Yes YesSample 1900 + 1910 1900 + 1910
47
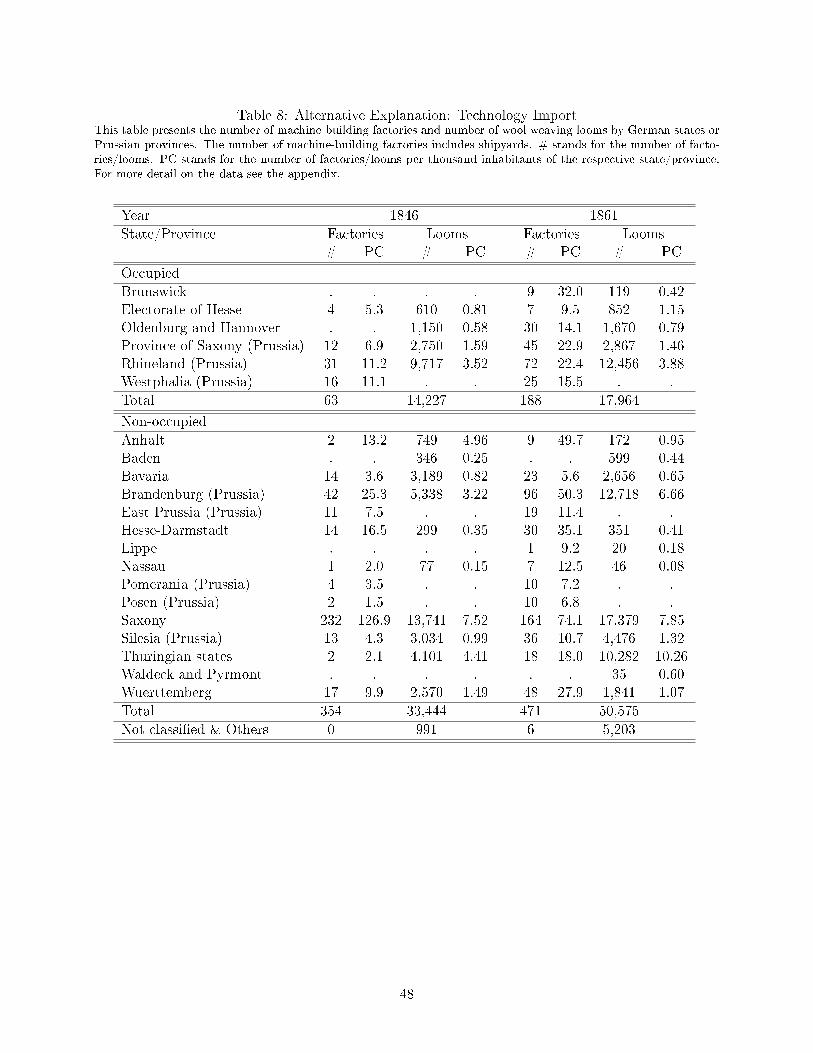
Table 8: Alternative Explanation: Technology ImportThis table presents the number of machine-building factories and number of wool weaving looms by German states orPrussian provinces. The number of machine-building factories includes shipyards. # stands for the number of facto-ries/looms. PC stands for the number of factories/looms per thousand inhabitants of the respective state/province.For more detail on the data see the appendix.
�Year 1846 1861
State/Province Factories Looms Factories Looms# PC # PC # PC # PC
Occupied
Brunswick . . . . 9 32.0 119 0.42Electorate of Hesse 4 5.3 610 0.81 7 9.5 852 1.15Oldenburg and Hannover . . 1,150 0.58 30 14.1 1,670 0.79Province of Saxony (Prussia) 12 6.9 2,750 1.59 45 22.9 2,867 1.46Rhineland (Prussia) 31 11.2 9,717 3.52 72 22.4 12,456 3.88Westphalia (Prussia) 16 11.1 . . 25 15.5 . .
Total 63 14,227 188 17,964
Non-occupied
Anhalt 2 13.2 749 4.96 9 49.7 172 0.95Baden . . 346 0.25 . . 599 0.44Bavaria 14 3.6 3,189 0.82 23 5.6 2,656 0.65Brandenburg (Prussia) 42 25.3 5,338 3.22 96 50.3 12,718 6.66East Prussia (Prussia) 11 7.5 . . 19 11.4 . .Hesse-Darmstadt 14 16.5 299 0.35 30 35.1 351 0.41Lippe . . . . 1 9.2 20 0.18Nassau 1 2.0 77 0.15 7 12.5 46 0.08Pomerania (Prussia) 4 3.5 . . 10 7.2 . .Posen (Prussia) 2 1.5 . . 10 6.8 . .Saxony 232 126.9 13,741 7.52 164 74.1 17,379 7.85Silesia (Prussia) 13 4.3 3,034 0.99 36 10.7 4,476 1.32Thuringian states 2 2.1 4,101 4.41 18 18.0 10,282 10.26Waldeck and Pyrmont . . . . . . 35 0.60Wuerttemberg 17 9.9 2,570 1.49 48 27.9 1,841 1.07
Total 354 33,444 471 50,575
Not classi�ed & Others 0 991 6 5,203
48
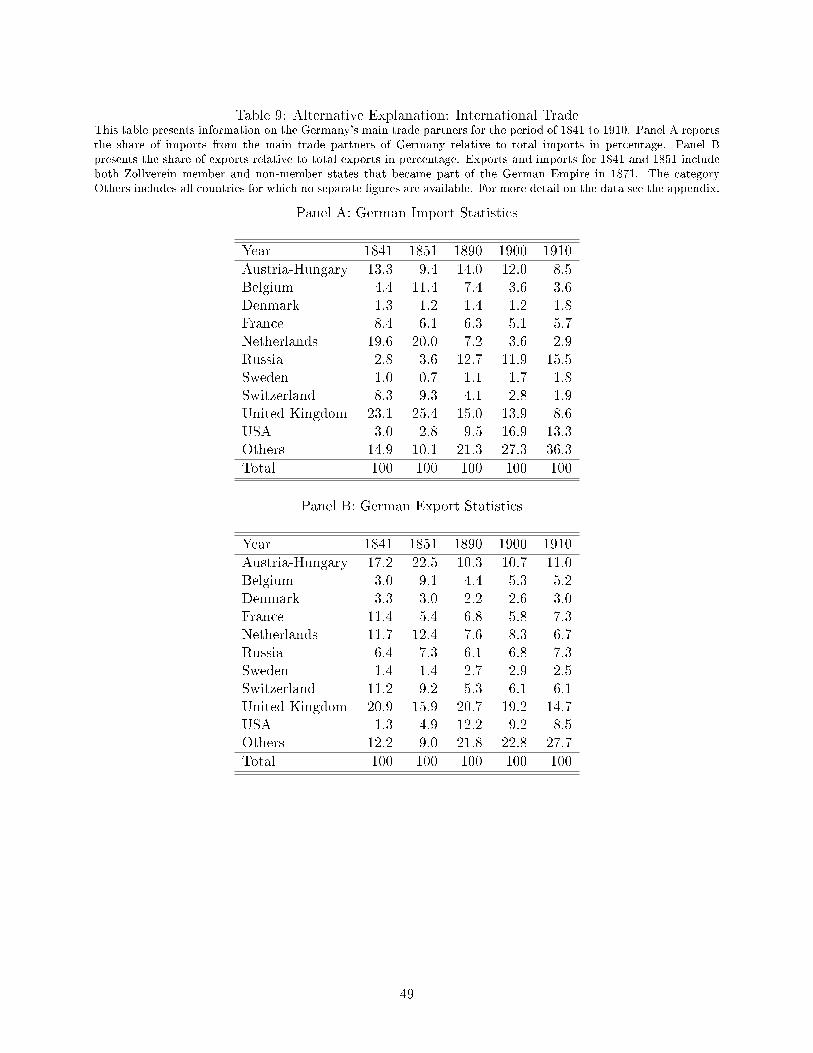
Table 9: Alternative Explanation: International TradeThis table presents information on the Germany's main trade partners for the period of 1841 to 1910. Panel A reportsthe share of imports from the main trade partners of Germany relative to total imports in percentage. Panel Bpresents the share of exports relative to total exports in percentage. Exports and imports for 1841 and 1851 includeboth Zollverein member and non-member states that became part of the German Empire in 1871. The categoryOthers includes all countries for which no separate �gures are available. For more detail on the data see the appendix.
Panel A: German Import Statistics
Year 1841 1851 1890 1900 1910
Austria-Hungary 13.3 9.4 14.0 12.0 8.5Belgium 4.4 11.4 7.4 3.6 3.6Denmark 1.3 1.2 1.4 1.2 1.8France 8.4 6.1 6.3 5.1 5.7Netherlands 19.6 20.0 7.2 3.6 2.9Russia 2.8 3.6 12.7 11.9 15.5Sweden 1.0 0.7 1.1 1.7 1.8Switzerland 8.3 9.3 4.1 2.8 1.9United Kingdom 23.1 25.4 15.0 13.9 8.6USA 3.0 2.8 9.5 16.9 13.3Others 14.9 10.1 21.3 27.3 36.3
Total 100 100 100 100 100
� Panel B: German Export Statistics
Year 1841 1851 1890 1900 1910
Austria-Hungary 17.2 22.5 10.3 10.7 11.0Belgium 3.0 9.1 4.4 5.3 5.2Denmark 3.3 3.0 2.2 2.6 3.0France 11.4 5.4 6.8 5.8 7.3Netherlands 11.7 12.4 7.6 8.3 6.7Russia 6.4 7.3 6.1 6.8 7.3Sweden 1.4 1.4 2.7 2.9 2.5Switzerland 11.2 9.2 5.3 6.1 6.1United Kingdom 20.9 15.9 20.7 19.2 14.7USA 1.3 4.9 12.2 9.2 8.5Others 12.2 9.0 21.8 22.8 27.7
Total 100 100 100 100 100
49
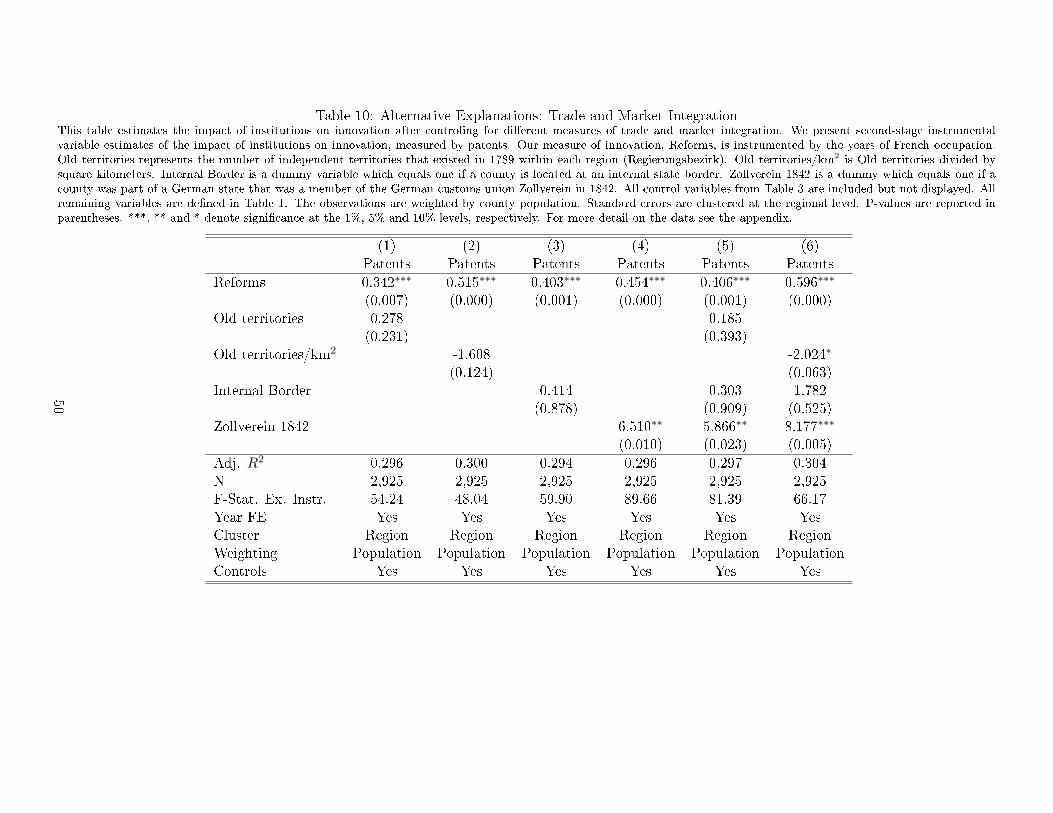
Table 10: Alternative Explanations: Trade and Market IntegrationThis table estimates the impact of institutions on innovation after controling for di�erent measures of trade and market integration. We present second-stage instrumentalvariable estimates of the impact of institutions on innovation, measured by patents. Our measure of innovation, Reforms, is instrumented by the years of French occupation.Old territories represents the number of independent territories that existed in 1789 within each region (Regierungsbezirk). Old territories/km2 is Old territories divided bysquare kilometers. Internal Border is a dummy variable which equals one if a county is located at an internal state border. Zollverein 1842 is a dummy which equals one if acounty was part of a German state that was a member of the German customs union Zollverein in 1842. All control variables from Table 3 are included but not displayed. Allremaining variables are de�ned in Table 1. The observations are weighted by county population. Standard errors are clustered at the regional level. P-values are reported inparentheses. ***, ** and * denote signi�cance at the 1%, 5% and 10% levels, respectively. For more detail on the data see the appendix.
�
(1) (2) (3) (4) (5) (6)Patents Patents Patents Patents Patents Patents
Reforms 0.342∗∗∗ 0.515∗∗∗ 0.403∗∗∗ 0.454∗∗∗ 0.406∗∗∗ 0.596∗∗∗
(0.007) (0.000) (0.001) (0.000) (0.001) (0.000)Old territories 0.278 0.185
(0.231) (0.393)Old territories/km2 -1.608 -2.024∗
(0.124) (0.063)Internal Border 0.414 0.303 1.782
(0.878) (0.909) (0.525)Zollverein 1842 6.510∗∗ 5.866∗∗ 8.177∗∗∗
(0.010) (0.023) (0.005)
Adj. R2 0.296 0.300 0.294 0.296 0.297 0.304N 2,925 2,925 2,925 2,925 2,925 2,925F-Stat. Ex. Instr. 54.24 48.04 59.90 89.66 81.39 66.17Year FE Yes Yes Yes Yes Yes YesCluster Region Region Region Region Region RegionWeighting Population Population Population Population Population PopulationControls Yes Yes Yes Yes Yes Yes
50
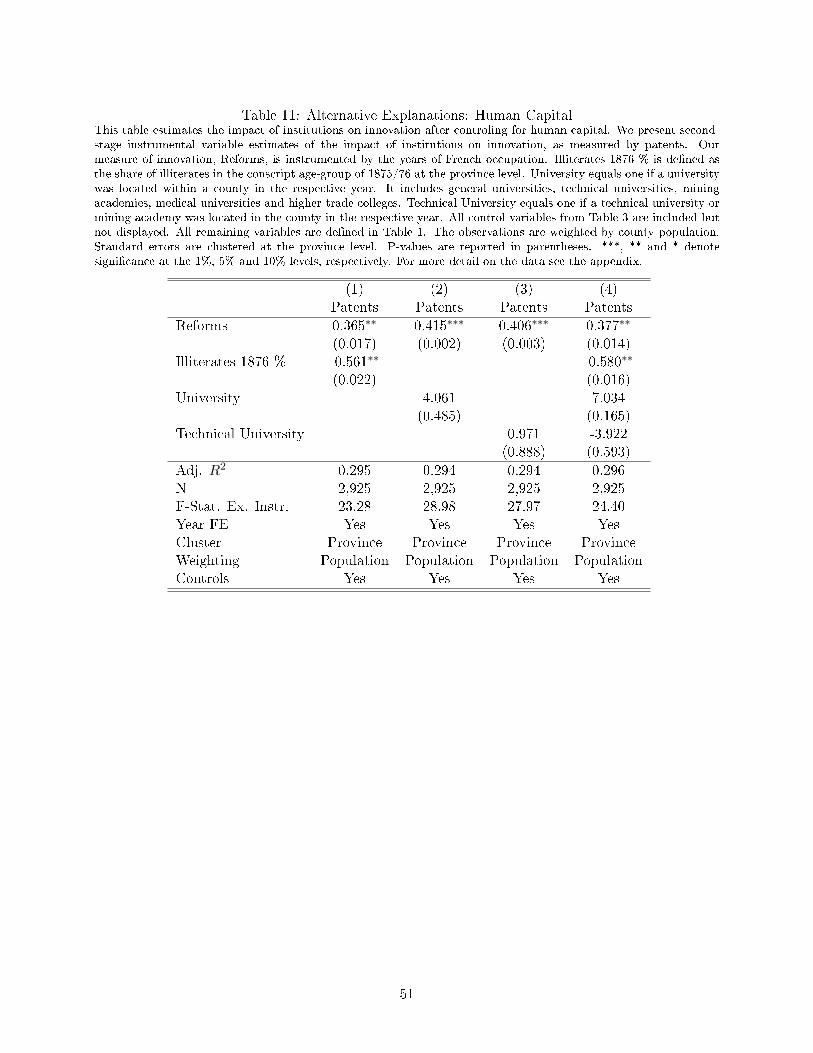
Table 11: Alternative Explanations: Human CapitalThis table estimates the impact of institutions on innovation after controling for human capital. We present second-stage instrumental variable estimates of the impact of institutions on innovation, as measured by patents. Ourmeasure of innovation, Reforms, is instrumented by the years of French occupation. Illiterates 1876 % is de�ned asthe share of illiterates in the conscript age-group of 1875/76 at the province level. University equals one if a universitywas located within a county in the respective year. It includes general universities, technical universities, miningacademies, medical universities and higher trade colleges. Technical University equals one if a technical university ormining academy was located in the county in the respective year. All control variables from Table 3 are included butnot displayed. All remaining variables are de�ned in Table 1. The observations are weighted by county population.Standard errors are clustered at the province level. P-values are reported in parentheses. ***, ** and * denotesigni�cance at the 1%, 5% and 10% levels, respectively. For more detail on the data see the appendix.
�
(1) (2) (3) (4)Patents Patents Patents Patents
Reforms 0.365∗∗ 0.415∗∗∗ 0.406∗∗∗ 0.377∗∗
(0.017) (0.002) (0.003) (0.014)Illiterates 1876 % -0.561∗∗ -0.580∗∗
(0.022) (0.016)University 4.061 7.034
(0.485) (0.165)Technical University 0.971 -3.922
(0.888) (0.593)
Adj. R2 0.295 0.294 0.294 0.296N 2,925 2,925 2,925 2,925F-Stat. Ex. Instr. 23.28 28.98 27.97 24.40Year FE Yes Yes Yes YesCluster Province Province Province ProvinceWeighting Population Population Population PopulationControls Yes Yes Yes Yes
51
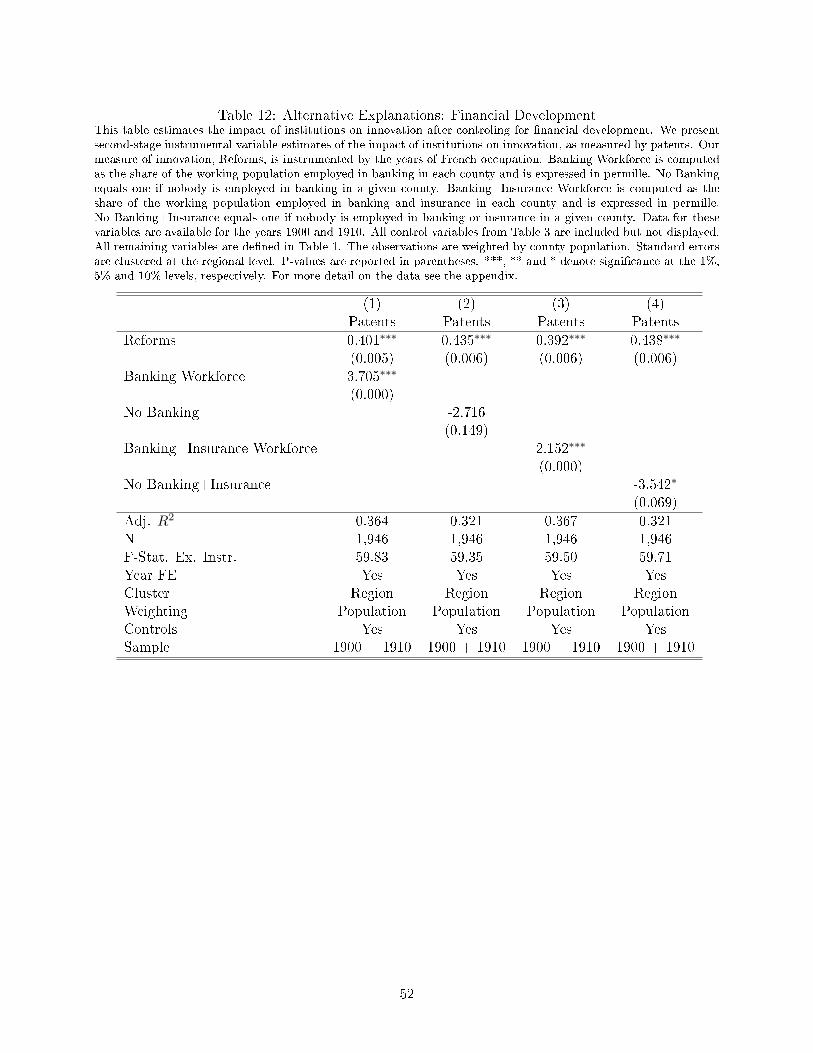
Table 12: Alternative Explanations: Financial DevelopmentThis table estimates the impact of institutions on innovation after controling for �nancial development. We presentsecond-stage instrumental variable estimates of the impact of institutions on innovation, as measured by patents. Ourmeasure of innovation, Reforms, is instrumented by the years of French occupation. Banking Workforce is computedas the share of the working population employed in banking in each county and is expressed in permille. No Bankingequals one if nobody is employed in banking in a given county. Banking+Insurance Workforce is computed as theshare of the working population employed in banking and insurance in each county and is expressed in permille.No Banking+Insurance equals one if nobody is employed in banking or insurance in a given county. Data for thesevariables are available for the years 1900 and 1910. All control variables from Table 3 are included but not displayed.All remaining variables are de�ned in Table 1. The observations are weighted by county population. Standard errorsare clustered at the regional level. P-values are reported in parentheses. ***, ** and * denote signi�cance at the 1%,5% and 10% levels, respectively. For more detail on the data see the appendix.
�
(1) (2) (3) (4)Patents Patents Patents Patents
Reforms 0.401∗∗∗ 0.435∗∗∗ 0.392∗∗∗ 0.438∗∗∗
(0.005) (0.006) (0.006) (0.006)Banking Workforce 3.705∗∗∗
(0.000)No Banking -2.716
(0.149)Banking+Insurance Workforce 2.152∗∗∗
(0.000)No Banking+Insurance -3.542∗
(0.069)
Adj. R2 0.364 0.321 0.367 0.321N 1,946 1,946 1,946 1,946F-Stat. Ex. Instr. 59.83 59.35 59.50 59.71Year FE Yes Yes Yes YesCluster Region Region Region RegionWeighting Population Population Population PopulationControls Yes Yes Yes YesSample 1900 + 1910 1900 + 1910 1900 + 1910 1900 + 1910
52
Appendix
A1 Structure of the Data Set
A1.1 General Structure
The structure of our data set re�ects the administrative structure of the German Empire, which con-
sisted of 25 federal states. Prussia was by far the most important one, accounting for a population
share of 61.2 percent in 1900 (see Deutsches Reich (1903a) for population �gures). It was subdivided
in provinces (Provinzen), regions (Regierungsbezirke), and counties (Kreise). The medium-sized
states like Bavaria or Saxony were organized in regions and counties, while the smaller principal-
ities were only subdivided in counties. We use county data, the lowest level for which the o�cial
census publications of the Imperial Statistical O�ce provide information. To account for potential
correlation within regions, standard errors are clustered at the region level in all regressions. Every
small German state, which was not subdivided into regions, is treated as an independent region. In
total, we consider all 25 German federal states. Alsace-Lorraine, which was annexed in 1871 as a
result of the French defeat in the Franco-German War, is excluded since it was not a federal state:
Alsace-Lorraine was a territory with a minor status (Reichsland) directly subordinated to the Ger-
man Emperor, where the inhabitants had less rights than the citizens of the German federal states,
and it was ruled by an Imperial governor coming from outside Alsace-Lorraine, who frequently was
a high-ranking Prussian o�cer.
The county borders changed over time as a result of administrative reforms. In most cases, the
size of the counties was reduced so that the number of counties increased. Our data set represents
the administrative structure in the year 1890, our �rst sample year. In order to generate a balanced
panel, we match the counties in all subsequent years to the administrative structure in the year
1890 (for example: Witten (city) was separated from Bochum in 1899. Thus, we merged Witten
(city) and Bochum in order to maintain the structure of 1890). Furthermore, for a couple of smaller
German federal states (e.g. the Principality of Lippe), some data was only available on a higher
aggregated level so that we had to merge counties. After all adjustments, our data set includes 975
county-level observations per year.
53
A1.2 De�nition of East Elbia
In Table 4 and column 1 of Panel B in Table 6, we use a sub-sample which excludes East Elbia
(Ostelbien), the Eastern Prussian provinces that were dominated by agriculture. In the histori-
cal literature, this geographical area is typically associated with economic backwardness, a high
landownership concentration and bad institutions (see, for example, Wagner (2005) for a detailed
description of the society in East Elbia). We de�ne the following Prussian provinces as part of East
Elbia: Brandenburg, Silesia, Pomerania, Posen, West Prussia, and East Prussia. Note that we treat
the capital city Berlin, which was administered as a separate district, not as part of East Elbia since
it lacks the relevant socioeconomic features that characterize East Elbia.
A1.3 De�nition of West vs. Saxony
In column 3 of Panel B in Table 6, we use the sub-sample West vs. Saxony to compare economically
leading regions in the Western and Eastern parts of Germany. We include the Prussian Rhine
Province, the Province of Westphalia, the Prussian Province of Saxony, and the Kingdom of Saxony
(in its pre-1815 borders) in this sub-sample.
A2 Patent Data
We extracted our patent data from the Baten/Streb patent database (see Streb, Baten, and Yin
(2006) for a detailed description of the data set). It contains all patents granted in the German
Empire between 1877 and 1913 that were renewed for at last 10 years, out of a maximum length
permitted by patent law of 15 years. The original data set includes information about the location of
the patentee, the technological class of the patent, and information regarding whether the patentee
was a �rm or a private individual. We assigned every patent to the historic German county, where
the patentee was located. The variable Patents is de�ned as the total number of patents, which
originated from the respective county in the respective year, divided by the county population.
Population �gures for 1890, 1900 and 1910 are extracted from the o�cial census records of the
Imperial Statistical O�ce (1890: Deutsches Reich (1894); 1900: Deutsches Reich (1903b); 1910:
Deutsches Reich (1915)).
In addition, we used information about the technology class of the patents to create sub-samples.
54
Technology classes were used by the Imperial Patent O�ce in order to classify inventions. In total,
there were 89 di�erent major classes. Due to the emergence of new technologies and the rising
number patents, the Imperial Patent O�ce extended its classi�cation scheme by introducing sub-
classes in 1900 (for example, class 21 (electrical engineering) was subdivided into 8 sub-classes
ranging from 21a (communications engineering) to 21h (processes and installations for electrical
heating and smelting including metalworking based on electrically generated heat)). We use this
classi�cation to distinguish between high-tech and low-tech patents. High-tech patents are de�ned as
all patents related to the chemical industry and electrical engineering, the two leading sectors of the
second industrial revolution. For the chemical industry, we include general chemical processes and
applications (class 12), fertilizers (class 16), dyestu�s (class 22), and textile chemistry (class 8i to
8o); for electrical engineering, we include general electrical engineering (class 21) as well as electrical
trains and electrical railway equipment (20k and 20l). All other classes are de�ned as low-tech. The
variable High-tech Patents (Low-tech Patents) represents the total number of high-tech (low-tech)
patents, which originated from the respective county in the respective year, divided by the county
population.
Furthermore, we distinguish between patents �led by �rms and individuals. The variable Firm
Patents (Individual Patents) is de�ned as the total number of �rm (individual) patents, which
originated from the respective county in the respective year, divided by the county population.
Accordingly, we use the variable High-tech Firm Patents for all high-tech patents (see de�nition
above), which were �led by �rms from the respective county in the respective year, divided by the
county population.
To ease the display of coe�cients all patent variables represent patents per million inhabitants.
A3 Institutional Reforms
A3.1 Reform Index
Our index (Reforms) is based on four institutional reforms: the introduction of a civil code, the abo-
lition of serfdom, the implementation of agrarian reforms and the dissolution of guilds. We determine
the year of reform implementation according to Acemoglu, Cantoni, Johnson, and Robinson (2011a).
For the following German states, our reform index is based on information published in their online
55
appendix (Acemoglu, Cantoni, Johnson, and Robinson (2011b)): Kingdom of Prussia, Kingdom of
Bavaria, Palatinate (Bavarian exclave west of the Rhine), Kingdom of Saxony, Kingdom of Wuert-
temberg, Grand Duchy of Baden, Grand Duchy of Brunswick, Grand Duchy of Hesse-Darmstadt,
Grand Duchy of Mecklenburg-Schwerin. Since we deal with data on the county level, we adjusted
and extended the data for some territorial entities. Our information about the political a�liation
of counties or border changes is based on various maps that are published online on the server for
digital historical maps at the Leibniz Institute of European History in Mainz (IEG-MAPS) (link:
http://www.ieg-maps.uni-mainz.de). In addition to the territories above, we collected information
for all small German states for which accurate information about the year of reform implementation
is available in the historic literature. Our sources are described below. In the following, we document
all changes compared to the original coding of Acemoglu, Cantoni, Johnson, and Robinson (2011a),
as well as the sources for all newly added territories:
Kingdom of Prussia:
(a) Provinces of Brandenburg, Saxony and Silesia: We take account for those counties that formed
the Northern part of the Kingdom of Saxony before 1815. These counties were annexed by Prussia
and became part of the Prussian provinces of Brandenburg, Saxony and Silesia. Institutional change
did not take place before 1815 in these counties. We therefore adjust the reform index accordingly.
(b) Province of Hesse-Nassau: As a result of its victory in the Austro-German War, Prussia
annexed several territories (Electorate of Hesse, Duchy of Nassau, Landgraviate of Hesse-Homburg,
and Free City of Frankfurt am Main), which constituted the Prussian province of Hesse-Nassau in
the subsequent years. Acemoglu, Cantoni, Johnson, and Robinson (2011a) report reform data for
the Northern part (former Electorate of Hesse), but not for the region in the South-West (former
Duchy of Nassau). Information about the years of reform implementation for the missing part is from
Schüler (2006). Furthermore, we adjust the values for the county of Biedenkopf, which belonged to
Hesse-Darmstadt until 1866, and thus di�ered with regard to the years of reform implementation.
(c) Rhine Province: The main part of the province is located west of the Rhine, but there
were also several counties on the East side (core territory of the Grand Duchy of Berg until 1815).
Acemoglu, Cantoni, Johnson, and Robinson (2011a) use province level data based on the reforms
in the western part. Since the years of reform implementation di�er slightly for the counties on
the East side, we use additional information from Klippel (1996) and Schubert (1977) to adjust the
56
data. Furthermore, the counties of Altenkirchen and Neuwied belonged to Nassau until 1866, and
thus di�ered in institutional quality. We use information from Schüler (2006) to get data for the
years of reform implementation in Nassau (see also our comments in (b)).
(d) Province of Schleswig-Holstein: Information about institutional reforms in Schleswig-Holstein
is reported in Acemoglu, Cantoni, Johnson, and Robinson (2011a). Lauenburg was part of the
Kingdom of Hanover until 1866, and therefore the years of reform implementation di�ered. After
the Prussian annexation of Hanover, Lauenburg became part of Schleswig-Holstein. We take this
change into account and adjust the reform values. Information about reforms in Hanover, which we
use for Lauenburg,is reported in Acemoglu, Cantoni, Johnson, and Robinson (2011a).
(e) Province of Westphalia: The Southern part of the province belonged to Hesse-Darmstadt
until 1815, where reforms were implemented in di�erent years. We therefore adjust our reform data
for the respective counties based on information about reform implementation in Hesse-Darmstadt.
Kingdom of Bavaria:
Acemoglu, Cantoni, Johnson, and Robinson (2011a) only consider the Eastern part of Bavaria
(the mainland around Munich), but not the Frankonian and Swabian regions. Since we identify no
di�erences with regard to the year of reform implementation, we take the same variables as for the
Eastern part of Bavaria.
Grand Duchy of Hesse-Darmstadt:
The western part on the left side of the Rhine (Rheinhessen) became part of Hesse-Darmstadt as
a result of the Congress of Vienna. Acemoglu, Cantoni, Johnson, and Robinson (2011a) do not treat
this region separately. Rheinhessen was under French rule and thus implemented reforms earlier.
Furthermore, institutions remained after the French withdraw. We therefore assign the same reform
values for Rheinhessen as for the Palatinate.
Grand Duchy of Mecklenburg-Strelitz:
Mecklenburg-Schwerin and Mecklenburg-Strelitz were strongly linked with regard to economic
and political terms so that reforms were implemented in the same years and the same way (see
Mast (1994), pp. 113-153). We therefore use the same years of implementation as for Mecklenburg-
Schwerin (see Acemoglu, Cantoni, Johnson, and Robinson (2011a)).
Grand Duchy of Oldenburg:
Besides its main territory in the north-west of Germany, Oldenburg possessed two small exclaves:
57
Birkenfeld (in the Rhineland) and the Principality of Luebeck (north of the independent city of
Luebeck). For the main territory: abolition of serfdom: Eckhardt and Schmidt (1987), p. 717-719;
agricultural reforms: Eckhardt and Schmidt (1987), p. 717-719; dissolution of guilds: Eckhardt and
Schmidt (1987), p. 354; code civil: Klippel (1996). The introduction of some reforms di�ered for
both exclaves, in particular for the territory of Birkenfeld which was under French occupation for
19 years. We thus adjusted the corresponding reform values based on information in Eckhardt and
Schmidt (1987) and Schubert (1977).
Grand Duchy of Saxe-Weimar-Eisenach:
Abolition of serfdom: Patze and Schlesinger (1978), p. 41; agricultural reforms: Patze and
Schlesinger (1978), p. 142; dissolution of guilds: Patze and Schlesinger (1978), p. 144; code civil:
Klippel (1996).
Duchy of Anhalt:
The Duchy was created in 1863 by uni�cation of Anhalt-Dessau and Anhalt-Bernburg. We treat
the preceding territories separately since the years of reform implementation di�ered. We used the
following sources: abolition of serfdom: Kraaz (1898) pp. 190-206 and p. 214; agricultural reforms:
Kraaz (1898), pp. 218-223; dissolution of guilds: Norddeutscher Bund (1869); code civil: Klippel
(1996); Schubert (1977).
Duchy of Saxe-Altenburg:
Abolition of serfdom: Patze and Schlesinger (1978), p. 41; agricultural reforms: Patze and
Schlesinger (1978), p. 142; dissolution of guilds: Patze and Schlesinger (1978), p. 144; code civil :
Klippel (1996).
Duchy of Saxe-Coburg-Gotha:
Abolition of serfdom: Patze and Schlesinger (1978), p. 141-142; agricultural reforms: Patze and
Schlesinger (1978), p. 142; dissolution of guilds: Patze and Schlesinger (1978), p. 144; code civil:
Klippel (1996).
Duchy of Saxe-Meiningen:
Abolition of serfdom: Patze and Schlesinger (1978), p. 141; agricultural reforms: Patze and
Schlesinger (1978), p. 142; dissolution of guilds: Patze and Schlesinger (1978), p. 144; code civil:
Klippel (1996).
Principality of Lippe:
58
Abolition of serfdom and agricultural reforms: Arndt (1992), pp. 266-272; dissolution of guilds:
Arndt (1992), p. 295; introduction of code civil: Klippel (1996).
Principality of Reuss, older line:
Abolition of serfdom and agricultural reforms: Patze and Schlesinger (1978), p. 142; dissolution
of guilds: Patze and Schlesinger (1978), p. 144; code civil: Klippel (1996).
Principality of Reuss, younger line:
Abolition of serfdom: Patze and Schlesinger (1978), p. 41; agricultural reforms: Patze and
Schlesinger (1978), p. 142; dissolution of guilds: Patze and Schlesinger (1978), p. 144; code civil:
Klippel (1996).
Principality of Schaumburg-Lippe:
Abolition of serfdom: Havliza (1975), p. 13-34; agricultural reforms: Schneider (1983); dissolu-
tion of guilds from Norddeutscher Bund (1871), p. 714; code civil: Klippel (1996).
Principality of Schwarzburg-Rudolstadt:
Abolition of serfdom: Patze and Schlesinger (1978), p. 141-142; agricultural reforms: Patze and
Schlesinger (1978), p. 142; dissolution of guilds: Patze and Schlesinger (1978), p. 144; code civil:
Klippel (1996).
Principality of Schwarzburg-Sondershausen:
Abolition of serfdom: Patze and Schlesinger (1978), p. 141-142; agricultural reforms: Patze and
Schlesinger (1978), p. 142; dissolution of guilds: Patze and Schlesinger (1978), p. 144; code civil:
Klippel (1996).
Principality of Waldeck and Pyrmont:
Abolition of serfdom and agricultural reforms: Seidel (1964), pp. 181-182; dissolution of guilds:
Brand (2006), p. 97; code civil: Klippel (1996).
Free and Hanseatic City of Bremen:
Abolition of serfdom: Schubert (1977), pp. 381-382; dissolution of guilds: Schulz (1995), p. 157;
code civil: Klippel (1996) and Schubert (1977), pp. 153-161. We have no information about agrarian
reforms since Bremen was a city state. Thus, the reform index is constructed over three reforms.
Free and Hanseatic City of Hamburg:
Abolition of serfdom: Schubert (1977), pp. 381-382; dissolution of guilds: Schulz (1995), p. 145;
code civil: Klippel (1996) and Schubert (1977), pp. 153-161. We have no information about agrarian
59
reforms since Hamburg was a city state. Thus, the reform index is constructed over three reforms.
Free and Hanseatic City of Luebeck:
Abolition of serfdom: Schubert (1977), pp. 381-382; dissolution of guilds: Endres (1926), p.
145; code civil: Klippel (1996) and Schubert (1977), pp. 153-161. We have no information about
agrarian reforms since Luebeck was a city state. Thus, the reform index is constructed over three
reforms.
A3.2 Alternative Reform Index
We use an alternative reform index (Alternative Reforms) to test whether our results are robust
to di�erent measures for institutional quality. Alternative Reforms include the reforms mentioned
above and is computed in the same way, but it also includes an additional reform measure: the
year when patrimonial courts were e�ectively abolished in the respective territory. Consequently,
we compute the average index value over �ve reform measures. Information about the abolition
of patrimonial courts are from Werthmann (1995), and for all Thuringian states (Saxe-Weimar-
Eisenach, Saxe-Altenburg, Saxe-Coburg-Gotha, Saxe-Meiningen, Reuss, younger line, Reuss, older
line, Schwarzburg-Rudolstadt, and Schwarzburg-Sondershausen) from Heÿ (1993), p. 64. We used
additional sources for Oldenburg (Eckhardt and Schmidt (1987), pp. 352-353), Anhalt (Kraaz
(1898), pp. 192-218), Schaumburg-Lippe (Havliza (1975), p. 31-36), and Waldeck and Pyrmont
(Seidel (1964), pp. 182). Since comparable patrimonial courts were not in operation in the city
states (Bremen, Hamburg and Lübeck), we do not include this reform. Thus, Alternative Reforms
only contains three reforms (abolition of serfdom, dissolution of guilds and code civil) for these cases.
A3.3 Discussion of Further Reform Measures
Kopsidis and Bromley (2016a) suggest a di�erent coding of the reform index. In particular, they
argue that the coding in Acemoglu, Cantoni, Johnson, and Robinson (2011a) underestimates the
institutional quality of non-occupied territories and thus provide a list of alternative years of reform
implementation. There are several reasons why we refer to the original coding. First, Acemoglu,
Cantoni, Johnson, and Robinson (2011a) describe in detail both the criteria that were used to de�ne
the year of reform implementation as well as the sources for each individual coding (see in particular
the online appendix of their paper (Acemoglu, Cantoni, Johnson, and Robinson (2011b))) while
60
Kopsidis and Bromley (2016a) use not only less strict criteria, but also provide no references for the
individual years of reform implementation at all (see the online appendix of their paper (Kopsidis
and Bromley (2016b))). Second, since Kopsidis and Bromley (2016a) provide no sources, we checked
their coding based on the historical literature. We are con�dent that the coding of Acemoglu,
Cantoni, Johnson, and Robinson (2011a) re�ects the institutional quality better. The following two
examples underline this argument:
For the Kingdom of Wuerttemberg, Kopsidis and Bromley (2016a) suggest that 1828 should be
used as the year when guilds were abolished. In their appendix, they motivate this by the fact that
the Common trade regulation act (Allgemeine Gewerbeordnung) was introduced in 1828. This trade
act caused the dissolution of some guilds, but there is strong evidence from historical studies that
the remaining guilds still a�ected the economic development in a negative way. Furthermore, as we
have argued in section 2.3, even sectors that were not regulated by guilds were heavily restricted
since trade licenses were necessary to establish a business. The allocation of trade licenses was
very restricted and, in the case of Wuerttemberg, this system was also used to protect the interest of
powerful guilds (see section 2.3, and, for example, Arns (1986) or Fischer (1962) for the restrictiveness
of the trade license system). In the same way as Acemoglu, Cantoni, Johnson, and Robinson
(2011b), we therefore de�ne the year of reform implementation as the year when commercial freedom
(Gewerbefreiheit) was established (in the case of Wuerttemberg: 1862).
For the Eastern provinces of Prussia, Kopsidis and Bromley (2016a) argue that the Prussian
October Decree (Oktoberedikt) of 1807 marked the introduction of the code civil in Prussia, while
Acemoglu, Cantoni, Johnson, and Robinson (2011b) use 1900, the year when the nationwide German
Civil Law (Bürgerlisches Gesetzbuch) was introduced. The latter is motivated by the fact that
under the General State Laws for the Prussian States (Allgemeines Landrecht für die Preuÿischen
Staaten), which existed until 1900, people were not treated equally before court. From our point of
view, taking 1807 as the year of introduction completely overestimates the institutional quality of
these provinces since very discriminating legal institutions had not yet been abolished in comparison
with the territories that had been under French rule. In particular, patrimonial justice persisted in
the Eastern Prussian provinces until 1849. The local lords of manor lost their police powers in the
same years, at least in some parts this privilege was o�cially reintroduced in 1853 (see in particular
Werthmann (1995) for the dissolution of patrimonial courts in German states). Apart from that,
61
there are detailed historical case studies about the society and daily live of people living in this
provinces that point out to the persistence of non-inclusive institutions during the 19th century
(see, for example, Wagner (2005)). Given the previously mentioned arguments, we use 1900 as the
year when the code civil was introduced. Nevertheless, we account for this concern, with the variable
Alternative Reforms (see section 4.6 and A3.2), which includes the abolition of patrimonial courts
as an additional measure.
Apart from their critique regarding the coding of the specif reforms, Kopsidis and Bromley
(2016a) argue that the abolition of serfdom is a more a less meaningless measure, which should
be excluded from the construction of the Reforms variable. In the late 18th century, serfdom was
indeed less strict than in earlier periods. However, it should be used as a measure for institutional
quality even it was not comparable with a kind of slavery in our period of interest. Under the
manorial system, the live of the serfs was restricted to the extend that they were dutiable to their
lord of manor. Depending on the way serfdom was organized locally, the people had to pay monetary
contributions, they had to deliver payments in kind, or they had to ful�ll work obligations (see, for
example, Achilles (1993)). These measures in turn restricted both social mobility and labor market
mobility. The formal abolition of serfdom was the �rst step in a series of agricultural reforms in which
the former serfs were relived from these duties. In territories where serfdom was abolished earlier,
other agricultural reforms could also be implemented earlier. The year when a law was implemented
that �nally regulated the redemption of feudal lands, which re�ects the reform measure 'agricultural
reforms' in Acemoglu, Cantoni, Johnson, and Robinson (2011b), is in most cases the end of this
reform process. However, it is worth to point out that excluding this variable does not a�ect our
results. In additional unreported robustness checks, we included a reform index that only includes
the introduction of the code civil as well as the dissolution of guilds, and we also ran our regressions
for guilds only. In both cases our results suggest a economically and statistically strong e�ect of
institutions on innovation. However, from our point of view the measures used in our paper (Reforms
and Alternative Reforms) re�ect the actual institutional quality far better.
A4 French Occupation
We follow the approach of Acemoglu, Cantoni, Johnson, and Robinson (2011a) to identify the years
of French occupation. We de�ne a territory as occupied if it was under direct French rule or under
62
the rule of a French-controlled satellite state, which include the Grand Duchy of Berg, the Kingdom
of Westphalia, and the Grand Duchy of Frankfurt, which were ruled by family members of Napoleon.
Accordingly, the period of French occupation ranges between 19 and zero years. Since Acemoglu,
Cantoni, Johnson, and Robinson (2011a) only provide data on the state level (on the province for
Prussia), we used various historical maps to identify the years of French occupation on the county-
level. The maps are published online on IEG-MAPS (link: http://www.ieg-maps.uni-mainz.de).
A5 Basic Control Variables
A5.1 Population Density
The variable Population/Km² represents the population density measured by the inhabitants of
each county divided by its area size in square kilometers. Both county population and area size are
extracted from the o�cial German census publications (for 1890: Deutsches Reich (1894); for 1900:
Deutsches Reich (1903b); for 1910: Deutsches Reich (1915)).
A5.2 Rivers and Harbors
River is a dummy variable that is equal to one if the respective county is located at a navigable
waterway, and zero else. We include all rivers and canals that were navigable in 1850, based on
the map Schi�ahrtsstrassen im Deutschen Zolllverin 1850, which is available online on IEG-MAPS
(link: http://www.ieg-maps.uni-mainz.de/gif/w850d_a4.htm). We use the same map to identify
counties with major seaports. The dummy variable Harbor is equal to one if a seaport is located in
the respective county, and zero otherwise. In addition, River*Harbor is a dummy variable that is
equal to one if a county has both access to a navigable river and a seaport, and zero otherwise.
A5.3 Border Counties
Border is a dummy variable that is equal to one if a county was located at an external border of the
German Empire, and zero otherwise. Due to the fact that Alsace-Lorraine was part of France until
1871, we treat the border between Alsace-Lorraine and the adjoining German federal states (Prussia,
Bavaria (Palatinate), and Baden) as an external border. Thus, this border de�nition re�ects the
situation after the Congress of Vienna (1815), which shaped economic activity in these counties in
63
the long-run. In the same way, we de�ne the dummy variable Border France, which is equal to one
if the county was located at the border to France after the Congress of Vienna, and zero otherwise.
A5.4 Universities in 1789
University 1789 is a dummy variable that is equal to one if a university was located in the respective
county in 1789, and zero otherwise. We use De Ridder-Symoens (1992), De Ridder-Symoens (1996),
and Rüegg (2004) to obtain information about the formation of universities in German states.
Our data includes information about the year when a university was opened, whether and when a
university was closed, and whether and when it was reopened. This data allows us to determine the
universities that were in operation in 1789. We include general universities, technical universities,
mining academies, medical and veterinary universities, and higher schools of commerce. Theological
universities, academies of arts and academies of music are not taken into account.
A5.5 Protestants
Protestants in % represents the share of the Protestant population as a percentage of the total
population of each county. We extracted the data from the o�cial census publications of the Impe-
rial Statistical O�ce for each year of observation (1890: Deutsches Reich (1894); 1900: Deutsches
Reich (1903a); 1910: Deutsches Reich (1915)). The census publications provide county-level infor-
mation about the Protestant and Catholic population living in each county, respectively. Together,
Protestants and Catholics account for over 98 percent of the German population.
A5.6 Minorities
Minorities is a dummy variable that is equal to one if the share of the population with a mother-
language other than German is higher than 50 percent in the respective county in 1900, and zero
otherwise. Our county-level data is based on the o�cial census publication of the Imperial Statis-
tical O�ce, which provides information about non-German-speaking minorities on the county-level
(Deutsches Reich (1903b)).
64
A5.7 Prussia in 1816
Prussia 1816 is a dummy variable that is equal to one if the county was located in Prussia after
the Congress of Vienna (1815), and zero otherwise. See the map Der Deutsche Bund nach dem
Frankfurter Territorialrezess um 1820 for the Prussian territory after the Congress of Vienna, which
is available online on IEG-MAPS (link: http://www.ieg-maps.uni-mainz.de/gif/d820_a4.htm).
A5.8 City States
City State is a dummy variable that is equal to one if the county was part of one of the city states
that existed in the German Empire (Bremen, Hamburg, and Luebeck), and zero otherwise.
A5.9 Natural Resources
Coal Deposits is a dummy variable that is equal to one if coal deposits were located in the respective
county, zero otherwise. In the same way, Ore Deposits is de�ned as dummy variable that is equal to
one if deposits of iron ore or or other important metals (e.g. copper) are located in the respective
county. We include all counties in which coal or ore mining facilities were in operation in the 1920s.
These counties represent the counties where the extraction of coal and metal ore was economically
feasible form the perspective of the nineteenth century. The data is based on map BI (coal mining)
and map BII (metal ore mining) in Pfohl and Friedrich (1928). In addition, we used further sources
to ensure that we do not miss mining counties where the resources were already exhausted in the
course of the nineteenth century (in particular: Bartels and Slotta (2012) and Weber (2015).
A6 Ecclesiastical States
Ecclesiastical 1789 is a dummy variable that is equal to one if the county was part of an ecclesiastical
principality in 1789, and zero otherwise. Ecclesiastical principalities include all ecclesiastical Elec-
torates (Cologne, Mainz, Trier), Prince-Bishoprics (e.g. Münster), Prince-Abbeys (e.g. Kempten),
and territories of religious orders of knights (Order of St. John's, Teutonic Knights). We used various
historical maps as well as registers to identify, whether the respective county belonged to an ecclesi-
astical states. Due to the strong political fragmentation, some counties belonged to various political
entities in 1789. We only set the dummy variable equal to one if a signi�cant part of the respective
65
county was part of an ecclesiastical state. Our coding is based on various sources: for a general
register for all former German territories: Köbler (1992); for the territories of the Rhineland: map
5.1 in Irsigler (1982); for the territories in the Palatinate: map 001 in Alter (1964); for the territories
in Hesse: map 22 in Hessisches Landesamt für Geschichtliche Landeskunde (1984); for the terri-
tories in the South-West (subsequent states of Baden and Wuerttemberg): map Herrschaftsgebiete
und Ämtergliederung in Südwestdeutschland 1790 in: Schröder and Miller (1988); for the territories
in the South-East (subsequent federal state of Bavaria): information in Bayrische Staatsbibliothek
München (2009).
A7 Further Control Variables
A7.1 Employment by Sector
Manufacturing+Mining Workforce % represents the share of people employed in manufacturing
and mining relative to the total number of people employed in the respective county, and Services
Workforce % the share of employees in the private service sector, respectively. We use the o�cial
German employment census publications of the Imperial Statistical O�ce get information about the
employment by sectors. In order to avoid double-counting, we only consider the main occupation.
Employment census data is available for the years 1895 and 1907 (1895: Deutsches Reich (1898a)
and Deutsches Reich (1898b); 1907: Deutsches Reich (1910)). We match the employment data for
1895 with patents per capita in 1900, and the employment data for 1907 with patents per capita in
1910.
Mining County is a dummy variable that is equal to one if the share of employees in mining
and primary metal production (e.g. steelworks, copper mills) relative to total employment in man-
ufacturing and mining is larger than �ve percent in the respective county. The employment census
publications mentioned above do not provide aggregate �gures for employment in mining and metal
production separately, but only for manufacturing and mining in total. Due to these data con-
straints, we use additional publications that are based on the o�cial employment census (1885:
Deutsches Reich (1899); 1907: Deutsches Reich (1909a) and Deutsches Reich (1909b)).
66
A7.2 Technology Transfer
In Table 8, we report the number of machine-building factories (including shipyards) and the number
of wool weaving looms that were in operation in German states in 1846 and 1861. The data is based
on o�cial surveys in the German Customs Union (Zollverein) states. Note that for some states data
is missing for 1846 since these states joined the Zollverein in subsequent years. Factory data is from
Becker (1962 (2010)) and data about wool weaving looms is from Blumberg (1965 (2014)), table 26.
In addition to the absolute number, we report the number of machine-building factories and wool
weaving looms per thousand inhabitants. Population data is from Franzmann (2013).
A7.3 Trade and Market Integration
In Table 9, we report German import and export statistics by country of origin and destination for
several years. Exports and imports for 1841 and 1851 include both Zollverein member and non-
member states that became part of the German Empire in 1871. The data for 1841 and 1851 is
from von Borries (1970), table 42. Exports and imports for 1890, 1900 and 1910 are based on the
o�cial trade statistics published in the yearbooks of the Imperial Statistical O�ce (Deutsches Reich
(1892), p. 65; Deutsches Reich (1905), pp. 169-171; Deutsches Reich (1913), pp. 241-242). Others
includes all countries for which no separate �gures are available in von Borries (1970).
Old territories represents the number of independent principalities that existed in 1789 within
each region (Regierungsbezirk), and Old territories/km² equals Old territories divided by the area
size in square kilometers of the respective region. Old territories is used in Deutsches Reich (1892),
too, but at a higher level of aggregation. Old territories includes secular principalities that were
immediate to the Emperor (reichsunmittelbar), independent ecclesiastical territories (Electorates,
Prince-Bishoprics, Prince-Abbeys, and territories of religious orders of knights), free imperial cities
and territories of the Imperial Knights. The latter represent a large number of micro states that
were organized in di�erent leagues and cantons (e.g. the canton Odenwald of the Franconian Circle).
Since even very detailed maps only report the Imperial Knights as a whole or by canton, but not
separately, we treat these micro states as one old territory. Territories that were reigned under
a dynastic union are only counted once. To get accurate information on the region-level, we use
the following sources: for a general register for all former German territories: Köbler (1992); for a
67
general overview (and the Eastern territories in particular): map Deutschland 1792, which is available
on IEG-MAPS (link: http://www.ieg-maps.uni-mainz.de/gif/w850d_a4.htm); for the territories of
the Rhineland: map 5.1 in Irsigler (1982); for the territories in the Palatinate: map 001 in Alter
(1964); for the territories in Hesse: map 22 in Hessisches Landesamt für Geschichtliche Landeskunde
(1984); for the territories in the South-West (subsequent federal states of Baden and Wuerttemberg):
map Herrschaftsgebiete und Ämtergliederung in Südwestdeutschland 1790, in: Schröder and Miller
(1988); for the territories in the South-East (subsequent state of Bavaria): information in Bayrische
Staatsbibliothek München (2009).
Internal Border is a dummy variable which equals one if a county is located at an internal state
border, and zero otherwise. We de�ne internal state border as a border between states that were
located on the territory of the subsequent German Empire. Our coding is based on the borders that
were established after the Congress of Vienna (see the map Der Deutsche Bund nach dem Frankfurter
Territorialrezess um 1820 , which is available online on IEG-MAPS (link: http://www.ieg-maps.uni-
mainz.de/gif/d820_a4.htm)). We therefore treat a county as internal border county if it was at the
common border of two states that became part of the German Empire in 1871 (e.g. the border
between the kingdoms of Bavaria and Wuerttemberg), or if it was at the border to a state that was
dissolved until 1871 (e.g. the border between the Kingdom of Hanover and Prussia; the Kingdom of
Hanover was annexed by Prussia after the Austro-Prussian War in 1866).
Zollverein in 1842 is a dummy variable that is equal to one if the county was located within a
state that belonged to the German Customs Union (Zollverein) in 1842, and zero otherwise. See the
map Deutscher Zollverein 1842, which is available on IEG-MAPS (link: http://www.ieg-maps.uni-
mainz.de/map4.htm). The Zollverein was founded in 1834 under the leadership of Prussia. By 1842,
most German states had joined the customs union except for the states in the North that had access
to the coast. We choose 1842 as a benchmark year for the following reasons: First, the e�ect of
market integration should be stronger for the states that had no access to the coast, second we want
to select a year for which still a signi�cant number of states were not part of the union. The latter
argument does not hold anymore for 1854, the year of the subsequent major enlargement, when the
Kingdom of Hanover and the Grand Duchy Oldenburg joined.
68
A7.4 Human Capital
Illiterates 1876 % is used as a proxy for human capital. It is de�ned as the share of illiterates in the
conscript age-group of 1875/76. The data is extracted from the yearbook of the Imperial Statistical
O�ce (Deutsches Reich (1880), p. 151). It is only available on the province level for Prussia, and on
the state level for all other German territories. We use 1875/76 since the Imperial Statistical O�ce
did not publish �gures for earlier years.
University is de�ned as a dummy variable that is equal to one if a university was located in the
respective county in the respective year, and zero otherwise. We use De Ridder-Symoens (1992),
De Ridder-Symoens (1996), and Rüegg (2004) to get information about the formation of universities
in German states. Our data includes information about the year when a university was opened,
whether and when a university was closed, and whether and when it was reopened. This data allows
us to determine the universities that were in operation for each year in our sample. University
includes general universities, technical universities, mining academies, medical and veterinary uni-
versities, and higher schools of commerce. Theological universities, academies of arts and academies
of music are not taken into account. Technical University is a dummy variable that is de�ned in the
same way, except that it includes only technical universities and mining academies.
A7.5 Financial Development
Banking Workforce % is de�ned as the share of people employed in banking relative to the total
number of people employed in the respective county, and Banking+Insurance Workforce % represents
the share of people employed in banking and insurance, respectively. We used the o�cial German
employment census publications of the Imperial Statistical O�ce get information about employment.
In order to avoid double-counting, we only consider the main occupation. Employment data is
available for the years 1895 and 1907 (1895: Deutsches Reich (1898a) and Deutsches Reich (1898b);
1907: Deutsches Reich (1910)). We match the employment data for 1895 with patents per capita
in 1900, and the employment data for 1907 with patents per capita in 1910. Based on the same
data, we de�ne No Banking as a dummy variable that is equal to one if there is no employment in
banking in the respective county and year, and zero otherwise, and No Banking+Insurance is equal
to one if we observe neither employment in banking nor in insurance, and zero otherwise.
69
References
Acemoglu, D., D. Cantoni, S. Johnson, and J. A. Robinson (2011a): �The Consequences ofRadical Reform: The French Revolution,� American Economic Review, 101(7), 3286�3307.
(2011b): �The Consequences of Radical Reform: The French Revolution: OnlineAppendix,� American Economic Review, https://assets.aeaweb.org/assets/production/articles-attachments/aer/data/dec2011/20100816_app.pdf.
Achilles, W. (1993): Deutsche Agrargeschichte im Zeitalter der Reformen und der Industrial-isierung. Verlag Eugen Ulmer, Stuttgart.
Alter, W. (ed.) (1964): Pfalzatlas. Im Auftrag der Pfälzischen Gesellschaft zur Förderung derWissenschaften. Eigenverlag der Gesellschaft Speyer, Speyer.
Arndt, J. (1992): Das Fürstentum Lippe im Zeitalter der Französischen Revolution: 1770-1820.Waxmann, Münster.
Arns, G. (1986): Über die Anfänge der Industrie in Baden und Württemberg. DRW-Verlag,Stuttgart.
Bartels, C., and R. Slotta (eds.) (2012): Der Alteuropäische Bergbau. Von den Anfängenbis zur Mitte des 18. Jahrhunderts, vol. 1 of Geschichte des Deutschen Bergbaus. Aschendor�,Münster.
Bayrische Staatsbibliothek München (2009): �Historischer Atlas von Bayern. Online-Ausgabe.,� http://geschichte.digitale-sammlungen.de/hab/online/angebot.
Becker, W. (1962 (2010)): Die Entwicklung der Deutschen Maschinenbauindustrie von 1850 bis1870. GESIS Köln, Deutschland ZA8439 Daten�le Version 1.0.0, Köln.
Blumberg, H. (1965 (2014)): Die Deutsche Textilindustrie in der Industriellen Revolution. GESISKöln, Deutschland ZA8582 Daten�le Version 1.0.0, Köln.
Brand, J. (2006): �Der Code civil als Brücke zum französischen und deutschen Arbeitsrecht,�in Richterliche Anwendung des Code civil in seinen europäischen Geltungsbereichen auÿerhalbFrankreichs, ed. by B. Dölemeyer, H. Mohnhaupt, and A. Somma, pp. 61�103. Vittorio Kloster-mann, Frankfurt am Main.
De Ridder-Symoens, H. (1992): A History of the University in Europe: 1. Universities in theMiddle Ages. Cambridge University Press, Cambridge.
(1996): A History of the University in Europe: 2. Universities in Early Modern Europe(1500 - 1800). Cambridge University Press, Cambridge.
Deutsches Reich (1880): Statistisches Jahrbuch für das Deutsche Reich. Puttkammer &Mühlbrecht, Berlin.
(1892): Statistisches Jahrbuch für das Deutsche Reich. Puttkammer & Mühlbrecht, Berlin.(1894): Statistik des Deutschen Reichs, Neue Folge, Band 68: Die Volkszählung im
Deutschen Reich vom 1. Dezember 1890. Puttkammer & Mühlbrecht, Berlin.(1898a): Statistik des Deutschen Reichs, Neue Folge, Band 117: Berufsstatistik nach der
Allgemeinen Berufszählung von 1895. Erster Teil. Puttkammer & Mühlbrecht, Berlin.(1898b): Statistik des Deutschen Reichs, Neue Folge, Band 118: Berufsstatistik nach der
Allgemeinen Berufszählung von 1895. Zweiter Teil. Puttkammer & Mühlbrecht, Berlin.(1899): Statistik des Deutschen Reichs, Neue Folge, Band 119: Gewerbe und Handel
im Deutschen Reich nach der Gewerblichen Betriebszählung vom 14. Juni 1895. Puttkammer& Mühlbrecht, Berlin.
(1903a): Statistik des Deutschen Reichs, Neue Folge, Band 150, Teil 1: Die Volkszählungam 1. Dezember 1900 im Deutschen Reich. Puttkammer & Mühlbrecht, Berlin.
(1903b): Statistik des Deutschen Reichs, Neue Folge, Band 151, Teil 2: Die Volkszählungam 1. Dezember 1900 im Deutschen Reich. Puttkammer & Mühlbrecht, Berlin.
70
(1905): Statistisches Jahrbuch für das Deutsche Reich. Puttkammer & Mühlbrecht, Berlin.(1909a): Statistik des Deutschen Reichs, Neue Folge, Band 219: Berufs- und Betriebszäh-
lung vom 12. Juni 1907, Gewerbliche Betriebsstatistik, Abteilung 6, kleinere Verwaltungsbezirke,Preuÿen. Puttkammer & Mühlbrecht, Berlin.
(1909b): Statistik des Deutschen Reichs, Neue Folge, Band 219: Berufs- und Betriebszäh-lung vom 12. Juni 1907, Gewerbliche Betriebsstatistik, Abteilung 7, kleinere Verwaltungsbezirke,Bundesstaaten ohne Preuÿen. Puttkammer & Mühlbrecht, Berlin.
(1910): Statistik des Deutschen Reichs, Neue Folge, Band 209: Berufs- und Betriebszäh-lung vom 12. Juni 1907. Gewerbliche Betriebstatistik, Abteilung 8, Kleinere Verwaltungsbezirke.Puttkammer & Mühlbrecht, Berlin.
(1913): Statistisches Jahrbuch für das Deutsche Reich. Puttkammer & Mühlbrecht, Berlin.(1915): Statistik des Deutschen Reichs, Neue Folge, Band 240: Die Volkszählung im
Deutschen Reiche am 1 Dezember 1910. Puttkammer & Mühlbrecht, Berlin.Eckhardt, A., and H. Schmidt (eds.) (1987): Die Geschichte des Landes Oldenburg. Holzberg,Oldenburg.
Endres, F. (1926): Geschichte der Freien Hansestadt Lübeck. Quitzow, Lübeck.Fischer, W. (1962): Der Staat und die Anfänge der Industrialisierung in Baden, 1800-1850.Duncker & Humblot, Berlin.
Franzmann, G. (2013): Histat-Datenkompilation: Stand und Bewegung der Bevölkerung desDeutschen Reichs, der Deutschen Staaten und der Regionen, 1841 bis 1886. GESIS Köln, Deutsch-land ZA8565 Daten�le Version 1.0.0, Köln.
Havliza, R. M. (1975): �Die Verfassungsentwicklung im Fürstentum Schaumburg-Lippe 1848/49,�Phd thesis, Universität Kiel, Kiel.
Heÿ, U. (1993): Geschichte der Behördenorganisation der Thüringischen Staaten und des LandesThüringen von der Mitte des 16.Jh. bis zum Jahre 1952, vol. 1. Gustav Fischer Verlag, Jena.
Hessisches Landesamt für Geschichtliche Landeskunde (1984): Geschichtlicher Atlas vonHessen. Hessisches Landesamt für Geschichtliche Landeskunde, Marburg.
Irsigler, F. (1982): Geschichtlicher Atlas der Rheinlande. Habelt, Bonn.Köbler, G. (1992): Historisches Lexikon der deutschen Länder. C.H. Beck, München.Klippel, D. (1996): Deutsche Rechts- und Gerichtskarte. Keip Verlag, Goldbach.Kopsidis, M., and D. W. Bromley (2016a): �The French Revolution and German Industri-alization: Dubious Models and Doubtful Causality,� Journal of Institutional Economics, 12(1),161�190.
(2016b): �The French Revolution and German Industrialization: Dubious Mod-els and Doubtful Causality: Supplemental Material,� Journal of Institutional Economics,http://www.millennium-economics.com/user/image/joie-2014-059.r4-supplementary.pdf.
Kraaz, A. (1898): Bauerngut und Frohndienste in Anhalt vom 16. bis zum 19. Jahrhundert. Fischer,Jena.
Mast, P. (1994): Mecklenburg-Vorpommern: 1000 Jahre Geschichte eines jungen Landes. Koehler& Amelang, München.
Norddeutscher Bund (1869): Gewerbeordnung für den Norddeutschen Bund. Bundes-Gesetzblattdes Norddeutschen Bundes Band 1869, Nr. 26. Vereinigtes Gesetz-Sammlungs-Debits- undZeitungs-Komtoir, Berlin.
(1871): Archiv des Norddeutschen Bundes und des Zollvereins. Jahrbuch für Staatsrecht,Verwaltung und Diplomatie des Norddeutschen Bundes und des Zollvereins, Band 3. Verlag derReichs-Gesetze, Berlin.
Patze, H., and W. Schlesinger (eds.) (1978): Geschichte Thüringens: Fünfter Band: PolitischeGeschichte in der Neuzeit; 2. Teil. Böhlau, Köln.
71
Pfohl, E., and E. Friedrich (1928): Die deutsche Wirtschaft in Karten (System Prof. Pfohl):430 Karten und Diagramme über die deutsche Produktion in Bergbau, Industrie, Landwirtschaft.die Standorte der Industrie, die Verteilung der Arbeiterschaft und die Stellung Deutschlands inder Weltproduktion. Hobbing, Berlin.
Rüegg, W. (2004): A History of the University in Europe: Vol.3. Universities in Early ModernEurope (1500 - 1800), vol. 3 of A History of the University in Europe. Cambridge University Press,Cambridge.
Schüler, W. (2006): Das Herzogtum Nassau 1806-1866: Deutsche Geschichte im Kleinformat.Historische Kommission für Nassau, Wiesbaden.
Schneider, K. H. (1983): Die Landwirtschaftlichen Verhältnisse und die Agrarreformen inSchaumburg-Lippe im 18. und 19. Jahrhundert. C. Bösendahl, Rinteln.
Schröder, K. H., and M. Miller (eds.) (1988): Historischer Atlas von Baden-Württemberg.Kommission für Geschichtliche Landeskunde in Baden-Württemberg, Stuttgart.
Schubert, W. (1977): Französisches Recht in Deutschland zu Beginn des 19. Jahrhunderts: Zivil-recht, Gerichtsverfassungsrecht und Zivilprozessrecht. Böhlau, Köln.
Schulz, A. (1995): �Liberalismus in Hamburg und Bremen zwischen Restauration und Reichsgrün-dung (1830-1870),� Historische Zeitschrift. Beihefte, 19, 135�160.
Seidel, F. (1964): Die Soziale Frage in der Deutschen Geschichte. MbB des Ehemaligen Fürsten-tums Waldeck-Pyrmont. Ein Lehrgeschichtlicher Überblick. Franz Steiner, Wiesbaden.
Streb, J., J. Baten, and S. Yin (2006): �Technological and Geographical Knowledge Spilloverin the German Empire 1877-1918,� Economic History Review, 59(2), 347�373.
von Borries, B. (1970): Deutschlands Auÿenhandel 1836 bis 1856. Eine Statistische Untersuchungzur Frühindustrialisierung. Gustav Fischer, Stuttgart.
Wagner, P. (2005): Bauern, Junker und Beamte: Lokale Herrschaft und Partizipation im Os-telbien des 19. Jahrhunderts, vol. 9 of Moderne Zeit. Neue Forschungen zur Gesellschafts- undKulturgeschichte des 19. und 20. Jahrhunderts. Wallstein Verlag, Göttingen.
Weber, W. (ed.) (2015): Salze, Erze und Kohlen: Aufbruch in die Moderne - 18. und 19. Jahrhun-dert, vol. 2 of Geschichte des Deutschen Bergbaus. Aschendor�, Münster.
Werthmann, S. (1995): Vom Ende der Patrimonialgerichtsbarkeit: Ein Beitrag zur DeutschenJustizgeschichte des 19. Jahrhunderts. Vittorio Klostermann, Frankfurt am Main.
72


![The Institutions of Innovation[1]](https://img.pdfslide.us/doc/110x75/577cdce61a28ab9e78abb294/the-institutions-of-innovation1.jpg)