Embed Size (px)
Citation preview

i
IMPACT OF MICROFINANCE INSTITUTIONS ON POVERTY
ALLEVITION IN BUSIA COUNTY-KENYA
BY
MALLINGUH EDMUND BWIRE
KCA 11/02967
A DISSERTATION SUBMITTED IN PARTIAL FULFILLMENT OF THE
REQUIREMENT FOR THE AWARD OF MASTER OF SCIENCE IN
COMMERCE IN THE SCHOOL OF BUSINESS AND PUBLIC
MANAGEMENT AT KCA UNIVERSITY
November, 2013

ii
DECLARATION I declare that this dissertation is my original work and has not been previously published or
submitted elsewhere for award of a degree. I also declare that this contains no material written
or published by other people except where due reference is made and author duly acknowledged.
Student Name: MALLINGUH EDMUND BWIRE Reg. No: KCA/11/02967
Sign : _______________________ Date: __________________________
I do hereby confirm that I have examined the Master’s research Paper of Mallinguh Edmund
Bwire
And have certified that all revisions recommended have been adequately addressed.
Sign: ____________________ Date: ______________
Supervisor’s Name: Dr. PAUL KATUSE

iii
ABSTRACT In the past ten years most people in underdeveloped countries have subscribed to MFIs in order to realize their economic empowerment (self employment, access to borrowings and increased savings) (Gupta, 2005).Studies carried in Kenya of the last couple of years suggest that to some extent, microfinance is an effective tool of containing poverty. Most recent studies have majored on positive effects, few on negative effects and very few on neutral effects (Kiiru, 2007). This study mirrored out the impact of microfinance on poverty alleviation in Busia County. Descriptive research design was used to assess the extent to which poverty alleviation co-relates with Microfinance Institutions services. The study targeted three Deposit Taking Microfinance institutions operating within the entire Busia County. The researcher considered scale of operations, distribution level in the county among other factors when choosing the three institutions. Simple random probability sampling was applied to select twenty (20) active MFIs members from three (3) DTMs, adding to sixty (60) respondents. Primary data was collected through questionnaires. Data collected was presented by descriptive statistics like pie charts and graphs. From the analysis, the results showed that microfinance institutions act as a key fulcrum to economic empowerment of residents in the County. However, it is important to note that the ability of members to start micro-enterprises does not guarantee financial improvement to all of them. It is important to note that there are other factors apart from availability of microfinance at play. The study found that costing of products by microfinance institutions to be the most important factor considered by members in the area. Accessibility to services on offer throughout the county is critical and in addition, microfinance institutions should endeavor to improve and differentiate their products. It is therefore important for the county government to find ways of encouraging increased microfinance operations in the entire county so as to reach as many potential members as possible in far flung areas. Those in remote parts of the county must be given the opportunity to access the services when they need them at the local level. Though MFIs are trying to address this, having their operations localized in town with weekly field visits is not sufficient. The results were re-affirmed by a linear regression analysis using SPSS version 20. The findings could be used to make policy proposals that will see MFIs meet the economical empowerment of people in County with high levels of poverty. The progress will help Kenya prepare to achieve its vision 2030 goals.
Key words: microfinance, poverty alleviation, micro-entrepreneurship

iv
ACKNOWLEDGEMENT My first debt of gratitude goes to Prof. Onyango, the H.O.D Business School and Dr. Renson
Muchiri, Dean, School of Graduate studies and Research, both from KCA University, Nairobi,
for giving me various ideas on Research issue, methodology, priorities and steps to be followed
while doing a research and valuable comments and suggestions during dissertation seminars
organized frequently at the main campus, Ruaraka.
I am grateful to my supervisor, Dr.Katuse, Assistant Professor of Strategic Management School
of Business, United States International University, for his valuable help, encouragement and
constant guidance throughout my study period. His valuable comments and suggestions were
stimulating and without his help this work would not have been completed.
Another immense gratitude goes to my family members for their benevolent moral and material
support they offered me which kept my spirit of doing this Proposal moving. Had they not
encouraged and supported me, I couldn’t have made it.
God bless you all

v
DEDICATION In memory of my loving mother, the late Celina Apondi Ong’ang’o.
May her soul find eternal peace.

vi
LIST OF TABLES Table 3.1: Sample size and determination 37
Table 4.1: Distribution and response to questionnaires 44
Table 4.2: Age in years of respondents 46
Table 4.3: Level of education 47
Table 4.4: Marital status of respondents 48
Table 4.5: Married and staying with spouse 49
Table 4.6: Respondents with dependents 50
Table 4.7: Motives for joining MFIs 51
Table 4.8: Enterprise ownership 52
Table 4.9: Employment as a co-source of income 53
Table 4.10: Microfinance products available 54
Table 4.11: Product rating 56
Table 4.12: Access to products 57
Table 4.13: Distribution of MFIs services in the County 59
Table 4.14: Cost of MFIs products and services 61
Table 4.15: Purpose for borrowing 63
Table 4.16: Access to micro-credit facilities before joining microfinance 64
Table 4.17: Control of resources 65
Table 4.18: Financial status before and after joining microfinance 66
Table 4.19: Access to both primary and secondary needs 68
Table 4.20: Model summary 69
Table 4.21: ANOVA 70
Table 4.22: Co-efficient of regression 73
LIST OF FIGURE Figure 1: Sources of Income and Control group 18
Figure 2: Conceptual Framework 33

vii
Figure 3: Distribution and Response to questionnaire 44
Figure 4: Age in years of Respondents 45
Figure 5: Marital status of Respondents 49
Figure 6: Motives for joining microfinance 51
Figure 7: Availability of microfinance products 55
Figure 8: Access to products 59
Figure 9: Frequency of borrowing 62

viii
ACRONYMS AND ABBREVIATIONS
MFIs: Micro-finance institutions
SMEs: Small to Medium Enterprises
UNHSP: United Nations Human Settlement Program
YEP: Youth Enterprise Fund
BRAC: Bangladesh Rural Advancement Committee
KWFT : Kenya Women Financial Trust
CMA : Capital Markets Authority
DTM: Deposit Taking Microfinance
UNDP: United Nations Development Program
CBK: Central Bank of Kenya
MDG: Millennium development Goals
AMFI : Association of Microfinance Institutions
USAID United States Agency International Development

ix
TERMS AND DEFINATIONS
Poverty: Those living under one dollar a day (UN-Habitat, 2011)
Microfinance: The provision of financing services to low income clients,
including consumer and self-employed who traditionally lack access to
banking and related services (Jeniceek, 2008).
Economy: Wealth or resources of a region or country in terms of production and
consumption of goods and services (Yunus, 2007).
Poverty Alleviation: Development interventions embracing microenterprises as the key
unlocking the potential of stagnant economies and improving the
livelihoods of the poor (Wolfensohn, 2000; Rhyne, 2000)

x
TABLE OF CONTENTS DECLARATION ......................................................................................................................................... ii
ABSTRACT .............................................................................................................................................. iii
ACKNOWLEDGEMENT ............................................................................................................................ iv
DEDICATION ............................................................................................................................................ v
LIST OF TABLES ....................................................................................................................................... vi
LIST OF FIGURE ....................................................................................................................................... vi
ACRONYMS AND ABBREVIATIONS ........................................................................................................ viii
TERMS AND DEFINATIONS ...................................................................................................................... ix
CHAPTER ONE ....................................................................................................................................1
INTRODUCTION ............................................................................................................. 1 1.1 Background of the Problem .......................................................................................... 1
1.12 Background to Busia County ................................................................................................................................. 3 1. 2 Statement of the problem ............................................................................................. 6 1.3 Objectives of the study.................................................................................................. 8
1.3.1. General Objective ................................................................................................................................................ 8 1.3.2 Specific Objectives of the study ............................................................................................................................ 8
1.4 Research Questions ....................................................................................................... 9 1.5 Significance of the study ............................................................................................... 9 1.6 Scope of the study ......................................................................................................... 9 1.7 Assumptions of the study ............................................................................................ 10 1.8 Chapter summary ........................................................................................................ 10 CHAPTER TWO ............................................................................................................ 12 LITERATURE REVIEW .............................................................................................. 12
2.1 Introduction ................................................................................................................. 12
2.2 THEORETICAL FRAMEWORK .............................................................................. 12 2.2.1 Neo-liberalism Theory ........................................................................................................................................ 13 2.2.2 Participatory Development (PD) Theory .......................................................................................................... 14 2.2.3 A Critique of the Theories ................................................................................................................................... 14
2.3 Empirical Review of Literature .................................................................................. 18 2.4 Knowledge Gap in Relation to the Study Objectives ................................................. 26
2.5 Conceptual Framework ............................................................................................... 28 2.6 Chapter Summary ....................................................................................................... 32 CHAPTER THREE …………………………………………………………………….33 RESEARCH METHODOLOGY ……………………………………………………...33
3.1 Introduction ................................................................................................................. 34
3.2 Research Design.......................................................................................................... 34 3.3 Study Population and Sample ..................................................................................... 35 3.4 Sample Design ............................................................................................................ 36
3.4.1 Sample Size Determination and Sample procedures .......................................................................................... 36

xi
3.5 Data Collection ........................................................................................................... 37 3.5.1 Data Collection Methods and Procedure ........................................................................................................... 37 3.5.2 Reliability and Validity of the Instruments used in Data collection ................................................................... 38
3.7 Ethical Issues .............................................................................................................. 40
3.8 Chapter Summary ....................................................................................................... 41 CHAPTER FOUR ..................................................................................................................................... 42
FINDINGS AND DISCUSSIONS ................................................................................................................. 42
4.1 Introduction .................................................................................................................................... 42
4.2 Distribution and Response Rate to the Questionnaires .................................................................... 42
4.3.3 Marital Status of the Respondents ................................................................................................ 46
4.3.4 Respondents Married and Staying with their Spouse ..................................................................... 48
4.4 Motives to join Microfinance ........................................................................................................... 50
4.5 Self Employment ............................................................................................................................. 51
4.5.1 Response on Enterprise Ownership................................................................................................ 51
4.5.2 Response on Employment as Co-source of Income ......................................................................... 52
4.6 Number of Products offered by DTMs in Busia County. .................................................................... 53
4.7 Access to Products offered by DTMs' and its Impact on Venture Decisions/Resource Acquisitions ... 55
4.7.1 Response on the Number/Distribution of DTMs' in the Whole County ................... 58 4.8.1 Frequency of Borrowing by Members ............................................................................................ 61
4.8.2 Response to Purpose of Borrowing by Members ..................................................... 61
4.9 Response to Nature of Business Environment provided by DTMs for Members ...... 64
4.10 Impact of Micro-finance Institutions on Poverty Alleviation ................................... 68
4.13 Chapter Summary .......................................................................................................................... 73
CHAPTER FIVE ....................................................................................................................................... 74
SUMMARY, CONCLUSION AND RECOMMENDATION ............................................................................ 74
5.1 Introduction .................................................................................................................................... 74
5.2 Summary of the Study ..................................................................................................................... 74
5.3 Conclusion ....................................................................................................................................... 77
5.4 Emerging Policy Implications ........................................................................................................... 79
5.5 Suggestions for Further Research ..................................................................................................... 80

xii
REFERENCES .......................................................................................................................................... 81
QUESTIONNAIRE SAMPLE ...................................................................................................................... 85

1
CHAPTER ONE
INTRODUCTION
This chapter contains the background, statement of the problem, objectives of the study,
research questions, hypothesis, limitations and assumptions of the study.
1.1 Background of the Problem
There has been a tremendous growth of microfinance institutions (MFIs) in most of the
developing countries and Kenya is no exception. The efforts have not been brought about by the
government alone but also by non-governmental organizations and donors. The proponents of
microfinance base their argument on the fact that when well-managed, MFIs can be beneficial.
Its supporters firmly believe that these institutions can reduce poverty levels a great deal. There
are two broad categories of MFIs in Kenya, namely non-deposit taking and deposit taking.
Currently there are numerous non-DTM and others are still coming up. In Kenya, non-DTM are
regulated by the ministry of Treasury while deposit taking fall under CBK. As of December last
year, CBK had registered eight DTM namely; Faulu Kenya, K.W.F.T, Rafiki (a subsidiary of
Chase bank), Remu, SMEP, Uwezo, Century and Sumac. (CBK) The paper will be more
concerned with deposit taking MFIs. MFIs use various lending models throughout the world.
Some of the major lending models are: the Grameen model and its Solidarity Group version,
Cooperatives and credit union model, visaca/village and Community Banking Model, and
Rotating Savings and Credit Association (ROSACA) or Osusu model, Self Help Group (SHG) –
Bank Linkage Model etc (Chandra, 2009). However it is important to interrogate how effective
and efficient they are in addressing the social and economic welfare of the poor (Sharma, 2000).
A number of definitions have been given such as, Microcredit, or microfinance, is banking the

2
un-bankable, bringing credit, savings and other essential financial services within the reach of
millions of people who are too poor to be served by regular banks, in most cases because they
are unable to offer sufficient collateral. In general, banks are for people with money, not for
people without according to Oikocredit (2004). Yunus (2003) argues that microcredit is based
on the premise that the poor have skills which remain unutilized or underutilized. It is definitely
not the lack of skills which make poor people poor….charity is not the answer to poverty. It only
helps poverty to continue. It creates dependency and takes away the individual’s initiative to
break through the wall of poverty. Unleashing of energy and creativity in each human being is
the answer to poverty. This is has been found to be an approach the government should consider.
Kenya is continuously undergoing financial reforms and this has seen the financial sector
enjoy freedom. These reforms have brought about efficiency and effectiveness in the operations
of the sector. In addition, the government through an ACT of parliament has regulated operations
of microfinance institutes (MFIs). MFIs came up in an effort to reach and tap in poor who had no
access to commercial banks. Generally the perception initially was that MFIs were meant for the
poor and were an effort to address poverty levels. MFIs were majorly situated in rural areas
where the bulk of the poor lived. It is important noting that some of the big banks began as MFIs
such as Equity, Family, K-Rep, and Jamii among others. Currently, MFIs are no longer limited in
rural areas or a preserve of the poor rather they are giving established banks stiff competition.
It’s important to evaluate the current state of affairs on the ground; are MFIs still playing the
important role of addressing poverty in rural set-ups or are they commercializing their service?
Commercial banks do consider the poor high risk and have been frustrating government efforts
in availing cheap credit. MFIs have been a blessing for those perceived to be poor in that they are
filling the void left by commercial banks (CBK).

3
The government has put in place the necessary legislation to control and support MFIs through
the Deposit Taking Microfinance Bill. This is very important since more and more microcredit
institutions are coming up thus facilitating financial intermediation. Each country understands
the importance and stability of credit flow in alleviating poverty levels among its citizenry.
According to the Poverty Reduction Strategy Paper (PRSP) of 1999, a large number of Kenyans
derive their livelihood from the MSEs. Therefore, development of this sector represents an
important means of creating employment, promoting growth, and reducing poverty in the long-
term. However, in spite of the importance of the sector, experience shows that provision and
delivery of credit and other financial services to the poor by formal financial institutions, such as
commercial banks has been below expectation. This means that it is difficult for the poor to
climb out of poverty due to lack of credit services for their productive activities. Therefore, new,
innovative and pro-poor methods of financing low-income households and MSEs based on sound
operating principles need to be developed (Adera, 1988). It’s worth appreciating that there are
those who can access these services, if so; the question then is how this impacts their lives as
well as addressing poverty levels?
1.12 Background to Busia County
Busia is a county in the former Western Province of Kenya. It borders Kakamega County
to the east, Bungoma County to the north, Lake Victoria and Siaya County to the south and
Busia District, Uganda to the west. The main economic activity is trade with neighboring
Uganda, with Busia town - the county headquarters and largest town - being a cross-border
centre. Away from town, the county economy is heavily reliant on fishing and agriculture, with
cassava, millet, sweet potatoes, beans, and maize being the principal cash crops (Busia county

4
website). The county has a total population of 743,946 as per 2009 census (Kenya National
Bureau of Statistics).
Chandra (2009) argues that Poverty and Poverty Alleviation are frequently heard
buzzwords today. Poverty is a multidimensional phenomenon and depends on the context and
perspective that one is looking at. According to Yunnus (2003), Poverty is that characteristic of
being in a state of joblessness, illiteracy, landlessness, homelessness, lack of adequate capital,
facilities and food to earn a decent living and also powerlessness. Poverty alleviation is,
therefore, the act of reducing the scourges of the above conditions of an individual or
community. Poverty levels in this country are documented in various journals. According to the
Kenya Integrated Household Budget Survey 2005/2006 statistics provided by (former) Planning,
National Development and Vision 2030 Ministry, poverty level in Busia County is estimated at
66 per cent above the national average that was at 46 per cent, placing the county among the
poorest counties in the country. No existing literature is available to show any prior studies done
in the area under study.
There is evidence to suggest that the poor use micro credit for two purposes (Sharma,
2000). The first is for investment and generation of wealth. This is the most documented purpose
and probably the officially accepted and promoted purpose, by many financial institutions. The
second is for consumption smoothening. This is less documented and hardly discussed,
especially in the context of the rural poor. The poor are usually faced by many challenges in rural
areas such as crop failure, sickness, and fee payments among other contingencies. There is little
or no documented evidence as far consumption is concerned. Micro-credits are important for
poverty reduction and alleviation for the poor. Credit for investment will reduce income poverty
if the project is profitable and grows. But credit for consumption smoothening is unlikely to

5
reduce the poverty level of the borrower. But it will prevent the borrower from falling deeper
into poverty levels. In the long run, if the shock (for example crop failure) does not repeatedly
occur or is not too prolonged, the credit may facilitate poverty reduction by creating
opportunities for the borrower to participate more fully in the production process through more
healthy and trained population.
Therefore, MFIs are important for the rural poor, but what is the situation? (Semboja,
2004) Those advocating for the measure of the MFIs impact hold that there is always an
opportunity cost in as far as allocation of funds is concerned. It’s beneficial to find out if the cash
diverted to improve the social and economic welfare of the poor would be beneficial in the long
run, than investing in certain projects such as health, agriculture, education etc. In relation to this,
two approaches have been fronted further in analyzing the impact of micro-credit. One such
approach is the ‘investment led’; it holds that there must be a measure of return on the
microcredit advanced. It examines if greater access to credit facilities can indeed bring about an
increase in income, consumption and wealth creation among the poor. The second approach is
‘insurance-led’ which relates to how access to credit assist households in upholding expenditure
when faced by income shocks ,such as a bad harvest or expenditure shocks e.g. healthcare costs.
(Sharma, 2000)
The outcome of MFIs on poverty rests on an enticing win-win proposition that:
Microfinance institutions that follow the principles of good banking will also be the ones that
alleviate the most poverty. The assumption being that with good banking practices it is possible
to cover costs and operate in a sustainable manner to continue serving clients and alleviating
poverty (Murdoch, 2000). A win-win situation between the poor and the microfinance
institutions is a possibility. MFIs should stick to good banking practices as well as the ACT

6
governing them; this may allow them to make a return on their investments. On the other hand
the poor who interacts with these institutes will be granted access to credit facilities at affordable
rates and eventually turn around their lives. The point is that the poor who borrows is expected to
repay the microcredit facility advanced. The credit advanced as earlier seen is assumed to be for
investment and not consumption Smoothening purposes. If they are able to meet their debt
obligations then it can be argued that their enterprises are making a positive return. In the long
run the welfare of the poor will improve and in general the society at large.
However there has been an on-going debate as to the importance of evaluating MFIs
performance in terms of returns. The argument is that, they are not profit based institutions but
then who or which organization is willing to fund ventures that return nothing. Adam & Von
Pische, (1992) argued that “debt is not an effective tool for helping most poor people to enhance
their economic condition be they operators of small farms or micro entrepreneurs”. This is
because the poor are normally faced by numerous constraints. Also in support of the same view
is Gulli (1998) who argues that credit is not always the main constraint for micro enterprises´
growth and development, and that poor people demand a wide range of financial, business
development and social services for different business and household purposes. Gulli questions
how to evaluate and rate MFIs that are indeed transforming the lives of its members (poor)
though are yet to achieve financial stability as institutions.
1. 2 Statement of the problem
Microfinance has achieved much publicity since the work of Professor Muhammad
Yunus and Grameen bank, an institution he founded in 1970s. For a long time the perception was
that microfinance was full of success stories as far as poverty alleviation is concerned with
minimal critique. It is important that the proposition that “microfinance reaches and helps the

7
poor most” be proven and not just assumed. The positive impact of microfinance was as a result
of success stories told across the globe which was just an assumption (Kiiru, 2007). However
Aghion and Morduch (2005), argue that it is important to have statistically concrete evidence
that cuts across the board rather than rely on these anecdotes or unverified success stories. Since
1990s, a number of studies have been done on the subject and this has not stopped. The findings
have been quiet engaging as the opinion is still varied among different scholars. As will be seen
in the next chapter, there are those strongly advocating for microfinance while others opine that
it makes the poor poorer.
The ‘mid-ground argue that after all there is no change in the social-economic welfare of
the poor as far as microfinance is concerned. For example those against microfinance like Adam
and Von Pische (1992) argued that “debt is not an effective tool for helping most poor people to
enhance their economic condition be they operators of small farms or micro entrepreneurs”. The
point here is that other than financing, the poor are faced by a variety of constraints. On a more
positive note, Khandker (2006) observes that microfinance has a positive impact not only on
poverty alleviation but also in terms of ‘spill-over’ effect to the rest of the community. In support
of this was Murdoch (1999) who whoever had a rider by stating that even in the best of
circumstances, credit from microfinance programs helps fund self-employment activities that
most often supplement income for borrowers rather than drive fundamental shifts in employment
patterns. It (microfinance) rarely generates new jobs for others and success has been especially
limited in regions with highly seasonal income patterns and low population densities.
Other researchers such as Coleman (2006) argued that microfinance may be effective but while
this is pronounced among the rich it is insignificant among the poorer. Aghion and Morduch
(2005) observed that microfinance has a positive impact on poverty. Many studies have been

8
conducted but the findings have never been conclusive. Kiiru (2007) argues for more research to
be directed towards not just specific results but also the context within which particular results
are expected. What worked in a particular socio cultural and economic context may not
necessarily work the same if the socio cultural and economic conditions are changed in another
context. In addition, women entrepreneurs in developing economies are not empowered
economically in African countries such as Nigeria and Kenya (Copestaal, 2008). Based on the
above, the study sought to answer the research question; what is the impact of Deposit Taking
MFIs on poverty alleviation in Busia County?
1.3 Objectives of the study
1.3.1. General Objective
The general objective of the study was to investigate the availability, accessibility and
impact of MFIs in Busia County.
1.3.2 Specific Objectives of the study
The specific objectives of the study were;
1. To ascertain the various types of products/services offered by deposit taking MFIs in the
area under study.
2. To investigate the cost of products offered by MFIs to their members in the area under
study.
3. To explore the level of penetration of deposit taking MFIs services in the area of study.
4. To probe the business environment offered by deposit taking MFIs to members in the
area of study
9
1.4 Research Questions
The study sought to respond to the following research questions
1. To what extent have MFIs availed and differentiated their products to resident in the area
of study?
2. To what levels of affordability are the products offered by MFIs in the county?
3. What is the level of penetration by MFIs in the county as a whole?
4. What is the perception of members as far as microfinance operations/business
environment is/are concerned?
1.5 Significance of the study
The study findings will be important to various categories of stakeholders. Economic
empowerment of the poor accelerates economic growth of a country by enabling these people get
access to credits, acquisition/control of resources, self-employment and increase savings,
especially in the developing economies. The study of MFIs services and their impact in the study
area is important in providing vital information that will enable to take effective measures by
MFIs management and policy makers to improve the MFIs performance. The outcome is
therefore useful in helping the microfinance institutions identify innovative options and
institutional arrangements that would serve as an input to policy makers in formulating economic
empowering policy. This study provides a window for further studies to advance on this topic
through gaps left by this study.
1.6 Scope of the study
The study was carried out in Busia County, which is a town and as well county. The
study targeted those respondents who have been with the MFI for a period ranging between 6-36
months. The respondents were members drawn across various parts of the entire County. There

10
were those who were got from the MFIs banking halls while those in far flung areas were
reached by the help of the institutions field officers during their weekly meetings. This ensured
that the views of all members across the area of study were well captured.
1.6.1 Justification of the study
Microfinance has been in Kenya for a few decades with the sole aim of addressing
poverty levels. There are many MFIs spread far and wide across the country and Busia County is
no exception. However it’s important to note that despite the operations of these institutions,
poverty level in this County is higher than the national average. Further, no published work is
available to prove that a study has been executed on the same in the area under study. The
mentioned reasons are thus the guiding ground that leads the researcher to choose Busia County.
1.7 Assumptions of the study
The study assumed that:
1. The respondents objectively revealed the truth in their responses while filling the
questionnaires.
2. The respondents are able to understand and interpret the test items when filling their
responses once they are alone.
3. The study findings can be generalized as presenting a similar picture to other wider areas.
1.8 Chapter summary
There have are still ongoing debates concerning MFIs and micro-credit facilities. Opinion
is divide as to whether they indeed arrest poverty or it is just wastage of scarce resources that
would have been put to good use. Majority of those in rural areas lack training, have limited or
do not put in practice skills attained. They tend to mix family finances with those of the ventures.

11
In some instances they do combine the operations of different enterprises irrespective of their
performance.
The danger here is that it is difficult for them to separate and discontinue the loss making
ventures. It is general assumed that the repayment of micro-credit facilities extended is a
reflection of the performance of these ventures. The disparity between inflation rate and the
interest rates (that are unstable at times) charged by these institutions has been a major source of
concern. The above among other factors have been a challenge for the poor trying to better their
situation. The conflicting results from previous studies make this an area worth investigating
more. Thus it is important to evaluate how the MFIs have impacted the poor people living in
Busia County.

12
CHAPTER TWO
LITERATURE REVIEW
2.1 Introduction
The chapter will seek to bring out both the empirical and literature review studies done
earlier pertaining to MFIs and poverty alleviation in rural set-ups. An emphasis will be put on
those theories that are directly related to the research questions stated above. The ultimate aim of
the review is to give us an insight into existing knowledge. The gap identified is what the study
in discussion aims to address.
Microenterprise development is private-sector-led economic development with a social
aspect. Microenterprises are generally expected to provide employment, and thus sustainable
incomes, as well as lower-cost goods and services for poor people (Kirkpatrick & Hulme, 2001).
Meanwhile, the profits of micro and small business are more likely to stay local, creating flow-
on benefits in disadvantaged areas. Microfinance has a long history that goes all the way back to
the developments in rural credit and agriculture modernization. For over 30 years now, there has
been so much debate concerning microfinance and its impact on poverty alleviation. The
argument as to how it can be viewed as a program that arrests poverty, bring about a ‘localized’
economic and social developments still continue. It is important at this point to put into
perspective the various schools of thoughts and arguments concerning the subject.
2.2 THEORETICAL FRAMEWORK
The study examined two major theories that address motivation for micro-credit among
the poor in the society. These are the Neo-liberalism and Participatory development theories.
Before examining in depth the two schools of thought it is important to highlight their

13
differences. There are three main points of divergence between the two theories as far as
microfinance is concerned.
Firstly, neo-liberalism is focused on the betterment of the market, whereas participatory
development is focused on the betterment of a community. Secondly, neo-liberalism relies of the
rational choices of the individual, whereas participatory development relies on the collective
choices of groups of and societies. Finally, given the neo-liberal bias toward economics, neo-
liberals are more likely to view their borrowers as clients, whereas those valuing participatory
development consider their borrowers as beneficiaries (Emily, 2006). Further neo-liberalism is
fundamentally concerned with economics while participatory development is more about
empowering the community economically.
2.2.1 Neo-liberalism Theory
This was more pronounced in the 1980s as the development theory though it’s still in use
to date. International corporations such as World Bank and International Monetary Fund
embrace it as an important tool to tackling poverty or as a tool of development. This was
happening within a neo-liberal international development climate that was shifting from
providing social services to poor people, to promoting self-help development and market
integration. Observing the existing, entrepreneurial capacity of ordinary people in poor countries
to employ themselves and create local jobs and wealth, development practitioners seized upon a
vision of poor people as entrepreneurs (albeit micro entrepreneurs) Hart (1973) and Peat tie
(1987). Microfinance or micro-credit may easily pass as an area where neo-liberalists would
care less. Simon (2002) argues that as a ‘bottom-up’ method of poverty alleviation, micro-credit
clashes with the typically ‘top-down’ methodology of neo-liberalism.

14
However, micro-credit for micro-enterprise becomes a neo-liberal construct when one views it as
the formalizing an informal economy. Emily (2006) states that by exposing pre-existing informal
economic networks, as well as providing the opportunity for the creation of additional formal
businesses, neo-liberalism posits that the macroeconomic situation of the state will improve.
2.2.2 Participatory Development (PD) Theory
The theory is concerned with economic power that is approached from a holistic point of
view. The empowerment includes structures of knowledge, social situations, and political
influences. Participatory development values local diversity and agendas, seeking to implement
projects using local knowledge, local capital, and local labor. The community is the agent that
requires development, rather than the individual or the state. As such, PD is largely delivered by
NGOs and community organizations rather than national or international bodies (Emily, 2006). It
can be argued that the ‘instrumental’ strain of participatory development provides the link
between it and microfinance. Emily further states that within the instrumental view, the goals of
development are valid although the institutions are malfunctioning, but can be improved by
involving the beneficiaries.
Thus participatory methods play a crucial role in the assessment of microfinance in
poverty alleviation among the poor in the community. Participatory methods for impact
assessment began to be developed in the 1970s. The methods are most commonly associated
with the spread of diagramming and visual techniques.
2.2.3 A Critique of the Theories
Conning et al. (2003) divide the evolution of the Bolivian market for micro-credit into
three stages. These formed the basis of a study on the motivation theories for micro-credit. Three
organizations were chosen, each characterizing one of Navajas et al.’s stages of micro-credit in

15
Bolivia: Banco Solidario, Caja Los Andes, and ProMujer. Caja Los Andes was the most neo-
liberal micro-credit institution examined. Its emphasis on economic efficiency, the rational
individual as a borrower, and its status as one of the most profitable micro-lenders are consistent
with neo-liberal principles. However, Caja Los Andes is not providing micro-credit to the
poorest of the poor, a value of micro-credit that was specified in a summit on micro-credit held
in 1997 (Emily, 2006). This is one of the weaknesses in neo-liberal theory. If market forces are
forces are to dictate the development of microfinance, then increased competition will mean
micro-lenders will be interested in affluent lenders as it guarantees them a higher return on loans
as seen in Bolivia. The problem here is that there is segregation of the clients as the poor in the
society are shunned and the elites embraced. Thus the danger with neo-liberalism is that it may
suffocate economic empowerment of the very poorest in the community if not checked.
ProMujer, is on the opposite end of the continuum, conforming to the theory of
participatory development. Here, loans were meant to promote collective progress through
communal banks and mandatory saving. However, this has been criticized especially the training
before funds can be disbursed. Though it is important more so for women borrowers who tend to
mix business and household finances to undergo training, it tends to be seen as patronizing and
time wastage (Simon, 2002). Refusing to move to higher-profit borrowers like Caja Los Andes,
ProMujer depends on poor to sustain its well-being. The conflicts of condescending training and
an unnatural reliance on poverty restrict the further growth of NGOs such a ProMujer (Emily,
2006). Bancosol is a mixture of the two theories. The exhibits characteristics of participatory
development through the group lending approach but its drive for status as a commercial bank
was largely motivated by neo-liberal ideals. Bancosol was the most distinctively neo-liberal of
the three studied. This is because it viewed its lenders as clients and not as borrowers. By

16
attempting to straddle both theories while new micro-lenders target specific demographics,
BancoSol is losing its ability to appeal to the general public (Bancosol, 2005).
Microfinance and its impact on poverty can be examined along a spectrum where neo-
liberalism lies on one end and participatory development on the other extreme end. It can be
deduced from the studies in Bolivia that neo-liberalism can ignore the poor by embracing the
‘elite’. Participatory development such as joint liability can stifle innovation and could preserve
poverty. A hybrid of both theories can stagnate and alienate borrowers. It’s important then to
interrogate the school of thought embraced by micro-lenders. This is because the approached
embraced guides how the lenders determine and interact with borrowers. Shunning the poorest of
the poor may mean little impact on poverty by microfinance.The argument behind microfinance
and micro-credit is that their availability is meant to improve the living standards of the very
poor in the society and their overall economic well-being. However the challenge in assessing
microfinance impact has been to separate and capture the causal role. Kiiru (2007) points out that
for the impact to be well captured one must control for selection and reverse causation. To
picture this, if the poor are able to improve their lifestyles after the intervention, it’s important to
know if the improvements are significant minus the intervention. In addition to this if,
‘wealthier’ households can access loans more often, then the question is whether the loans made
them richer or is their ‘status’ a factor in getting loans frequently, the latter is the reverse
causation (Kiiru, 2007). It is important to address selection bias which is about traits of
participants in the microfinance program. There could be participants in the program who could
still do better due to natural entrepreneurial skills, academics among other factors. Aghion and
Morduch (2005) argue that there is a possibility of overestimating micro-enterprise profits by
100% if both selection bias and reverse causation are not well addressed.

17
Consider the figure 2.1 as put forth by the study Aghion and Morduch (2005). T
represents the ‘treatment’ group being those using microfinance services. T1 being the economic
status and income of the households at month (0) since joining the program. T2 will be taken as
the income of the household at a given period of time in our case 36 months. The difference
between (T1-T2) gives us the net impact that is both measurable and immeasurable. The impact
may be due to some pre-existing attributes, situation or due to microfinance. For simplicity
purposes only those active members of MFIs are included in the study. However it is important
to point out that certain situations may affect both MFIs and non-MFIs members equally. A an
example is the weather elements such as a bumper harvest on good rainfall, that enables
households earn extra income and the opposite in dry spells. Therefore attributing the difference
between (T1-T2) entirely may be incorrect (Kiiru, 2007).
Aghion and Morduch (2005) stress on the importance of having a ‘control’ group to
address the issue of selection bias during the study. This consists of those people who are not
and have never been members of MFIs. Similarly as seen above, C1 represents the level of
income on the commencement of the study at time, month (0). C2 represents the level of income
at the end of the study period, after 36 months. The base income levels for the “control group”
(the non-participant households) may be different from the base income levels of the “treatment
group” (the participant households). What this means is that comparing the difference between
T2 and C2 will help address biases due to the broadly felt economic and social changes, but it
will not account for differing base levels. Isolating the true impact of microfinance requires
comparing the difference T2-T1, with the difference C2-C1, which has also been referred to as
the difference-in-difference approach (Aghion and Morduch 2005).

18
Figure 1: Sources of Income for treatment and control group
Effects on income of various factors:
Unmeasured Attributes
Measured Attributes
Village Attributes
T1 T2 C1 C2 Month 0: Month 36: Month 0: Month 36: Before intervention After intervention Before intervention After intervention
Source; Adapted from Aghion and Morduch 2005.
2.3 Empirical Review of Literature
According to UN-Habitat (Nairobi, 2011) MFIs efforts to keep the cost of transactions
and interest rate levels down cannot guarantee escape from poverty by clients. However there is
need for prolonged period of successive borrowing, investing and repayments. Though tiresome,
each cycle brings the client closer to overcoming poverty. According to CGPA (2010), MFIs
may vary in a number of ways such as methodologies, legality or mission but of importance is
that all of them play the important role of providing finance to the poor. The services include
micro-credit loans, savings, money transfer systems, insurance and pensions (Rieneke, 2010).
MFIs help the poor set-up business; manage risk, consumption smoothening as well as
accumulation of assets.
“Treatment” group: Households that 00access microfinance
“Control” group: Households without access to microfinance
Broad economic Changes
Unmeasured Attributes
Measured Attributes
Village Attributes
Broad economic Changes
Unmeasured Attributes
Measured Attributes
Village Attributes
Unmeasured attributes
Measured Attributes
Village Attributes
Microfinance impact

19
It is important bearing in mind that the poor having been shunned by commercial banks
had no other source credit. As Yunus (1999) found, the poor had no option other than approach
the loan sharks who were charging extremely high rates. Microfinance enables self-employment
and running of small enterprises, these results in an increased source of income for the
household. The role played by microfinance in poverty reduction cannot be over emphasized.
The year 2005 was proclaimed by UN as the year of microcredit and several conferences were
held as ‘front runner in poverty alleviation strategies’ (Lard and Barres, 2007). This was to
appreciate and take stock of the achievements since the pioneers like Yunus made such a big
success out of the concept. To show its significance, the following year 2006, a total of
approximately $ 1.5B was donated towards this noble course, while private investment in the
same year exceed $0.5B (Rieneke, 2010). One of the Millennium Goals calls for reduction and
possibly halving the incidence of extreme poverty. There are currently 1.1 billion extremely poor
in the world and the question is what constraints must be overcome if microfinance is to be able
to serve this mass of people? (UN Nairobi, 2011). There is anecdotal evidence that MFIs that
target poorer clients do achieve substantially higher repayment rates than those that target richer
clients. Of importance is that if these MFIs can do better, then it can be inferred that those it
supports must be fairing on well. According to Murdoch and Haley (2002), empirical indications
are that the poorest can benefit from microfinance from both an economic and social well-being
point-of-view, and that this can be done without jeopardizing the financial sustainability of the
MFI. While there are many biases presented in the literature against extending microfinance to
the poorest, there is little empirical evidence to support this position. However, if microfinance is
to be used, specific targeting of the poorest will be necessary. Without this, MFIs are unlikely to
create programs suitable for and focused on that group.

20
The following is an example of studies done and that strongly advocate for microfinance
in fighting poverty. Remenyi, Joe & Quinones, Benjamin (2000) in their study found that,
household income of families with access to credit is significantly higher than for comparable
households without access to credit. In Indonesia a 12.9 per cent annual average rise in income
from borrowers was observed while only 3 per cent rise was reported from non-borrowers
(control group). In Bangladesh, a 29.3 per cent annual average rise in income was recorded and
22 percent annual average rise in income from no-borrowers. Sri-Lanka indicated a 15.6 rise in
income from borrowers and 9 per cent rise from non-borrowers. In the case of India, 46 per cent
annual average rise in income was reported among borrowers with 24 per cent increase reported
from non-borrowers. The effects were higher for those just below the poverty line while income
improvement was lowest among the very poor. (Hossain (1984) found that Grameen Bank
members had incomes about 43% higher than the target group in the control villages, and about
28% higher than the target group nonparticipants in the project villages. Similarly, Kamal (1996)
noted higher rates of per capital income among Microcredit program borrowers compared to
those who did not borrow. According to Chowdhury et al (1997) women (and men) participating
in BRAC sponsored activities had more income (both in terms of amount and source), own more
assets and are more often gainfully employed than non-participants.
A study commissioned by World Bank in collaboration with the Bangladesh Institute of
Development Studies, and cited by Hashemi and Morshed (1975) showed that the Grameen Bank
not only reduced poverty and improved welfare of participating households but also enhanced
the household’s capacity to sustain their gains over time. All the above examples are an indicator
that developing countries faced with high levels of poverty can use microfinance as a tool.
However there are those in the ‘middle ground’ concerning effects of microfinance on poverty

21
alleviation. They point out the beneficial impact but then argue that microfinance does not assist
the poor as often portrayed. In their study done in 1996 and again two years later, Hulme and
Mosley, find that contrary to earlier beliefs, microfinance alone cannot lift the very poor out of
poverty. It can only ‘better’ the situation but rarely lifts them above the poverty line as outlined
by United Nations (Hulme & Mosley, 1996; Mosley &Hulme, 1998). Sharma (2000) while
evaluating the impact of microfinance on poverty is of the view that since much of the impetus
behind this large and increasing support for microfinance hinges on the assumption that its
economic and social impacts are significant, it needs to be examined more closely. Though in his
paper there is no argument as to the importance of the role played by MFIs, he questions the
accuracy of the results. Sharma (2000) argues many impact studies fail to reveal the exact
processes by which poverty is affected. To improve the impact of microfinance, more explicit
discussion of the actual process of impact is needed. Finally, impact has been evaluated only for
the most successful programs, and generalization can be dangerous. The argument by Sharma
seems to be supported by UN-Habitat publication (Nairobi, 2011). The findings are that though
microfinance reduces poverty, the actual mechanism and rate have not been accurately captured.
Then there are those who hold that microfinance has no effect on poverty. The most-cited
source of evidence on the impacts of microfinance is the early set of studies collected by David
Hulme and Paul Mosley (1996). The findings of these studies are provocative: poor households
do not benefit from microfinance; it is only non-poor borrowers (with incomes above poverty
lines) who can do well with microfinance and enjoy sizable positive impacts. More troubling is
the finding that a vast majority of those with starting incomes below the poverty line actually
ended up with less incremental income after getting micro-loans, as compared to a control group
which did not get such loans (Chowdhury, 2009). Milford Bateman (2011) argues that most

22
individual microfinance programs had been evaluated in-terms of their impact on those targeted
as well as the surrounding area. However due to the fact that the early studies were conducted by
players such as MFIs and not the poor, voices of biased outcome have been heard. The point is
that the studies normally concentrated and amplified only positive and ignored negatives
outcomes. Thus clients that made it were projected positively while doing little to shade light on
the unsuccessful ones. This called for independent studies by people who had no interest other
than information in the industry. Khandker (1998) while performing a study on three major
MFIs in Bangladesh namely BRAC Grameen Bank and RD-12 found that up to 5% of the
participants improved income and lives by borrowing from these institutions. As stated earlier
most of the evaluations were done by MFIs, microfinance advocacy groups and multi-national
partners who were funding some of the institutions. Need for independent studies meant
universities had to lead by example. Murdoch, 1998; Coleman, 1999 questioned the rigor and
validity of earlier evaluations, highlighting data and methodological problems.
As Milford (2011) put it, there was a shift to more rigorous forms of impact evaluation,
such as the randomized control trial (RCT) methodology. This aims to avoid the selection bias in
the choice of treatment and control groups that might occur if, for example, those receiving a
microloan were already more entrepreneurial than those in the control group. Any impact here
would have to be attributed to this characteristic, rather than to a microloan. RCT methodology
ensures that both groups studied are as identical as possible, aside from the receipt of
microcredit. In 2007 onwards studies done using RCTs began being published and the results
though mixed were interesting. This is because a majority of them found that microfinance had
little if no impact at all on poverty alleviation. One such study is Straus (2010) which had the
initial findings of a conducted by Esther Duflo and others over two years targeting approximately

23
5000 households in rural Morocco. The research found the “effect of microfinance on
consumption to be negative and insignificant, with no impact on new business creation,
education or women’s empowerment according to Karlan and Zinman (2009) and Banerjee et al.
(2009) found almost no impact from a number of large-scale microfinance programs. The work
of Rood man and Morduch (2009) presented in interesting results. They visited the work done by
Pitt and Khandker (Khandker, 1998; Pitt and Khandker, 1998), whose work had been cited
severally supporting microfinance in poverty reduction.
Based on the same data used by the two in their earlier studies, they found that
microfinance had little effect in addressing poverty if none at all. ‘Strikingly, 30 years into the
microfinance movement we have little solid evidence that (microfinance) improves the lives of
clients in measurable ways’ was their conclusion (2009:4). ACCION International et al., (2010)
published an admission by six major leading microfinance advocacy bodies that indeed it is
difficult for studies to demonstrate the impact of microfinance quantitatively for methodological
reasons (implicitly conceding the lack of robust quantitative evidence), and fell back on
anecdotal evidence, citing carefully selected anecdotes and uplifting case studies from
individuals. Microfinance has been viewed as having failed to achieve the intended purpose as
far as poverty alleviation and improving social welfare is concerned. Ditcher (2006) found that
microcredit loans have been used for consumption smoothening rather than investing in
enterprises. Consumption smoothening arrests risk and vulnerability in the short-run but fails to
do so in the long term. The danger here lies in the fact that there is a possibility of poor
substituting the microcredit loan into an income source, the result being sinking further into
poverty (Collins et al., 2009). Consumption smoothing can certainly reduce risk and
vulnerability, but it can lead poor individuals to substitute microcredit for non-existent income in

24
an unsustainable way. Growing dependency upon microcredit, coupled with high interest rates,
means that a growing proportion of the unstable income of the poor is siphoned off to cover
interest charges (Milford 2011). This was the dynamic behind the current microfinance crisis in
Andhra Pradesh, India according to Srinivasan (2010). Muhammad Yunus while presenting his
argument before international donors cited the need to stop the poor from accessing loan sharks
that were offered at a higher rate.
However at the end of it all, the people were seeing still an opportunity to get money but
not the risk of worsening their lot if it was not put to good use. More importantly those whole
failed to repay the microcredit saw the option of approaching loan sharks to better the situation.
Unsustainable microcredit indebtedness can be a common occurrence across many developing
countries if the necessary steps are not taken. This can well be illustrated by the following cases;
in India; in Bangladesh (Banking with the Poor, 2009); and in Peru (Kevany, 2010); and also in
transition countries, notably in the Balkans (Bateman, 2011) and especially in Bosnia and
Herzegovina (Cain, 2010). Ghokale (2009) found that in Andhra Pradesh, the poorest households
have increased their engagement with local loan sharks to pay off microloans they obtained all
too easily from their local MFIs. It is important to understand why many microenterprises fail in
their infancy. A number of studies have been done in these regard and the findings have not been
very encouraging. It is thus upon policy makers to curtail the dangers associated with this high
failure rates (Storey, 1994). In Bosnia and Herzegovina, a team dispatched by World Bank to
carry a study on microfinance enterprises, found that close to 50% of them failed within the first
year (Demirgüç-Kunt et al., 2007). George (2005) carried a study in Tamil Nadu state in India
and the outcome was telling. He found that after three years of operation, only a mere 2% of the
original was still surviving. Such failure can lead to irretrievable poverty. The social necessity to

25
repay microloans attached to failed microenterprises can strip the poor of all their remaining
assets. This is according to Davis (2007) on his work carried in Bangladesh. Institutional
economics helps to clarify the issue of development through microfinance. A major claim long
made of microfinance is that it can reduce the credit constraints that often face potential entre-
preneurs in poor communities, and that preclude enterprise development (Stieglitz, 1998).
A contrasting viewpoint is that credit constraints affecting tiny individual enterprises are
not the core problem. It is the overall lack of access to credit for small and medium enterprises
that prevents microenterprises growing into anything more substantive (Milford, 2011). It can be
deduced from above that there are still differing opinions on the impact of microfinance on
poverty. It’s not conclusive how micro-credit facilities alleviate poverty and this still proves to
be an area that needs continuous study. The philosophy adopted by MFIs whether neo-liberalism
or participatory development determines its level of penetration. As seen earlier, whereas one
philosophy advocates for reaching the poor masses, the other is for the not so poor.
Microfinance plays an important role in poverty alleviation though this may be through a tiring
cycle of borrowing and repaying the loans advanced. It must be emphasized that as the poor
borrows specifically for economic empowerment so is the MFI(s) expected to stick to the best
principles of practice ((Rhyne, 2003) For majority of the Kenyans living under-a-dollar a day
and faced with high unemployment rates, microfinance is a powerful tool that can better their
lives. It provides the only avenue of accessing scarce resources especially after being shut out by
the big commercial banks. It does not matter whether the funds are accessed individually or
through groups. Besley (2004) argues that financial services allow household to attain higher
standards of living with the same resource base, while for enterprises and farmers, financial
services can facilitate the pursuit of Income growth. Reduction in poverty should be seen in a

26
direct change in the lives of the subjects (poor). Improved livelihood results higher standards of
living, increased demand for goods/services as well as acquisition and control of economic
resources.
Asset are important as they have ability on their or (or in combination with others) to
generate a stream of wealth over periods of time (Hoddinot and Quisumbing 2003). Dercon
(2001) observed that sustainable livelihood approaches have forced more on assets to measure
vulnerability to poverty. The relationship that exists between microfinance, households and
income generation is likely to be altered by some unexpected shocks. The shocks may take the
form of failed business ventures, sickness, non- repayment by peers (in cases of joint liability) to
some unexpected occurrences that hinder generation of income. The shocks thus affect the
capabilities of households to generate income or make subsequent loan repayments (Kiiru,
2007). According to Rood man and Qureshi (2006) the danger in these scenarios is that the poor
may incur more debts in an attempt to settle existing ones. This pushes them further down the
poverty line. Rogally (2007) found that default on loan repayment had severe consequences and
in some instances led to break-up of families.
2.4 Knowledge Gap in Relation to the Study Objectives
An evaluation of the literature review shows that opinion is divided as to the impact of
microfinance in poverty alleviation. Given differing findings, the assessment of microfinance
programs’ effects on economic empowerment on Entrepreneurs (poor) remains an important
field for researchers, policymakers and development practitioners (Gupta, 2005). As seen earlier,
data from the Ministry of Planning and Vision 2030 places poverty levels at 60%, a rate higher
than the national average. It should be noted that MFIs have been in operation in the County for
over a decade now, why then the scenario if microfinance alleviates poverty? Aghion and

27
Morduch 2005 agreed that microfinance alleviates poverty but cautioned that this should not be
taken as ‘a one size fits all’ kind of scenario, neither is microfinance a panacea nor a magic bullet
against poverty. Kiiru (2007) observed that a number of studies have been done on microfinance
but the findings have never been conclusive. Based on the argument above, then there is need to
carry out further studies on the case. Kiiru (2007) calls for caution when performing or
embracing the results of a study. This is because what has worked on one socio-cultural and
economic context may not work in another. It is thus important to examine through this study the
impact of microfinance in Busia County given its socio-cultural, economic and political
environment. Alleviation of poverty means among other factors, the living standards of a
household must change. This can only be so if there is also a change in the household’s
disposable income. The poor will normally be characterized by wanting or poor saving culture,
demeaning lifestyle, lack of wealth (accumulation) and inability to access credit facilities.
Robison (2001) argues that among the economically active poor of the developing world,
there is strong demand for small-scale commercial financial services-for both credit and savings.
Where available, these and other financial services help low income people improve household
and enterprise management, increase productivity, smooth income flows and consumption cost,
enlarge and diversify their micro-business and increase their incomes. Remenyi et al (2000) in
their study also found that the income of households with access to microfinance was always
higher compared to those that did not. Further households that were MFIs members tend to have
a saving culture that can be attributed to the advice obtained. Dupas and Robinson (2009)
conducted a study in the rural parts of Kenya and found that as high as 89% of the ‘treatment
group’ opened bank accounts while a paltry 3% of the ‘control group’ did.

28
2.5 Conceptual Framework
Pricing of microcredit (interest rates) is critical to these young enterprises established.
High repayment levels will definitely choke them in their infancy; a rider to this is if there is no
grace period given before the first installment. There are still some MFIs charging extremely
high interest rates under the pretext of recovering the cost of giving out many small loans to the
poor. Milford (2011) concurs this argument had some validity initially but interest rates have not
fallen as much as predicted, and in some countries … have remained very high. In part, this is
because of the emphasis on the commercial model, with MFIs now required to generate high
financial rewards for their managers (salaries, bonuses) and owners/shareholders (dividends and
capital gains) (Milford, 2011). Roodman (2009) argue in their study that one of the more difficult
things to understand about the microfinance institutions we’ve investigated is the ‘true’ interest
rate they’re charging their borrowers. Some MFIs charge subtle fees that increase the overall
interest charged. While some charge a one-time loan origination fee others require the borrower
to deposit a certain percentage of the loan advanced in the saving account, which pays little
interest than the loan. MFIs do further quote their interest rates on monthly basis and this
translates to a big figure annually. In relation to this are those MFIs that insist on ‘a flat-rate’
rather than on ‘a declining-rate’ of the interest charged on advanced monies. This implies that the
borrowers pay extremely huge amounts in terms of interest rates (Roodman, 2009). The high
rates limits access by the poor to credit facilities and this is what frustrates the government.
According to Mayoux (2002), studies exist showing that ‘high levels’ of debt for
vulnerable households could make them worse off due to their effects on livelihood assets. This
is more so in incase of inability to repay, gender biases in the control of household resources or
in joint liability where other members are called upon to pay for those who fail. The shifting of

29
costs to the poor in the pursuit of sustainable lending institutions that cater for the poor could
instead fuel insecurity amongst the borrowers. Insecurity is an important component of welfare
and can be understood as vulnerability to a decline in well-being (Kiiru, 2007). Low interest
rates were meant to compliment governments efforts for those who cannot get funds from the
YEP, women enterprise fund programs among others. Some commercial banks in this country
began as MFIs as seen noted earlier. However the goal of trying to attain ‘a bank-status’ means
MFIs review their clientele. This has the potential of locking out the majority deemed too poor to
meet the ‘cut-off’ and thus deemed risky. The distribution and outreach of microfinance
institutions determines to what extent the borrowers can access funds. However with many
players in a given market so is competition expected to arise. The question then would be; is this
increased competition healthy? An estimated 8.8 million Euros worth of portfolio was
outstanding as at July, 2009 for MFIs operating in Kolar district India. One reason advanced was
intense competition that lowers borrower selection standards, weakens relationships with
customers, and leads to multiple loan-taking and high defaults (Assefa et al, 2010). Srinivasan
(2009) discovered that up to 25% borrowers have been reported taking loans from six or more
different lenders in Morocco the rate was as high as 40%. McIntosh et al. (2005) in analyzing the
loan market of Uganda under competition came to the same conclusion. This coupled with other
factors, eventually leads to “repayment crisis” in the microfinance industry in late 2008 (Chen et
al., 2010). Assefa et al (2010) conducted a study on competition as regards MFIs over a 15 year
period, covering 73 nations and covering 362 institutions. Assefa et al (2010) result of study
showed intense competition is, overall, negatively associated with performance of MFIs.
However, ways that ensure lending standards, enhance information sharing and promote

30
efficiency may help overcome the adverse effect of competition without risking growth of the
microfinance sector
Related to the above is ‘reach visa vie depth of impact’ argument. The debate has been
raging over the importance of a trade-off between ‘outreach’ (the ability of a microfinance
institution to reach poorer and more remote people) and its ‘suitability’ (its ability to cover its
operating costs—and possibly also its costs of serving new clients—from its operating revenues).
MFIs do seek to balance these goals to a larger extent; there are a wide variety of strategies,
ranging from the minimalist profit-orientation of BancoSol in Bolivia to the highly integrated
not-for-profit orientation of BRAC in Bangladesh (Conning et al, 2003).This is true not only for
individual institutions, but also for governments engaged in developing national microfinance
systems. It can be observed from above how intense competition can negatively affect the
welfare of both MFIs and the households. MFIs should continually differentiate their products to
remain relevant in the face of increased competition. MFIs may meet particular and at the same
time offer products that the consumer would recognize and appreciate. “In this case a wider array
of firms should increase consumer welfare. Product differentiation can limit the loss of, or even
increase, welfare by effectively allowing financial institutions to make their products imperfect
substitutes relative to other existing loansThese results also suggest that many firms offering
different types of loans can coexist for the benefit of consumers” (Chan et al, 2012). Their study
found out that the growth in MFIs (product differentiation) notably had a positive effect on
consumer surplus in the recent years. Differentiation ensures that the consumer not only makes a
decision concerning the institution but also on the various products offered. Traditionally MFIs
offer four types of services namely; insurance, loans, advice and saving. How each presents the
same to the clients matters. The general environment in which MFIs operate in is a crucial aspect

31
to be considered. Moderating factors such as MDGs/Vision 2030, MFI ACT, political and
environment among others are quite important. Regulation of MFIs in the country is under the
MFI-ACT. This alone is not sufficient and close monitoring is necessary. Ownership of MFIs is
a crucial aspect in achieving the overall goal. Institutions funded by donors may only require a
return sufficient to fund their operations. But as seen earlier those, funded by investors might
require higher returns. This is because other than financing their own operations, the investors
will require a return on their investment.
If the poor do access microcredit services at a reasonable cost and guided in their
microenterprises, the rate of default is expected to be low. This gives a win-win situation for both
the institution and the borrower. The lender is assured of continued business survival by the
clients who in turn better their lives by not only being economically but holistically empowered.
The institution(s) can meet their goals among them profitability, stability in their operations and
further penetration of the ‘market’ among others. On MDGs, goal number one is to halve
extreme poverty and hunger by 2015 (UN HABITAT, 2011). Kenya being a member of the
United Nations and faced with almost halve the population below the poverty line, has been
striving to achieve that goal. Unpredictable political or political climate can adversely affect the
operations of financial institutions, MFIs included. Ascanio (2010) argues that microfinance
markets could lose attractiveness in terms of investment opportunities. This could happen in a
period when microfinance has been spotted among sectors attracting investors. A possible side
effect of MFI in financial difficulties could lead to a slow-down of the investments in
microfinance industry. Thus it’s important how a country defines and handles its moderating
environment.

32
2.6 Chapter Summary
The chapter started by evaluating the existing empirical literature review related to the
research question(s). It brought to the fore some theories or school of thoughts that shape the
approach taken by microfinance institutions. This has been done to help the researcher formulate
the assumptions and any hypothesis for the study. The evaluation has enabled the
synchronization of the general area of study. The chapter brought out the various argument
whether against, for or those advocating for caution while assessing the impact of MFIs on
poverty alleviation. As pointed out, there is still debate on the issue and the jury is still out there.
Figure 2: Conceptual framework
Independent variables moderating variables Dependent variable
MFI ACT
ECONOMOMIC/POLITICAL
ENVIROMENT/MDGs
Membership to MFIs Extent of impact on the member (poverty alleviation indicators)
• Number of products offered
• Number of consumers accessing the products
• Cost of products offered by various MFIs
• Operational environment offered by MFIs
� Extent on Saving � Extent on Lifestyle
change � Extent on self-
employment � Extent on control of
resource � Extent on access to
micro-credit facilities

33
This still proves to an important area worth further study. This leads the researcher to be
interested in factually determining the impact of microfinance in Busia County. The study seeks
to determine the nature of relationship between microfinance and poverty in the area under
study. Is the impact positive, negative or none at all? The study intends further, to unearth any
challenges facing microfinance seekers and way forward. The chapter ends up by outlining the
frameworks adopted by the researcher. Specifically, it puts forth the conceptual framework that
guides the study. The framework gave the independent, moderating as well as dependent
variables of the study.

34
CHAPTER THREE
RESEARCH METHODOLOGY
3.1 Introduction
The chapter gives an insight of the approach adopted in evaluating the research questions
pointed in the previous chapters. It points out the target population of the study and the sampling
techniques used in choosing the selected sample. It goes on to outline data collection tools
explaining how the said data was collected and finally presented. It concludes by showing the
analytical tools to be used in analyzing the presented data.
3.2 Research Design
Malhorta (2004) defines descriptive research as a research design in which the major
emphasis is on determining the frequency with which something occurs or the extent to which
two variables co-vary. Cohen (2007) puts it as a framework guiding a researcher in the collection
and analyzing data gathered. The nature of study adopted by the researcher was multiple cross-
sectional. As cherry put it cross-sectional research is a research method often used in
developmental psychology, but also utilized in many other areas including social science and
education. This type of study utilizes different groups of people who differ in the variable of
interest, but share other characteristics such as socioeconomic status, educational background,
and ethnicity. She further states that Cross-sectional studies are observational in nature and are
also known as descriptive research. In this approach researchers record the information that is
present in a population, but they do not manipulate variables.
This type of research can be used to describe characteristics that exist in a population, but
not to determine cause-and-effect relationships between different variables. These methods are

35
often used to make inferences about possible relationships or to gather preliminary data to
support further research and experimentation”. Since the study cannot reach all subjects (poor)
under study; Inferences can thus be made from the findings arising from the sample studied. It
basically intends to find the interaction between MFIs operations and its customers. How is this
interaction in terms of alleviating poverty, improving household livelihood and what are the
parameters.
3.3 Study Population and Sample
The term population is used in statistics to represent all possible measurements or
outcomes that are of interest to us in a particular study. Yale (2006), states that in defining a
population for study, such a population must be specific enough to provide readers a clear
understanding of the applicability of your study to their particular situation and their
understanding of that same population. Robert (2002) argues the word sample refers to a portion
of the population that is representative of the population from which it was selected. It therefore
becomes important to select the proper method of sampling, the process by which representative
individuals are randomly selected to provide insights into the entire population under study. The
study targeted members of deposit taking microfinance institutes in the area under study. By end
of 2012, there were (8) DTMs operational in the Kenya (CBK). The study targeted 40% of the
total DTMs operating in County. The selected institutions was in-turn provides the researcher
with target population from which a sample was drawn. The selected MFIs are; K.W.F.T,
S.M.E.P and FAULU (K), the criteria used are size of operation, membership and operations.
These institutions are expected to provide the researcher with a population of 120 respondents
from which a sample was drawn

36
3.4 Sample Design
The study picked three institutions (40% of 8) that provided the population; this is in
compliance with recommendation by Mugenda (2003) who suggest that a sample of 10% of all
the MFIs is ideal. Convenience sampling was used to arrive at the three major institutions. As
state elsewhere in the study, size and network of the institution in the area under study among
other factors were the guiding principles in MFIs selection. The target MFIs provided an equal
number of respondents (that is 40respondents) to give us a population of 120. Each selected
institution provided two categories of participants still of an equal number; those whose
membership is more than six months but not more than one year and two, those above one but
not more than three years that is, 20 + 20respondents); this is illustrated in the figure below. The
difference in duration is expected to help the researcher capture any expected impact. The
research targeted clients who have been beneficiaries and members for a minimum period of six
months and a maximum of three years; this is because most ventures fail at this time frame.
Management of these MFIs is expected to co-operate in providing the necessary information.
3.4.1 Sample Size Determination and Sample procedures
Simple random sampling was used because the population is Study Population is the
perceived or targeted field of the respondents in any given particular research (mugenda and
mugenda, 2006). Mugenda states that a sample of 10 percent is relatively large and contains a
series of almost same cadre of respondents. Each element in the population has a known and
equal probability of selection. This procedure ensures a high degree of equal chances of
representation of all in the population. A proportion of 0.5 is to be used since all participants
have an equal chance of being selected. The study drew a sample of 60 respondents from the

37
given population of 120. This is because each category based on duration provides 30
respondents proportionally selected from target population as shown in the table below.
Table 3.1 Sample Size Determination
Duration
Number of targeted population
Proportion sample
One year and below 60 0.50 30
Between 1 and 3 years 60 0.5 30
Total 120 60
3.5 Data Collection
The section explains how data will be collected, the procedure and instruments. Further
the reliability and validity of instruments used will be tested in this section.
3.5.1 Data Collection Methods and Procedure
The study used primary data collection method. The data was collected primarily through
structured questionnaire. The questions were both closed and open-ended. This is because
questionnaires are instruments, which provide high accuracy, generalization and explanatory
power with low cost, rapid speed, and a minimum of management demands, with high
administrative convenience. The procedure for collecting data involved the researcher issuing
questionnaires to the respondents. The questionnaires were dropped to the respondents through
‘drop and pick’ method. Those not captured by method may be reached by help of the MFIs
operations department when weekly meetings are held with the said clients.

38
Data collection was done within a maximum period of two weeks. Due to the social and
educational level of the targeted respondents, mailing or e-mailing was avoided. The questions
were put forth to the respondents to choose their level of agreement or disagreement that is
agrees, strongly agrees, disagrees and strongly disagrees. This is in relation to their interaction
with MFIs and its impact in their lives.
3.5.2 Reliability and Validity of the Instruments used in Data collection
The researcher intended to carry out a pilot study to assess the feasibility of the main
study. This was meant for developing specific pre-testing of the questionnaires and interview
adequacy. It checked the effectiveness of the sample frame, sampling techniques and designing
of the study protocol. De Vaus, (1993) argue that one of the advantages of conducting a pilot
study is that it might give advance warning about where the main research project could fail,
where research protocols may not be followed, or whether proposed methods or instruments are
inappropriate or too complicated. A sample of 15 respondents drawn from selected MFIs was
picked randomly during their weekly meetings with the operations departments for this purpose.
Another important goal of the pilot study was to address the validity and reliability of the study.
According to Bernheimer, et al (2008), reliability refers to how well we are measuring whatever
it is that is being measured (regardless of whether or not it is the right quantity to measure). The
study is to ensure consistency or repeatability of the findings was the study to be done again.
Validity was ensured by performing a few test interviews to strengthen the response of what is
being measured. There is one challenge to be put into consideration as pertaining reliability and
this is moral hazard. It may be difficult from the responses to ascertain whether the micro-credit
loans are entirely used for income generation activities or for consumption smoothening. Further,
those involved in business and not following the laid down (legal) procedures may feel

39
uncomfortable with some of the questions. This was minimized by stressing on the
confidentiality of the responses obtained.
SPSS a statistical program was used as the tool of analysis to test the relationship
between the dependent variable and the five independent variables. Cronbach’s alpha of well
above 0.7 implies that the instrument was sufficiently reliable for the measurement. The
researcher found the value to be 0.75 for this study. However it should be noted that there is no
rule to suggest that a Cronbach’s alpha greater than 0.70 indicates a good instrument (Comer &
Kelly 1982). Although, it is commonly agreed among researchers that an alpha greater or equal
to 0.7 shows that an instrument is reliable in measuring what it was intended to measure.
3.6 Data Analysis and Presentation Methods
Raw data collected was sorted and presented using tables and diagrams. All collected
questionnaires were checked for completeness, accuracy and consistency to determine those
meeting the required criteria. Kaewsonth and Harding, (1992) suggest that then the coded data
should be checked for any errors and omissions. The researcher used the Statistical Package for
Social Sciences (SPSS) to analyze the collected data. A comparative analysis was used for
responses from open-ended questions. This entailed graphical analysis, percentiles and
distribution tables where necessary. For close-ended questions, responses were coded. As for
likert scale responses; mean and standard deviation was used. Though the researcher intends to
analyze the data using SPSS software, a regression analysis was used to examine the relation of
the variables under study. The researcher intends to interrogate the relationship between MFIs
activities and poverty. The regression analysis took the form below;
The general regression form was;

40
Y = α + β1X1 + β2X2 + β3X3 + β4X4 + ε
Where; X1 X2, X3, X4 …. Xn are independent variables explained below.
While the specific regression form;
Y=α + β1X1 +β2X2 +β3X3+ β4X4 + ε
Where;
Y- (Dependent variable); Poverty alleviation (household economic empowerment).
α- (Constant variable); Economic status of the respondents without access to MFIs services.
β1, β2, β3, β4, β5 - Determinants of poverty reduction with respect to X1, X2, X3,X4 and X5 in
the Regression Analysis.
Y- Is the dependent variable (Poverty Alleviation)
Independent variables are;
X1- is Number of Products of available,
X2- is Number of consumers accessing the products,
X3- Cost of DTMs products
X4- Nature of business environment offered to members by DTMs
ε- Error term (those factors not captured by independent variables).
3.7 Ethical Issues

41
The research strictly observed ethical issues governing such studies. This is entirely a
voluntary exercise where safety, confidentiality and responses of the participants is guaranteed,
only those directly involved in the study can have access to the information. Full disclosure of
the purpose of the study was done to all the respondents and consent obtained from those willing
to take part. Though it is not anticipated, the researcher sought consent where this is governed by
the law. According to 21 CFR 50.20, no investigator may involve a human being as a subject in
research covered by these regulations unless the investigator has obtained the legally effective
informed consent of the subject or the subject's legally authorized representative. The researcher
observed justice in the equitable selection of participants i.e. avoid anyone under coercion
(Callahan, 1998).Finally, honesty was guiding principle and any outcome arrived at a reflection
of the data obtained in the field.
3.8 Chapter Summary
The chapter started by explaining that the research design adopted is descriptive in nature. It
explained how MFIs and respondents chosen for the study were selected in the area under
research. It has highlighted the data collection tools and how obtained information is to be
analyzed and presented. It ended by presenting the model to be used in the study.

42
CHAPTER FOUR
FINDINGS AND DISCUSSIONS
4.1 Introduction This chapter presents analysis and findings of the study as set out in the research
methodology. The researcher used the econometric regression tool for descriptive statistics
to test the hypothesis, in order to establish the correlation between the different variables of
the Respondents and the Microfinance institutions. The researcher targeted a population of
60 respondents from three Deposit taking Microfinance Institutions of different nature in
the Busia town, each contributing 20 active members.
4.2 Distribution and Response Rate to the Questionnaires
The response rate of the respondents is as given in table 4.1 below: As indicated in
the table, 80 questionnaires the researcher distributed to the four Microfinance Institutions
with a projected response of 60 respondents, 62 respondents returned the questionnaires,
which translates to 77.50% response rate, while the non respondents were 18 that translates
to 22.50%. The overall response represents a good response rate. However two of the
received questionnaires were incomplete thus maintaining the expected figure of 60. Kenya
Women Finance Trust Bank had the highest response rate largely because women were
more responsive to the study. The figure below illustrates this.

43
4.3 Biographic Data of the Respondents
The below indicated are frequencies indicating the biographic data of respondents
who took part in the study on impact of DTMs on poverty alleviation in Busia.
TABLE 4.1 Distributions and Response to the Questionnaires
MICROFINANCE NAME
Distribution
Response
Percentage of response
FAULU 30 21 70.00
SMEP 20 15 75.00
KWFT 30 26 86.67
T0TAL 80 62
FIGURE 3: Distributions and Response to the Questionnaires
0
10
20
30
40
50
60
70
80
90
Faulu (K) SMEP K.W.F.T Total
Responded
No-Response
Response %
No-Response %
4.3.1 Age in years of the respondents
The respondents' age distribution is indicated in the table below. As indicated in table 4.2,
out of the 60 respondents, the majority had an age bracket of between 36 and 50 adding to
28 or 46.70 percent, entrepreneurs between age 0 and 18 added to 24 respondents which

44
takes 23.33 percent of the total respondents. Age bracket of 19-35 years had 16 respondents
and added to 16.66 percent. Those above 50 had the least number of respondents 2,
representing 3.40 percent. The bracket between 0-18 years had the second highest
percentage of respondents.
Table 4.2 Ages in Years of Respondents
Age Bracket Frequency Percent
0-18 14 23.33
19-25 8 13.33
26-35 8 13.33
36-50 28 46.70
50 and above
2 3.40
Total 60 100
Most of the members here are those who never went beyond as well as those
through with high school, they are basically risk takers. This group is interested in raising
money for vocational or tertiary training, only a few want to pursue this full time. This
explains why there is a decrease in the percentage of respondents between age brackets of
19-35 years. This category comprised of semi and skilled people still looking for
employment but try their luck in business if they fail to find jobs. This partly explains the
sudden increase in the percentage from the bracket between 36-50 years. This implies that
most of the entrepreneurs get serious with their entrepreneurial stints due to the vast
number of challenges that emerge at age of 36-50. From this information it can be depicted
that this is the time when couples begin to quarrel in the house over their roles in the house
and furthermore life becomes that difficult to individuals that they have to become

45
empowered. Those at 50 years and above are risk averse, thus not willing to gamble with
the little they own or withstand pressures associated with doing business. Closely related to
this is the fact that, at that age a majority of their children are working. Most of them may
be living off on the assistance of their children as this is a normal cultural practice not only
in the area of study but in most areas of the country. The age of the respondents is an
important pointer to the motive of an individual member joining microfinance. There could
be MFIs that would find it risky dealing with certain age brackets such as those below 18
years and yet be recognized by the state as adults despite their business acumen. Those
over the ages of 60 years that may equal find it challenging to deal access some of MFIs
services such as loans just because they are viewed as a risky lot.
FIGURE 4: Ages in Years of the Respondents
0
10
20
30
40
50
0-18 0-18 19-25 26-35 36-50 50 and
above
pe
rce
nta
ge
fre
qu
en
cy
percentage
frequency

46
4.3.2 Level of Education attained
The respondents were asked to indicate their highest level of education. The results
are given in table 4.3. As shown in the table above, no formal education had the least
number of respondents at 5, representing 8.33% of the total. Primary level was second at 6
respondents, equivalent to 10%. Secondary education had 11 respondents translating to
18.33%, while tertiary and middle level colleges had 20 and 10 respondents' equivalent to
33.33% and 16.66% respectively. The highest level was university education that had 8
respondents or 13.33% of the total respondents. This shows that all the respondents to the
study had attained a level of education to enable them give responses that could be relied
upon. This means that most of the entrepreneurs are educated to make rational decisions
pertaining to their businesses. They are not relying on their academic background to get
economically empowered, say through being employed; rather they seem to achieve
economic empowerment through other mechanisms such as resorting to MFIs and starting
income generating ventures. This means academics to them is just basic but not that
critical. However it is important to note that the level of education is important as it
indicates the intellectual capacity of a person to make some difficult decisions when need
arises and how to deal with MFIs to get the best of the deals.
4.3.3 Marital Status of the Respondents
The respondents were asked to indicate their marital status. The results are given in
table 4.4 below. Out of the 60 respondents 15 of them were single which amounted to 25
percent and 33 of them were married amounting to 55 percent as shown above. 10
respondents were widowed representing 16.67 percent of the total respondents. Two out of
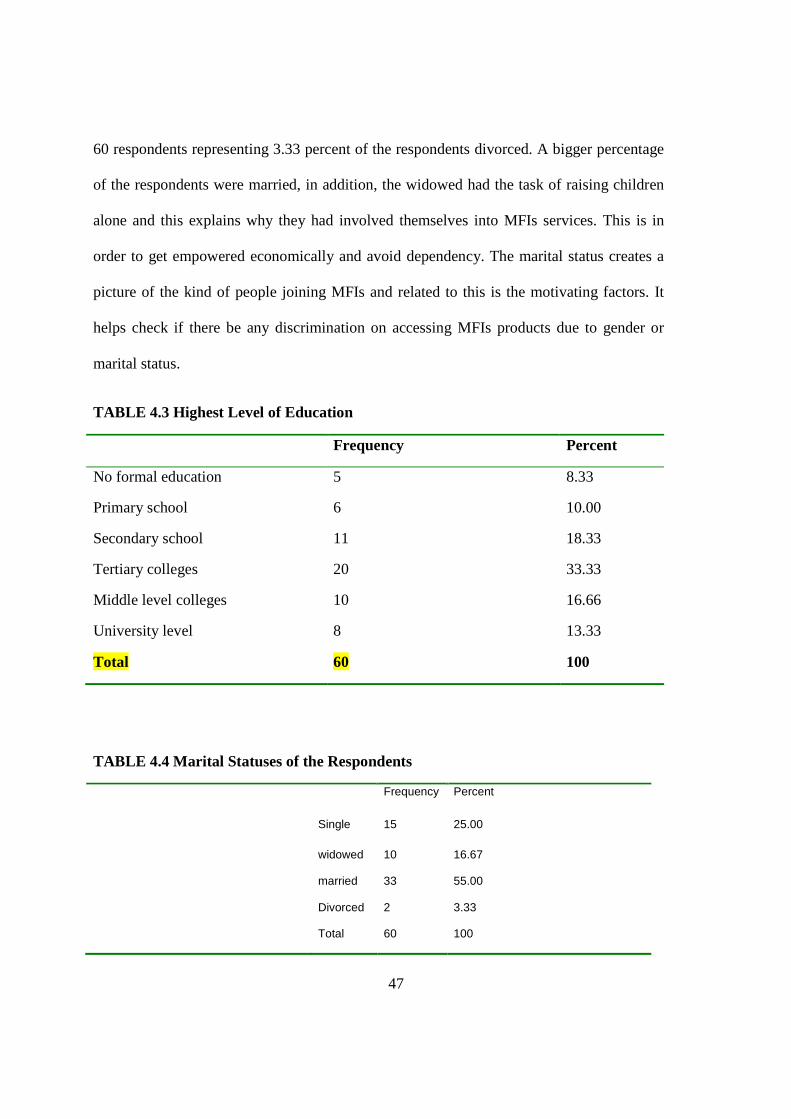
47
60 respondents representing 3.33 percent of the respondents divorced. A bigger percentage
of the respondents were married, in addition, the widowed had the task of raising children
alone and this explains why they had involved themselves into MFIs services. This is in
order to get empowered economically and avoid dependency. The marital status creates a
picture of the kind of people joining MFIs and related to this is the motivating factors. It
helps check if there be any discrimination on accessing MFIs products due to gender or
marital status.
TABLE 4.3 Highest Level of Education
Frequency Percent
No formal education 5 8.33
Primary school 6 10.00
Secondary school 11 18.33
Tertiary colleges 20 33.33
Middle level colleges 10 16.66
University level 8 13.33
Total 60 100
TABLE 4.4 Marital Statuses of the Respondents
Frequency Percent
Single 15 25.00
widowed
married
10
33
16.67
55.00
Divorced
Total
2
60
3.33
100

48
4.3.4 Respondents Married and Staying with their Spouse
The married respondents were to indicate whether they are staying with their spouses or
not.
FIGURE 5: Marital Status of the Respondent
0
20
40
60
80
100
Single Widowed Married Divorced Totals
Frequecy
Percentage
As shown in table 4.5 below, 26 of the respondents stay with their spouses, this translates to
78.82 percent of the total. Only 7 stay apart and the reason is because the other partner, mostly
the man is involved in economic activities in other parts of the country. This statistics helped the
researcher to be sure that the study had a good number of married entrepreneurs, staying with or
without their spouses but facing economic challenges after which some could join MFIs. They
become members with the intention of venturing into micro-enterprises to either get a source of
income or supplement the efforts of the other partner.

49
The study sought to know from the respondent if whether married or not have children
who depend on them. This was important to the study as it helped the researcher get members
who take their micro-business ventures seriously because other than extended family members,
they have children who look upon them for their basic needs.
TABLE 4.5 Respondents Married and Staying with Their Spouse
Frequency Percent
Not Staying with spouse
Staying with spouse
Total married
7
26
33
21.12
78.82
100
4.3.5 Respondents with Children Whether Married or Not
As shown in the table below, majority of the respondents, at 43 or 72 percent of the
total respondents had children. Only 17 of those sampled or 28 percent had no dependents
in form of children. Respondents with dependents help create a picture of how
microfinance is helping them achieve financial independency, the change in their social
welfare
TABLE 4.6 Respondents with Children Whether Married or Not
Frequency Percent
Not Staying with spouse
Staying with spouse
Total married
17
43
60
28
72
100

50
4.4 Motives to join Microfinance
The respondents were asked to indicate why they joined their respective Deposit taking
MFIs. They had the option of choosing more than one motive if they felt so. The results are
shown in table 4.7 below. All the respondents, 60, stated that their main motive of joining DTMs'
is to eventually get access to loan facilities. This is equivalent to 100 percent of those sampled,
the purpose of the loan notwithstanding. Those seeking control of resource, whether of fixed
assets or financial came second at 55 of those sampled translating to 91.67 percent. Self
employment had 50 respondents or 83.33 percent of those sampled.
TABLE 4.7 Motives of Respondents for Joining DTMs'
Frequency Total Percentage
Self employment 50 60 83.33
Control of resources 55 60 91.67
Access to borrowings 60 60 100
Increase savings 35 60 58.33
The difference between this group and that of accessing borrowings is that there are some
respondents who were employed elsewhere thus having a source of income. The least group of
those sampled, at 35 or 58.33 percent agree that the goal of joining DTMs' was saving. They
simply do so as a requirement of the institution as well as the fact that the micro-credit facility
advanced is dictated one's level of saving. The motives will determine how the members take

51
products on offer by the various MFIs in the county. This will influence how DTMs scale their
operations in the county as a whole, that is the penetration level and how to cost the products.
This is graphically illustrated as below.
FIGURE 6: Motives to Join Deposit Taking Microfinance Institutions
0
20
40
60
80
100
Self
employment
Control
resources
Acess loans Saving Totals
Frequecy
Percentage
4.5 Self Employment
On enterprise ownership, the respondents responded as shown below in table 4.8
4.5.1 Response on Enterprise Ownership
From table 8 below, out of the 60 respondents, 22 of them or 36.67 percent owned
enterprises of different natures before joining their respective Microfinance Institutions.
However a majority or 28 of them amounting to 63.33% of the total respondents started owning
their enterprises after joining their respective Microfinance institutions. This can be linked to
access to loans as a result of being a DTM member. This further shows that those whose aim was
self employment had a chance to venture into micro-businesses. Deposit Taking Microfinance
institutions were giving them not only an opportunity to get funds and advice but also instilling
in them self financial discipline and prudence, by insisting that they continuously save. This is

52
evident from the big difference between those who had enterprises before and after joining their
respective microfinance institutions.
TABLE4.8 Response on Enterprise Ownership
Frequency Percent
Those with enterprise before joining MFIs 22 36.67
Acquired enterprise after joining MFIs 38 63.33
Total 60 100
Micro-business ownership will help show how members are interacting with the MFIs in general.
Are the institutions offering them the best environment to carry out transactions whether their
micro-business are booming or undergoing difficulties? This is because the relationship between
individual member/s and MFIs has an impact on the social aspect as well.
4.5.2 Response on Employment as Co-source of Income
From table 4.9 below, it can be seen that 10 percent of the respondents relied on
employment as their main source of income. This group comprised mainly of Government
employees, in the private sector and Non-governmental organizations that want an extra source
of income. Respondents whom employment is a secondary source of employment stood at 30
percent. Many in this group are unskilled or semi-skilled and as such worked as casuals on 'on-
off' basis. Most of the respondents at 53.33 percent do not rely on employment as a source of
employment. This group comprised of respondents who are in business fully time and or doing
farming as well.

53
TABLE4 Employment as co-Source of Income Frequency Percentage
Employment as main source of income 10 10.00
Employment as secondary source of income
(members both in employment and business)
18 30.00
Employment not a source of income 32 53.33
Total 60 100
4.6 Number of Products offered by DTMs in Busia County.
The respondents were asked to express their opinion on the listed services offered
by their preferred Deposit Taking Microfinance institution. The response is as shown in
table 4.10 below. On insurance services, disagreed and strongly disagreed were 32 and 28
respectively. This indicates that either they are unaware of the availability of the service or
the institutions see no point of passing extra costs onto them. On financial advice being
helpful to members start and manage business, 51 of the respondents were in agreement;
only 9 disagreed with 4 strongly disagreeing. Overall, it can be noted that advice is an
appreciated service being offered by these institutions.
On saving services offered by the institutions, a total of 50 of the respondents
concurred that they have a chance to save. This is because the amount of money one can
get as a loan is pegged on the savings and saving culture. About Micro-credits assistance to
the respondents, 12 respondents plainly agreed while there was a bigger portion of
respondents of 39 who strongly agreed that micro-credits services of the MFIs have really
assisted them access loan facilities that they couldn’t have been given had it been to borrow
from Commercial Banks. Only 9 respondents plainly disagreed while none strongly
disagreed to the micro-credits services on assisting them in their entrepreneurship

54
activities. It therefore shows that this is a service well appreciated by members of
microfinance institutions.
TABLE 4.10 Distribution and Response on Microfinance Products available to Members
1=S.A= Strongly Agree, 2=A= Agree, 3=Not sure, D=Disagree, 4=S.D=Strongly Disagree
VARIABLE: TYPES OF PRODUCTS OFFERED
Agree
(1)
Strongly
Agree (2)
Disagree
(3)
Strongly Disagree
(4)
Total
Insurance Services are offered by this DTM and have used the product
0 0 32 28 60
Financial Advisory services are offered on regular basis
19 28 9 4 60
Saving Saves offered other than deposits made in respect of any existing loan facility taken.
31 29 5 5 60
Micro -credit facilities are available to all those who are members
25 22 9 4 60
4.6.1 Response on Products Rating in the County
The respondents were asked to express their opinion on the nature of the products offered
by their respective Deposit Taking Microfinance institutions. The researcher aimed at
establishing if this was a factor to consider in the choice of the institution to join. On this point,
23of the respondents translating to about 38.33 percent agree that generally the products are
similar. To them it played no major role as they were indifferent on the various institutions in the
County. However, 27 of the respondents or 45 percent of the total believed that the products are
different; they argued that even where they generally appear similar, product differentiation is
vital. The group is price sensitive and no matter how small the variation in product cost, it has to
be considered. The final group comprised of those who are unsure of any differences between
their microfinance institution and the rest in the county. The group simply joined the without

55
comparing the various players in the market. Need to join a group means that some members
have little or option on the choice of their preferred institution.
FIGURE 7: Responses on Availability of DTMs' Products in the County
0
5
10
15
20
25
30
35
40
A S.A D S.D
Insurance
Fin. Advice
Saving
Micro-credit
This is because they tend to join existing group that comprise of people they know or
known to each other. It was noted that those who joined the DTMs as individuals try to take
advantage of the product differentiation; however those joining under joint liability have little
say in the choice.
4.7 Access to Products offered by DTMs' and its Impact on Venture Decisions/Resource
Acquisitions
When the respondents were asked to rate access to products/services offered by their
DTMs and if this had an impact on business decisions as well as resource acquisition, the
response was as shown below in table and figure. On access to insurance services and its impact,

56
the respondents were split down the middle either plainly or strongly disagreeing that it played
any role. They seem unaware of this product probably due to the fact that they are never
informed. Those aware are unwilling to bear the extra cost unless passed to them when taking a
substantial amount in form of a loan, in which case is mandatory. The argument from the
members' is to try and avoid any extra costs insisting their micro-businesses are so small to
warrant an insurance cover.
TABLE 4.11 Responses on Product Rating
Frequency Percentage
Similar 23 38.33
Different
(Product Differentiation)
27 45.00
Not Sure 10 16.67
Total 60 100
On financial advisory services, majority of the respondents were in agreement that it is
available regularly. Of those sampled, plainly and strongly agreeing was 30 and 25 of the total
respondents, a small number of 5 disagreed. Those appreciating availability and impact of advice
state that the service is always available during their weekly group meeting with the DTMs'
officials. Further, each group has its own assigned field officer who knows each member
individually and their venture. The officer is always reachable at the office or on phone if need
be.

57
TABLE 4.12 Responses by Members on Access to DTMs' Products and their Impact on Ventures/Resource Acquisition
1=Agree, 2=Strongly Agree, 3= Not Sure, 4=Disagree, 5=Strongly Disagree
VARIABLE: CONSUMER ACCESS TO PRODUCTS
Agree
(1)
Strongly
Agree (2)
Disagree
(3)
Strongly Disagree
(4)
Total
The Insurance services are offered by this DTM allowing me peace of mind to concentrate on my business
0 0 30 30 60
Advisory services are available on need, the advice received from this institution have assisted me informed decision in my business
30 25 5 60
Savings- is it easy to save and access your money in this DTM if need be.
32 13 10 5 60
Micro -credit facilities are easily accessed and always of the requested amounts to facilitate business operations.
25
22
9
4
60
On saving, plainly and strongly agreeing to accessibility and impact of the service stood
at 32 and 13 of the respondents. The plain and strongly disagreeing with this point was 10 and 5
of the respondents respectively. Those in support do agree that their weekly meetings with field
officers where each members has a minimum amount to contribute and deposit, either in the
group or individual account, has forced them to learn saving. The saved monies have always
come in handy stocking or meeting some business obligations not an emergency. Members
reported also the ability to acquire resources gradually over a period due to the accumulated
savings. The members disagreeing are those who find the periodic saving culture cumbersome.
Then there are those whose savings are frozen till their outstanding loans or those the guaranteed
are fully paid. About access to micro-loan products, those plainly and strongly agreeing were 25

58
and 22 respectively of the respondents. Those disagreeing or strongly disagreeing was 9 and four
respectively. A total of 47 of the respondents agreed that DTMs' have given them an opportunity
to run a 'bank' and access loans, a challenge they faced with commercial banks. To them, being a
member of these institutions has made access funds relatively easy and affordable. They all agree
that this is a facility available to all active members of microfinance institutions. Those who
disagree, cite the requirements such as joining a group, continuous saving or those to whom
borrowing has been suspended for a while for one reason or the other. However both groups
agree that they are better off with DTMs than facing unwilling commercial banks or dreaded
shylocks. It can be presented graphically as shown in figure 4.7.
4.7.1 Response on the Number/Distribution of DTMs' in the Whole County
The respondents were asked to express their opinion on the penetration level of
microfinance services in the county as whole; this is illustrated in table 4.13 below. Only 8
respondents or 13.33 percent of the respondents felt that the penetration level of DTMs in the
county is very satisfactory. This is a group that comprises of members who stay within the town
center and can thus access the services whenever need arose. Just and somehow satisfactory, had
23 and 16 respondents that translate to 38.33 percent and 26.67 percent respectively. These
respondents felt that yes, the services are available but not to the level expected. These comprise
of members living some distance from the town but can access the services with minimal effort.
Further, these members have the option of both waiting for weekly group meetings with the
DTM's field officer or visit the office when need arises. Of concern to the group is accessing
money through automated teller machine. Members in an institution like K.W.F.T feel the
inconvenience of accessing the facility.

59
FIGURE 8: Level of Access to Products offered by DTMs and their Impact on Micro-Enterprises and Resource Acquisitions by Members
0
5
10
15
20
25
30
35
Agree Strongly
Agree
Disagree Strongly
Disagree
Insurance
Advice
Saving
Micro-loans
Had the A.T.Ms been distributed in the county other than the only one being in the town, then it
would have been better. This is a concern shared equally by those in the not satisfactory
category. The group had 13 respondents or 21.67 percent of the total. This group had members
who stay and do their businesses away from town and it takes effort and resources to visit the
institution's office in town. The easier option is to wait for weekly meetings with a representative
from the institution. These members are in remote parts of the county and depositing their sales
is a challenge. They argue that the long distance and cost to town is an impediment.
TABLE 4.13 Responses on Number/Distribution of DTMs in the County
Frequency Percentage
Very satisfactory 8 13.33
Just satisfactory 23 38.33
Somehow Satisfactory 16 26.67
Not Satisfactory 13 21.67

60
In addition, most of the microfinance institutions have mobile money transfer platform
but it is at member's expense. This then means either keeping the money till a need arises to visit
the town, wait for the field officer to collect or carry out mobile money transfer at given
intervals. The problem here is that a member ends up mixing family and business finances or
using the money for unintended purpose. However it can be deduced that though with varying
degrees of satisfaction a vast majority or 73.33 percent of the total respondents feel that the
penetration level is acceptable. This is because are going the extra mile to serve the members
something commercial banks are yet to embrace.
4.8 Cost of Products/Services Offered By DTMs' in the County
The respondents were asked to state their level of satisfaction with the cost of products
(micro-loans) offered by microfinance institutions. The response is tabulated in table 14 below.
None of the respondents felt very satisfied with the cost of loans. However, just and somehow
satisfactory had 20 and 17 respondents' equivalent to 33.33 and 28.33 percent respectively.
Those not satisfied were 23 of the total respondents or 38.33 percent. A total of 37 respondents
or 61.67 percent felt the interest rates levied by the Deposit Taking Microfinance institutions are
satisfactory at varying degrees. This means that these institutions offer acceptable rates to them
as compared to commercial banks or any other lender(s) in the county. The degree in levels of
satisfaction is due to the fact that, still there is a feeling the rates are a bit high but then the best
among the alternatives available. The remaining 38.33 percent feel the rates offered by the
institutions not only in the county but country as a whole are on the higher side. However they
have no other option of accessing micro-loans since they are below the threshold set by
commercial banks.

61
TABLE 4.14 Response on Cost of Products (Micro-loans) offered
Frequency Percentage
Very satisfactory 0 0.00
Just satisfactory 20 33.33
Somehow Satisfactory 17 28.33
Not Satisfactory 23 38.33
4.8.1 Frequency of Borrowing by Members
As pertains to how frequently members apply for micro-loans from their institutions, the
responses are illustrated in the graph below. A total of 27 respondents or 45 percent do borrow at
an interval ranging from 2-6 months. A further 28 or 46.7 0f the respondents do so between 7-12
months. Those borrowing between 12-18 months and above 18 months are 4 and 1respondent(s)
or 4 and 1 percent respectively.
Thus it can be deduced that a majority of the respondents, 91.7 percent apply for loans
within an average duration of one year. This may be attributed to taking small amounts of loans
that are payable within one calendar year. This group is largely made up of those whose
membership to the institutions is under joint liability. Only 8.3 percent borrow from one year and
above and this comprises of those who are members to microfinance institutions as individuals.
In addition, this small group of respondents comprises those with 'big' micro-businesses
compared to those under joint liability. The amount of loans sought is substantial to be repaid
over a period of more than one year.
4.8.2 Response to Purpose of Borrowing by Members
Respondents' response as pertains to the above point is shown in the table below. Twelve
respondents or 20 percent of the total, borrow purposely to start a business venture. A majority

62
totaling to 27 respondents or 45 percent get funds to expand their business operations. On
resource acquisition, 13 respondents or 21.67 percent concurred as to this being the motive for
borrowing.
FIGURE 9: Responses to Frequency of Borrowing by Members
0
10
20
30
40
50
2-6 months 7-12 months 12-18 months After 2 years
Frequency
Percentage
Only a small number of respondents, 8, or 13.33 percent to borrow for household
purposes .This include school fees, emergencies such as hospital fees among other. It can be
noted that 29 respondents or 65 percent of the total, borrow for business purposes.
TABLE 4.15 Purpose of Borrowing by Members
Frequency Percentage
Start a business 12 20.00
Expansion of business 27 45.00
Acquire resources 13 21.67
Household purposes 8 13.33
TOTAL 60 100

63
This is a pointer that microfinance institutions are giving members an opportunity to get
the much needed funds to start income generating ventures. This is aimed at attaining financial
independency for the respondents. The 21.67 percent that borrow, mainly do so to acquire
resources and this can be turned into liquid cash if need arose on disposal.
4.8.3 Access to Loan Facilities before joining the Deposit Taking Microfinance Institution
Most of the respondents were unable or found it extremely difficult to access loan
facilities to start or expand income generating projects. As shown below, only 11 or 18.33
percent of respondents could access loan facilities. This comprised of those employed but
running business on the side or those who already running businesses. It is easy for this group as
they have a way of meeting the loan repayment installments. A majority, 49 or 81.67 percent of
the respondents had an avenue of getting loans after joining the DTMs. This is a group that
joined under joint liability model and through continuous saving has been able to access loans to
either start or expand their ventures. It is clearly from the table below that these microfinance
institutions are positively impacting their members. Most people been staying without loans
rather than applying for commercial banks until recently when MFIs came into existence.
TABLE 4.16 Accessing to Loans before Joining their Respective MFIs
Frequency Percentage
YES 11 18.33
NO 49 81.67
TOTAL 60 100

64
This implies that many respondents feared applying for loans in commercial banks because of
fluctuating interest rates unlike MFIs which have fixed interest rates.
4.9 Response to Nature of Business Environment provided by DTMs for Members
The expressed their opinion on a number of factors below and their responses are
indicated as follows;
4.9.1 Response to Control of Resources before and after joining the Deposit Taking
Microfinance Institution
The response to the above point is shown in table 4.17 below. On before, joining 12 or 20
percent of the respondents could acquire resources through other sources of income. The group
comprised those employed or running businesses prior to joining the microfinance institutions.
However, on after joining, the number goes up to 40 or 66.67 percent of the respondents. This
can be attributed to majority who said 'No' to resource control but 'Yes' as well as the indifferent
after becoming members. Majority at 38 or 63.33 percent had no control of resources before
joining microfinance; however the number goes down by over half to 15 or 25 percent after
joining. The decline is as a result of those saying 'yes' after joining.
TABLE 4.17 Control of Resources before and after joining the Deposit Taking Microfinance Institution
Before After
YES 12 -20% 40-66.67%
NO 38-63.33% 15-25.00%
Remained same 10-16.67 5-8.33%

65
Those still saying 'NO' even after joining are either yet to fully acquire resources through cyclical
borrowing and payment. Alternatively some may have defaulted on loan repayment and as such
their savings frozen or assets attached. There were 10 or 16.67 percent respondents indifferent
about resource control before becoming member. The figure drops to 5 or 8.33 percent of the
respondents on once becoming a member. This group comprised of those who have been
members for less than year and are growing their business.
4.9.2 Response to Financial Worth before and after joining this Microfinance Institution
The respondents were asked to express their financial health both before and after joining
microfinance. The results are tabulated in table 4.18 below. They were to express if there is any
change whether positive, negative or none at all. The responses to 'Before joining' are as follow;
only 10 respondents or 16.67 percent agree that that they were okay financially. This then means
their joining the institutions was to further improve financial independence. Most respondents,
42 or 70 percent of those sampled concurred that indeed they were fairing on badly before. This
was the main reason as to why they became members with the ultimate goal of starting a venture,
whether farming or running a business. Those unsure of the financial status before were 8 or
13.33% the respondents. The response to 'After joining' is as follows; 35 or 58.33% percent of
the respondents observed a positive change in their finances. Arguably, about 25 respondents
whose affairs were initially worse joined this group as their situations improved over time since
becoming members. However the indifferent lot also increased to 9 or 15 percent of the
respondents. The members indifferent are basically, those still new in their membership. They
are still building on their savings before applying for some substantial amount for investment
purposes. It is important to note that over half or 58.33% agree that in one way or the other their
financial status has been positively impacted since joining respective Deposit Taking

66
Microfinance institutions. The improvement in financial status owing to microfinance is an
indication of the impact of microfinance. The availability of products such as loans and access to
the same has significance on reducing poverty.
TABLE 4.18 Response to Financial worth before and after joining Microfinance
Before joining After joining
Positive 10 -16.67% 35-58.33%
Negative 42-70.00% 16-26.67%
Remained same 8-13.33% 9-15.00%
4.9.3 Member's Access to Primary and Secondary Needs since joining Microfinance
The respondents were given a list of statements as pertains to the home affairs welfare
with various levels of agreement or disagreement. The responses are shown in table 4.19 below.
Most of the respondents, 35, do agree that financial discipline in terms of saving has ensured that
they adequately cater for family basic need than they did before. Only 10 disagreed whereas 5
are not sure, either because their ventures are yet to stabilize or they lack financial prudency. In
terms of borrowing for home improvement, or provide shelter, over half of those sampled, 38,
agree that at one point or the other, monies borrowed were not entirely channeled to business.
Part of the money was used to improve the home environment. On this issue, 12 plainly disagree
or are unsure of, probably because a need of this nature is yet to arise. Saving while at the same
time repaying a loan has been has been accepted by 27 respondents as being a challenge.
Interestingly, an equal number or respondents disagree that it is straining their family

67
obligations. They argue that the flexibility in repayment whether weekly, fortnight or monthly
allows them to plan on the finances. Six respondents are not sure where they stand on the issue.
On the quarrels at home since joining microfinance, 44 respondents disagree. Indeed they
argue that peace has in a way been restored since their partners appreciate the efforts to provide
for the family. Openness and communication about finances and business health is appreciated
by spouses'. However, 8 respondents disagree while another 8 are unsure. Those disagreeing
could be as a result of failing to meet their family financial obligations or squandering the money
alone for example through drinking. Improved accessibility to both primary and secondary
needs for both the member and dependents after joining microfinance may be taken as a measure
of poverty alleviation. This is because where such a member stands to be affected economically
were MFIs to pull out, and then the business environment offered by the institutions is important.
TABLE 4.19 Responses on Member's to Basic and Secondary Needs
1=Strongly Agree, 2=Disagree, 3=Not Sure, 4=Agree, 5=Strongly Agree
VARIABLE: ECONOMIC CHANGES
1= Agree 2=Strongly Agree
3= Disagree
4=Strongly Disagree
5=Not sure
TOTAL
Increased savings have enabled me cater for my family
32 13 7 3 5 60
Increased borrowings have enabled me shelter my family
27 11 12 0 10 60
Both saving and or interest on the borrowed loan is straining provision of family needs
18 9 22 5 6 60
Since joining this MFI there have been quarrels on finances with my spouse
8 0 36 8 8 60

68
4.10 Impact of Micro-finance Institutions on Poverty Alleviation
In this section, the researcher will state the linear regression model, look at the usefulness
of the model, test and interpreted the coefficient appropriately.
The table below shows the output information about the quantity of variance that is
explained by the predictor variables. The first statistic, R, is the multiple correlation
coefficients between all the predictor variables and the dependent variable. It measures the
correlation between dependent and independent variables. In this model, the value is 0.801,
which indicates that there is a positive co-variance shared by the independent variables and
the dependent variable. The next, R squared, is simply the squared value of R. This is the
amount of variance explained by the given set of predictor variables as shown below the
table. In the model, the value is 0.642, which indicates 64.2% of the variance in the
dependent variable is explained by the independent variables in the model.
The model is as follows;
Y = β0+ β1X1 + β2X2 + β3X3 + β4X4 + έ
Dependent variable Independent variables
Y- Poverty Alleviation
β0 -Constant -level of economic empowerment of members without microfinance membership
β1, β2, β3, β4, = the coefficients/ determinants of Impact on poverty by Deposit taking MFIs ( for
the various four independent variable)
X1 = Number of products/services offered by Deposit Taking MFIs in the county
X2 = Number of member accessing the products (level of penetration)

69
X3 = Cost of the products
X4 = Business environment provided by MFIs
έ = Error term= effects due to other microfinance services not captured by the variables
All these variables were measured by various parameters in the questionnaire as indicated in the
conceptual framework in chapter two.
TABLE 4.20 Model Summary
Model R R Square
Adjusted R Square
Std. Error of the Estimate
Change Statistics
R Square Change
F Change
df1 df2 Sig. F Change
1 .801(a) .642 .623 .630 .642 21.25 4 55 .000
64.20% of the changes in the dependent variable (poverty Alleviation) can be explained by
changes in the independent variables. The value may be due to one factor found to statistically
insignificant but discussed below. The remaining 35.80% can be explained by factors not
captured by the model. The researcher was however convinced that this was a good model.
(a) Predictors: (Constant), Number of products available, Number of people accessing the
products, Cost of products and Nature of economic environment provided by MFIs
(b) Dependent Variable: Poverty Alleviation
TABLE4.21 ANOVA (Analysis of Variance)
Model Sum of Squares Df Mean Square F Sig.
1 Regression 24.7 4 5.925 21.25 .001(a)
Residual 7.8 55 0.195
Total 35.573 59

70
The researcher used Anova test to show whether all the Xi (Independent variables) taken
significantly explain the variability observed in the Y (Dependent Variable).
In the table 4.21 above, the F statistic is equal to 21.25. The distribution is F (4, 55), that
is 4 numerator degrees of freedom and 55 denominator degrees of freedom implying that 6.12 is
the upper limit of the acceptance region for a significance level of α = 0.05. Our F value is 21.25
which is greater than F critical of 6.12, it can then be concluded that the regression as a whole is
highly significant. There is strong evidence that βi is not equal to zero. Therefore the researcher
concluded from the data above that there is a linear relationship between the entire X i variables
considered together and Y variable. And so the regression as a whole is highly significant. The
same conclusion was reached by noting that the output shows “p” is 0.001 this is the F
significance value that implies an F-significance value of p<0.001. Because this probability value
is less than the significance level of α = 0.05, the researcher concluded that the regression as a
whole is significant. To test this statistic the researcher used a table of F to determine a critical
test value for a probability of 0.05 or 5% (this relationship can occur by chance only in 5 out 100
cases) and with 4, 59 degrees of freedom. According to the table, the critical test value is 6.12. In
this test, the relationship is deemed significant because the calculated F statistic is greater than
the critical test value. This regression is statistically significant at the 0.05 level because is
greater than 6.12
The equation below contains generated information pertaining to the effect of each
individual independent variable on the model. It tests how well the regression equation fits
the data generated.
From the generated values, the final regression equation is as follows

71
Y = 0.387 + 0.229 No. of Products + 0.386 Access to Products + 0.260 Cost of Products
+ 0.125 Business environment provided by MFIs+ 0.239
The coefficients indicate the increase in the value of the dependent variable for each unit
increase in the predictor variable; this is indicated by the un-standardized coefficients. The
value for number of products is 0.229, which indicates that for each unit change in products
available, the predicted poverty alleviation increases by 22.9% given that all the other
predictor variables, (Xi) are held constant. The un-standardized coefficient for access to
products is 0.386, which indicates that for each member accessing a unit of the product, the
predicted poverty alleviation increases by 38.6% given that all the other predictor variables,
(X i) are held constant. The un-standardized coefficient for cost of products is 0.260 which
indicates that for each reduction in product costs, the predicted poverty alleviation
increases by 26% given that all the other predictor variables, (Xi) are held constant .The un-
standardized coefficient for business environment to members is 0.125, which indicates
that for each unit of conducive business environment, the predicted poverty alleviation
increases by 12.5% given that all the other predictor variables, (Xi) are held constant.
Looking at the different un-standardized coefficients of the independent
variables, comparing them with each other the researcher found out; that access to products
(38.6%) predictor was the best predictor variable followed by cost of products (26%), then
number of products (22.9%) and lastly business environment (12.5%).
4.11 The t-Test Statistic and interpretation
The researcher used a two tailed test to test whether Xi is a significant explanatory
variable, this was done by checking –tc ≤ to ≤ tc. Since the researcher used a 95%
confidence interval then the significant level alpha α is 0.05. Using the data in the above

72
coefficient table, the researcher conducted a linear regression t-test to determine whether
the slope of the regression line differs significantly from zero by using the critical tc.
The degree of freedom (DF) is equal to:
DF = n- (3)
Where n is the number of observations in the data.
Table 4.22 Coefficients of Regression
Model Un-standardized Coefficients
Standardized Coefficients
T Sig. 95% Confidence Interval for B
Correlations
B Std. Error
Beta Lower Bound
Upper Bound
Zero-order
Partial Part
1 (Constant) .387 .239 1.155 .123 -.563 1.217
NO. OF PRODUCTS .229 .215 .192 2.509 .187 -.117 .321 .433 .174 .081
ACCESS TO PRODUCTS
.386 .291 .289 2.654 .111 .086 .532 .486 .303 .197
COST OF THE PRODUCTS
.260 .229 .516 2.812 .233 -.429 .186 .395 .010 .092
BUSINESS ENVIROMENTPROVIDED BY MFIs
.125 .142 .167 .569 .421 -.166 .429 .572 .121 .068
DF = 60- (3) = 57
The 5% two-tailed critical t-value with 60– (2 + 1) = 57 degrees of freedom is 2.000. The
researcher should nullify the research questions if the t-statistic is less than 2.000. The t-
statistic values can be obtained from the table above and they are as follows;

73
Number of product available =2.509
Access to products=2.654
Cost of products=2.812
Business environment offered by MFIs to members=0.569
It can thus be concluded that the above four factors with the exception of business
environment are significant to the model. Thus, number of products, access to products and
cost of products are significant factors in explaining impact of Deposit Taking MFIs on
poverty alleviation.
4.12 Assumptions of the model
1. Residual analysis:
- Normally distributed and Independent Residuals
2. Random and Independent selected samples.
3. Normally distribution of the 60 respondents.
4.13 Chapter Summary
The researcher used SPSS software to analyze and present data. Four independent
variables were analyzed to examine their impact on poverty alleviation in the area under study.
Cost of products, accessibility to products and number/types of products were found to have a
significance impact on poverty in their order of arrangement. Business environment was found to
have no impact at all on poverty.

74
CHAPTER FIVE
SUMMARY, CONCLUSION AND RECOMMENDATION
5.1 Introduction
This chapter provides a summary of the findings; the conclusion and the
recommendations of the study on impact of Micro-finance on poverty alleviation in Busia
County.
5.2 Summary of the Study
The following is the summary of the research findings upon which the conclusion and
recommendations of the study are made. The study established that the respondents were
moderate in their opinions about the number of products offered by Deposit Taking MFIs
empowering them economically and thus reducing poverty levels. The respondents agreed that
the need to borrow what you save even through joint liability has instilled financial discipline in
them. A good number were moderate that the Savings services have directly contributed to their
control of resources besides helping them to get the small loans. The study found out that the
majority of the respondents had moderate opinion that the savings services offered by the MFIs
were unique from the bigger financial Institutions because they could act as guarantors on the
loans borrowed. Although caution should be taken while saving because the higher the savings
the greater the opportunity cost on household crucial expenditure, as one has to forego other
expenditures to save for future loan application. Nevertheless a good number strongly agreed that
access to microfinance services has been effective in helping entrepreneurs get empowered
economically, a situation which makes them rest assured that when their businesses face any

75
catastrophe, they have a lender they can turn to. A good number agreed that micro-credit services
offered have assisted them to get economically empowered because loan can be advanced up to
about 3 times the savings of a member.
The study found out that majority agreed that availability and access to products such as
loans, saving and advisory services greatly assist them to achieve self employment. However on
the availability of products, insurance services are the least exploited or known by members.
This is because it is the least promoted product by the institutions. Most of them who had joined
the MFIs with the intention of running business while looking for employment had resorted to
self employment as their core source of income. On the other hand a few were moderate that they
faced different forms of obstacles in their struggle to get economically empowered before joining
their respective MFIs. However, advisory and microcredit services have assisted them to move
away from the obstacles. Further, majority were moderate that Microcredit services of MFIs
have assisted them achieve self employment because the small loans advanced to them with fair
interest rates have led to their entrepreneurial achievements. In addition a few were moderate
that the insurance services offered by the MFIs could assist them off the time to time liabilities
and uncertainties/risks in business. This group comprises of members who hold individual
membership to the institution, having businesses that are "bigger" compared to the rest. They
take large sums in terms of loans repayable over a minimum period of three years. Given their
operations and level of transactions, MFIs encourage them to take insurance services. These are
members that can comfortable main stream commercial banks but due to interest rate levels
among other factors opt not to. However the respondents disagreed that there was a well
organized structure on how insurance services of MFIs could help the respondents be protected
from the defaulters who default intentionally yet the guarantors savings are taken up to pay for

76
such defaulters, while a good number agreed that advisory services are satisfactorily conducted
and greatly assisting respondents to have financial independence. Respondents were moderate
concerning savings status of the members because the microcredit service motivates the
respondents to increase their savings so as to get more lending from the MFIs.
According to the findings, most respondents were moderate that cost of the products
more so loans is vital. The short durations between loan uptakes and frequency is due to the fact
that the interest rates are satisfactory compared to commercial banks. The cyclical uptake and
repayment of loans though tedious but with patient has seen some members grow their ventures
and pull out of joint liability membership, preferring to join MFIs as individuals. Thus
availability of affordable microcredit facilities has assisted many respondents to greatly acquire
more resources than they had before joining the MFIs. The only challenge is that these members
cannot take large loans either due to their small operations, savings or members under joint
liability unwilling to guarantee such amounts. This then explains the cyclic process of borrowing
and repaying till one break out of joint liability and join as an individual member, who can
depend on the microfinance turnover to be accepted as collateral. After all these, whether under
joint or individual liability, one has control his/her own business, size notwithstanding. Hence
their control of resources can be attributed to the availability of Deposit Taking Microfinance
services in county.
On the penetration level of Deposit Taking MFIs in the County, a moderate number agree
that it has not reached the remotest part of the county. They feel more can be done to better the
situation but in the mean time, the efforts of these institutions to have field officers to address
members concerns have been appreciated. This cannot according to them be compared by
commercial banks that 'forgot' them. Majority of the respondents were in agreement that in most

77
cases, their respective DTMs provide an enabling environment for them to improve financially.
Improved penetration level means easy membership and eventually access to micro-credit
facilities, something many members have been longing for. This is because unlike commercial
banks that had stringent measure as far as joining and lending is concerned, MFIs are more
flexible. A member can get a loan as early as after three months and unlike banks where if a loan
application fails, one has to endure for three months before making an attempt (at the same
bank), MFIs don’t have such rules. There is more flexibility in repayment among other factors
and this explains why members feel the environment offered by MFIs is ideal. In any case, a
majority associate these institutions with their economic status compared to commercial banks
viewed in their eyes as being after the money. To them MFIs are after bettering their welfare and
as such a 'win-win' situation for the players.
5.3 Conclusion
With regard to whether the Deposit Taking MFIs have contributed to economical ly
empowering Busia micro-entrepreneurs, the study found that there was an improvement in terms
of members accessing MFIs services. More people are continuously joining MFIs and their reach
to the unbanked and poor in the county is evident than it was some years back. Therefore the
MFIs have improved the services offered in terms of reach, cost number of products and
assisting their members by offering a good business environment. Deposit Taking MFIs are
expanding the spectrum of services they offer apart from the traditional Microcredit services.
Deposit Taking MFIs have improved the spectrum of services as compared to non-DTMs which
seem to stick much on the traditional services and not giving a chance to the emerging needs

78
have additional services that may assist the members in the County get more empowered
economically than before.
The finds agree with the study of Kiiru (2007) whose results indicated a positive and
significant impact of microfinance on household income. She argues in her study that there is a
role of microfinance on the improvement of household incomes. This is in agreement with the
findings of this paper that providing affordable financial services to the rural population still
remains to be an important component of development strategy. The data indicated that there
was increased number of members who control resources, in self employment and saving. There
is equally many members accessing Microcredit services to start or expand businesses than
before in the county. Furthermore, most members in self employment and controlling resources
were an indicator of increased economic empowerment as such a reduction in poverty. The
findings are similar to those of Kiiru (2007) on a study on poverty in Makueni. The studies
concur that there is need to come up with innovative microfinance institutions that are supportive
of their own role in assets accumulation and wealth creation for their clients. This entails
profiling of potential clients, as well as streamlined microfinance regulations to protect their
clients. Creation of an enabling policy framework to spur growth both in the micro enterprises
and the overall rural economy would lead to the creation of employment opportunities and an
increment in the agricultural output (which is a major source of income for residents). However
this may require more than one particular policy intervention thus need for both private
(microfinance) and public partnerships to create the environment where such poverty reduction
objectives can be realized.
There were four research questions relating to Deposit Taking MFIs that lead to poverty
alleviation in the County. The Regression analysis was applied to test them. The poverty

79
alleviation rate could have been higher had the nature of business environment offered by DTMs
been statistically significant. This means that cost of products, accessibility and cost of the
products are important factor if poverty alleviation in the county is to prevail. Business
environment offered by MFIs had the least impact on poverty.
5.4 Emerging Policy Implications
This study done on the impact of Deposit Taking MFIs on poverty alleviation in the
County observed that members are faced with various constraints. As a result, policy makers
should intervene in the following areas to support members' efforts in eradicating poverty and
achieve economic empowerment:
Deposit Taking MFIs Services Penetration: Policy makers especially in the County government
should find ways of encouraging microfinance institutions to scale their operations throughout
the county. The County government should find ways of formulating policies or offering
incentives to MFIs aimed at encouraging them to spread in the entire county.
Capacity Development: the county leadership should explore ways of equipping the youth with
entrepreneurial skills. This turns would be job seekers into employers because after all, the
county cannot offer employment opportunities to everyone. Further, there county government
should offer incentives to lure youth into business.
The government should:
1. Create an enabling environment for microenterprises by making requisite financial
reforms and formulating appropriate policies; the Uwezo fund is a good starting point
2. Carry out institutional and policy reforms to promote better access through licensing
more MFIs.

80
5.5 Suggestions for Further Research
In the light of the findings discussed above the researcher recommends a few area that further
studies can be conducted. Future studies can be carried out to examine the impact of
microfinance on social empowerment of the residents in the area. More studies have focused on
economical but less on the social aspect. In addition to this, has microfinance has any impact on
political empowerment of its members. The study also found that 35.80% of the outcome could
not be explained by the model, there is need then to examine which factors are this and the
nature and level of their impact on poverty. Lastly, there is need to carry out studies to examine
whether MFIs exist to make profit, empower their clients or both.
5.6 Remedy to Limitations of the Methodology used in Future Studies
The researcher encountered some limitations during the study and this could be remedied in
future in a number of ways. Thorough pilot studies should be carried out before the study can be
conducted to test the instruments to be used. This will help in correcting any anomaly before the
actual data collection. The researcher advocates for one to spend more time in the area under
study as other data collection procedures such as interviews with and observations of the target
population can augment data collection through questionnaires. Including control group into the
study, that is respondents who are not members to microfinance, may present good scenario for
comparison. This will allow the researcher reach conclusion after having made an evaluation of
the control and treatment groups.

81
REFERENCES
Armendariz de Aghion, Beatriz and Jonathan Morduch, (2000), on Microfinance beyond
group lending, Economics of Transition
Barnes, Carolyn, Gayle Morris, and Gary Gaile, (2007), an Assessment of Client of Microfinance Programs in Uganda, International Journal of Economic Development
Barret , (2005), microfinance institutions and developing countries subscriptions.
Baydas, Mayada M., Richard L. Meyer, and Nelson Aguilera-Alfred, (2004), Discrimination against women in formal credit markets: Reality or rhetoric? World Development
Bennett, L. and C. Cuevas, (2006), Sustainable banking with the Poor, Journal of International Development 8, 145-152
Berger, Allen N. and Gregory F. Udell, (2001), Relationship lending and lines of credit in small firmfinance, Journal of Business 68, 351-381
Beverly, Sondra and Michael Sherraden, (2005), Institutional determinants of savings: implications for low-income households and public policy, Journal of Socio-Economics 28, 457-473.
Bhatt, Nitin, (2008), Can microcredit work in the United States? Harvard Business Review (77, 26 27).
Bhatta, Gambhir, (2001), "Small is indeed beautiful but ...": The context of microcredit strategies in Nepal, Policy Studies Journal 29, 283-295.
Buckley, Graeme, (2007), Microfinance in Africa: Is it either the problem or the solution? World Development 25, 1081-1093.
Christen, Robert Peck, Elisabeth Rhyne, Robert Vogel, and Cressida McKean. (2005) “Maximizing the Outreach of Microenterprise Finance: An Analysis of Successful Microfinance Programs” USAID Program and Operations Assessment Report No. 10. Washington, D.C.: U.S. Agency for International Development
Churchill, Craig, (2002), tries to understand the Demand for Micro insurance, Journal of International Development 14, 381-387.
Conning, Jonathan, (1999), Outreach, Sustainability and Leverage in Monitored and Peer-Monitored
Copestake, J., Bhalotra, S., & Johnson, S. (2001). Assessing the impact of microcredit: A Zambian case study Journal of Development Studies, 37(4), 81-100

82
Copestake, James, Sonia Bhalotra, and Susan Johnson, (2007), assessing the impact of microcredit: A Zambian case study, The Journal of Development Studies 37, 81-100
Harper, Malcolm, (2007), “Promotion of Self Help Groups under the SHG Bank Linkage Program in India”, Paper presented at the Seminar on SHG-bank Linkage Programme at New Delhi, November 25-26, 2002.
Henri Ukoha A. & Orebiyi J. S (2011) on determinants of loan acquisition from financial
Hussien Hamda, (2007), Farm household economic Behavior in imperfect Financial Markets
International Finance Corporation IFC (2011), Strengthening Access to Finance for women
Kabeer N (2009), “Conflicts Over Credit: Re-evaluation the Empowerment Potential of Loans to Women in Rural Bangladesh”: World Development, Vol. 29, No.1.
Porteous, (2006), Competition and Microcredit Interest Rates.
Morduch and Barbara, (2002), Analysis of the Effects of Microfinance on Poverty Reduction.
Pitt, Mark, and Khandker, (1996), Household and Intrahousehold Impact of the Grameen
Bank and similar Target Credit Programs in Bangladesh
Remenyi, Joe, Quinones and Benjamin, (2002), Microfinance and Poverty Alleviation.
Barnes, Carolyn, Gayle Morris, and Gary Gaile, (2007), Assessment of Client of
Microfinance Programs in Uganda, International Journal of Economic Development.
Pitt, Mark, Khandker, Chowdhury and Millimet, Credit Programs for the Poor and the
Health Status of the Children in Rural Bangladesh.
Rodrik, Dan, (2000), on Growth versus Poverty Reduction: a Hallow Debate.
Simanowitz, Anton, (2000), on Client Exit Surveys: A Tool for Understanding Client Drop-Out.
Stearns, Katherine, (1989), on Microenterprise Development programs: Is Client Graduation

83
a Myth? Tinker, Irene and Summer, (2000), on Alleviating Poverty. Journal of American Planning Association. 66 (3)
Yunus, (1999), on The Grameen Bank. Scientitific American.
Zaman, (2000), on Assessing the Poverty and Vulnerability of Impact of Micro-Credit
in Bangladesh: A Case study of BRAC. World Bank
Sunita, (2003), on Factors Impeding the Poverty Reduction Capacity of Micro-Credit:
Economic Research Papers NO. 74

84

85
APPENDIX II
QUESTIONNAIRE SAMPLE
Client’s Microfinance institution name……………………………………………………..
Section A. Client’s Demographic information
Q. 1 Age in years
(Tick where appropriate)
0-18 19-25 50 and above
26-35 36-50
Q.2 Client’s Education level
(Tick where appropriate)
No formal education
Primary school
Secondary school
Tertiary colleges
Middle level colleges
University level-undergraduate
University level-Masters
Other (please specify)…………………………………………………………..

86
Q.3 Marital status
(Tick where appropriate)
Single
Married
Divorced
Widowed
Other (please specify)……………………………………………………………………………..
b) If you are married, are you staying with your spouse?
YES NO
c) Do you have children?
YES NO
SECTION B-Basic history with Microfinance
d) When did you join this Microfinance?
Month-------- Year -----------
e) What drove you to joining this microfinance? (You can tick more than one)
Self-employment control of resources
Increase my savings access borrowings
Other (please specify)………………………………………………………………………
SECTION C- Types of products offered by Microfinance Institutions
Q.4 a) Do you own an enterprise?

87
YES NO
If yes, was it started before or after joining the Microfinance institution?
BEFORE AFTER
b) Are you employed elsewhere?
YES NO
c) What is your main source of income?
Employment my own Enterprise
d). How do you rate the services/products offered by your microfinance institute?
Agree Strongly Agree
Not sure Disagree Strongly Disagree
Similar
Different
Don’t know
Never cared
e) Are you able to get all of the services below from MFIs whose membership you hold? If
so has it made any difference in the enterprise?
Agree Strongly
Agree
Not sure Disagree Strongly
Disagree
Insurance by MFIs
Advice received

88
Savings acting as your
security
Micro-credits
f) Was the type of services offered a factor when choosing the microfinance institution to
join?
YES NO
g) Do you think that the service offered adequately address personal and business needs?
YES NO
SECTION D- Access to Microfinance services/products Q 5
a) What are the main obstacles that affected your business before and after joining this
Microfinance? (Tick where appropriate)
Before after joining
no obstacles
combining work and family
liquidity and other financial problems
no sufficient advice
b) Before joining this Microfinance were you able to get access funds from elsewhere i.e.
Chama’s, merry-go-rounds etc.?
YES NO
c) After joining this Microfinance, is there a difference in accessing services offered?

89
YES NO
If the answer to this is No, please explain briefly
……………………………………………........................................................................................
............................................................................................................................................................
............................................................................................................................................................
..........................................
d) If you normally borrow, for what purpose is it for?
Starting business Expansion of business School Fees Household expenses
others (please
specify)……………………………………………………………………………………………
………………………………………………………………………………………………………
…………………………………………………………………………………………………….
e) In your opinion, are there many limitations/hurdles encountered before one can finally
be a microfinance institution member?
YES NO
f) Are there Assets that you have acquired after joining this Microfinance?
YES NO
h) Has either of the following Microfinance Services accessed assisted in your
resources acquisition/control activities and/or running of the business since you
joined this Microfinance.
Agree Strongly Agree
Not sure Disagree Strongly Disagree
Insurance by MFIs
Advice received

90
Savings acting as your security
Micro-credits/borrowings
SECTION E- The number of microfinance institutions offering services in a) How do you
find the number/distribution of microfinance instit utions in the region?
Not satisfactory Somehow satisfactory Just Satisfactory Very
satisfactorily
a) How do you find the efforts of the Microfinance institution/s to serve those in the
remote parts of the region?
Not satisfactory Somehow satisfactory Just Satisfactory Very
satisfactorily
b) Has access to basic rights improved since joining microfinance? (Tick where appropriate).
Agree Strongly
Agree
Not sure disagree Strongly disagree
Education to the children
Food
Clothing
social life like your ‘status’ in the community

91
c) What is the state of your net financial worth after joining this Microfinance Institution ? (tick where appropriate)
before joining after joining
Positive
Negative
d) Do you think either of the following affected your choice of this microfinance institution?
Agree Strongly Agree
Not sure Disagree Strongly Disagree
Difference of products offered
No of microfinance institutions
Accessibility/availability to microfinance services
Variation in costing of the services
e) Has the distance between your business and the microfinance institutions offices a factor to consider?
YES NO
f) Are you a member to more than one microfinance institution? YES NO
SECTION F- Cost of service/s provided by Microfinance Institutions
Q 7
a) How frequently do you borrow from this Microfinance Institution?
After one month after 2-6 months after 6-12 months after 2 years
Others (please specify) ………………………………………………………………………………………………………………………………………………………………………………………………………………
b) How do you find the interest rates in this Microfinance institution?
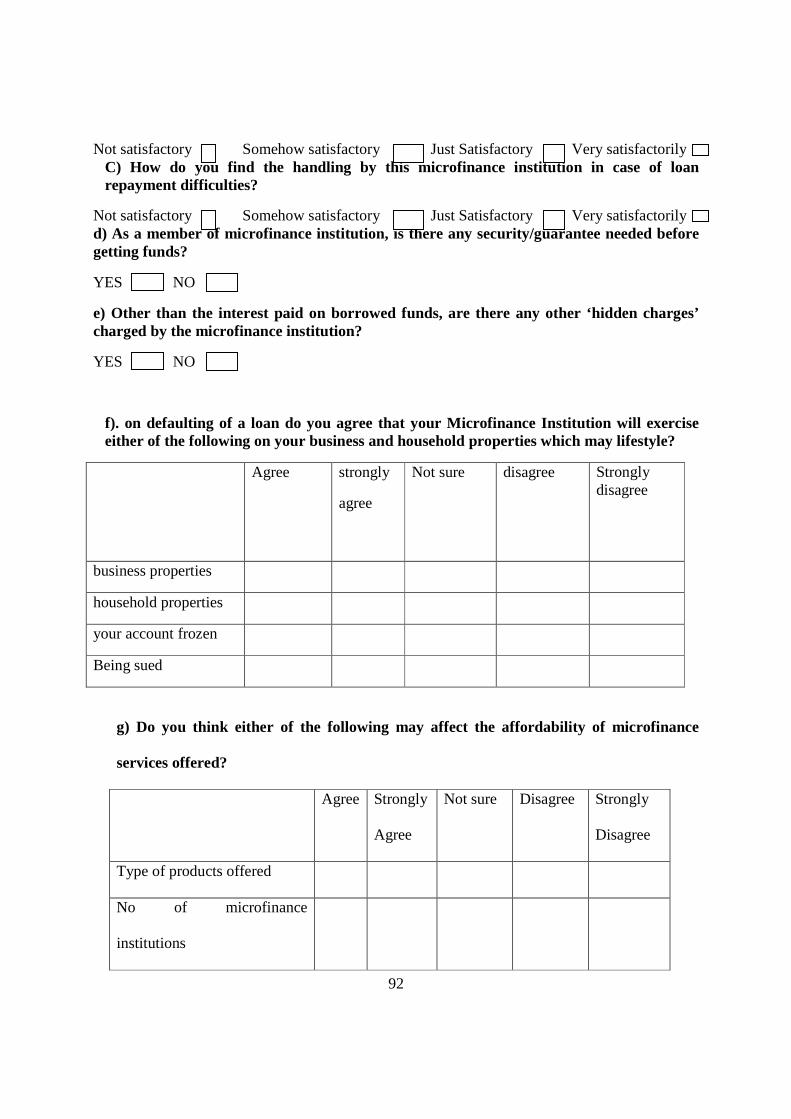
92
Not satisfactory Somehow satisfactory Just Satisfactory Very satisfactorily
C) How do you find the handling by this microfinance institution in case of loan repayment difficulties?
Not satisfactory Somehow satisfactory Just Satisfactory Very satisfactorily d) As a member of microfinance institution, is there any security/guarantee needed before getting funds?
YES NO
e) Other than the interest paid on borrowed funds, are there any other ‘hidden charges’ charged by the microfinance institution?
YES NO
f). on defaulting of a loan do you agree that your Microfinance Institution will exercise either of the following on your business and household properties which may lifestyle?
Agree strongly
agree
Not sure disagree Strongly disagree
business properties
household properties
your account frozen
Being sued
g) Do you think either of the following may affect the affordability of microfinance
services offered?
Agree Strongly
Agree
Not sure Disagree Strongly
Disagree
Type of products offered
No of microfinance
institutions

93
Accessibility/availability to
microfinance institutions
/services
Variation in costing of the
services/products
Section G. - The general extend to which Microfinance operations alleviate poverty Q 8(a) to what level do you agree that the following Micro-finance factors affect your enterprise in pursuing economic independence?
Agree (1)
Strongly Agree (2)
Not Sure (3)
Disagree (4)
Strongly Disagree (5)
Total
Type of products
Number of microfinance institutions
Accessibility to microfinance institutions/services
Variation in costing of services/products
Thank you for your time and co-operation