Embed Size (px)
Citation preview
The Global Fertilizer Supply Chain and Market Outlook Eoin Lowry Agribusiness Editor , Irish Farmers Journal
Outline
• Origins of fertiliser nutrients • The supply chain • Selection of NPK for compounds • Factors affecting prices • Price outlook
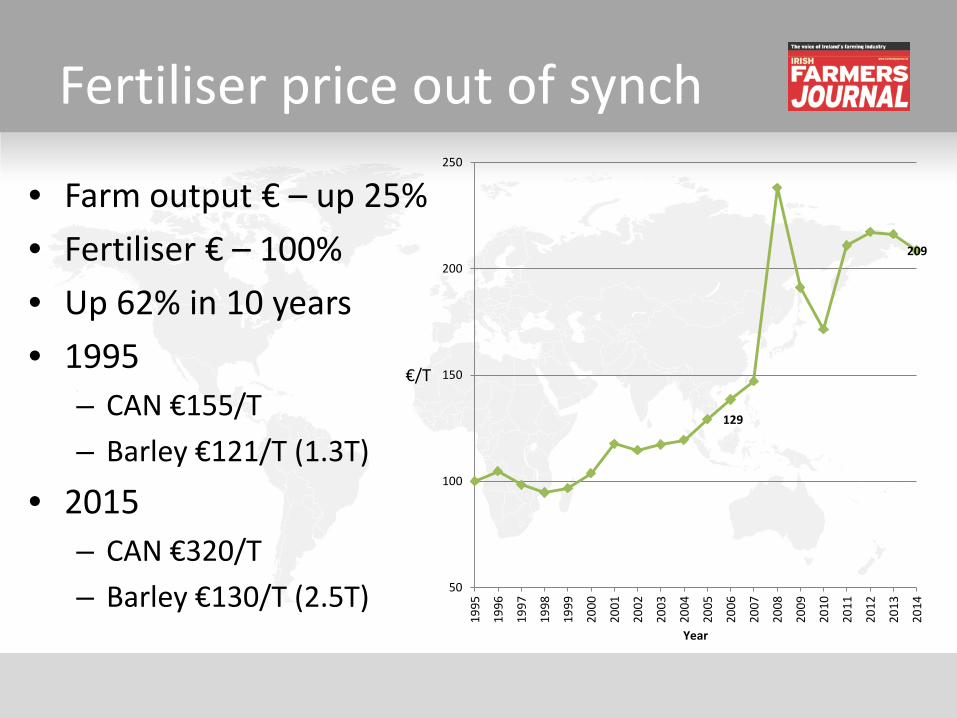
Fertiliser price out of synch
• Farm output € – up 25% • Fertiliser € – 100% • Up 62% in 10 years • 1995
– CAN €155/T – Barley €121/T (1.3T)
• 2015 – CAN €320/T – Barley €130/T (2.5T)
129
209
50
100
150
200
250
1995
1996
1997
1998
1999
2000
2001
2002
2003
2004
2005
2006
2007
2008
2009
2010
2011
2012
2013
2014
Year
€/T
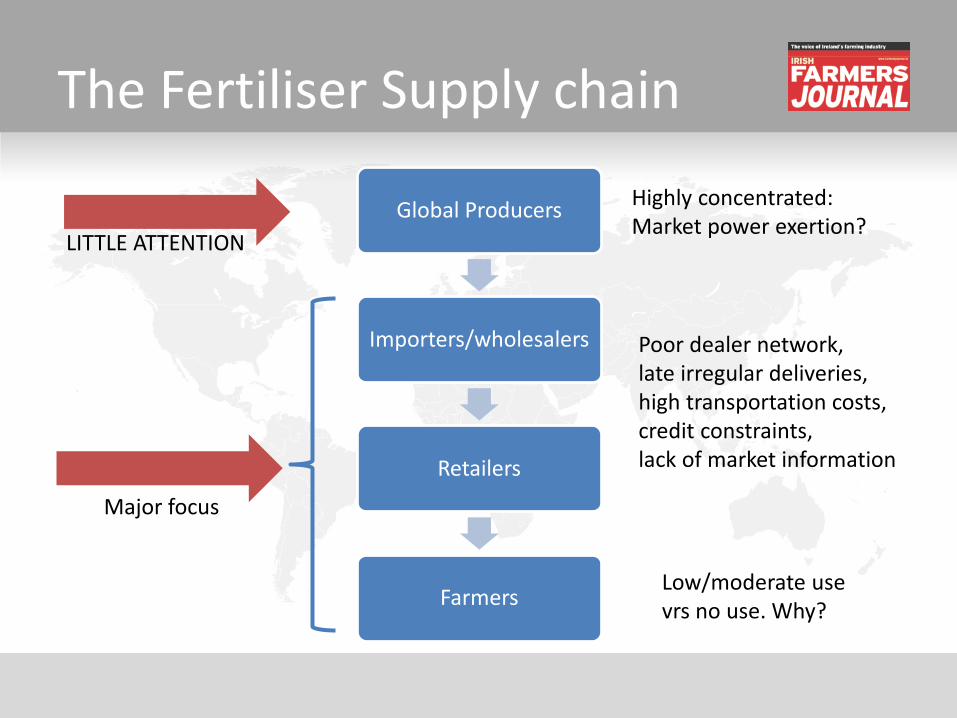
The Fertiliser Supply chain
Global Producers
Importers/wholesalers
Retailers
Farmers
LITTLE ATTENTION
Major focus
Highly concentrated: Market power exertion?
Poor dealer network, late irregular deliveries, high transportation costs, credit constraints, lack of market information
Low/moderate use vrs no use. Why?
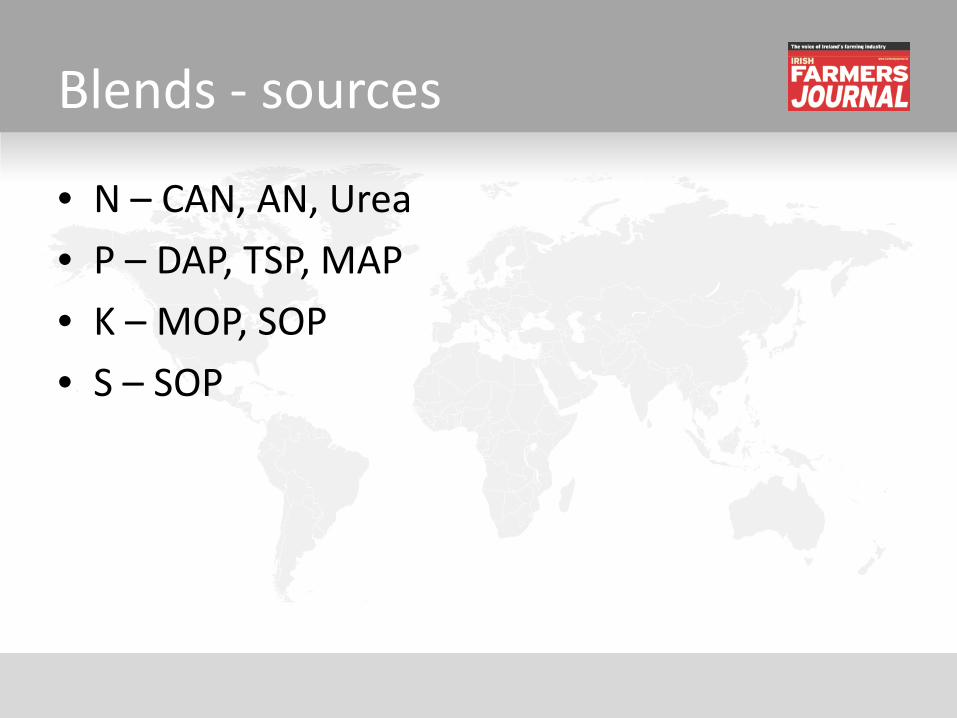
Blends - sources
• N – CAN, AN, Urea • P – DAP, TSP, MAP • K – MOP, SOP • S – SOP
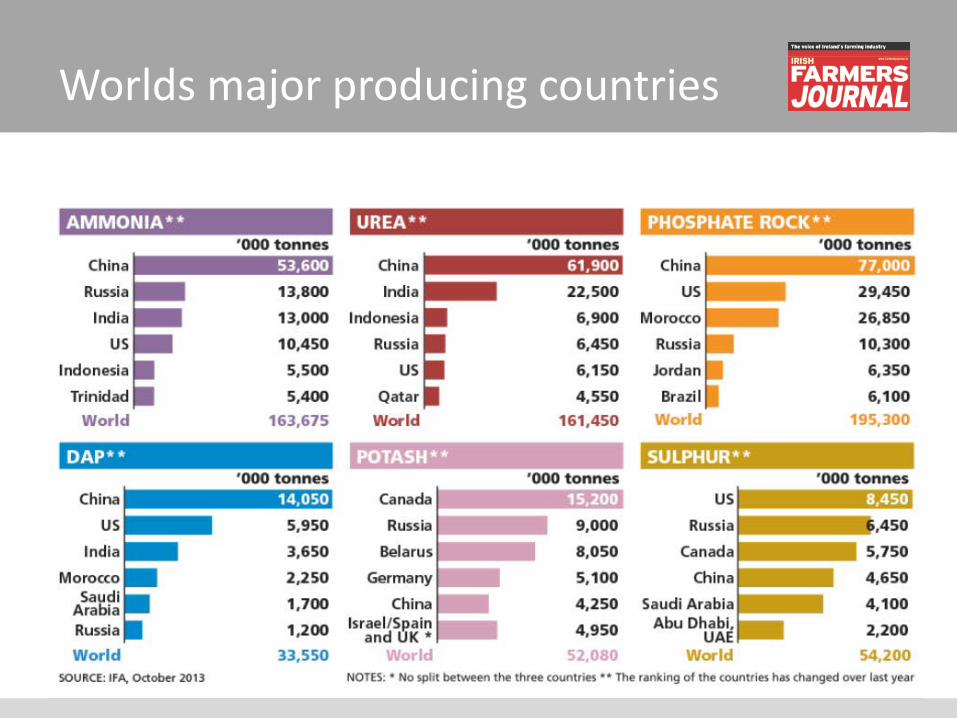
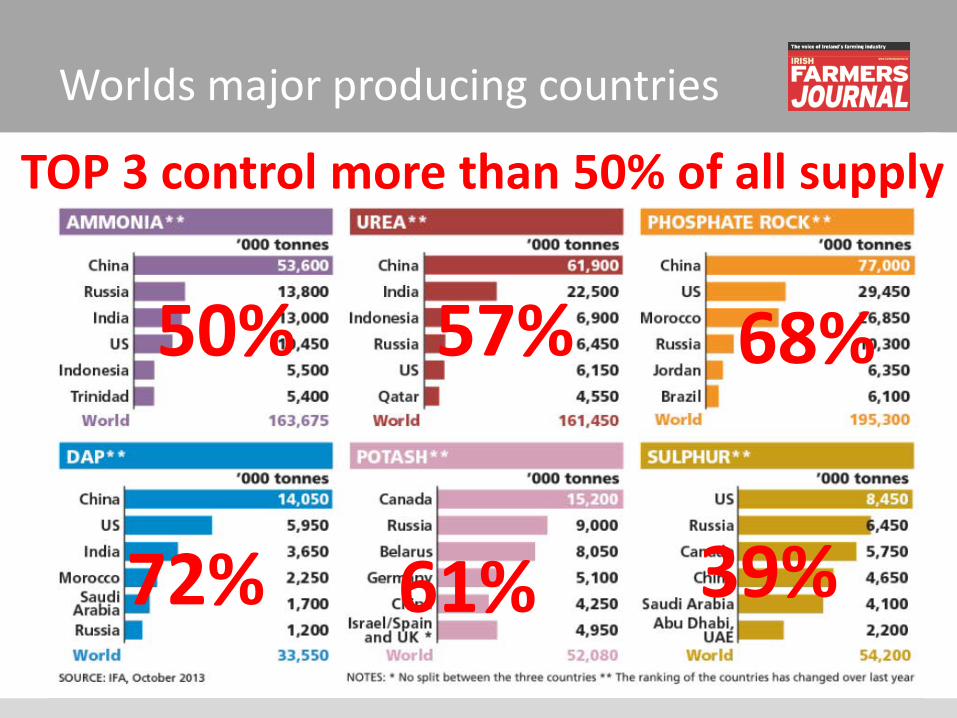
Worlds major producing countries
Worlds major producing countries
50% 57% 68%
72% 61% 39%
TOP 3 control more than 50% of all supply
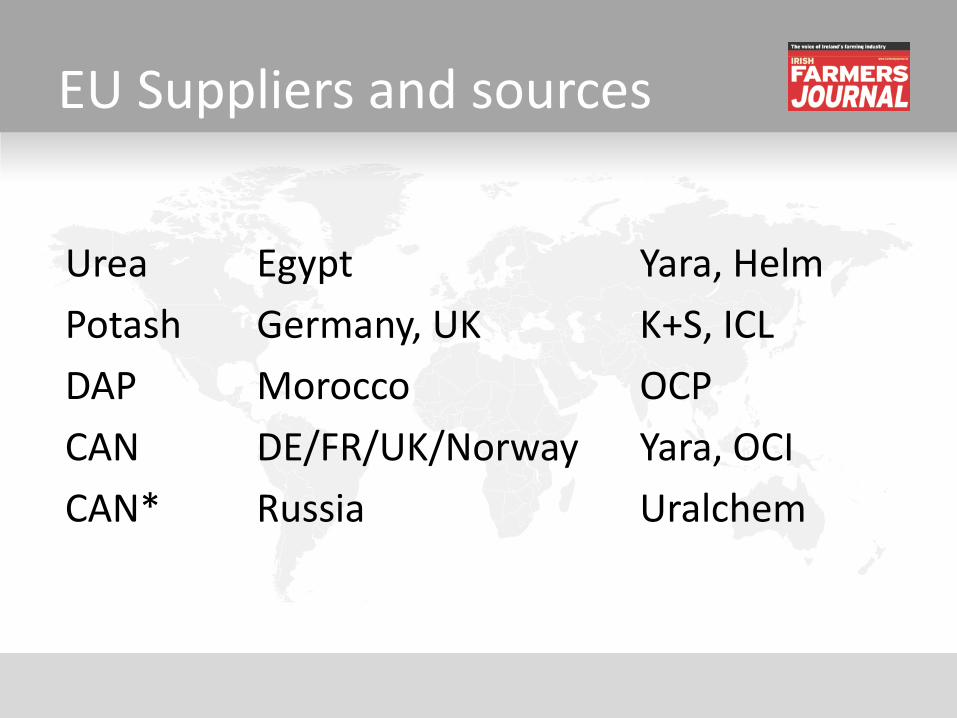
EU Suppliers and sources
Urea Egypt Yara, Helm Potash Germany, UK K+S, ICL DAP Morocco OCP CAN DE/FR/UK/Norway Yara, OCI CAN* Russia Uralchem
The global supply chain • Complex • Geopolitical • Macro-economic • Trade barriers • Other commodity
sectors – Energy – Mining
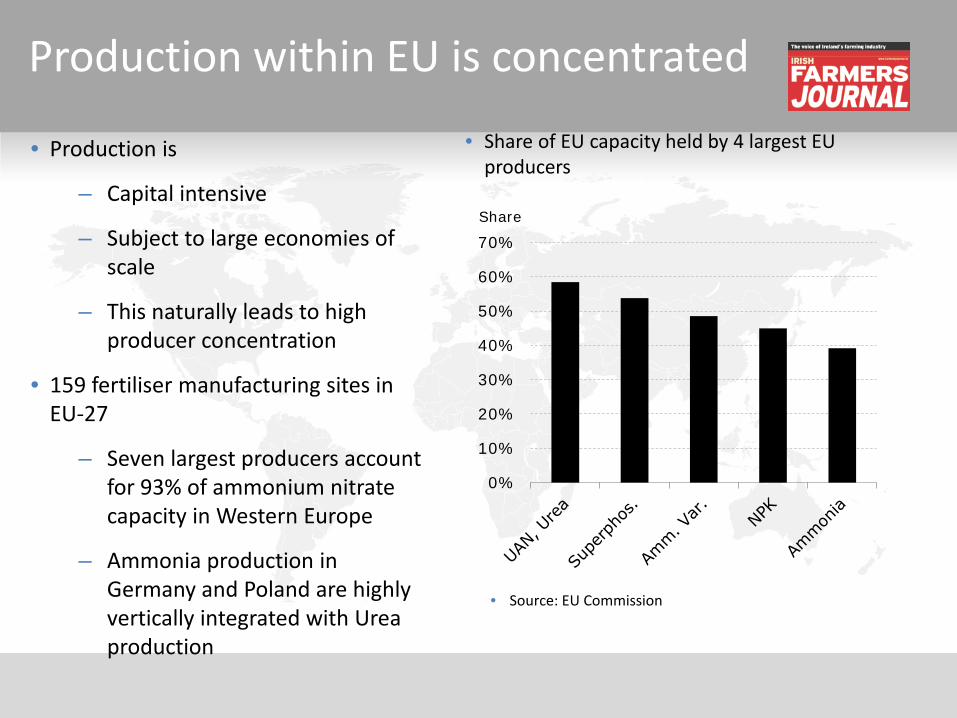
Production within EU is concentrated
0%
10%
20%
30%
40%
50%
60%
70%Share
• Share of EU capacity held by 4 largest EU producers
• Source: EU Commission
• Production is
– Capital intensive
– Subject to large economies of scale
– This naturally leads to high producer concentration
• 159 fertiliser manufacturing sites in EU-27
– Seven largest producers account for 93% of ammonium nitrate capacity in Western Europe
– Ammonia production in Germany and Poland are highly vertically integrated with Urea production
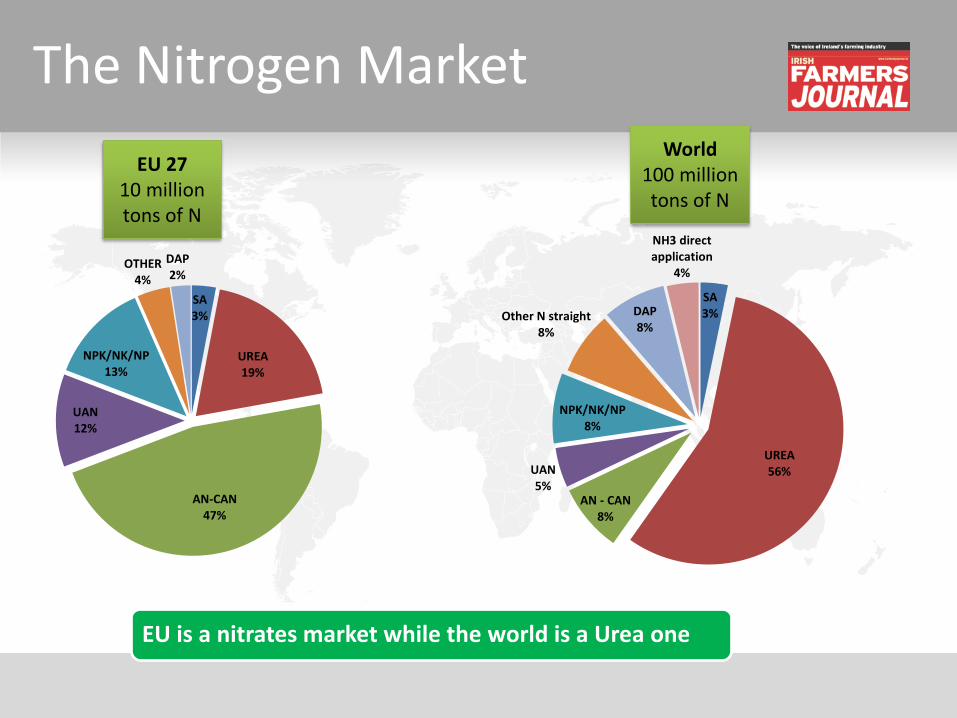
The Nitrogen Market
SA 3%
UREA 19%
AN-CAN 47%
UAN 12%
NPK/NK/NP 13%
OTHER 4%
DAP 2%
EU 27
10 million tons of N
SA 3%
UREA 56%
AN - CAN 8%
UAN 5%
NPK/NK/NP 8%
Other N straight 8%
DAP 8%
NH3 direct application
4%
EU is a nitrates market while the world is a Urea one
World
100 million tons of N
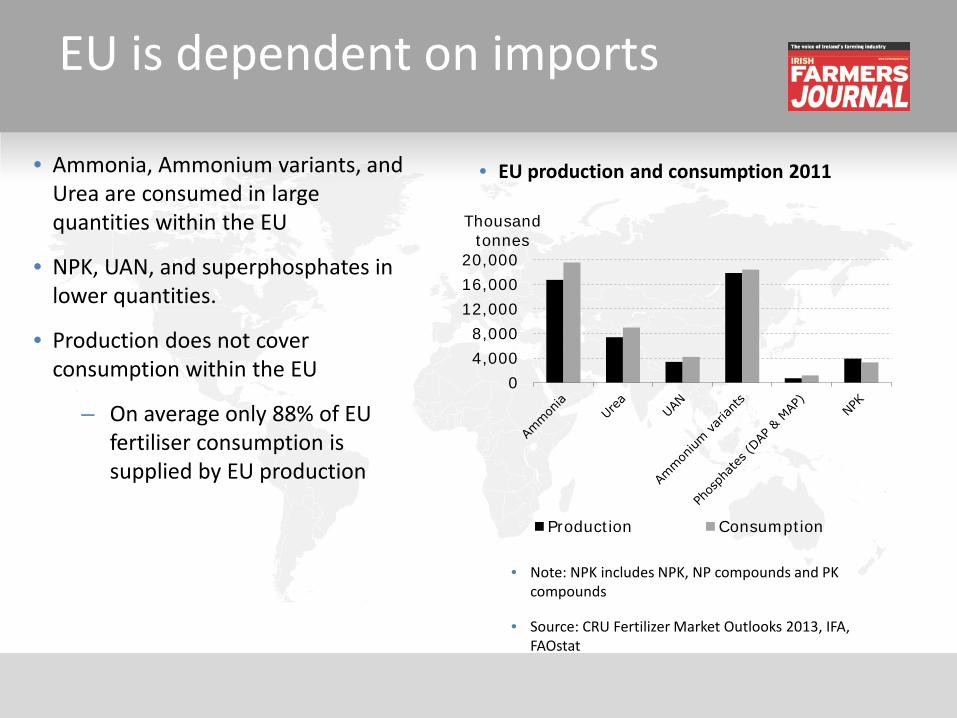
EU is dependent on imports
04,0008,000
12,00016,00020,000
Thousand tonnes
Production Consumption
• EU production and consumption 2011
• Note: NPK includes NPK, NP compounds and PK compounds
• Source: CRU Fertilizer Market Outlooks 2013, IFA, FAOstat
• Ammonia, Ammonium variants, and Urea are consumed in large quantities within the EU
• NPK, UAN, and superphosphates in lower quantities.
• Production does not cover consumption within the EU
– On average only 88% of EU fertiliser consumption is supplied by EU production

Nitrogen - Imports needed • Import share of Nitrogen fertilisers in EU-27
• Note: Consumption includes both agriculture and technical use of nitrogen containing fertilisers
• Source: Fertilisers Europe 2012 Overview
• Excess demand in the EU is covered by imports
• Imports of fertilisers containing nitrogen is stable around 20 per cent of consumption
• Mid-term projections predict EU consumption to be basically constant
Factors impacting prices • Supply demand balance • Currency • Gas Prices • Grain Prices – 68% arable/24% grass in EU • EU Policy
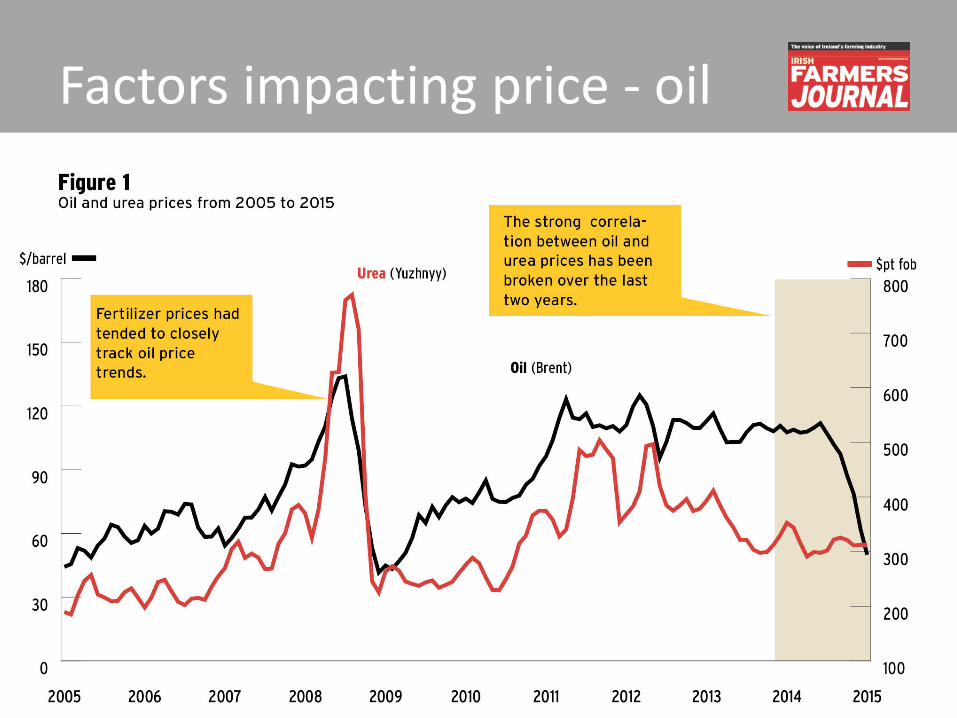
Factors impacting price - oil
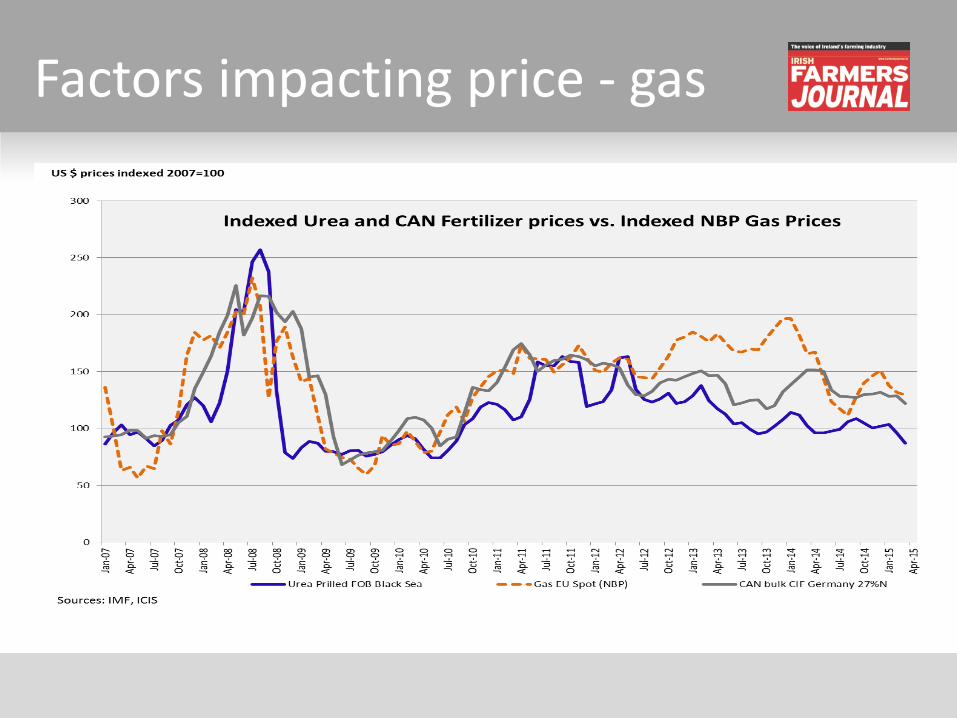
Factors impacting price - gas
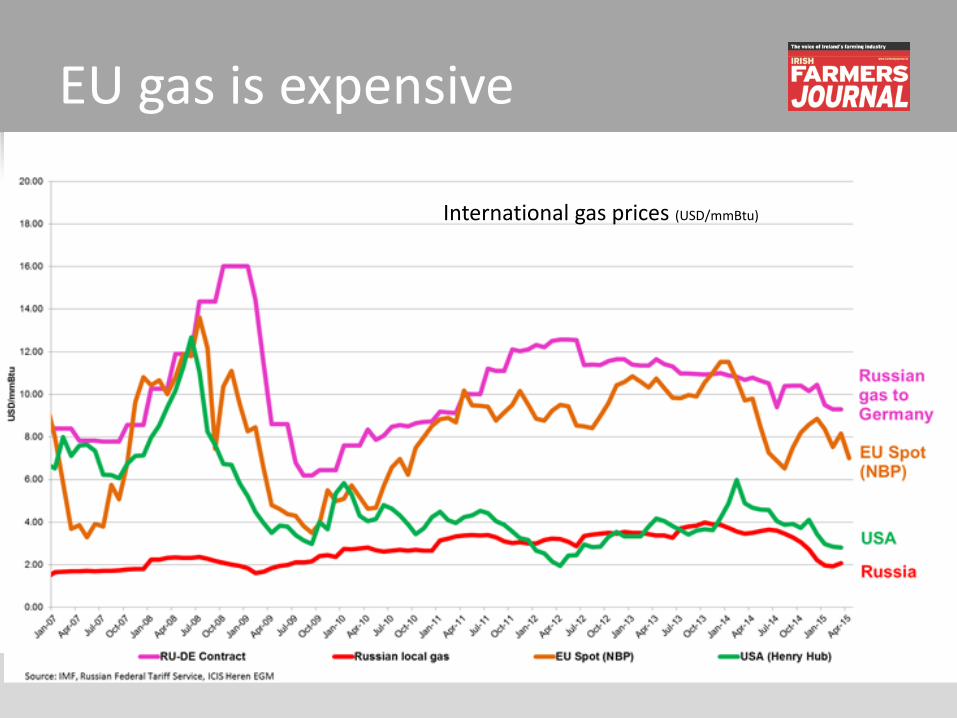
EU gas is expensive
International gas prices (USD/mmBtu)
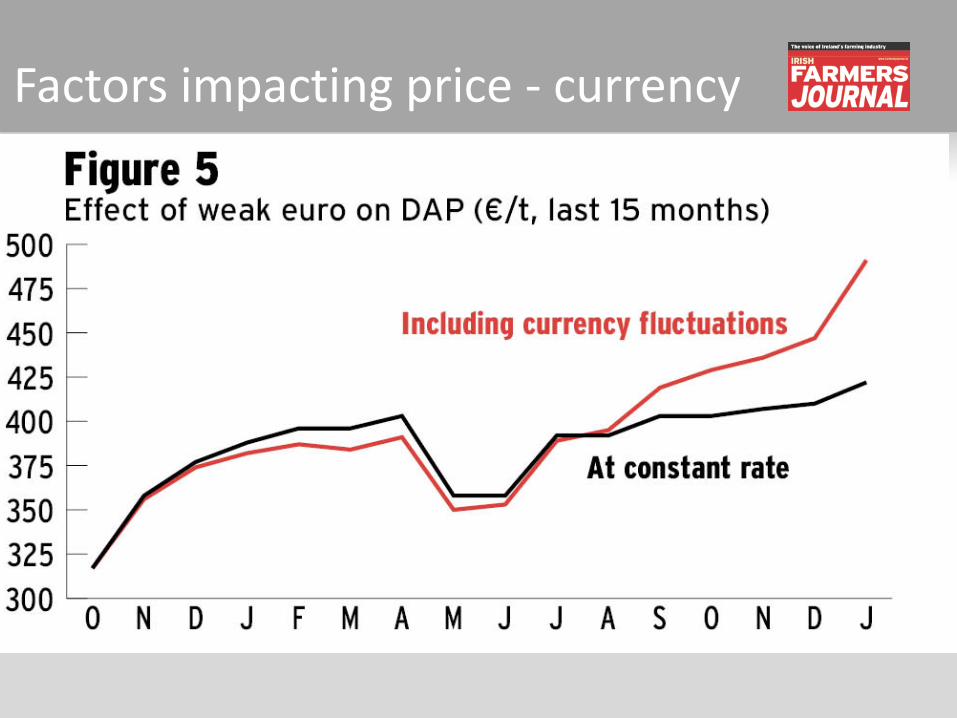
Factors impacting price - currency
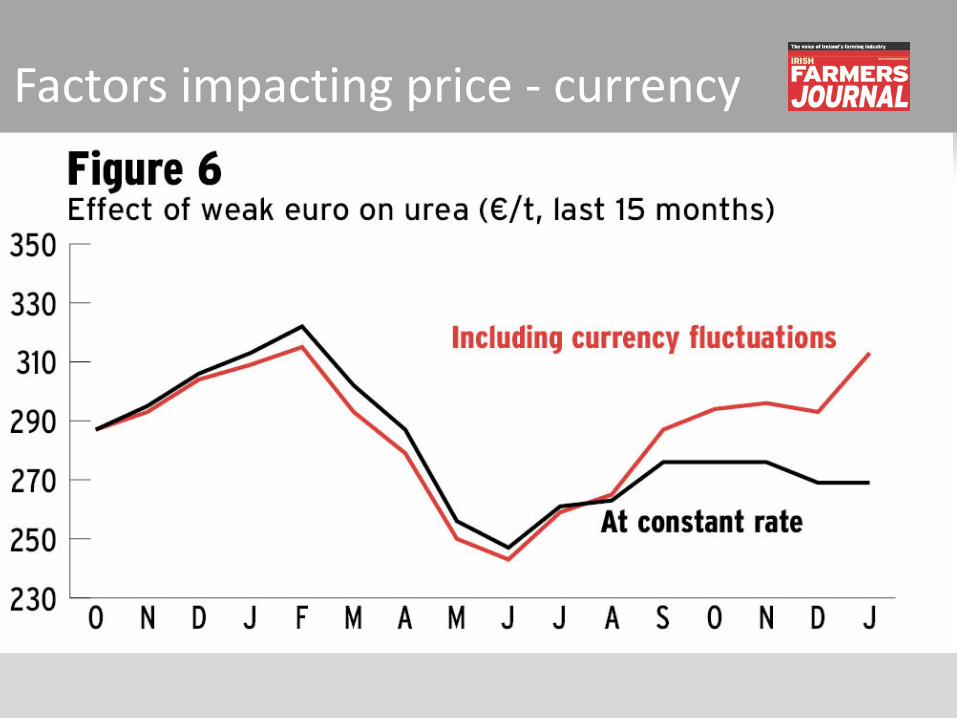
Factors impacting price - currency

5 year outlook • Invest $ 125bn • 235 new units • 1.4 m people are employed in the
industry worldwide • 45,000 new direct jobs • 95,000 new indirect jobs
Nitrogen Outlook • Supply growth to exceed growth in N
demand during the next 5 years • Supply surpluses would accelerate from
10mT N in 2016 to 18m T in 2019 • New ammonia capacity in East Asia and
African • Industrial demand expected to increase
28% compared to 6% in fertiliser N
Nitrogen Outlook - Urea • Urea - 55% going to 70% • New Urea capacity (East Asia, Africa and North
America) • 60 new units (20 located in China) • In countries well endowed with natural gas • Capacity to increase by 4% per year • 2019 before comes on stream
• Surplus – 4% of potential supply
Phosphate Outlook • Rock supply to grow 16% • Massive capacity expansions • 30 new units • Export orientated • 80 % - Morocco, Saudi Arabia, Jordan
China • Surplus – 4% of potential supply
Potash Outlook • Supply will increase 16% • Major Brownfield projects planned • 4 new mines • 2008 started – take a long time to come on
stream • Canada, Russia, Belarus -70% of growth • Short term equilibrium moving towards a
growing surplus in the longer term • Surplus – 18% of potential supply (14%)
0
100
200
300
400
500
600Q
1-20
14
Q4-
2014
Q3-
2015
Q2-
2015
Q1-
2015
Q3-
2014
Q2-
2014
Q4-
2013
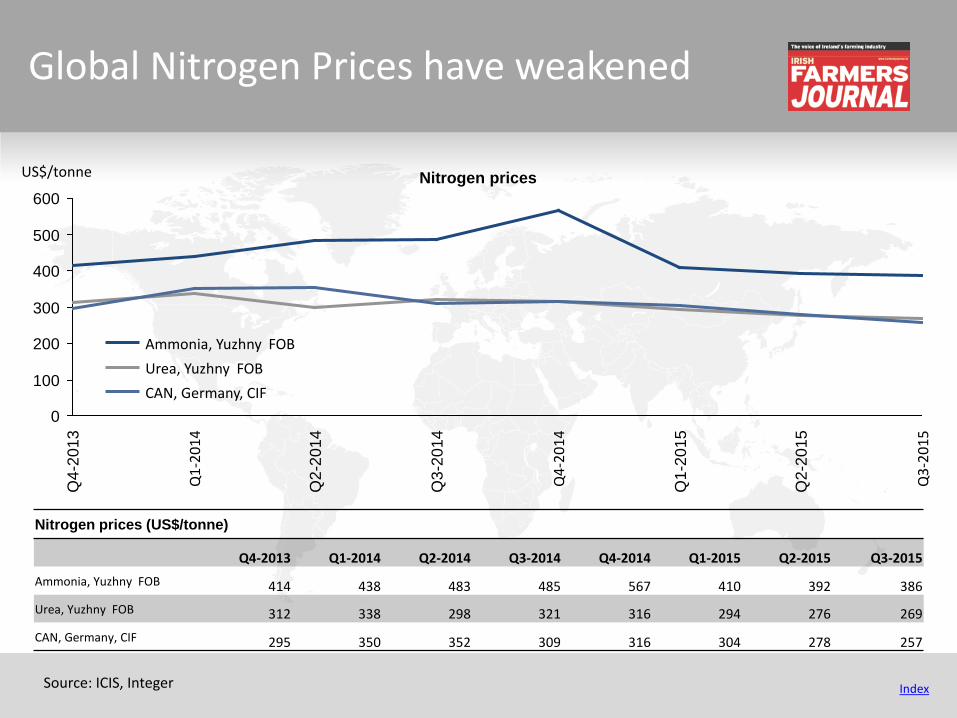
Global Nitrogen Prices have weakened
Source: ICIS, Integer
US$/tonne Nitrogen prices
Index
CAN, Germany, CIF Urea, Yuzhny FOB Ammonia, Yuzhny FOB
Nitrogen prices (US$/tonne)
Q4-2013 Q1-2014 Q2-2014 Q3-2014 Q4-2014 Q1-2015 Q2-2015 Q3-2015 Ammonia, Yuzhny FOB 414 438 483 485 567 410 392 386 Urea, Yuzhny FOB 312 338 298 321 316 294 276 269 CAN, Germany, CIF 295 350 352 309 316 304 278 257
0
100
200
300
400
500
600
Q4-
2014
Q3-
2014
Q2-
2014
Q1-
2014
Q4-
2013
Q3-
2015
Q2-
2015
Q1-
2015
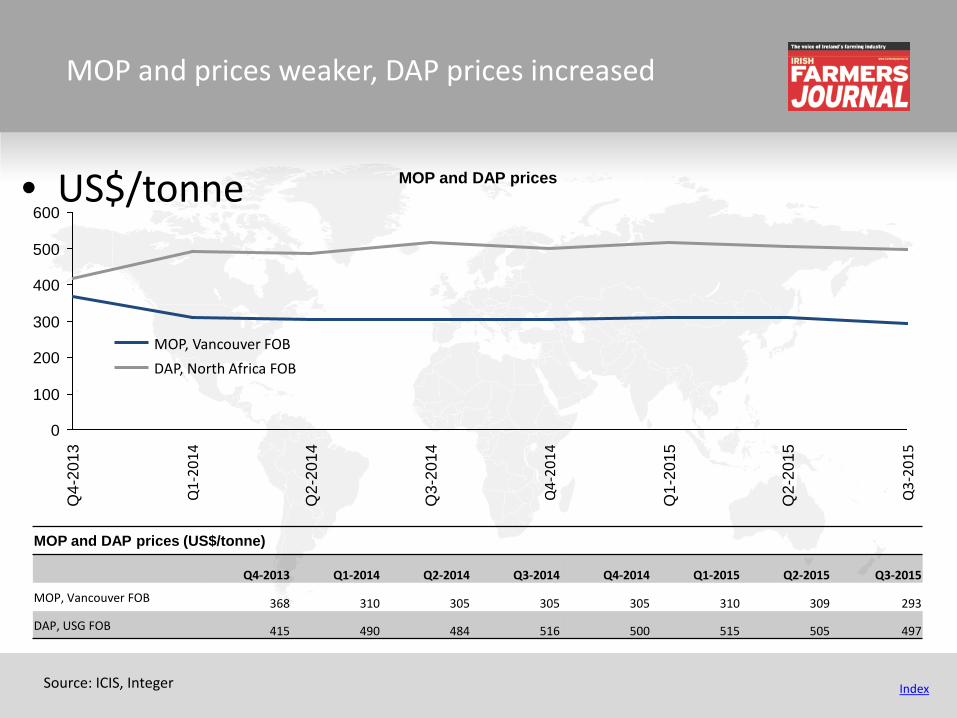
MOP and prices weaker, DAP prices increased
• US$/tonne
Source: ICIS, Integer
MOP and DAP prices
Index
MOP, Vancouver FOB DAP, North Africa FOB
MOP and DAP prices (US$/tonne)
Q4-2013 Q1-2014 Q2-2014 Q3-2014 Q4-2014 Q1-2015 Q2-2015 Q3-2015
MOP, Vancouver FOB 368 310 305 305 305 310 309 293
DAP, USG FOB 415 490 484 516 500 515 505 497
Summary • Weak € is single biggest factor driving current prices • EU is a CAN market – niche • Arable crops drive demand and prices • Gas accounts for 80% • N – strong increases unlikely • P – price is high • K – watch evolution of grain prices • Caution – volatile - little and often
Source: Integer