Embed Size (px)
Citation preview
1
The Phosphate Outlook
by
Michael R. RahmVice President
Market & Economic AnalysisThe Mosaic Company
2006 Fertilizer and Technology Outlook ConferenceTampa, FloridaNovember 3, 2005
2
Forward- Looking StatementsCertain statements contained herein constitute “forward-looking statements” as that term is defined underthe Private Securities Litigation Reform Act of 1995. Although we believe the assumptions made inconnection with the forward-looking statements are reasonable, they do involve known and unknown risks,uncertainties and other factors that may cause the actual results, performance or achievements of The MosaicCompany, or industry results generally, to be materially different from those contemplated or projected,forecasted, estimated or budgeted (whether expressed or implied) by such statements. Factors affectingforward-looking statements may include, among others, the ability to successfully integrate the formeroperations of IMC and the Cargill fertilizer businesses; the ability to fully realize the expected cost savingsfrom the business combination between IMC and the Cargill fertilizer businesses within expected time frames;the ability to develop and execute comprehensive plans for asset optimization and/or rationalization; thefinancial resources of, and products available to, Mosaic’s competitors; the retention of existing, andcontinued attraction of additional, customers and key employees; changes in the outlook of the nitrogen,phosphate or potash markets; changes in the costs of raw materials or energy; the effect of any conditions orrestrictions imposed on or proposed with respect to Mosaic by regulators; the effect of legislative orregulatory changes in jurisdictions where Mosaic operates; the ability of Mosaic to obtain the regulatorypermits necessary for the continued operation of its businesses in a manner consistent with current practicesor anticipated expansions; contingencies related to environmental liability under U.S. federal and state andforeign environmental laws and regulations; adverse weather conditions affecting central Florida or the GulfCoast of the United States, including the impact of potential hurricanes or excess rainfall; the rating of TheMosaic Company’s and Mosaic Global Holding Inc.’s securities and the changes that may occur in the U.S.securities markets; and the factors described in our filings with the SEC, including our Quarterly Report onForm 10-Q for the fiscal quarter ended August 31, 2005.
This presentation may not be distributed, reproduced, or used without the express written consent of TheMosaic Company.
Safe Harbor Statement
3
1. Offshore Demand Fundamentals remain positive in India and Pakistan China becomes self-sufficient Only a modest recovery is expected in South America
2. Domestic Demand Old wives tales and misconceptions How inelastic is nutrient demand? How will high energy prices impact demand?
3. Supply Hurricanes and plant closures reduce U.S. supply DAP and MAP are not the whole story
Outline of Presentation
4
Offshore Demand
5
World Processed Phosphate Import Demand
Processed Phosphate Import Demand
0
3
6
9
12
15
18
21
24
90 91 92 93 94 95 96 97 98 99 00 01 02 03 04 05E 06F
MMT
Asia Europe L Amer Oceania Other
Source: Fertecon and Mosaic
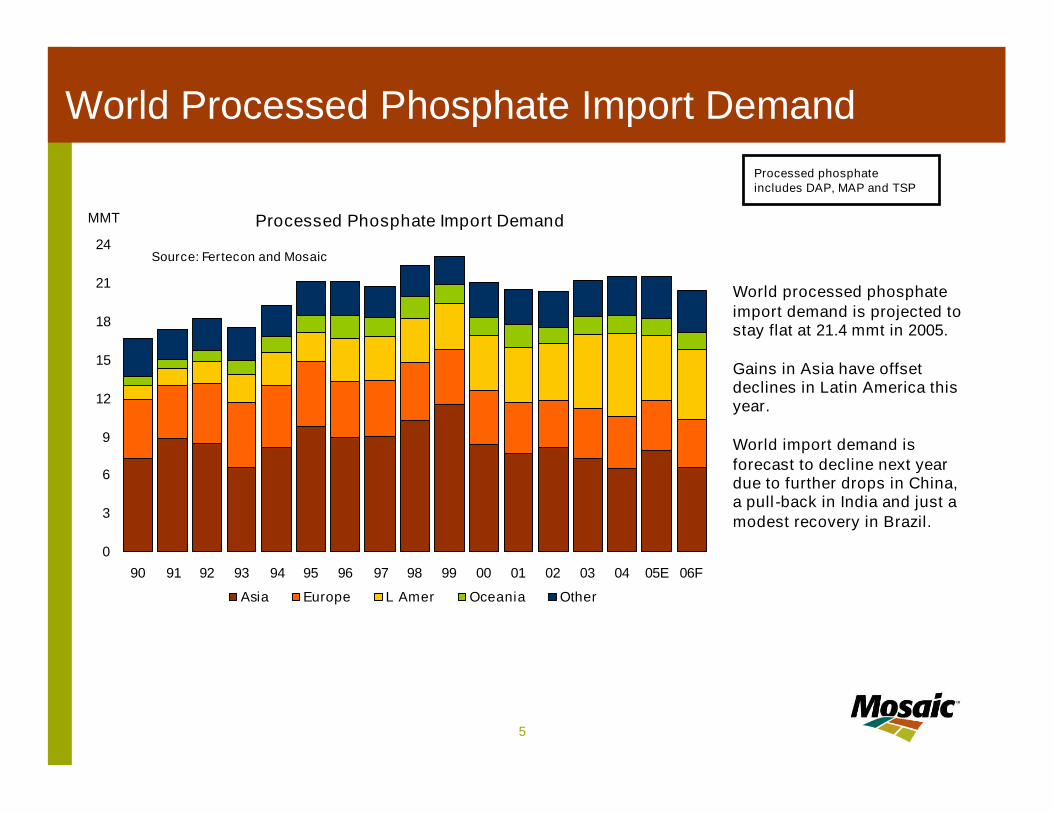
World processed phosphateimport demand is projected tostay flat at 21.4 mmt in 2005.
Gains in Asia have offsetdeclines in Latin America thisyear.
World import demand isforecast to decline next yeardue to further drops in China,a pull-back in India and just amodest recovery in Brazil.
Processed phosphateincludes DAP, MAP and TSP
6
Processed Phosphate Export Supply
0
3
6
9
12
15
18
21
24
90 91 92 93 94 95 96 97 98 99 00 01 02 03 04 05E 06F
MMT
USA Africa & Mideast FSU Other
Source: Fertecon and Mosaic
World Processed Phosphate Export Supply
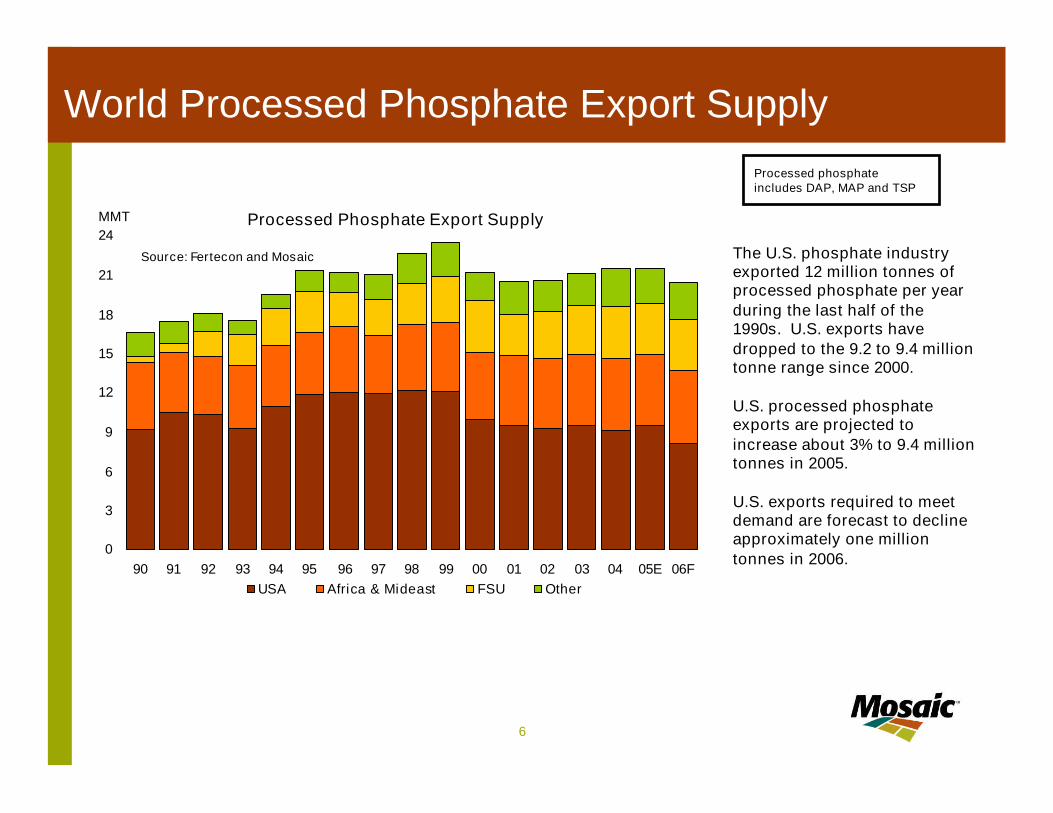
The U.S. phosphate industryexported 12 million tonnes ofprocessed phosphate per yearduring the last half of the1990s. U.S. exports havedropped to the 9.2 to 9.4 milliontonne range since 2000.
U.S. processed phosphateexports are projected toincrease about 3% to 9.4 milliontonnes in 2005.
U.S. exports required to meetdemand are forecast to declineapproximately one milliontonnes in 2006.
Processed phosphateincludes DAP, MAP and TSP
7
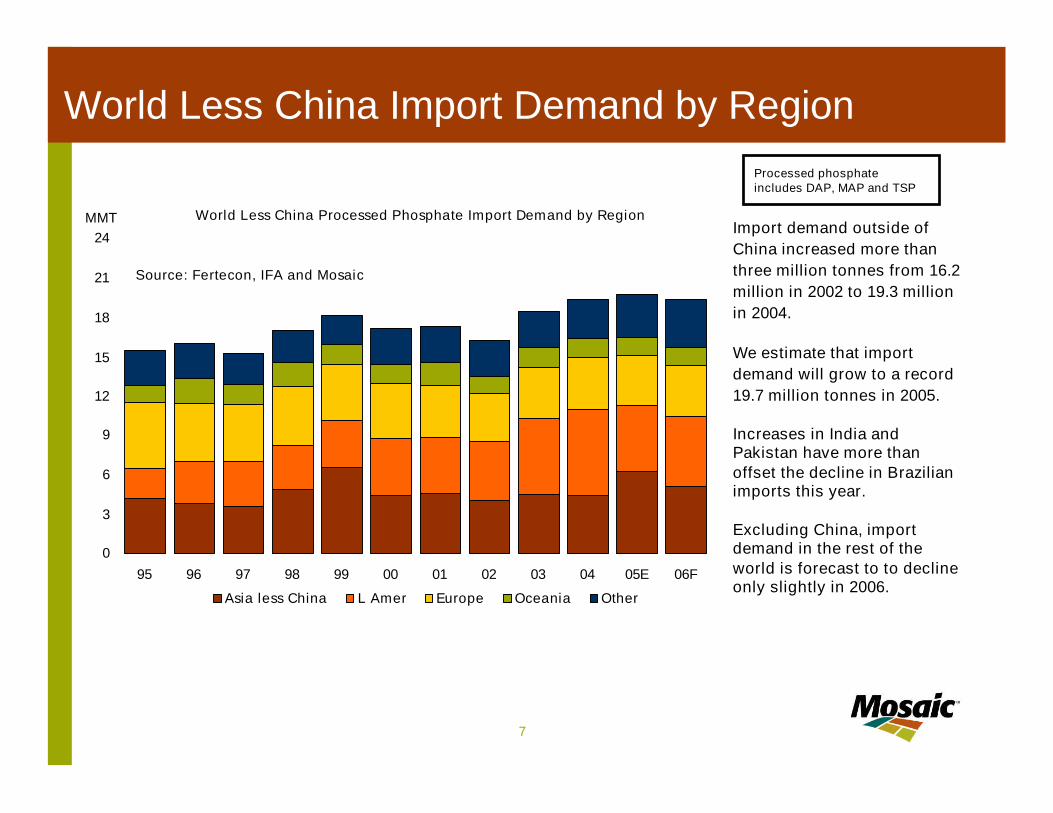
World Less China Import Demand by Region
World Less China Processed Phosphate Import Demand by Region
0
3
6
9
12
15
18
21
24
95 96 97 98 99 00 01 02 03 04 05E 06F
MMT
Asia less China L Amer Europe Oceania Other
Source: Fertecon, IFA and Mosaic
Import demand outside ofChina increased more thanthree million tonnes from 16.2million in 2002 to 19.3 millionin 2004.
We estimate that importdemand will grow to a record19.7 million tonnes in 2005.
Increases in India andPakistan have more thanoffset the decline in Brazilianimports this year.
Excluding China, importdemand in the rest of theworld is forecast to to declineonly slightly in 2006.
Processed phosphateincludes DAP, MAP and TSP
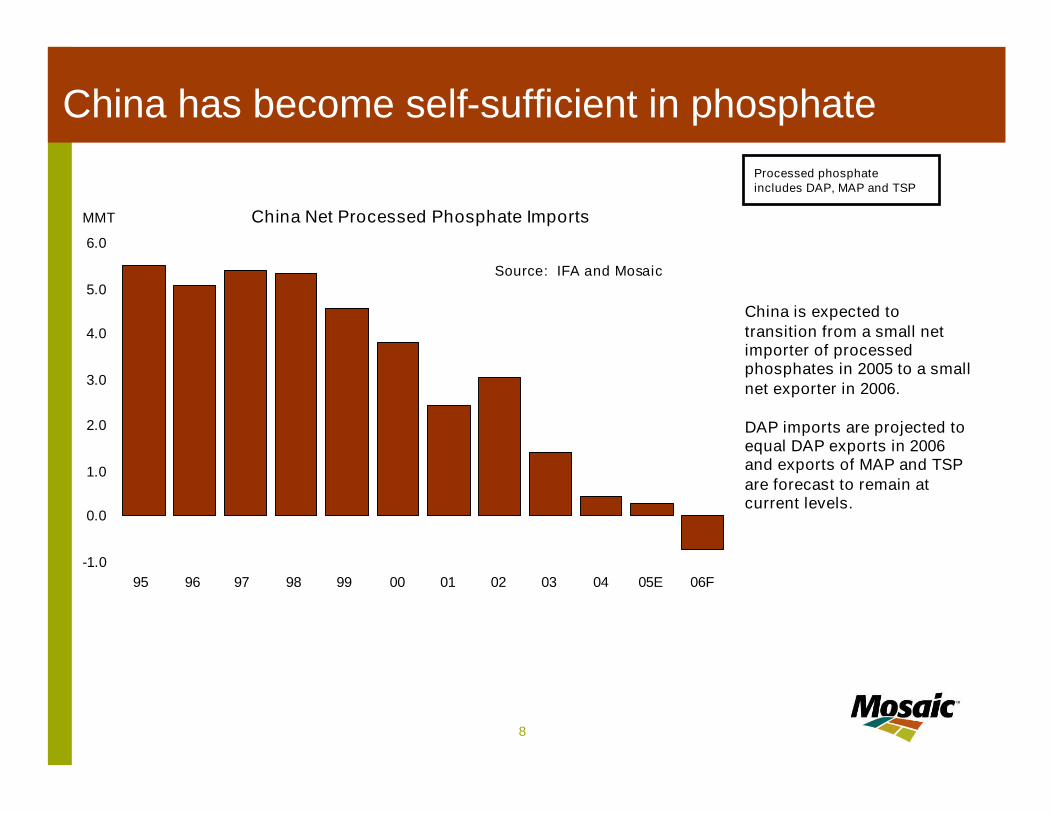
8
China Net Processed Phosphate Imports
-1.0
0.0
1.0
2.0
3.0
4.0
5.0
6.0
95 96 97 98 99 00 01 02 03 04 05E 06F
Source: IFA and Mosaic
MMT
China has become self-sufficient in phosphate
China is expected totransition from a small netimporter of processedphosphates in 2005 to a smallnet exporter in 2006.
DAP imports are projected toequal DAP exports in 2006and exports of MAP and TSPare forecast to remain atcurrent levels.
Processed phosphateincludes DAP, MAP and TSP
9
China’s Phosphate Strategy
At China Chemical Industry Prosperity Period Analysis Forum, official of NationalDevelopment and Reform Commission said, in the course of Chinese eleventh five-year plan,China chemical industry need to adjust industry design, material and drive structure; toconstruct a few megaton urea production bases in energy sources, grain and cottonproducing areas, phosphate compound fertilizer producing bases in Yunnan and Guizhou,potassium fertilizer producing bases in Qinghai and Xinjiang. The main goals are to supplynitrogenous fertilizer and phosphate fertilizer by ourselves, to raise the rate of potassiumfertilizer self-support and to greatly lower the costs of fertilizer producing.
China FertilizerBOABCOctober 27,2005
Anhui phosphate compound fertilizer plants have suspended operation recently on accountof raw material shortage. Thirteen phosphate plants have recently appealed to the centralgovernment for a macro-control of phosphorite resources to break regional restriction.Anhui needs 2.6 million MT phosphorite a year, 85% of which relies on inshipment.
China FertilizerBOABCOctober 27,2005
10
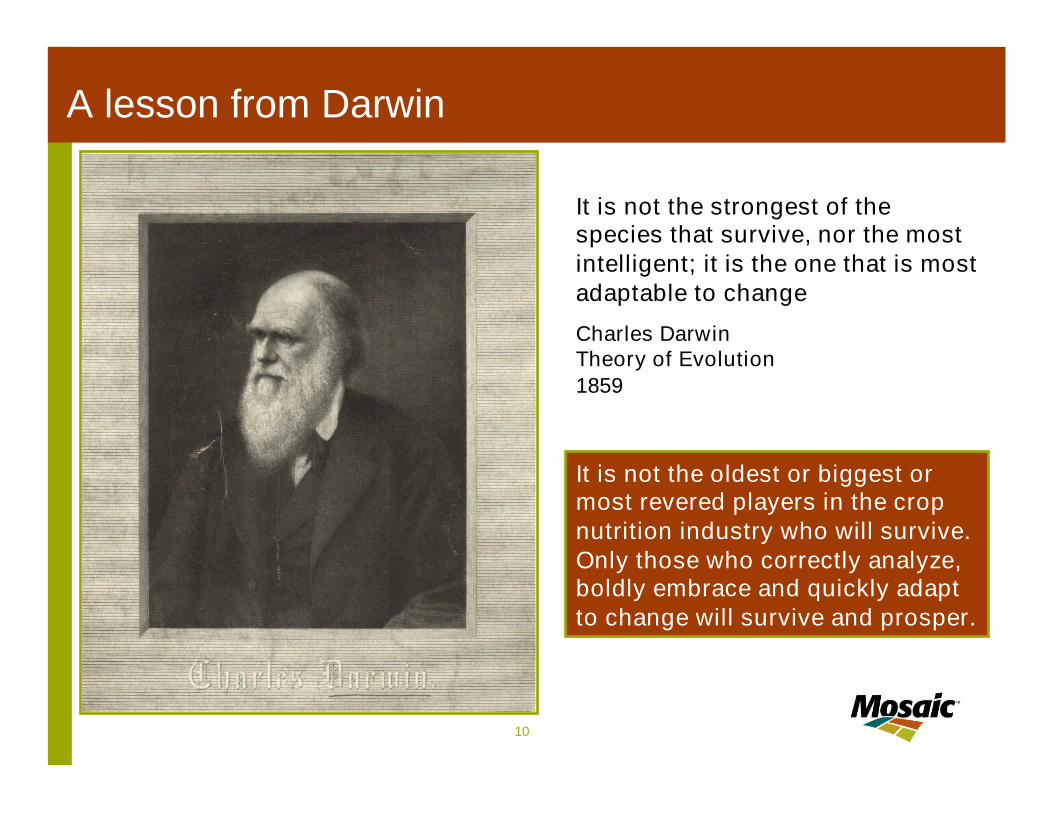
It is not the oldest or biggest ormost revered players in the cropnutrition industry who will survive.Only those who correctly analyze,boldly embrace and quickly adaptto change will survive and prosper.
A lesson from Darwin
It is not the strongest of thespecies that survive, nor the mostintelligent; it is the one that is mostadaptable to change
Charles DarwinTheory of Evolution1859
11
India and Pakistan Processed Phosphate Imports
0.0
0.5
1.0
1.5
2.0
2.5
3.0
3.5
4.0
4.5
95 96 97 98 99 00 01 02 03 04 05E 06F
Source: IFA and Mosaic
MMT
India Pakistan
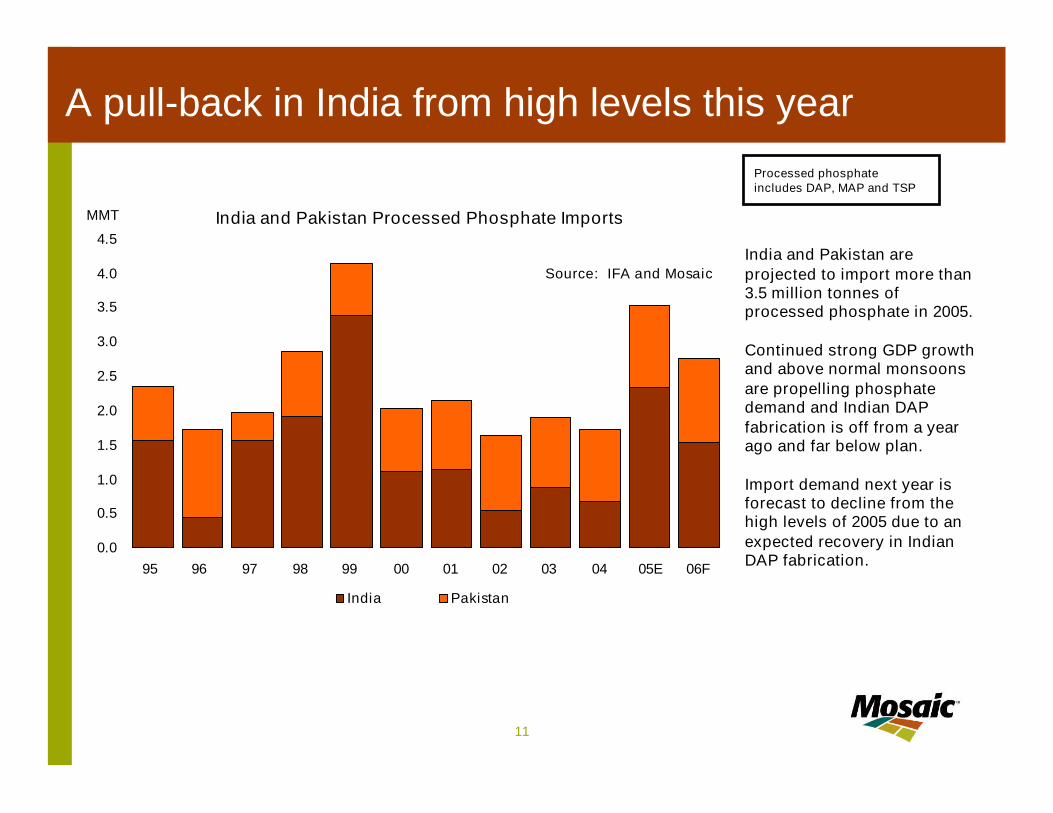
A pull-back in India from high levels this year
India and Pakistan areprojected to import more than3.5 million tonnes ofprocessed phosphate in 2005.
Continued strong GDP growthand above normal monsoonsare propelling phosphatedemand and Indian DAPfabrication is off from a yearago and far below plan.
Import demand next year isforecast to decline from thehigh levels of 2005 due to anexpected recovery in IndianDAP fabrication.
Processed phosphateincludes DAP, MAP and TSP
12
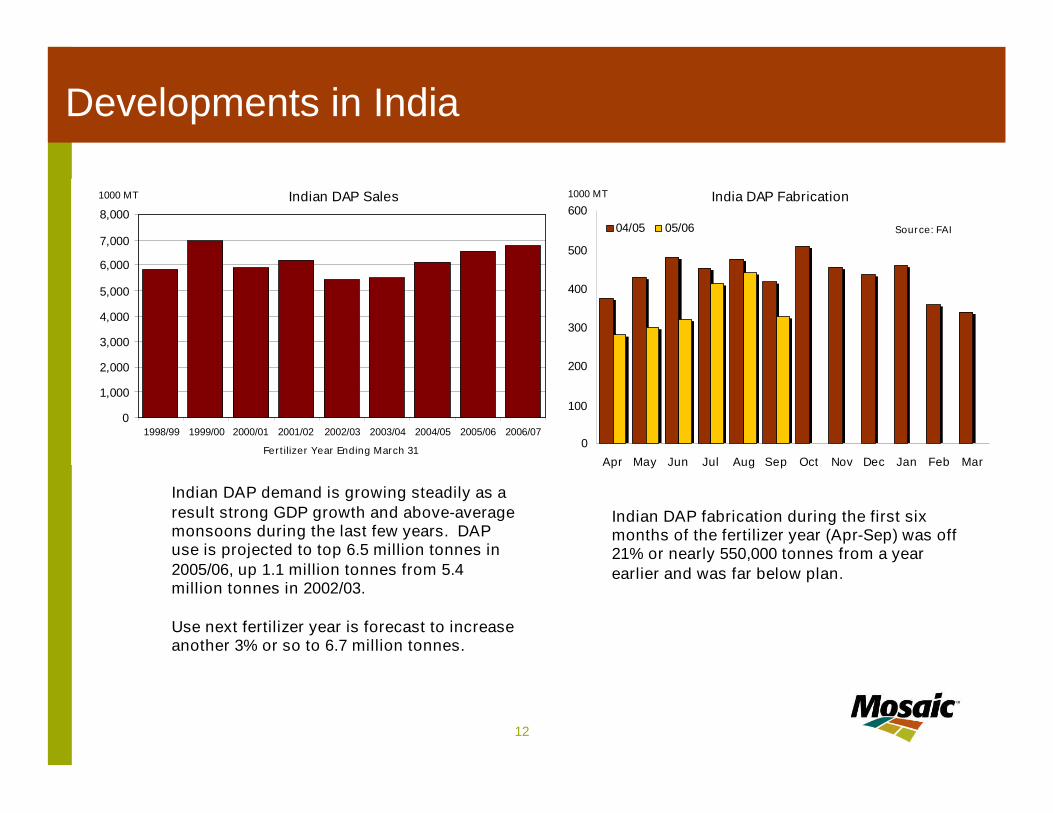
Developments in India
Indian DAP fabrication during the first sixmonths of the fertilizer year (Apr-Sep) was off21% or nearly 550,000 tonnes from a yearearlier and was far below plan.
India DAP Fabrication
0
100
200
300
400
500
600
Apr May Jun Jul Aug Sep Oct Nov Dec Jan Feb Mar
1000 MT
04/05 05/06 Source: FAI
Indian DAP Sales
0
1,000
2,000
3,000
4,000
5,000
6,000
7,000
8,000
1998/99 1999/00 2000/01 2001/02 2002/03 2003/04 2004/05 2005/06 2006/07
Fertilizer Year Ending March 31
1000 MT
Indian DAP demand is growing steadily as aresult strong GDP growth and above-averagemonsoons during the last few years. DAPuse is projected to top 6.5 million tonnes in2005/06, up 1.1 million tonnes from 5.4million tonnes in 2002/03.
Use next fertilizer year is forecast to increaseanother 3% or so to 6.7 million tonnes.
13
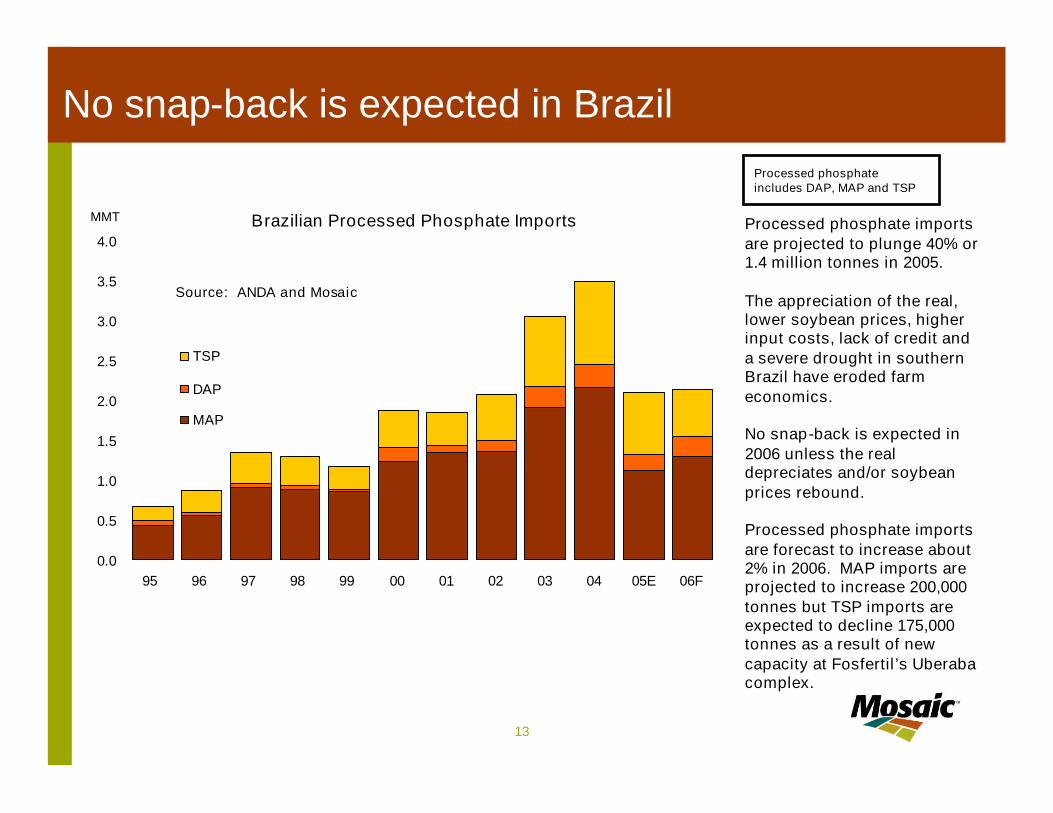
No snap-back is expected in Brazil
Brazilian Processed Phosphate Imports
0.0
0.5
1.0
1.5
2.0
2.5
3.0
3.5
4.0
95 96 97 98 99 00 01 02 03 04 05E 06F
Source: ANDA and Mosaic
MMT
TSP
DAP
MAP
Processed phosphate importsare projected to plunge 40% or1.4 million tonnes in 2005.
The appreciation of the real,lower soybean prices, higherinput costs, lack of credit anda severe drought in southernBrazil have eroded farmeconomics.
No snap-back is expected in2006 unless the realdepreciates and/or soybeanprices rebound.
Processed phosphate importsare forecast to increase about2% in 2006. MAP imports areprojected to increase 200,000tonnes but TSP imports areexpected to decline 175,000tonnes as a result of newcapacity at Fosfertil’s Uberabacomplex.
Processed phosphateincludes DAP, MAP and TSP
14
Brazil Fertilizer Shipments
0
500
1000
1500
2000
2500
3000
3500
Jan Feb Mar Apr May Jun Jul Aug Sep Oct Nov Dec
1000 MT
2004 2005
Source: ANDA
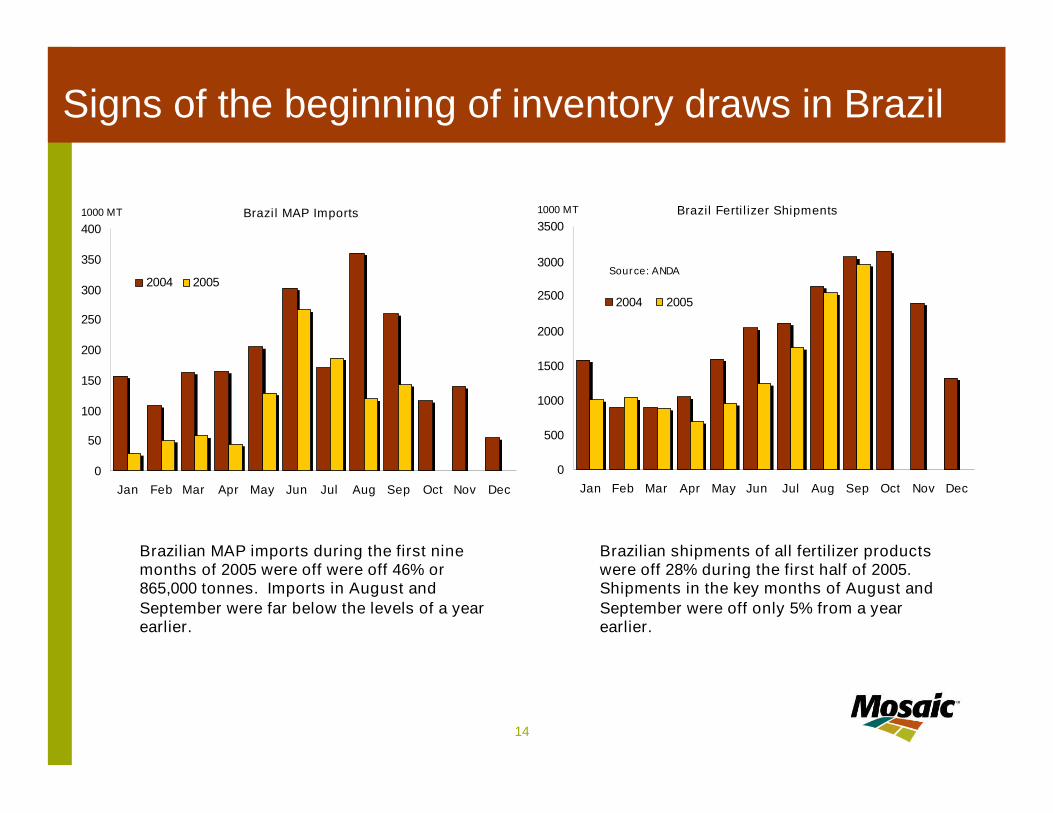
Signs of the beginning of inventory draws in Brazil
Brazil MAP Imports
0
50
100
150
200
250
300
350
400
Jan Feb Mar Apr May Jun Jul Aug Sep Oct Nov Dec
1000 MT
2004 2005
Brazilian shipments of all fertilizer productswere off 28% during the first half of 2005.Shipments in the key months of August andSeptember were off only 5% from a yearearlier.
Brazilian MAP imports during the first ninemonths of 2005 were off were off 46% or865,000 tonnes. Imports in August andSeptember were far below the levels of a yearearlier.
15
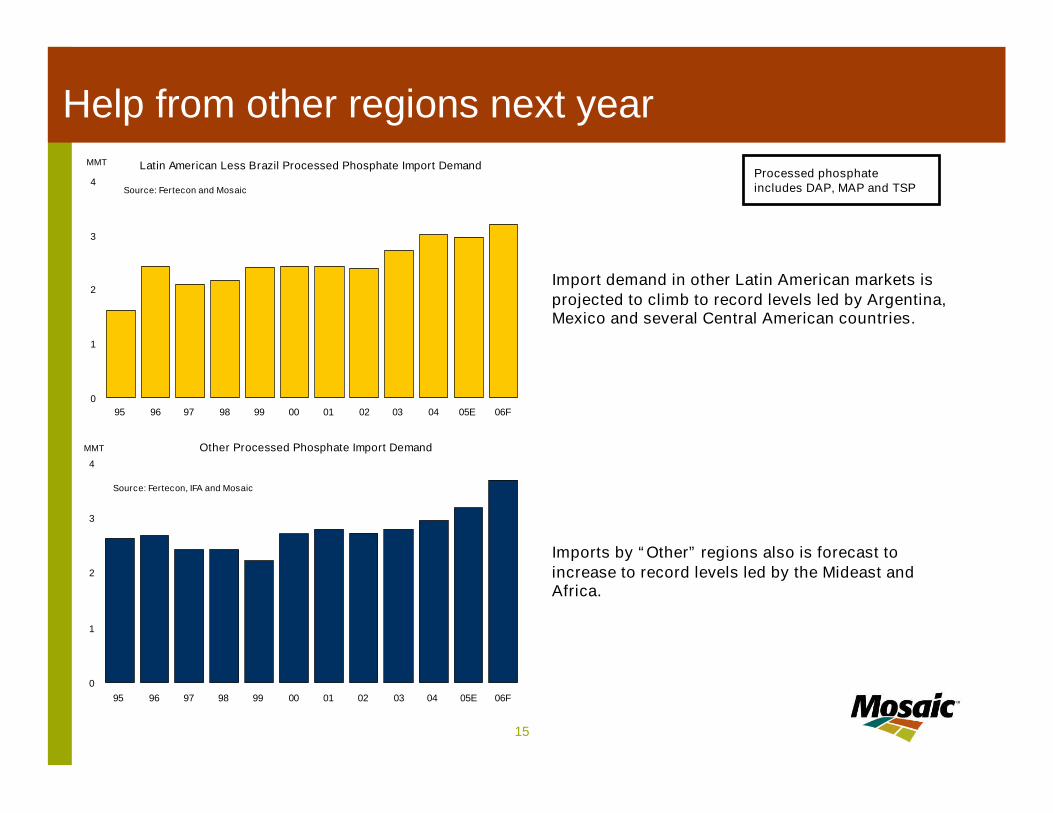
Help from other regions next year
Imports by “Other” regions also is forecast toincrease to record levels led by the Mideast andAfrica.
Latin American Less Brazil Processed Phosphate Import Demand
0
1
2
3
4
95 96 97 98 99 00 01 02 03 04 05E 06F
MMT
Source: Fertecon and Mosaic
Other Processed Phosphate Import Demand
0
1
2
3
4
95 96 97 98 99 00 01 02 03 04 05E 06F
MMT
Source: Fertecon, IFA and Mosaic
Import demand in other Latin American markets isprojected to climb to record levels led by Argentina,Mexico and several Central American countries.
Processed phosphateincludes DAP, MAP and TSP
16
Domestic Demand
17
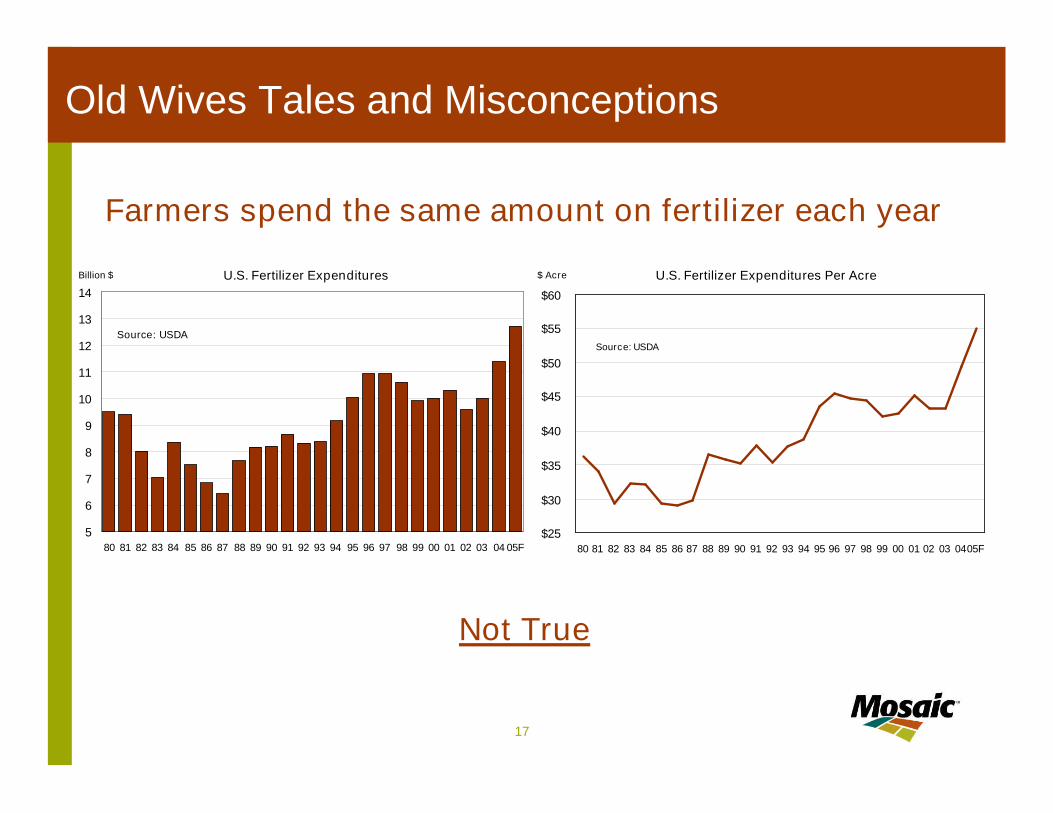
Old Wives Tales and Misconceptions
Not True
U.S. Fertilizer Expenditures
5
6
7
8
9
10
11
12
13
14
80 81 82 83 84 85 86 87 88 89 90 91 92 93 94 95 96 97 98 99 00 01 02 03 04 05F
Billion $
Source: USDA
U.S. Fertilizer Expenditures Per Acre
$25
$30
$35
$40
$45
$50
$55
$60
80 81 82 83 84 85 86 87 88 89 90 91 92 93 94 95 96 97 98 99 00 01 02 03 0405F
$ Acre
Source: USDA
Farmers spend the same amount on fertilizer each year
18
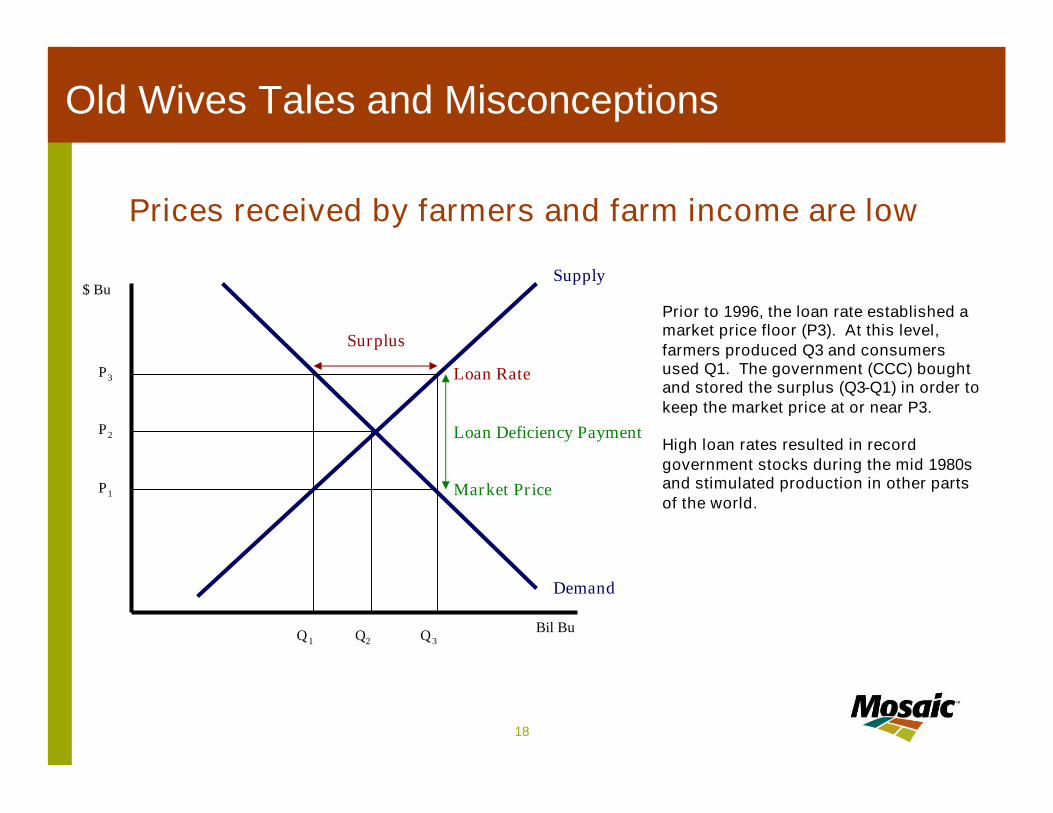
Old Wives Tales and Misconceptions
Prices received by farmers and farm income are low
Q3
Demand
Bil Bu
Surplus
$ Bu
P3
P2
P1
Q1 Q2
Supply
Loan Deficiency Payment
Loan Rate
Market Price
Prior to 1996, the loan rate established amarket price floor (P3). At this level,farmers produced Q3 and consumersused Q1. The government (CCC) boughtand stored the surplus (Q3-Q1) in order tokeep the market price at or near P3.
High loan rates resulted in recordgovernment stocks during the mid 1980sand stimulated production in other partsof the world.
19
Old Wives Tales and Misconceptions
Prices received by farmers and farm income are low
Q3
Demand
Bil Bu
Surplus
$ Bu
P3
P2
P1
Q1 Q2
Supply
Loan Deficiency Payment
Loan Rate
Market Price
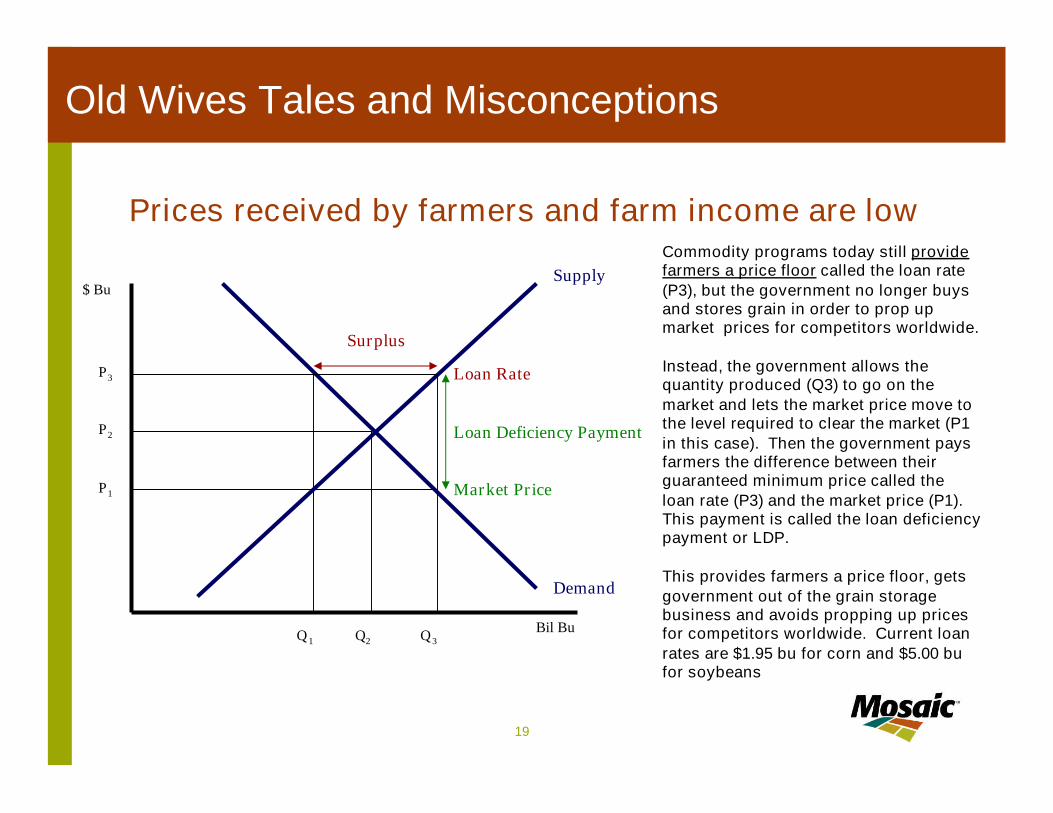
Commodity programs today still providefarmers a price floor called the loan rate(P3), but the government no longer buysand stores grain in order to prop upmarket prices for competitors worldwide.
Instead, the government allows thequantity produced (Q3) to go on themarket and lets the market price move tothe level required to clear the market (P1in this case). Then the government paysfarmers the difference between theirguaranteed minimum price called theloan rate (P3) and the market price (P1).This payment is called the loan deficiencypayment or LDP.
This provides farmers a price floor, getsgovernment out of the grain storagebusiness and avoids propping up pricesfor competitors worldwide. Current loanrates are $1.95 bu for corn and $5.00 bufor soybeans
20
Old Wives Tales and Misconceptions
Prices received by farmers and farm income are low
U.S. Net Cash Farm Income
0
10
20
30
40
50
60
70
80
90
80 81 82 83 84 85 86 87 88 89 90 91 92 93 94 95 96 97 98 99 00 01 02 03 0405F
Bil $
Market Gov Payments
Source: USDA
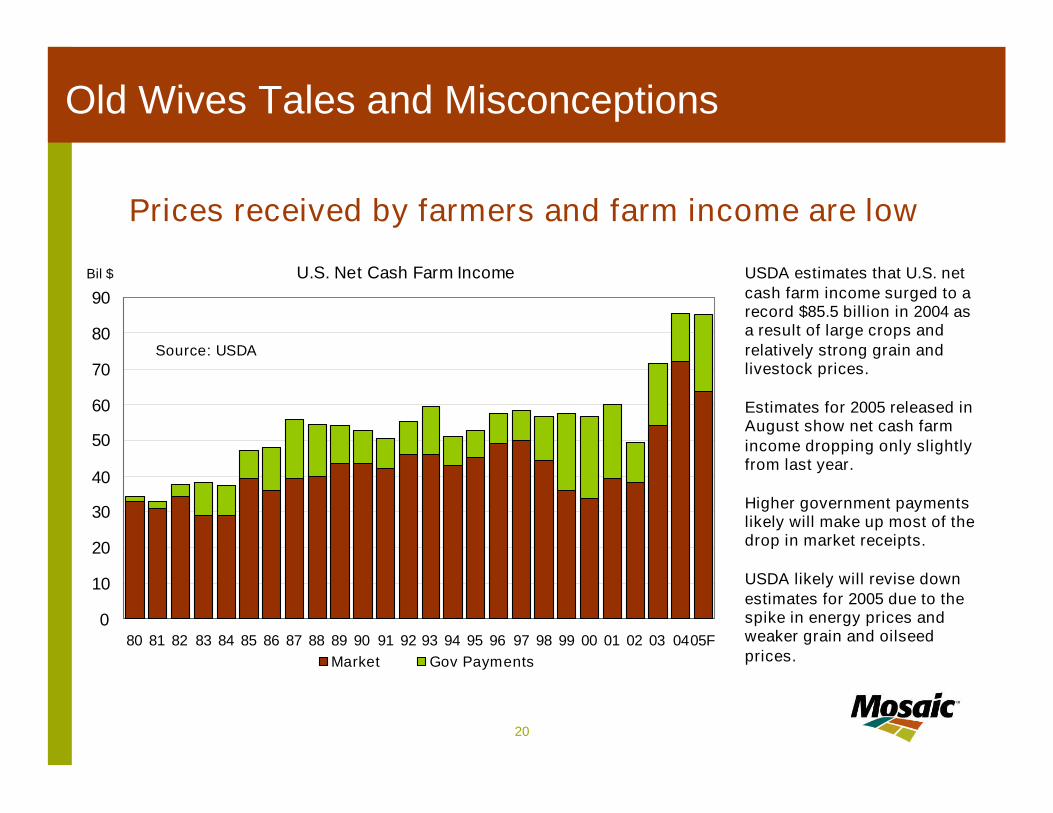
USDA estimates that U.S. netcash farm income surged to arecord $85.5 billion in 2004 asa result of large crops andrelatively strong grain andlivestock prices.
Estimates for 2005 released inAugust show net cash farmincome dropping only slightlyfrom last year.
Higher government paymentslikely will make up most of thedrop in market receipts.
USDA likely will revise downestimates for 2005 due to thespike in energy prices andweaker grain and oilseedprices.
21
How inelastic is nutrient demand?
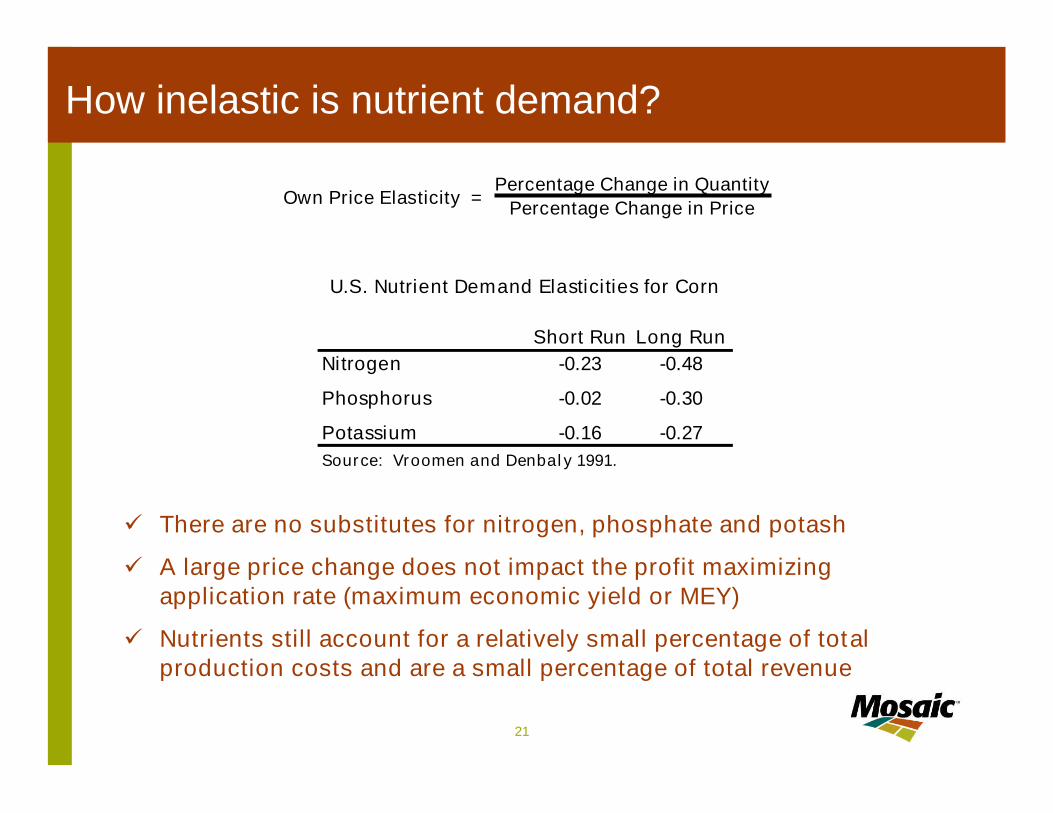
U.S. Nutrient Demand Elasticities for Corn
Short Run Long RunNitrogen -0.23 -0.48
Phosphorus -0.02 -0.30
Potassium -0.16 -0.27Source: Vroomen and Denbaly 1991.
Percentage Change in PriceOwn Price Elasticity =Percentage Change in Quantity
There are no substitutes for nitrogen, phosphate and potash
A large price change does not impact the profit maximizingapplication rate (maximum economic yield or MEY)
Nutrients still account for a relatively small percentage of totalproduction costs and are a small percentage of total revenue
22
Moderate declines in P application rates on cornU.S. Phosphate Application Rates
1988-92 Average = 100
80
85
90
95
100
105
110
90 91 92 93 94 95 96 97 98 99 00 01 02 03 04 05E 06F
Source: USDA and CBOT
Percent
1.80
2.10
2.40
2.70
3.00
3.30
3.60
$ BU
On Corn New Crop Corn Price (AMJ Average)
Corn Prices vs. Phosphate Application Rates on Corn
y = 5.3256x + 33.602R2 = 0.4571
43
44
45
46
47
48
49
50
51
52
53
2.00 2.20 2.40 2.60 2.80 3.00 3.20 3.40
New Crop Corn Prices - AMJ Average ($ Bu)
Ap
plic
atio
nR
ate
(lbs
Ac
re)
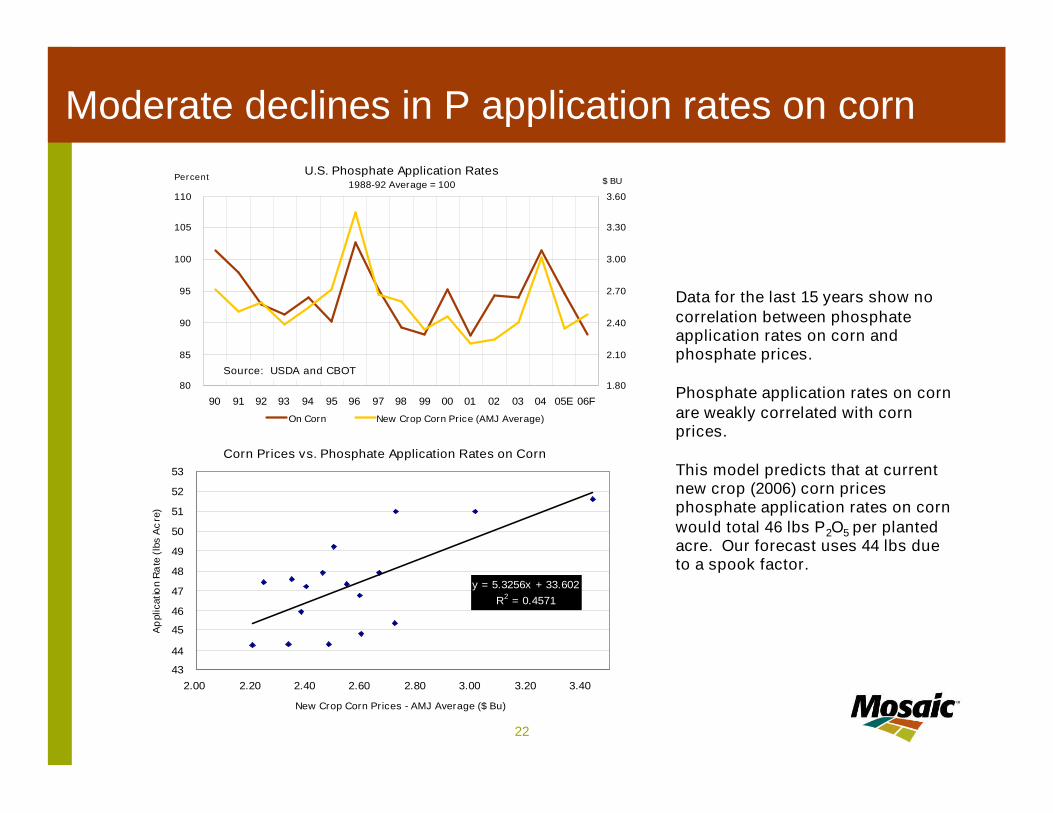
Data for the last 15 years show nocorrelation between phosphateapplication rates on corn andphosphate prices.
Phosphate application rates on cornare weakly correlated with cornprices.
This model predicts that at currentnew crop (2006) corn pricesphosphate application rates on cornwould total 46 lbs P2O5 per plantedacre. Our forecast uses 44 lbs dueto a spook factor.
23
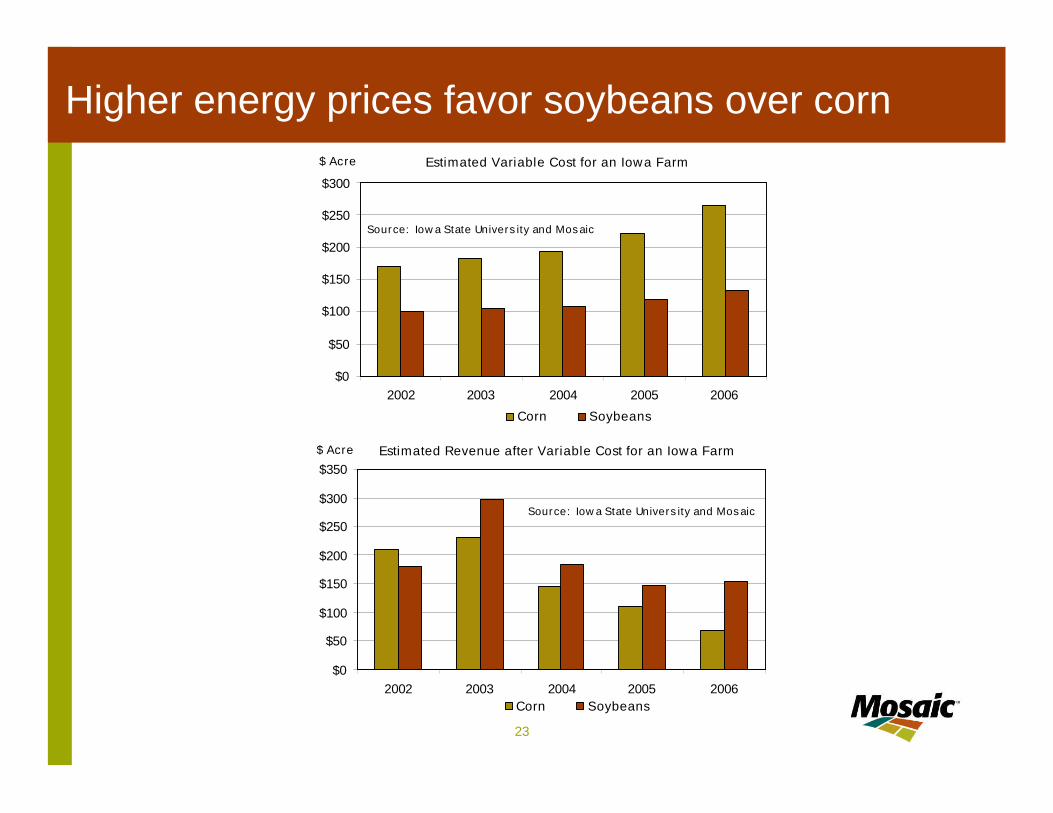
Higher energy prices favor soybeans over cornEstimated Variable Cost for an Iowa Farm
$0
$50
$100
$150
$200
$250
$300
2002 2003 2004 2005 2006
Source: Iowa State University and Mosaic
$ Acre
Corn Soybeans
Estimated Revenue after Variable Cost for an Iowa Farm
$0
$50
$100
$150
$200
$250
$300
$350
2002 2003 2004 2005 2006
Source: Iowa State University and Mosaic
$ Acre
Corn Soybeans
24
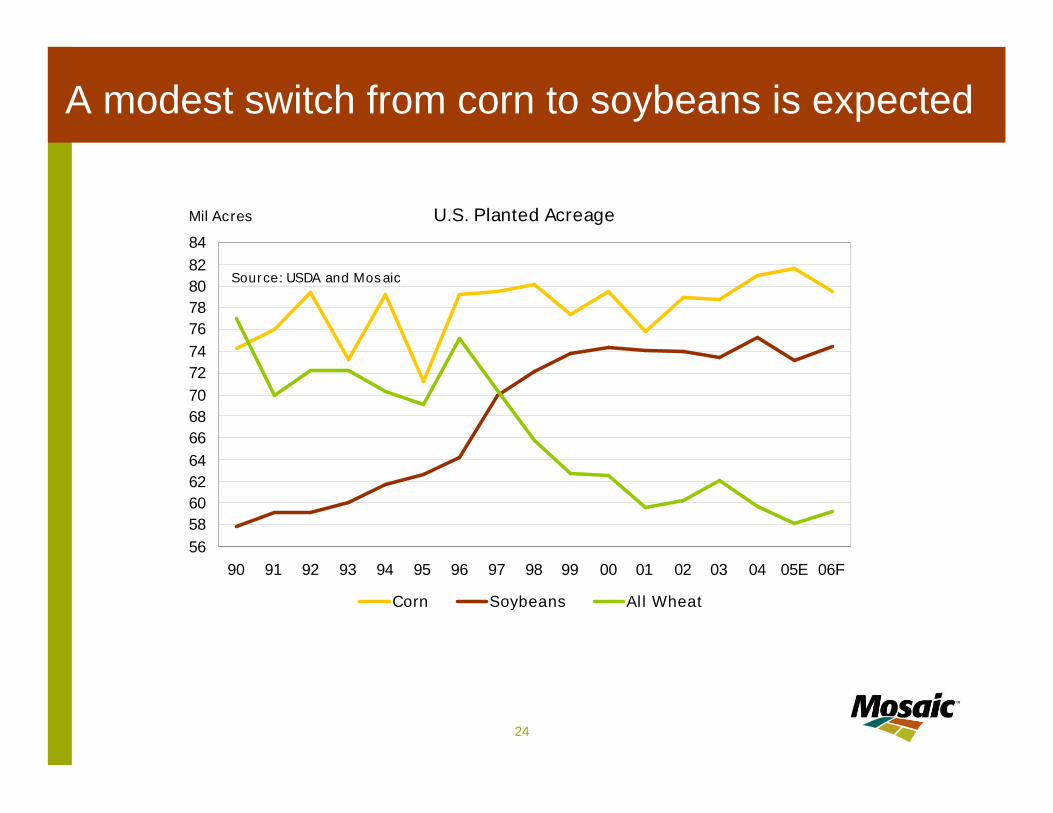
A modest switch from corn to soybeans is expected
U.S. Planted Acreage
565860626466687072747678808284
90 91 92 93 94 95 96 97 98 99 00 01 02 03 04 05E 06F
Mil Acres
Corn Soybeans All Wheat
Source: USDA and Mosaic
25
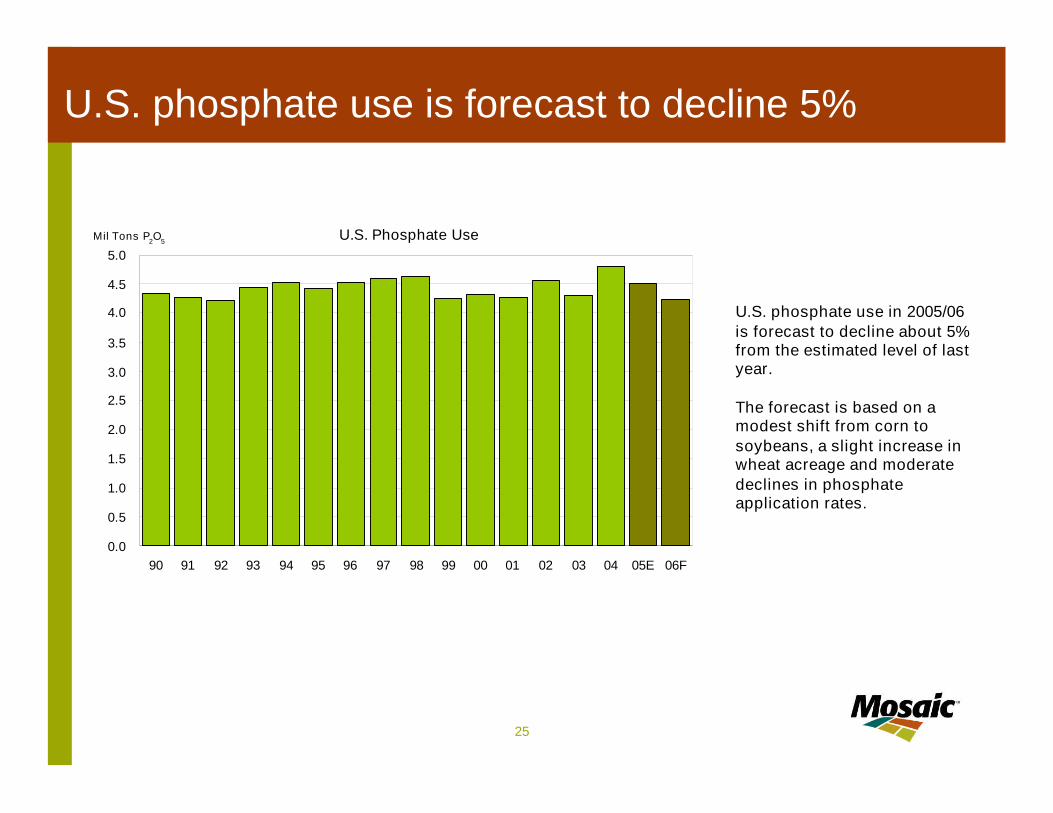
U.S. phosphate use is forecast to decline 5%
U.S. Phosphate Use
0.0
0.5
1.0
1.5
2.0
2.5
3.0
3.5
4.0
4.5
5.0
90 91 92 93 94 95 96 97 98 99 00 01 02 03 04 05E 06F
Mil Tons P2O5
U.S. phosphate use in 2005/06is forecast to decline about 5%from the estimated level of lastyear.
The forecast is based on amodest shift from corn tosoybeans, a slight increase inwheat acreage and moderatedeclines in phosphateapplication rates.
26
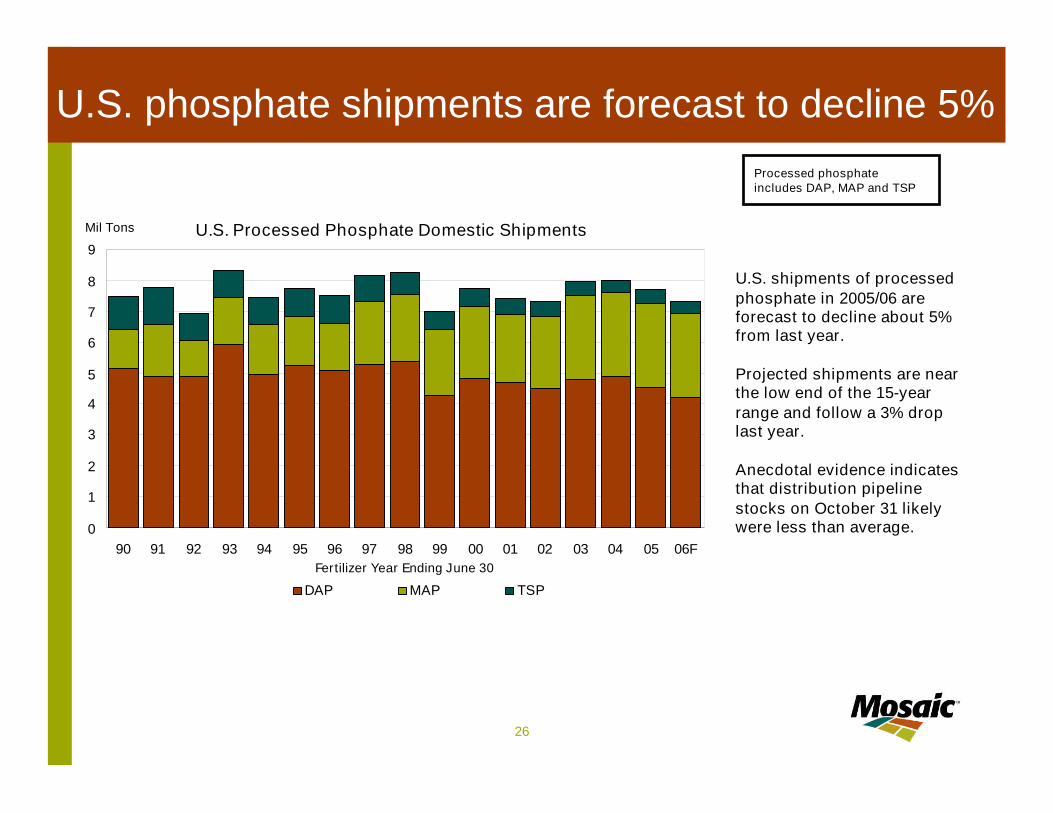
U.S. Processed Phosphate Domestic Shipments
0
1
2
3
4
5
6
7
8
9
90 91 92 93 94 95 96 97 98 99 00 01 02 03 04 05 06FFertilizer Year Ending June 30
Mil Tons
DAP MAP TSP
U.S. phosphate shipments are forecast to decline 5%
U.S. shipments of processedphosphate in 2005/06 areforecast to decline about 5%from last year.
Projected shipments are nearthe low end of the 15-yearrange and follow a 3% droplast year.
Anecdotal evidence indicatesthat distribution pipelinestocks on October 31 likelywere less than average.
Processed phosphateincludes DAP, MAP and TSP
27
U.S. DAP and MAP Domestic Shipments
0
200
400
600
800
1000
1200
1400
JUL AUG SEP OCT NOV DEC JAN FEB MAR APR MAY JUN
1000
ST
MIN MAX Range (1994/95-2003/04) 04/05 Actual 3-Yr Avg
Source: TFI and Mosaic
U.S. DAP and MAP Domestic Shipments
0
200
400
600
800
1000
1200
1400
JUL AUG SEP OCT NOV DEC JAN FEB MAR APR MAY JUN
1000
ST
MIN MAX Range (1995/96-2004/05) 05/06 Actual/Forecast 3-Yr Avg
Source: TFI and Mosaic
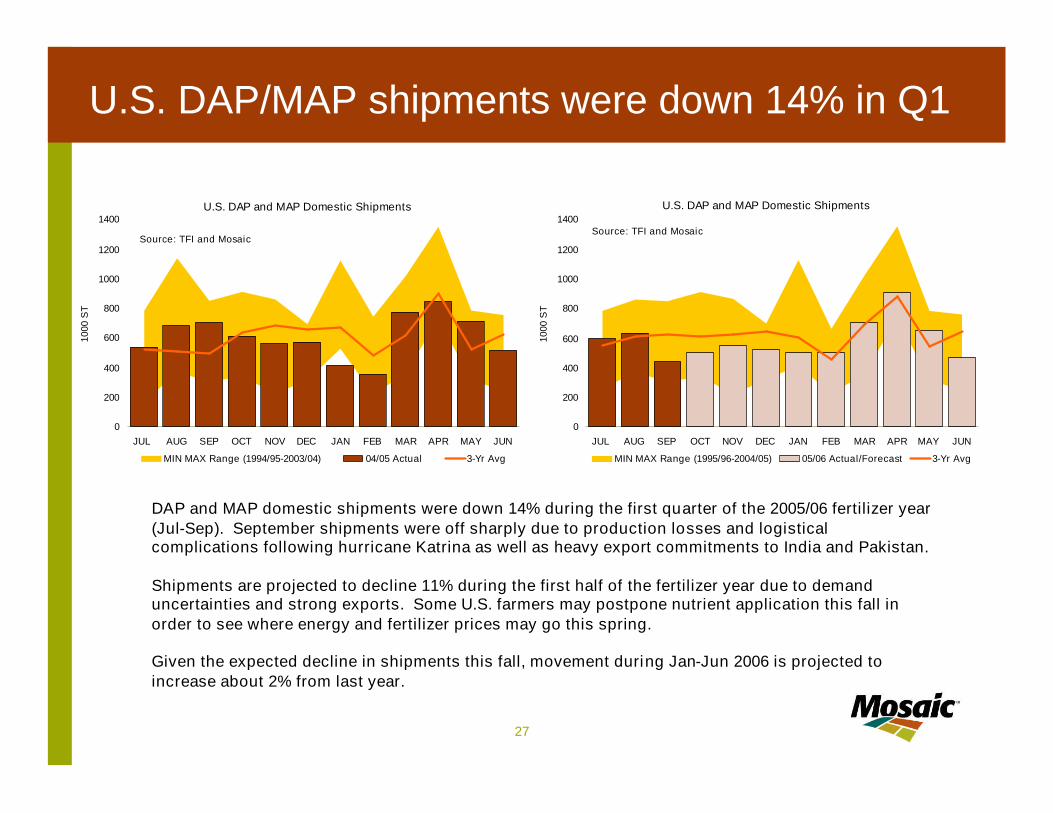
U.S. DAP/MAP shipments were down 14% in Q1
DAP and MAP domestic shipments were down 14% during the first quarter of the 2005/06 fertilizer year(Jul-Sep). September shipments were off sharply due to production losses and logisticalcomplications following hurricane Katrina as well as heavy export commitments to India and Pakistan.
Shipments are projected to decline 11% during the first half of the fertilizer year due to demanduncertainties and strong exports. Some U.S. farmers may postpone nutrient application this fall inorder to see where energy and fertilizer prices may go this spring.
Given the expected decline in shipments this fall, movement during Jan-Jun 2006 is projected toincrease about 2% from last year.
28
Supply
29
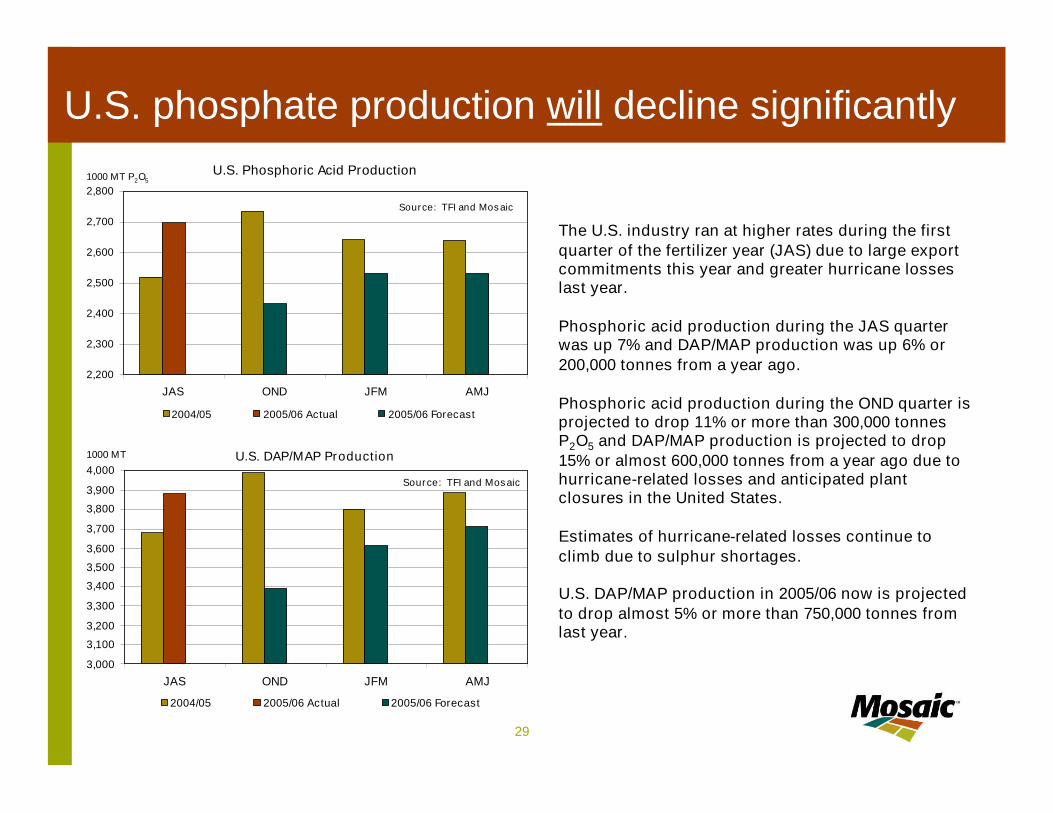
U.S. phosphate production will decline significantlyU.S. Phosphoric Acid Production
2,200
2,300
2,400
2,500
2,600
2,700
2,800
JAS OND JFM AMJ
Source: TFI and Mosaic
1000 MT P2O5
2004/05 2005/06 Actual 2005/06 Forecast
U.S. DAP/MAP Production
3,000
3,100
3,200
3,300
3,400
3,500
3,600
3,700
3,800
3,900
4,000
JAS OND JFM AMJ
Source: TFI and Mosaic
1000 MT
2004/05 2005/06 Actual 2005/06 Forecast
The U.S. industry ran at higher rates during the firstquarter of the fertilizer year (JAS) due to large exportcommitments this year and greater hurricane losseslast year.
Phosphoric acid production during the JAS quarterwas up 7% and DAP/MAP production was up 6% or200,000 tonnes from a year ago.
Phosphoric acid production during the OND quarter isprojected to drop 11% or more than 300,000 tonnesP2O5 and DAP/MAP production is projected to drop15% or almost 600,000 tonnes from a year ago due tohurricane-related losses and anticipated plantclosures in the United States.
Estimates of hurricane-related losses continue toclimb due to sulphur shortages.
U.S. DAP/MAP production in 2005/06 now is projectedto drop almost 5% or more than 750,000 tonnes fromlast year.
30
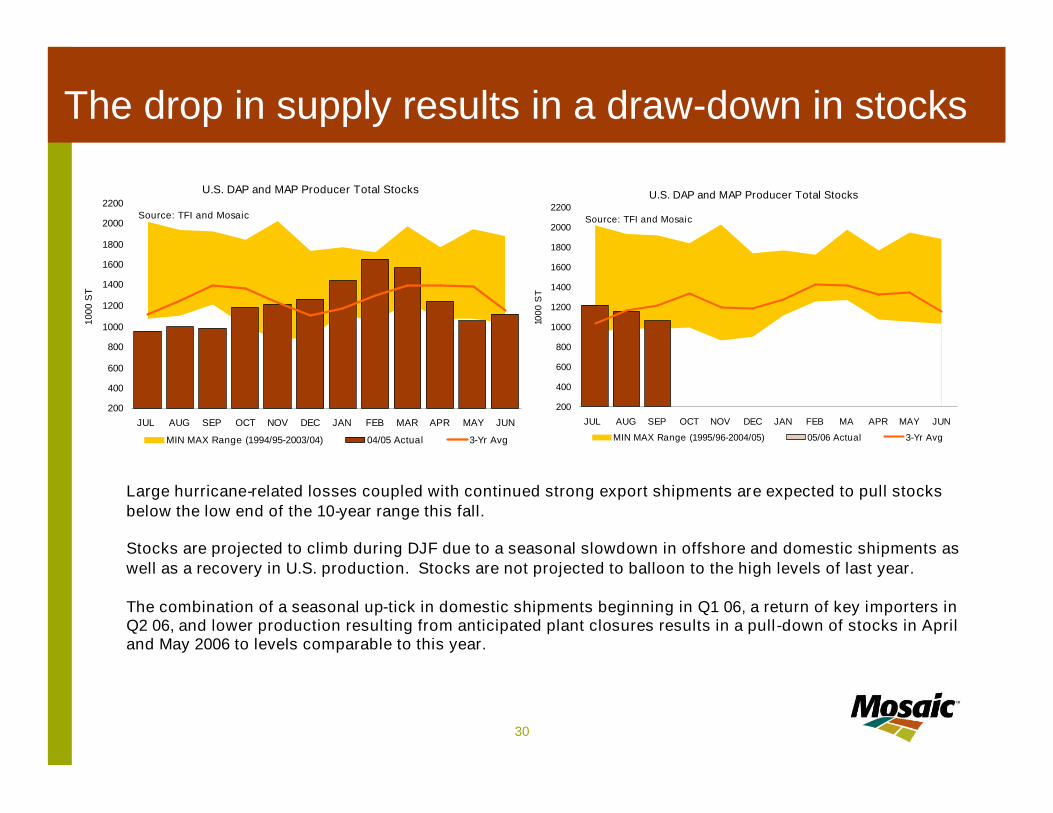
Large hurricane-related losses coupled with continued strong export shipments are expected to pull stocksbelow the low end of the 10-year range this fall.
Stocks are projected to climb during DJF due to a seasonal slowdown in offshore and domestic shipments aswell as a recovery in U.S. production. Stocks are not projected to balloon to the high levels of last year.
The combination of a seasonal up-tick in domestic shipments beginning in Q1 06, a return of key importers inQ2 06, and lower production resulting from anticipated plant closures results in a pull-down of stocks in Apriland May 2006 to levels comparable to this year.
The drop in supply results in a draw-down in stocks
U.S. DAP and MAP Producer Total Stocks
200
400
600
800
1000
1200
1400
1600
1800
2000
2200
JUL AUG SEP OCT NOV DEC JAN FEB MAR APR MAY JUN
1000
ST
MIN MAX Range (1994/95-2003/04) 04/05 Actual 3-Yr Avg
Source: TFI and Mosaic
U.S. DAP and MAP Producer Total Stocks
200
400
600
800
1000
1200
1400
1600
1800
2000
2200
JUL AUG SEP OCT NOV DEC JAN FEB MA APR MAY JUN
1000
ST
MIN MAX Range (1995/96-2004/05) 05/06 Actual 3-Yr Avg
Source: TFI and Mosaic
31
DAP and MAP are not the whole story
U.S. Phosphoric Acid Production and Operating Rate
4
5
6
7
8
9
10
11
12
13
95 96 97 98 99 00 01 02 03 04 05 06FFertilizer Year Ending June 30
MMT P2O5
55%
60%
65%
70%
75%
80%
85%
90%
95%
100%
For DAP/MAP/TSP For Other Capacity Operating Rate
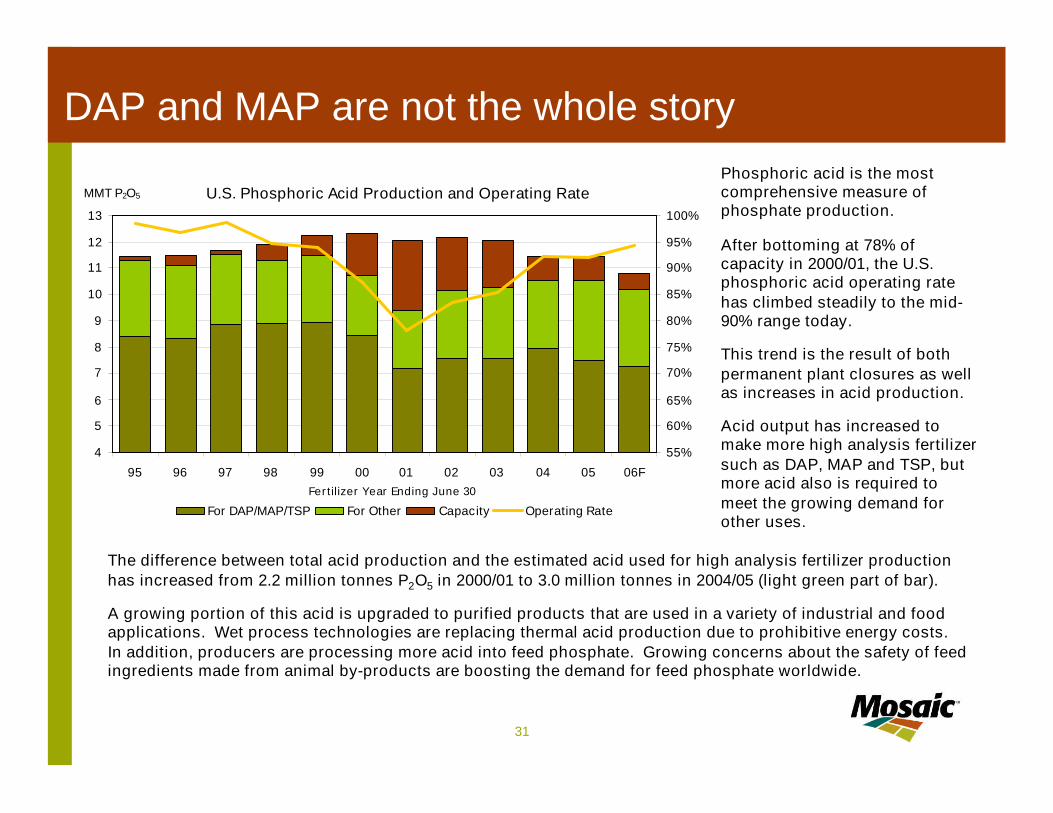
The difference between total acid production and the estimated acid used for high analysis fertilizer productionhas increased from 2.2 million tonnes P2O5 in 2000/01 to 3.0 million tonnes in 2004/05 (light green part of bar).
A growing portion of this acid is upgraded to purified products that are used in a variety of industrial and foodapplications. Wet process technologies are replacing thermal acid production due to prohibitive energy costs.In addition, producers are processing more acid into feed phosphate. Growing concerns about the safety of feedingredients made from animal by-products are boosting the demand for feed phosphate worldwide.
Phosphoric acid is the mostcomprehensive measure ofphosphate production.
After bottoming at 78% ofcapacity in 2000/01, the U.S.phosphoric acid operating ratehas climbed steadily to the mid-90% range today.
This trend is the result of bothpermanent plant closures as wellas increases in acid production.
Acid output has increased tomake more high analysis fertilizersuch as DAP, MAP and TSP, butmore acid also is required tomeet the growing demand forother uses.
32
The Phosphate Outlook
by
Michael R. RahmVice President
Market & Economic AnalysisThe Mosaic Company
2006 Fertilizer and Technology Outlook ConferenceTampa, FloridaNovember 3, 2005
Thank You!