Embed Size (px)
Citation preview
Andrew Cote
PotashCorp.com
Sales Manager, South Region
World Fertilizer Outlook
Forward-Looking Statements
The following presentation contains forward-looking statements. These statements are based on certain factors
and assumptions including foreign exchange rates, expected growth, results of operations, performance,
business prospects and opportunities and effective income tax rates. While the company considers these
factors and assumptions to be reasonable based on information currently available, they may prove to be
incorrect. A number of factors could cause actual results to differ materially from those in the forward-looking
statements, including, but not limited to: fluctuations in supply and demand in fertilizer, sulfur, transportation
and petrochemical markets; changes in competitive pressures, including pricing pressures; timing and amount
of capital expenditures; risks associated with natural gas and other hedging activities; changes in capital
markets and corresponding effects on the company’s investments; changes in currency and exchange rates;
unexpected geological or environmental conditions, including water inflow; strikes and other forms of work
stoppage or slowdowns including the possibility of work stoppages at our Allan, Cory and Patience Lake
facilities; changes in and the effects of, government policy and regulations; and earnings, exchange rates and
the decisions of taxing authorities, all of which could affect our effective tax rates. Additional risks and
uncertainties can be found in our Form 10-K for the fiscal year ended December 31, 2007 under captions
“Forward-Looking Statements” and “Item 1A – Risk Factors” and in our filings with the US Securities and
Exchange Commission and Canadian provincial securities commissions. Forward-looking statements are given
only as at the date of this presentation and the company disclaims any obligation to update or revise the
forward-looking statements, whether as a result of new information, future events or otherwise, except as
required by law.
Fertilizer Demand Drivers
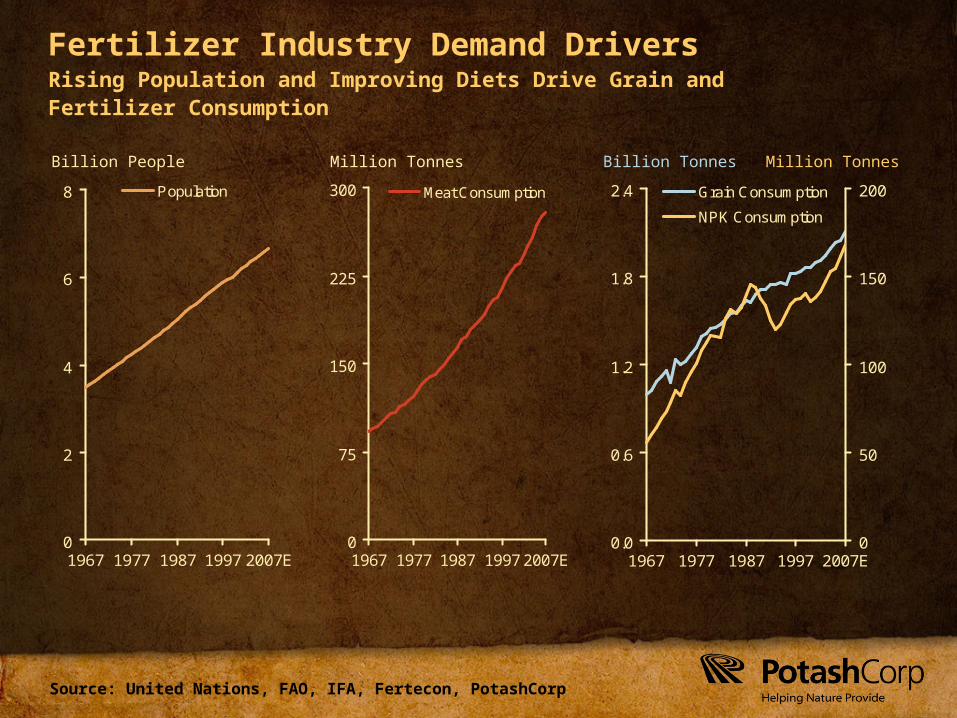
Source: United Nations, FAO, IFA, Fertecon, PotashCorp
Fertilizer Industry Demand Drivers
0
2
4
6
8
1967 1977 1987 1997 2007E
Population
Rising Population and Improving Diets Drive Grain and Fertilizer Consumption
Billion People Million Tonnes Billion Tonnes
0.0
0.6
1.2
1.8
2.4
1967 1977 1987 1997 2007E0
50
100
150
200Grain Consumption
NPK Consumption
Million Tonnes
0
75
150
225
300
1967 1977 1987 1997 2007E
Meat Consumption
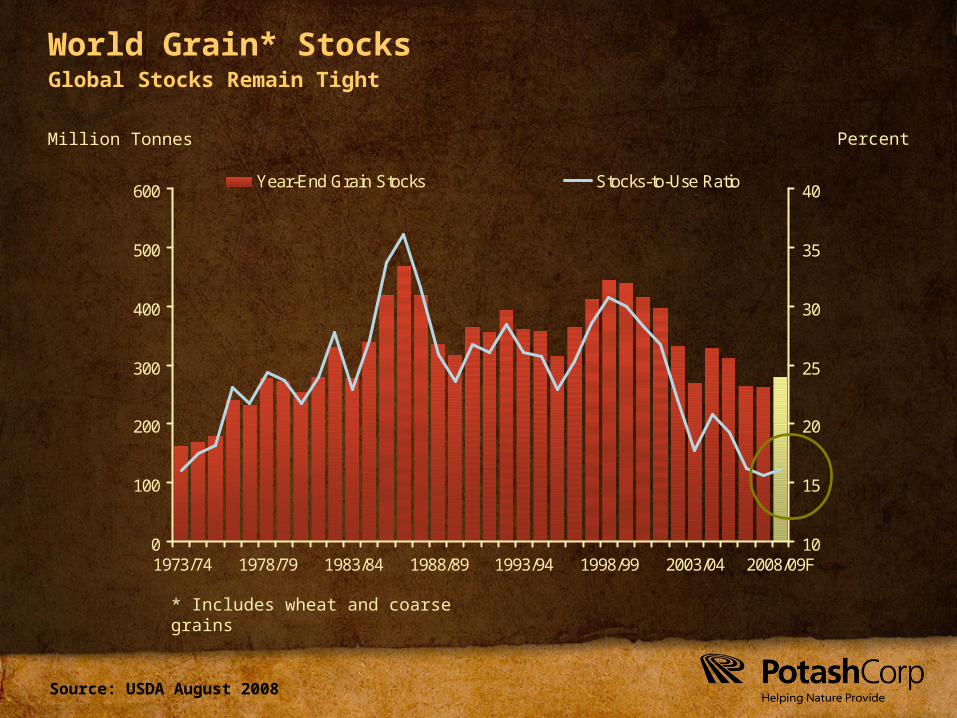
Source: USDA August 2008
World Grain* Stocks
Million Tonnes Percent
Global Stocks Remain Tight
0
100
200
300
400
500
600
1973/74 1978/79 1983/84 1988/89 1993/94 1998/99 2003/04 2008/09F10
15
20
25
30
35
40Year-End Grain Stocks Stocks-to-Use Ratio
* Includes wheat and coarse grains
Source: USDA
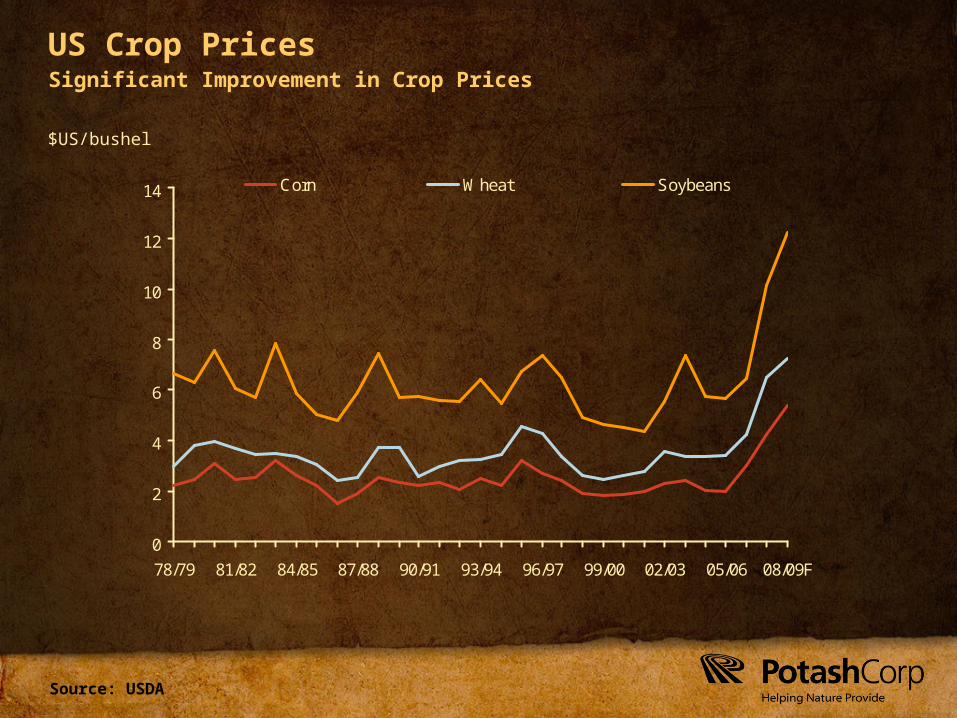
US Crop Prices
$US/bushel
Significant Improvement in Crop Prices
0
2
4
6
8
10
12
14
78/79 81/82 84/85 87/88 90/91 93/94 96/97 99/00 02/03 05/06 08/09F
Corn Wheat Soybeans
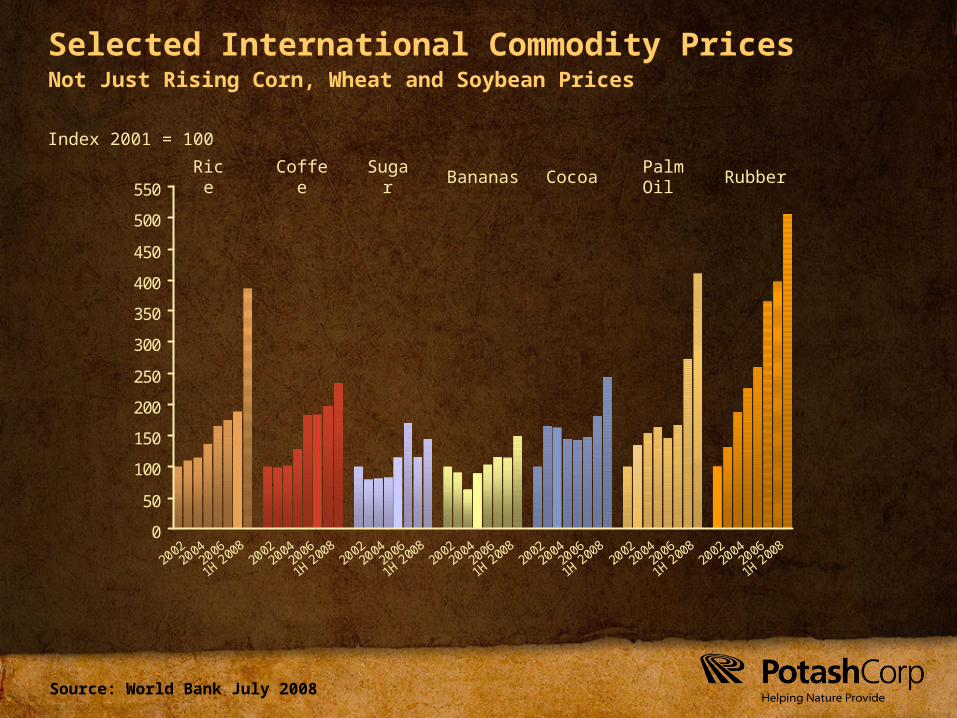
Source: World Bank July 2008
Selected International Commodity Prices
0
50
100
150
200
250
300
350
400
450
500
550
20022004
2006
1H 20082002
20042006
1H 20082002
20042006
1H 20082002
20042006
1H 20082002
20042006
1H 20082002
20042006
1H 20082002
20042006
1H 2008
Index 2001 = 100
Coffee Sugar BananasRice Cocoa RubberPalm Oil
Not Just Rising Corn, Wheat and Soybean Prices
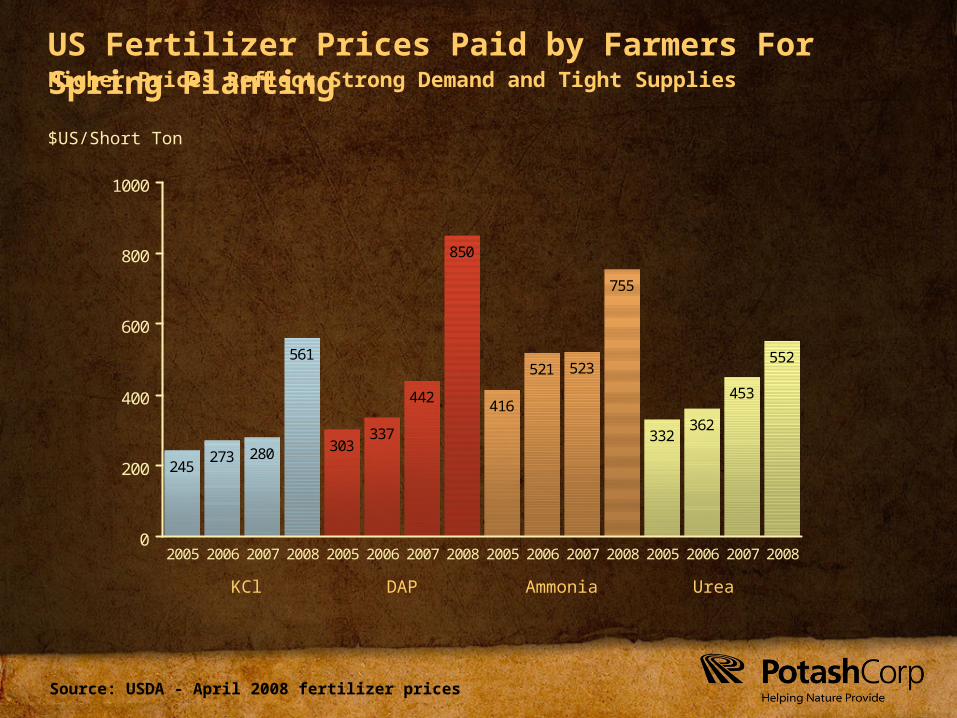
Source: USDA - April 2008 fertilizer prices
US Fertilizer Prices Paid by Farmers For Spring Planting
245273 280
561
303337
442
850
416
521 523
755
332362
453
552
0
200
400
600
800
1000
2005 2006 2007 2008 2005 2006 2007 2008 2005 2006 2007 2008 2005 2006 2007 2008
$US/Short Ton
KCl UreaDAP Ammonia
Higher Prices Reflect Strong Demand and Tight Supplies
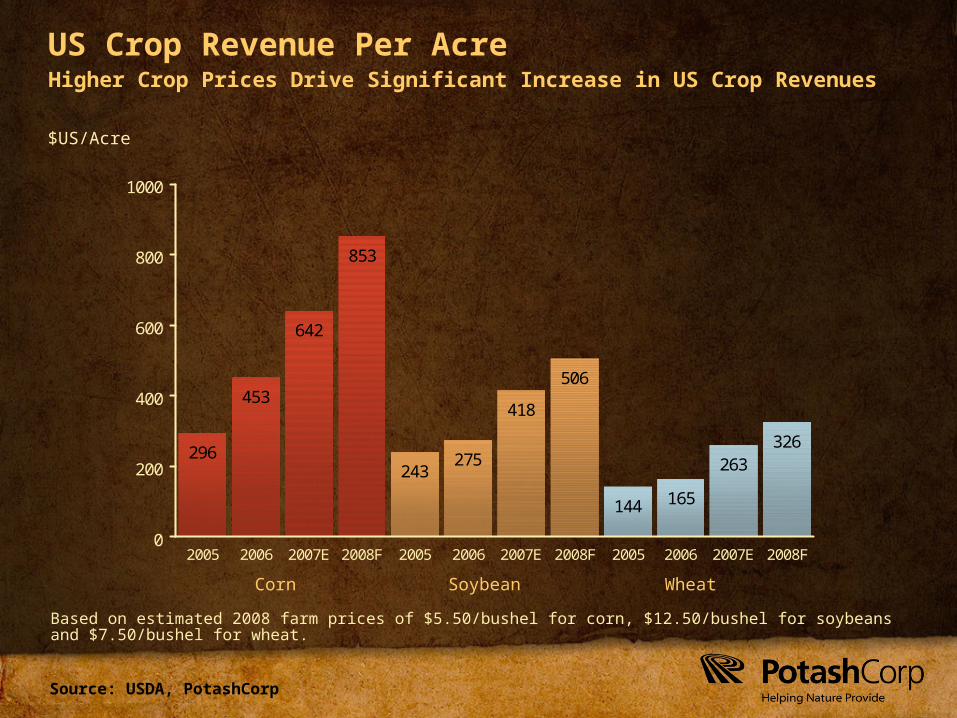
Source: USDA, PotashCorp
US Crop Revenue Per Acre
296
453
642
853
243275
418
506
144 165
263326
0
200
400
600
800
1000
2005 2006 2007E 2008F 2005 2006 2007E 2008F 2005 2006 2007E 2008F
$US/Acre
Higher Crop Prices Drive Significant Increase in US Crop Revenues
Based on estimated 2008 farm prices of $5.50/bushel for corn, $12.50/bushel for soybeans and $7.50/bushel for wheat.
Corn WheatSoybean
Source: USDA, PotashCorp
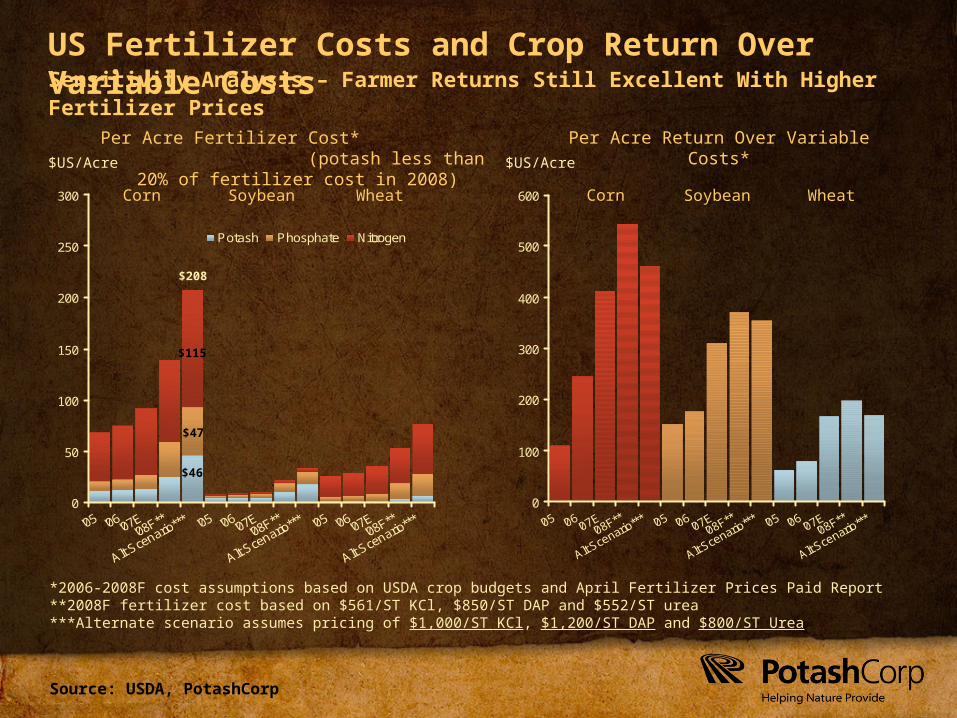
US Fertilizer Costs and Crop Return Over Variable Costs
0
50
100
150
200
250
300
Potash Phosphate Nitrogen
Sensitivity Analysis – Farmer Returns Still Excellent With Higher Fertilizer Prices
0
100
200
300
400
500
600
*2006-2008F cost assumptions based on USDA crop budgets and April Fertilizer Prices Paid Report**2008F fertilizer cost based on $561/ST KCl, $850/ST DAP and $552/ST urea***Alternate scenario assumes pricing of $1,000/ST KCl, $1,200/ST DAP and $800/ST Urea
Per Acre Fertilizer Cost* (potash less than 20% of fertilizer cost in 2008)
Per Acre Return Over Variable Costs*
Soybean WheatCorn
$115
$47
$46
$208
$US/Acre $US/Acre
Soybean WheatCorn
Source: USDA, Doane
0
10
20
30
40
50
60
70
80
90
100
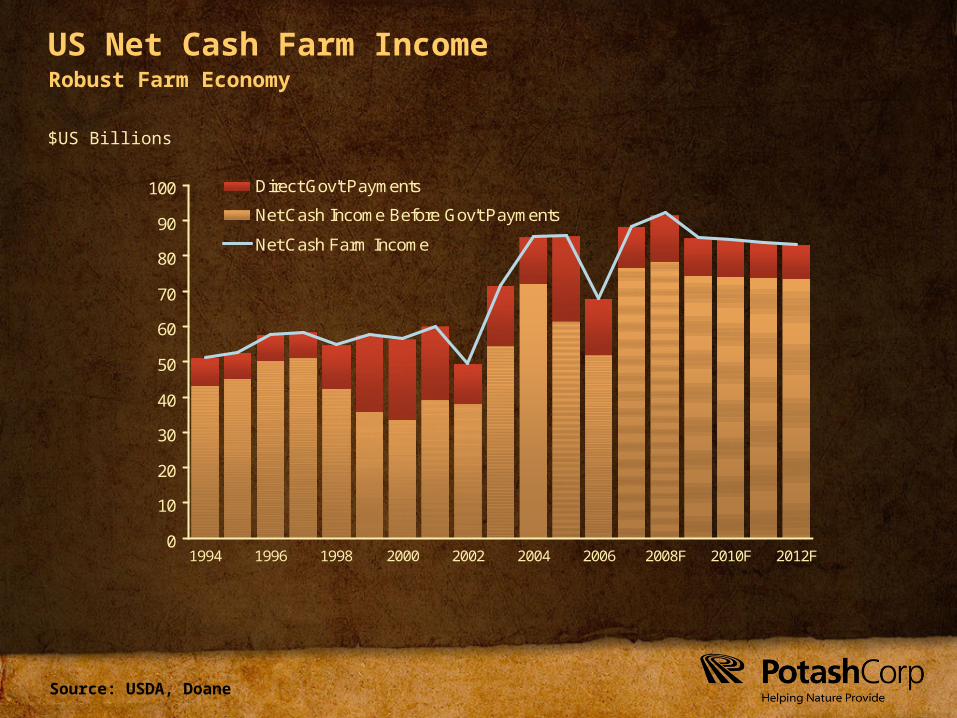
1994 1996 1998 2000 2002 2004 2006 2008F 2010F 2012F
Direct Gov't Payments
Net Cash Income Before Gov't Payments
Net Cash Farm Income
US Net Cash Farm Income
$US Billions
Robust Farm Economy
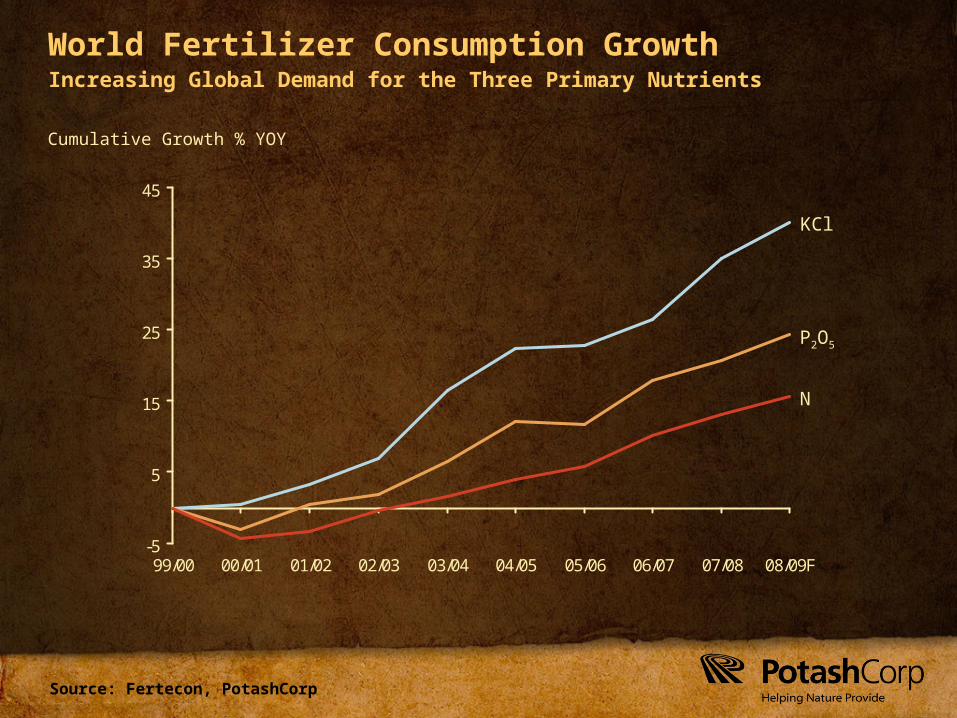
Source: Fertecon, PotashCorp
-5
5
15
25
35
45
99/00 00/01 01/02 02/03 03/04 04/05 05/06 06/07 07/08 08/09F
World Fertilizer Consumption Growth
Cumulative Growth % YOY
Increasing Global Demand for the Three Primary Nutrients
KCl
P2O5
N
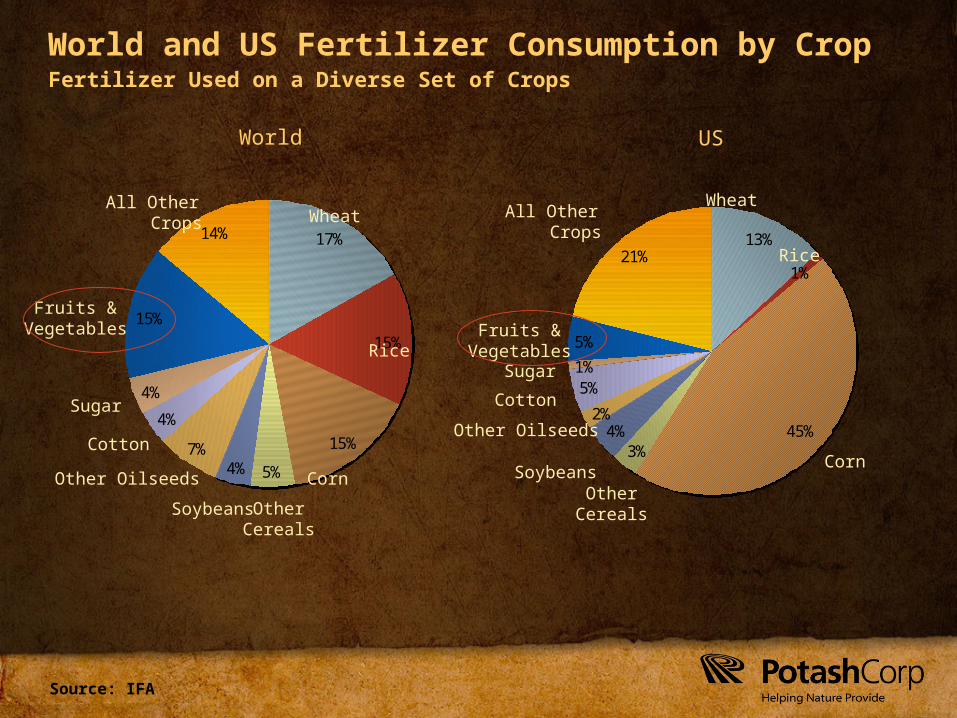
Source: IFA
World and US Fertilizer Consumption by Crop
17%
15%
15%
5%4%7%
4%
4%
15%
14%Wheat
Rice
Corn
OtherCereals
Cotton
Fruits &Vegetables
Soybeans
All Other Crops All Other CropsWheat
CornSoybeans
Cotton
World US
Other Oilseeds
Sugar
13%
1%
45%3%
4%2%
5%1%
5%
21% Rice
OtherCereals
Other Oilseeds
Sugar
Fruits &Vegetables
Fertilizer Used on a Diverse Set of Crops
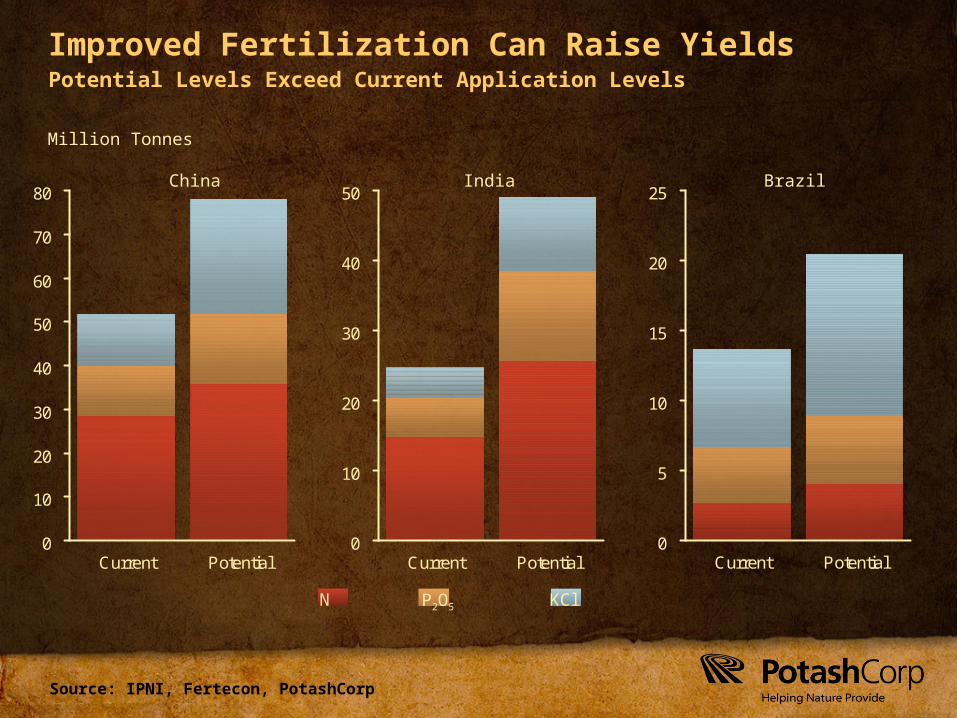
Source: IPNI, Fertecon, PotashCorp
Improved Fertilization Can Raise Yields
0
10
20
30
40
50
60
70
80
Current Potential
IndiaChina
Million Tonnes
0
10
20
30
40
50
Current Potential0
5
10
15
20
25
Current Potential
Brazil
N P2O5 KCl
Potential Levels Exceed Current Application Levels
Phosphate Overview
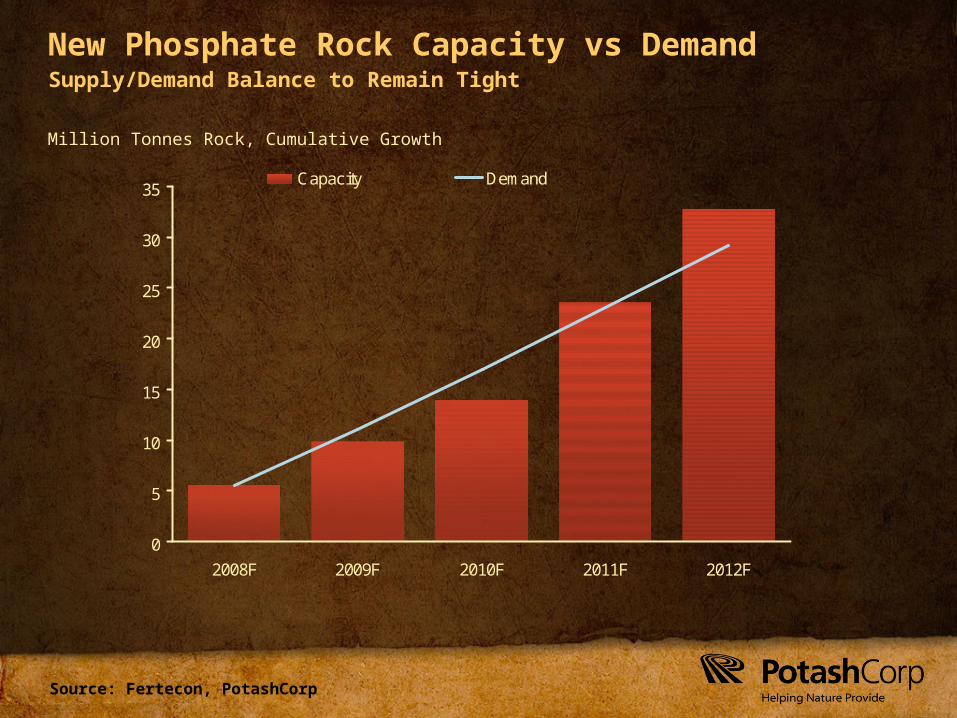
Source: Fertecon, PotashCorp
0
5
10
15
20
25
30
35
2008F 2009F 2010F 2011F 2012F
Capacity Demand
Million Tonnes Rock, Cumulative Growth
New Phosphate Rock Capacity vs Demand Supply/Demand Balance to Remain Tight
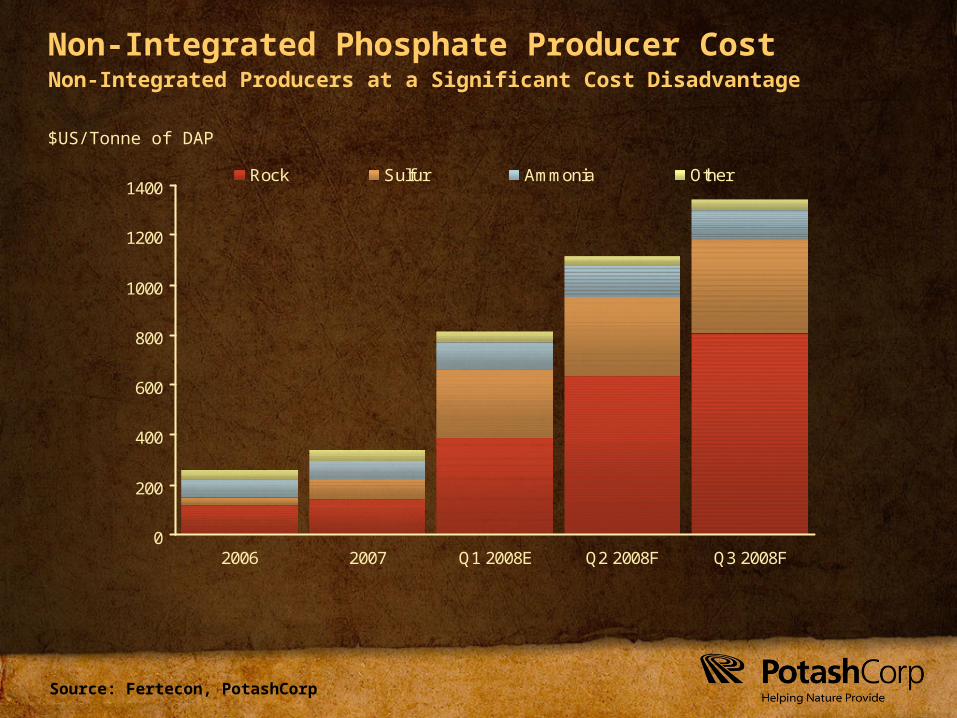
Source: Fertecon, PotashCorp
Non-Integrated Phosphate Producer Cost
$US/Tonne of DAP
0
200
400
600
800
1000
1200
1400
2006 2007 Q1 2008E Q2 2008F Q3 2008F
Rock Sulfur Ammonia Other
Non-Integrated Producers at a Significant Cost Disadvantage
Source: British Sulphur, Fertecon, PotashCorp
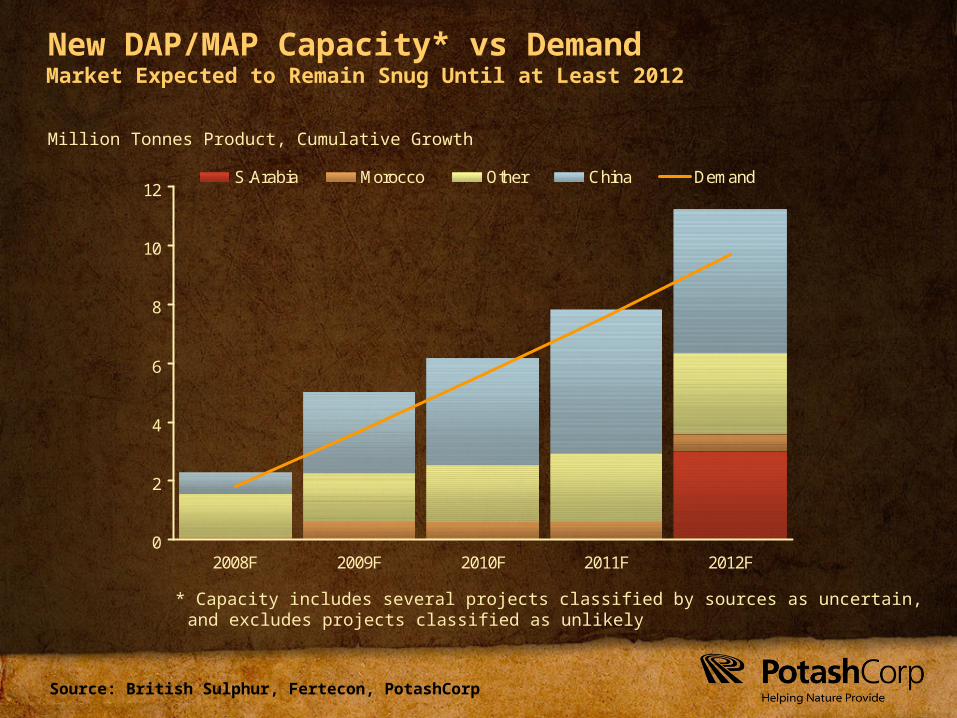
New DAP/MAP Capacity* vs Demand
0
2
4
6
8
10
12
2008F 2009F 2010F 2011F 2012F
S.Arabia Morocco Other China Demand
Million Tonnes Product, Cumulative Growth
* Capacity includes several projects classified by sources as uncertain,and excludes projects classified as unlikely
Market Expected to Remain Snug Until at Least 2012
Source: Fertecon, PotashCorp
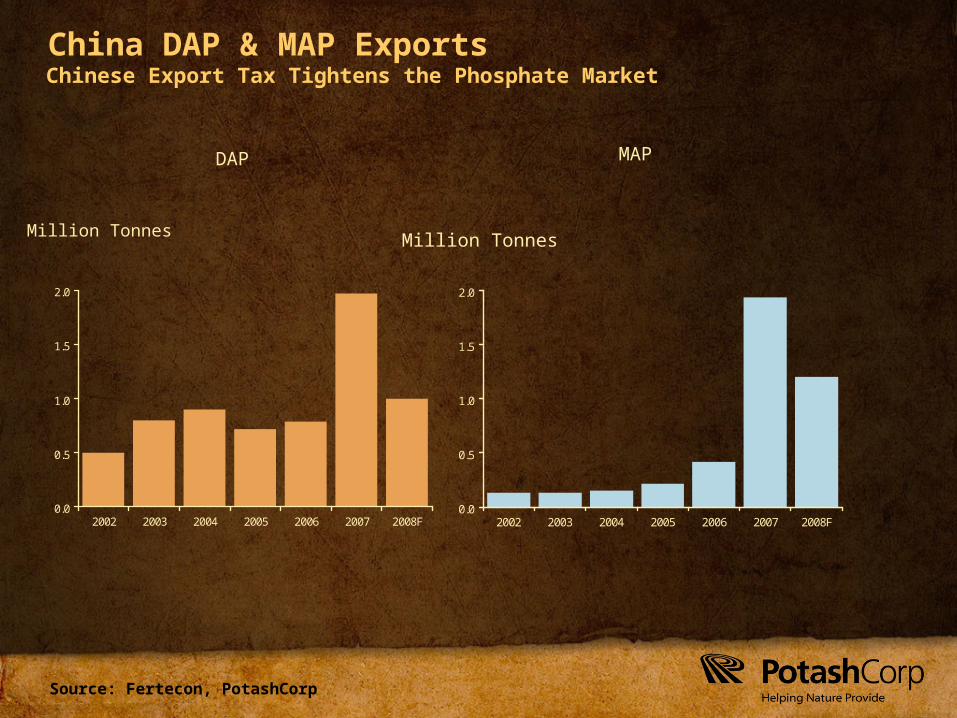
China DAP & MAP Exports
0.0
0.5
1.0
1.5
2.0
2002 2003 2004 2005 2006 2007 2008F
Million Tonnes
0.0
0.5
1.0
1.5
2.0
2002 2003 2004 2005 2006 2007 2008F
Million Tonnes
DAP MAP
Chinese Export Tax Tightens the Phosphate Market
Source: Fertecon, PotashCorp
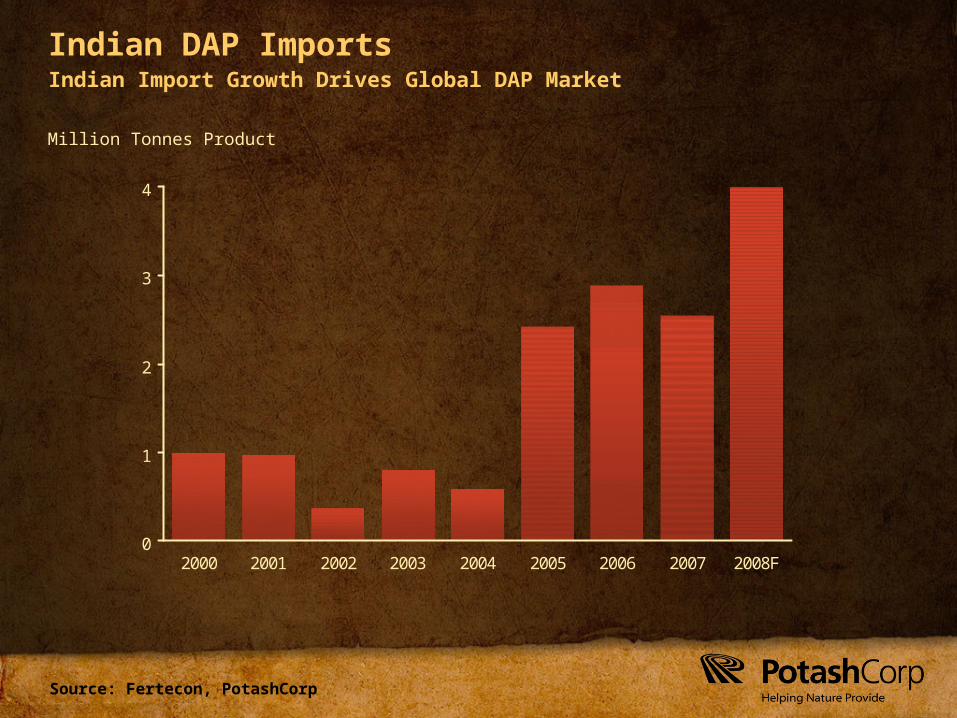
Indian DAP Imports
0
1
2
3
4
2000 2001 2002 2003 2004 2005 2006 2007 2008F
Million Tonnes Product
Indian Import Growth Drives Global DAP Market
Nitrogen Overview
Source: Fertecon, PotashCorp
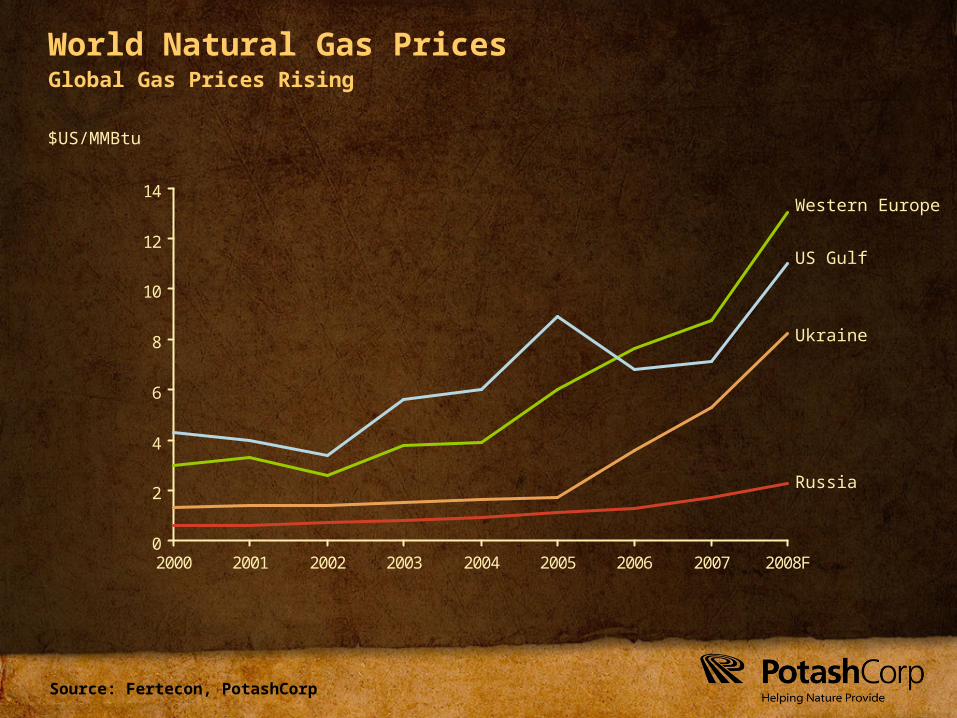
0
2
4
6
8
10
12
14
2000 2001 2002 2003 2004 2005 2006 2007 2008F
World Natural Gas Prices
$US/MMBtu
Global Gas Prices Rising
Western Europe
US Gulf
Ukraine
Russia
Source: Fertecon, PotashCorp
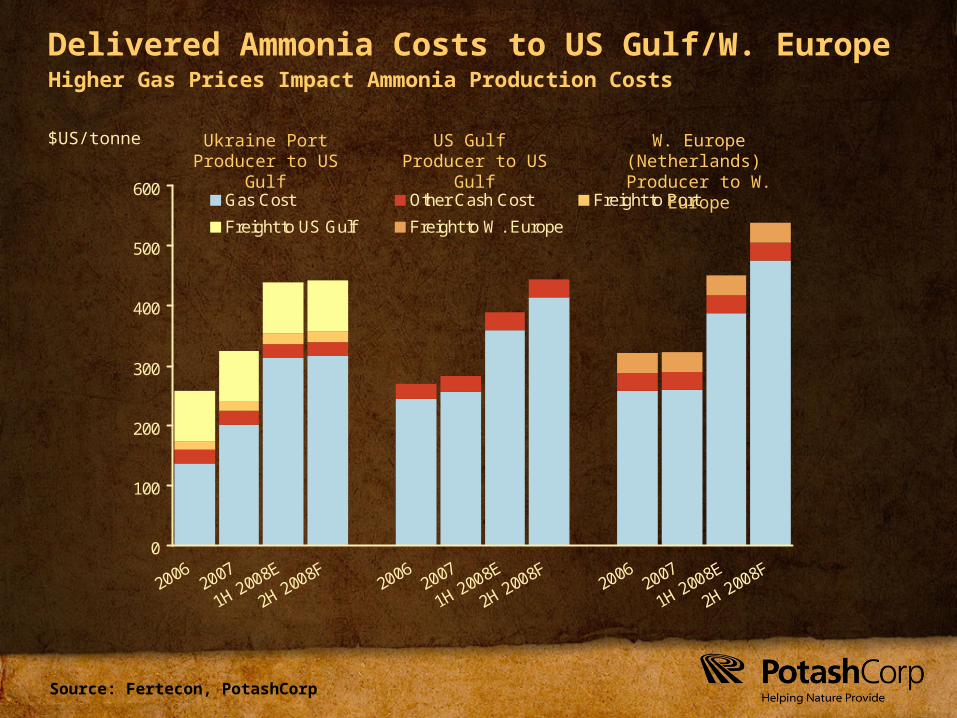
0
100
200
300
400
500
600
20062007
1H 2008E
2H 2008F2006
2007
1H 2008E
2H 2008F2006
2007
1H 2008E
2H 2008F
Gas Cost Other Cash Cost Freight to Port
Freight to US Gulf Freight to W. Europe
Delivered Ammonia Costs to US Gulf/W. Europe
$US/tonne Ukraine Port Producer to US Gulf
US Gulf Producer to US Gulf
W. Europe (Netherlands) Producer to W. Europe
Higher Gas Prices Impact Ammonia Production Costs
Source: Fertecon, British Sulphur, Potash Corp
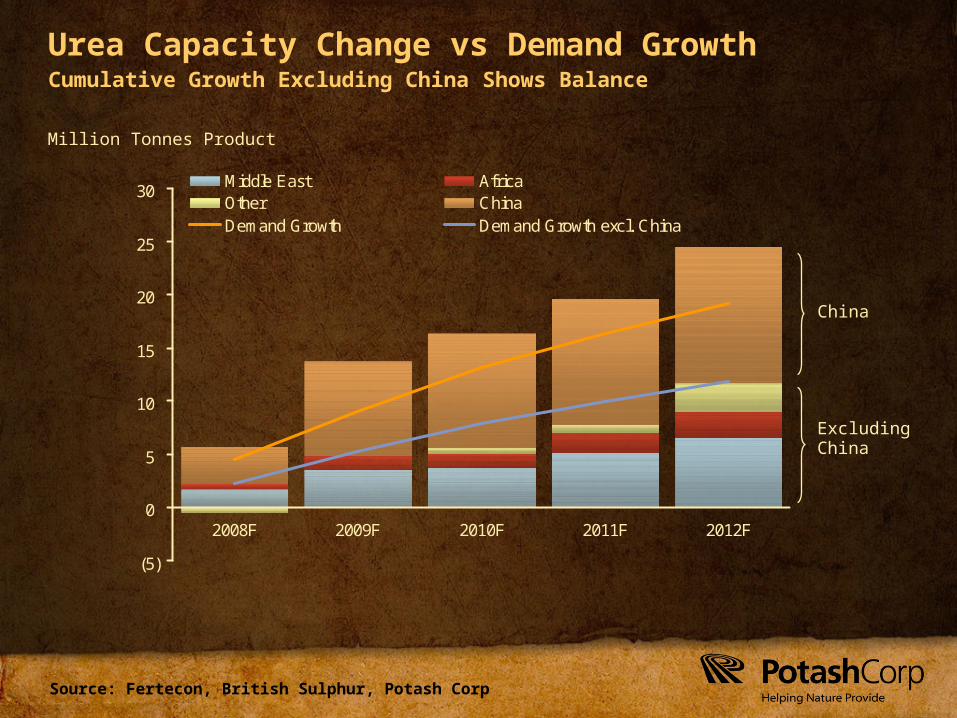
Million Tonnes Product
Urea Capacity Change vs Demand Growth
(5)
0
5
10
15
20
25
30
2008F 2009F 2010F 2011F 2012F
Middle East AfricaOther ChinaDemand Growth Demand Growth excl. China
Cumulative Growth Excluding China Shows Balance
Excluding China
China
Source: Fertecon
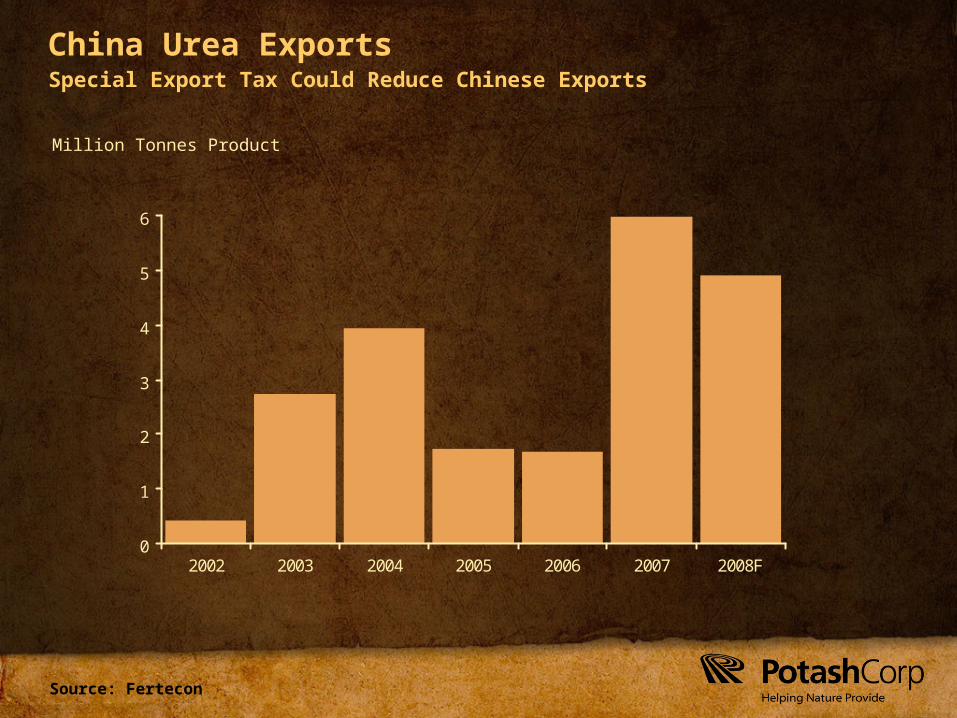
China Urea Exports
0
1
2
3
4
5
6
2002 2003 2004 2005 2006 2007 2008F
Million Tonnes Product
Special Export Tax Could Reduce Chinese Exports
Source: Fertecon, British Sulphur, PotashCorp
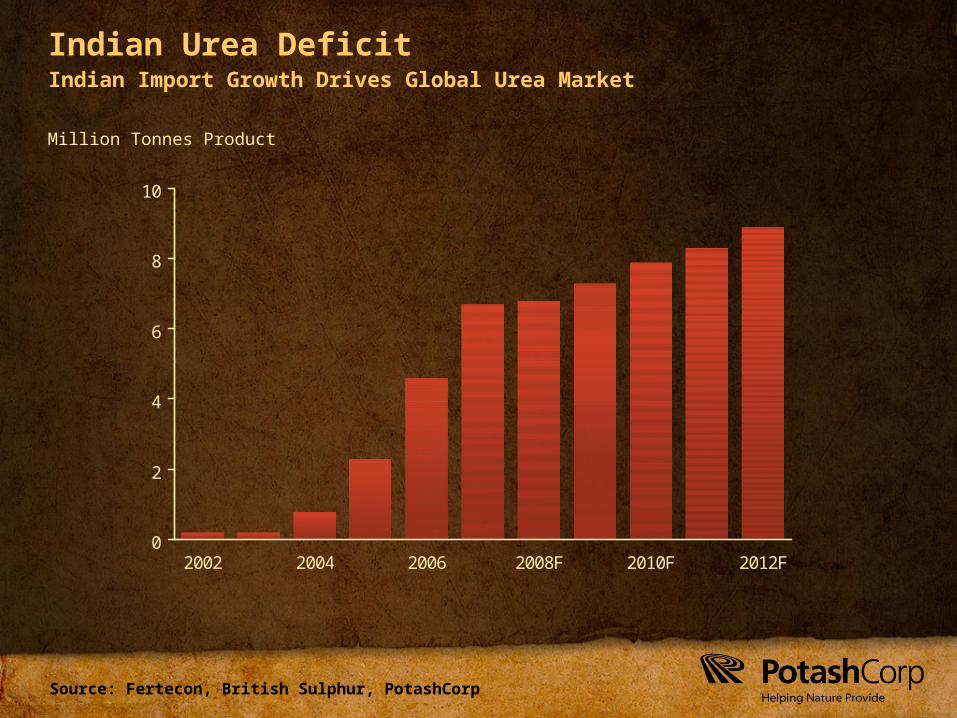
Indian Urea Deficit
0
2
4
6
8
10
2002 2004 2006 2008F 2010F 2012F
Million Tonnes Product
Indian Import Growth Drives Global Urea Market
Potash Overview
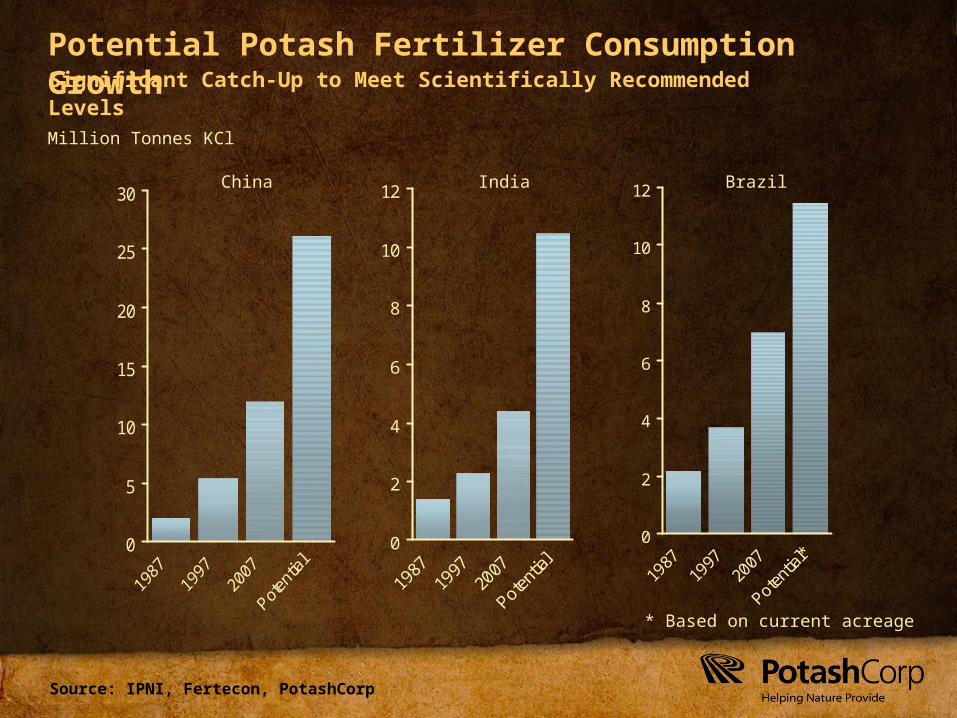
Source: IPNI, Fertecon, PotashCorp
0
5
10
15
20
25
30
0
2
4
6
8
10
12
1987
1997
2007
Potent
ial0
2
4
6
8
10
12
1987
1997
2007
Potent
ial*
Potential Potash Fertilizer Consumption Growth
China India Brazil
Million Tonnes KCl
Significant Catch-Up to Meet Scientifically Recommended Levels
* Based on current acreage
Source: Fertecon
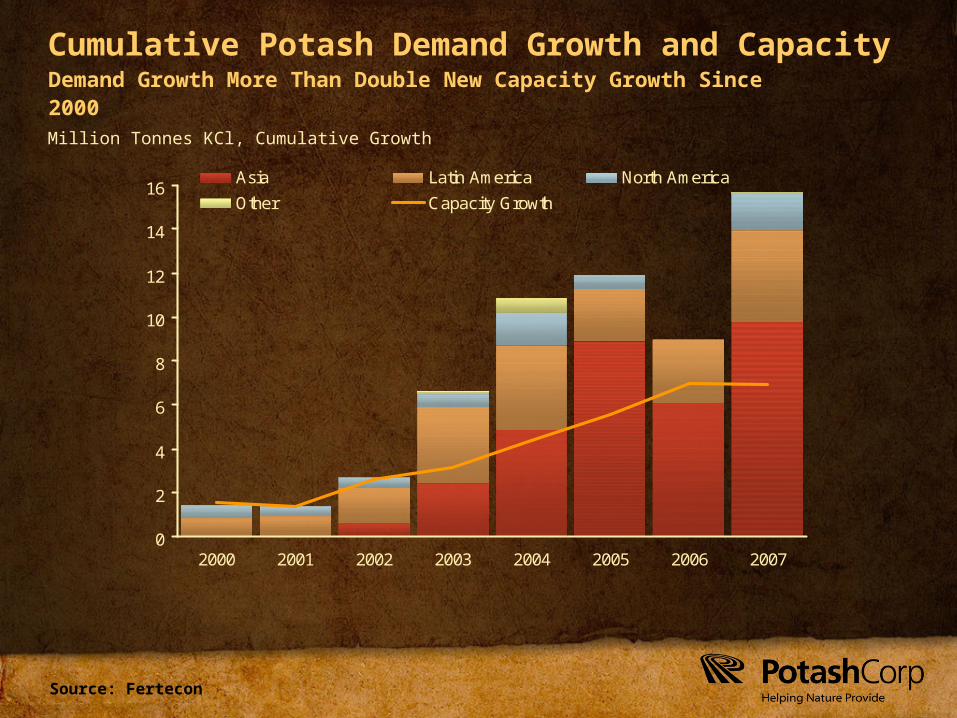
Cumulative Potash Demand Growth and Capacity
Million Tonnes KCl, Cumulative Growth
0
2
4
6
8
10
12
14
16
2000 2001 2002 2003 2004 2005 2006 2007
Asia Latin America North America
Other Capacity Growth
Demand Growth More Than Double New Capacity Growth Since 2000
Source: Fertecon, PotashCorp
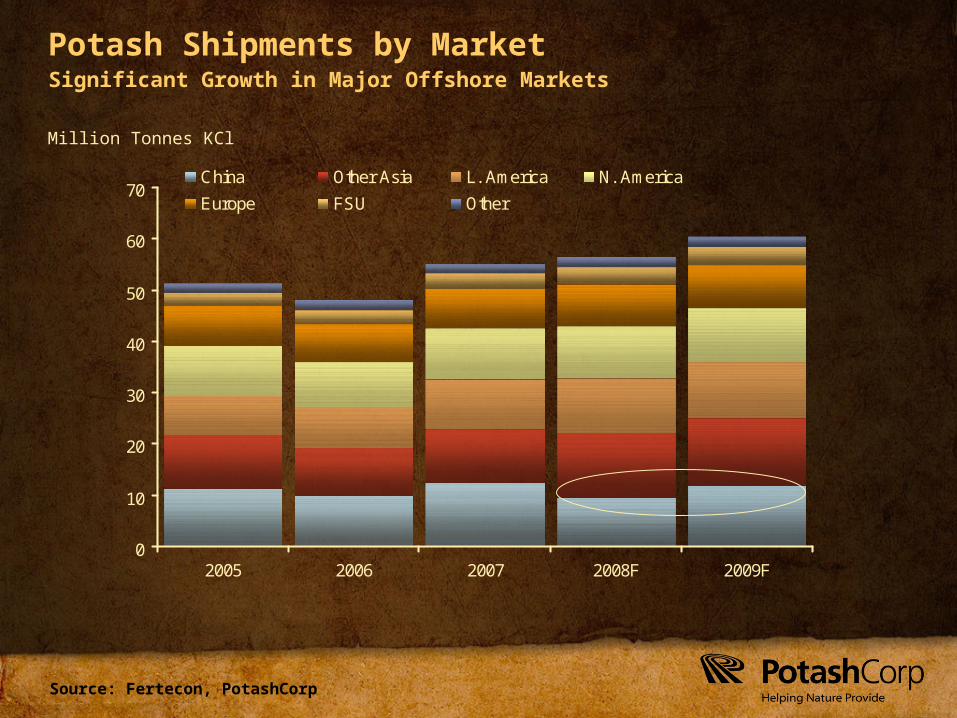
Potash Shipments by Market
Million Tonnes KCl
0
10
20
30
40
50
60
70
2005 2006 2007 2008F 2009F
China Other Asia L. America N. America
Europe FSU Other
Significant Growth in Major Offshore Markets
Source: IPNI
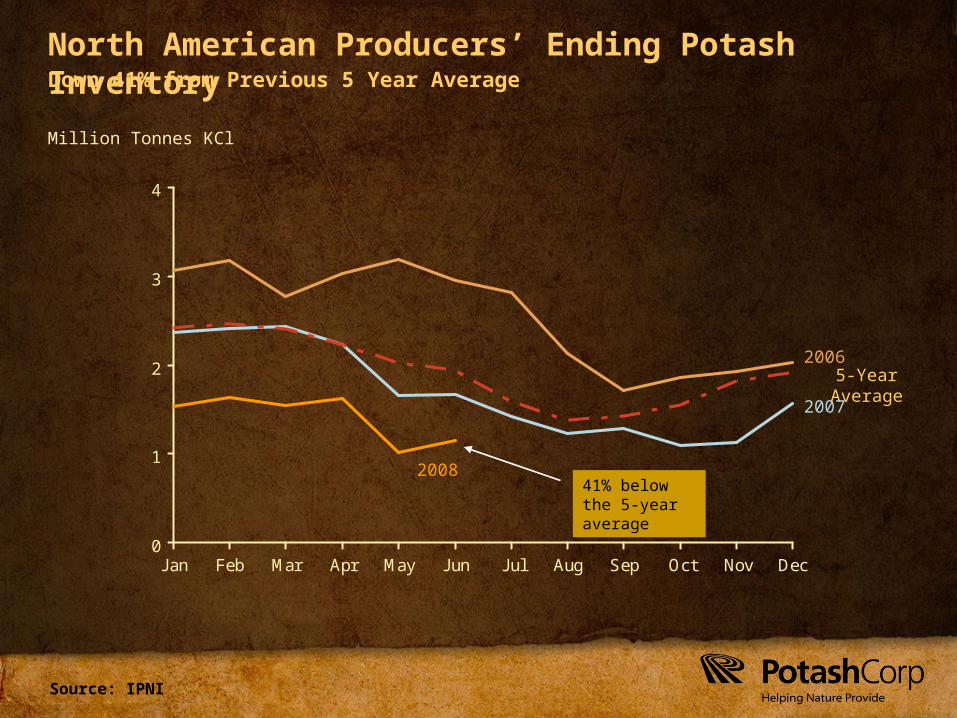
North American Producers’ Ending Potash Inventory
0
1
2
3
4
Jan Feb Mar Apr May Jun Jul Aug Sep Oct Nov Dec
Million Tonnes KCl
5-Year Average
41% below the 5-year average
2006
2007
2008
Down 41% from Previous 5 Year Average
Source: PotashCorp
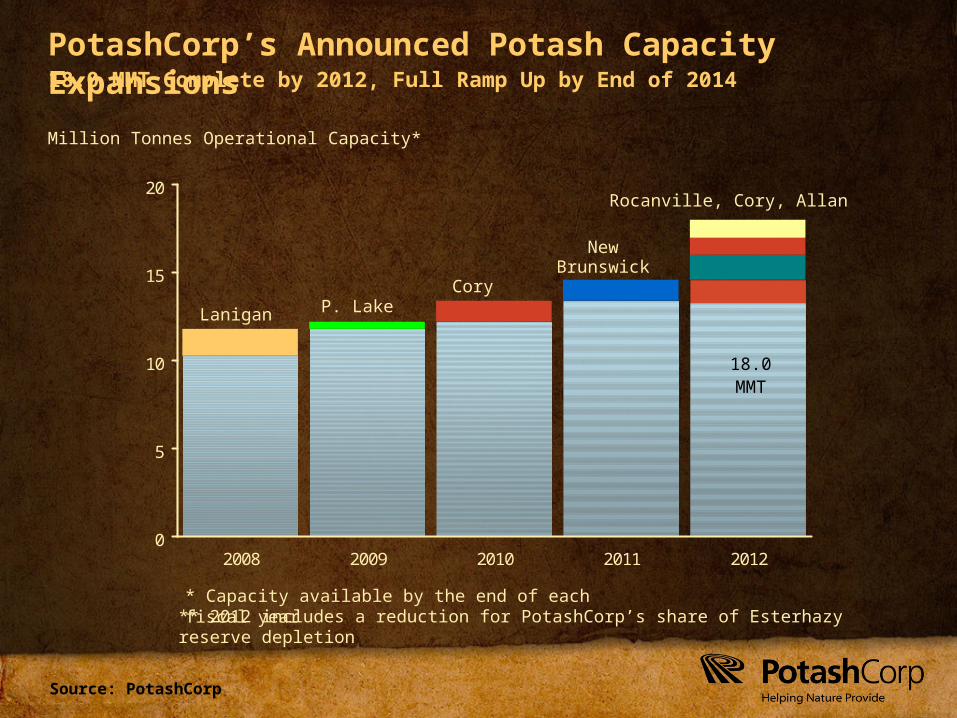
PotashCorp’s Announced Potash Capacity Expansions
0
5
10
15
20
2008 2009 2010 2011 2012
Million Tonnes Operational Capacity*
18.0 MMT Complete by 2012, Full Ramp Up by End of 2014
Lanigan
Cory
Rocanville, Cory, Allan
NewBrunswick
* Capacity available by the end of each fiscal year** 2012 includes a reduction for PotashCorp’s share of Esterhazy reserve depletion
18.0MMT
P. Lake

Thank You
PotashCorp.com