Embed Size (px)
Citation preview
EIA’s Natural Gas Outlook Through 2025
Howard GruenspechtDeputy Administrator
Energy Information Administration([email protected])
forThe Fertilizer InstituteOutlook Conference
October 26, 2004Annapolis, MD
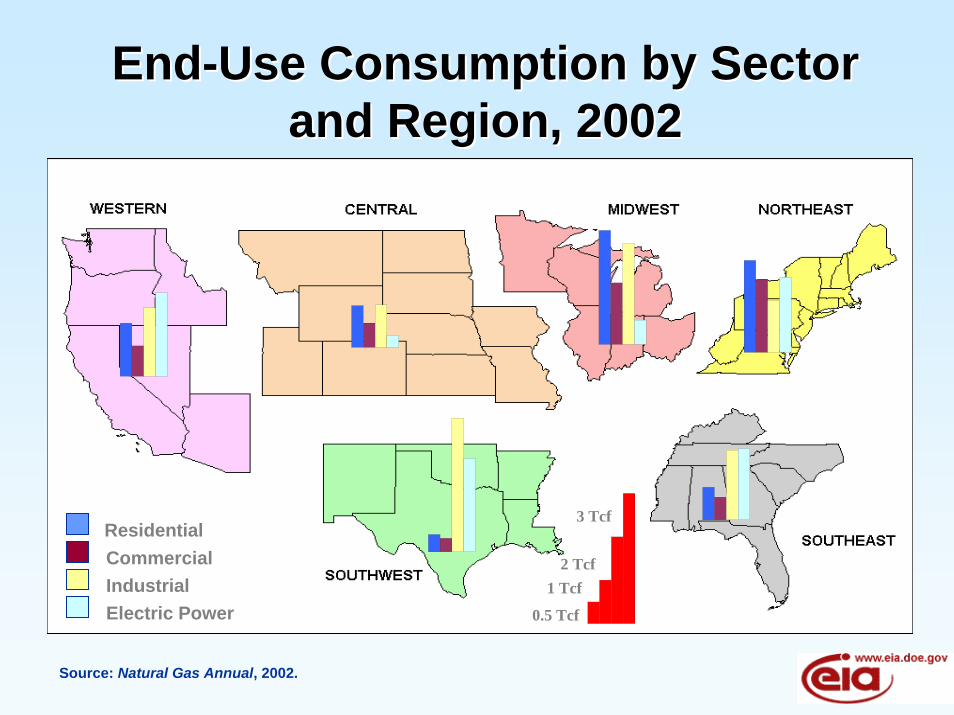
EndEnd--Use Consumption by Sector Use Consumption by Sector and Region, 2002and Region, 2002
Residential
Electric PowerIndustrialCommercial
0.5 Tcf
1 Tcf2 Tcf
3 Tcf
Source: Natural Gas Annual, 2002.
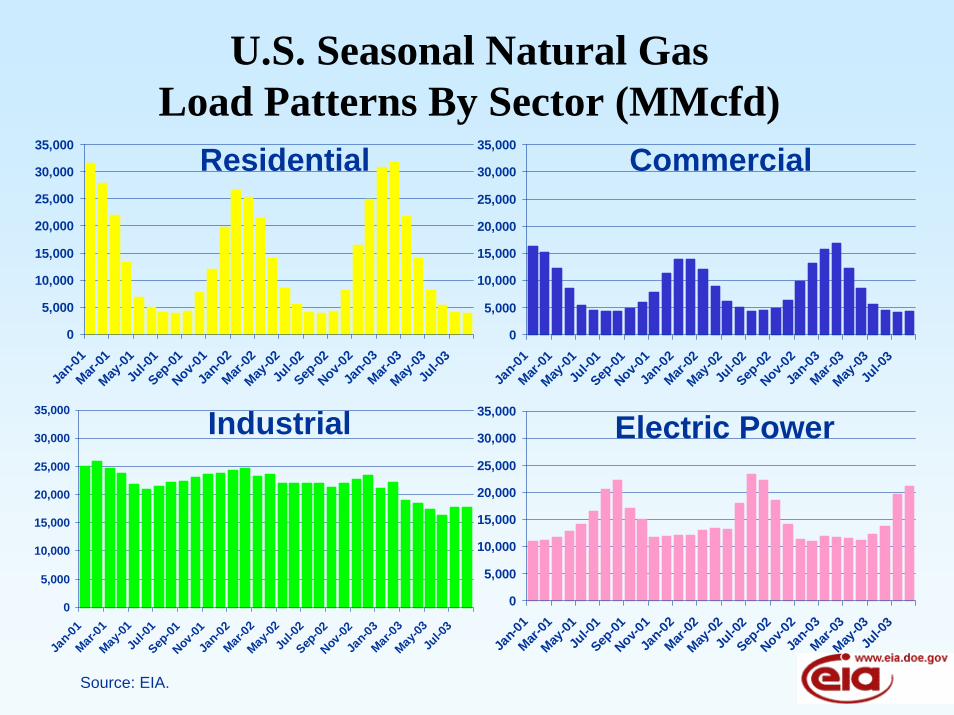
U.S. Seasonal Natural Gas Load Patterns By Sector (MMcfd)
0
5,000
10,000
15,000
20,000
25,000
30,000
35,000
Jan-0
1Mar-
01May
-01Ju
l-01
Sep-01
Nov-01
Jan-0
2Mar-
02May
-02Ju
l-02
Sep-02
Nov-02
Jan-0
3Mar-
03May
-03Ju
l-03
0
5,000
10,000
15,000
20,000
25,000
30,000
35,000
Jan-0
1Mar-
01May
-01Ju
l-01
Sep-01
Nov-01
Jan-0
2Mar-
02May
-02Ju
l-02
Sep-02
Nov-02
Jan-0
3Mar-
03May
-03Ju
l-03
0
5,000
10,000
15,000
20,000
25,000
30,000
35,000
Jan-01
Mar-01
May-01
Jul-0
1Sep
-01Nov
-01Ja
n-02
Mar-02
May-02
Jul-0
2Sep
-02Nov
-02Ja
n-03
Mar-03
May-03
Jul-0
3
Source: EIA.
0
5,000
10,000
15,000
20,000
25,000
30,000
35,000
Jan-0
1Mar-
01May
-01Ju
l-01
Sep-01
Nov-01
Jan-0
2Mar-
02May
-02Ju
l-02
Sep-02
Nov-02
Jan-0
3Mar-
03May
-03Ju
l-03
Residential
Industrial
Commercial
Electric Power
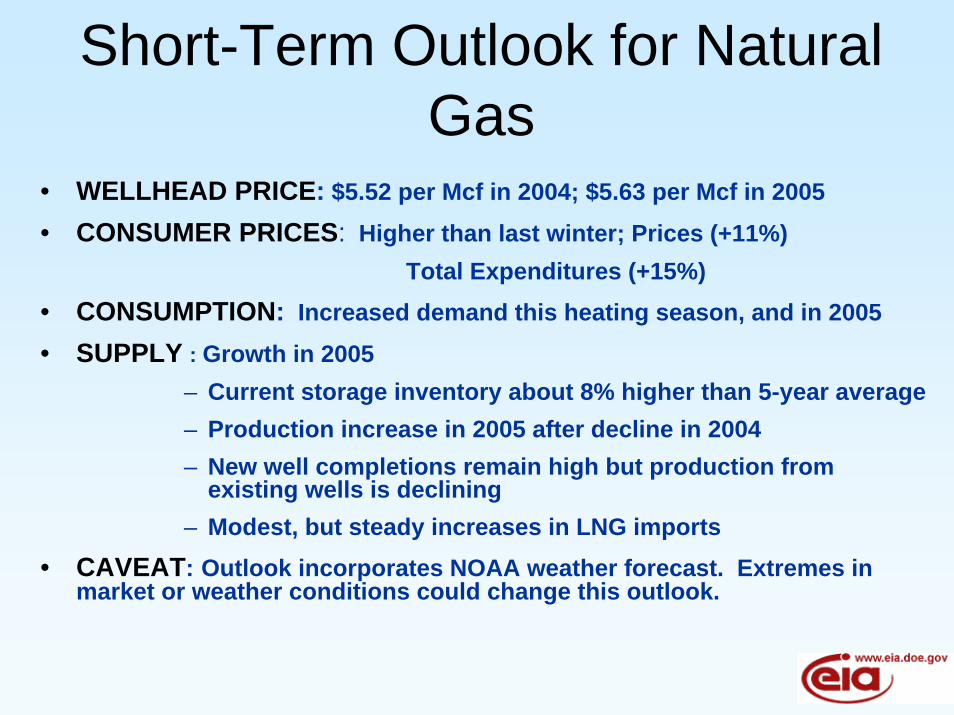
Short-Term Outlook for Natural Gas
• WELLHEAD PRICE: $5.52 per Mcf in 2004; $5.63 per Mcf in 2005
• CONSUMER PRICES: Higher than last winter; Prices (+11%)Total Expenditures (+15%)
• CONSUMPTION: Increased demand this heating season, and in 2005
• SUPPLY : Growth in 2005– Current storage inventory about 8% higher than 5-year average– Production increase in 2005 after decline in 2004– New well completions remain high but production from
existing wells is declining– Modest, but steady increases in LNG imports
• CAVEAT: Outlook incorporates NOAA weather forecast. Extremes in market or weather conditions could change this outlook.
0.0
2.0
4.0
6.0
8.0
10.0
12.0Ja
n-99
May
-99
Sep
-99
Jan-
00
May
-00
Sep
-00
Jan-
01
May
-01
Sep
-01
Jan-
02
May
-02
Sep
-02
Jan-
03
May
-03
Sep
-03
Jan-
04
May
-04
Sep
-04
Jan-
05
May
-05
Sep
-05
Monthly
Dol
lars
per T
hous
and
Cub
ic F
eet
Projections
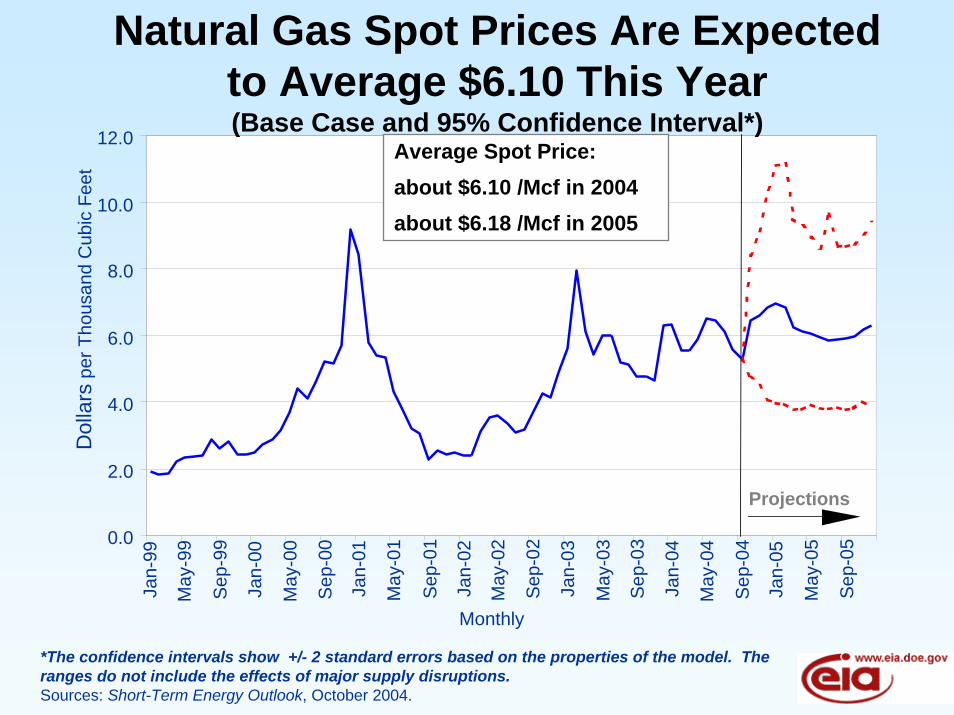
Natural Gas Spot Prices Are Expected to Average $6.10 This Year(Base Case and 95% Confidence Interval*)
Average Spot Price:about $6.10 /Mcf in 2004about $6.18 /Mcf in 2005
*The confidence intervals show +/- 2 standard errors based on the properties of the model. The ranges do not include the effects of major supply disruptions.Sources: Short-Term Energy Outlook, October 2004.
$0
$2
$4
$6
$8
$10
$12
$14
$16
Jan-96
Jan-97
Jan-98
Jan-99
Jan-00
Jan-01
Jan-02
Jan-03
Jan-04
Jan-05
Dol
lars
Per
Mcf
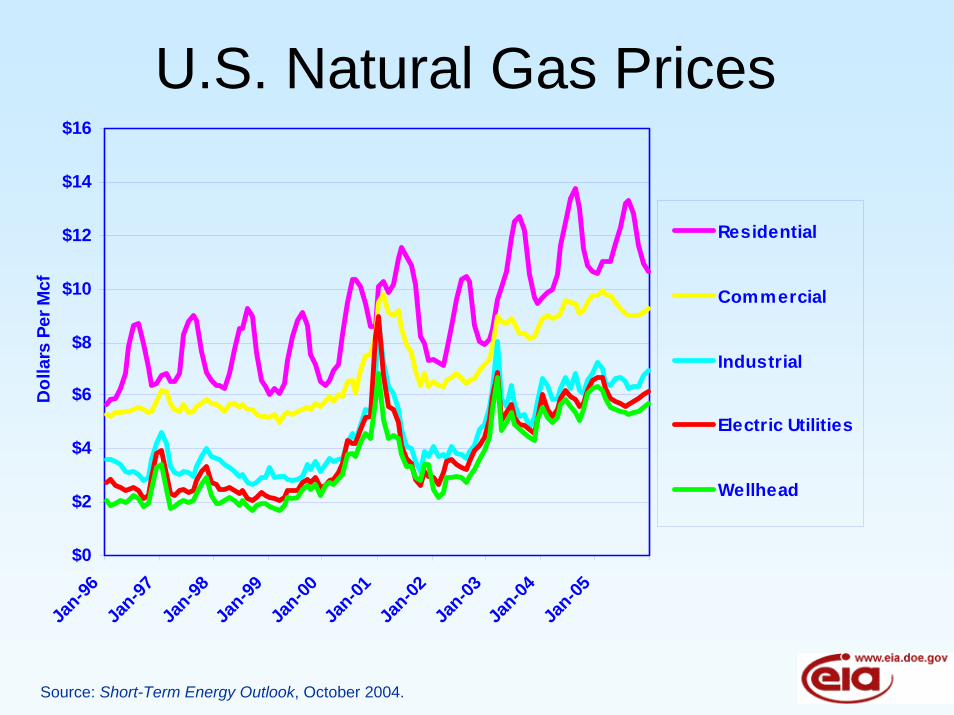
Residential
Commercial
Industrial
Electric Utilities
Wellhead
U.S. Natural Gas Prices
Source: Short-Term Energy Outlook, October 2004.
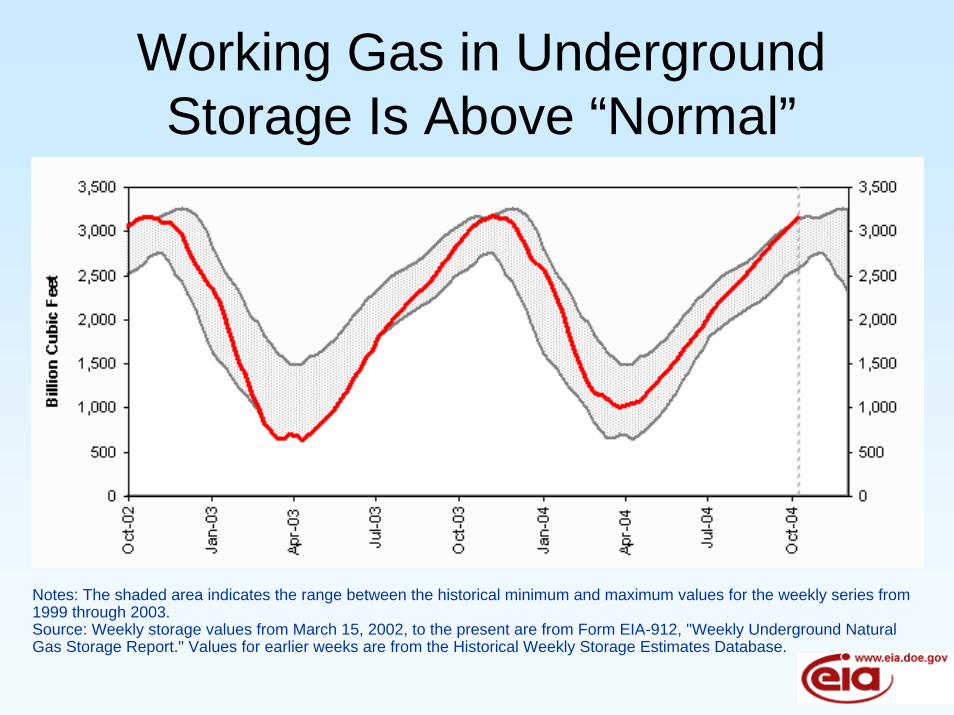
Working Gas in Underground Storage Is Above “Normal”
Notes: The shaded area indicates the range between the historical minimum and maximum values for the weekly series from 1999 through 2003. Source: Weekly storage values from March 15, 2002, to the present are from Form EIA-912, "Weekly Underground Natural Gas Storage Report." Values for earlier weeks are from the Historical Weekly Storage Estimates Database.
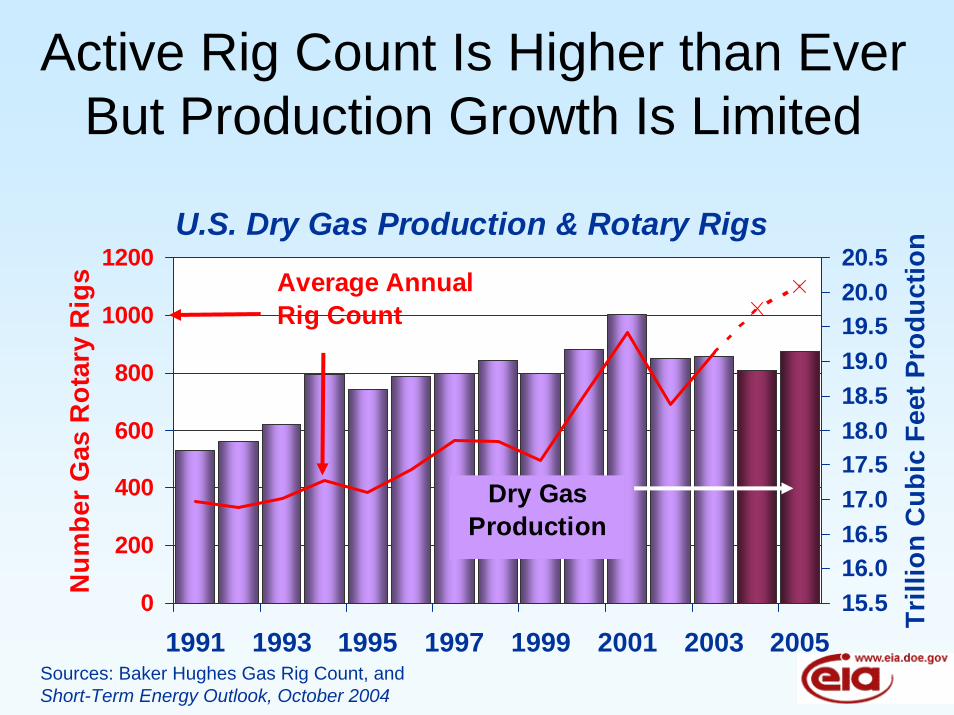
Active Rig Count Is Higher than Ever But Production Growth Is Limited
0
200
400
600
800
1000
1200
1991 1993 1995 1997 1999 2001 2003 2005
Num
ber
Gas
Rot
ary
Rig
s
15.516.016.517.017.518.018.519.019.520.020.5
Trill
ion
Cub
ic F
eet P
rodu
ctio
nU.S. Dry Gas Production & Rotary Rigs
Dry Gas Production
Average Annual Rig Count
Sources: Baker Hughes Gas Rig Count, andShort-Term Energy Outlook, October 2004
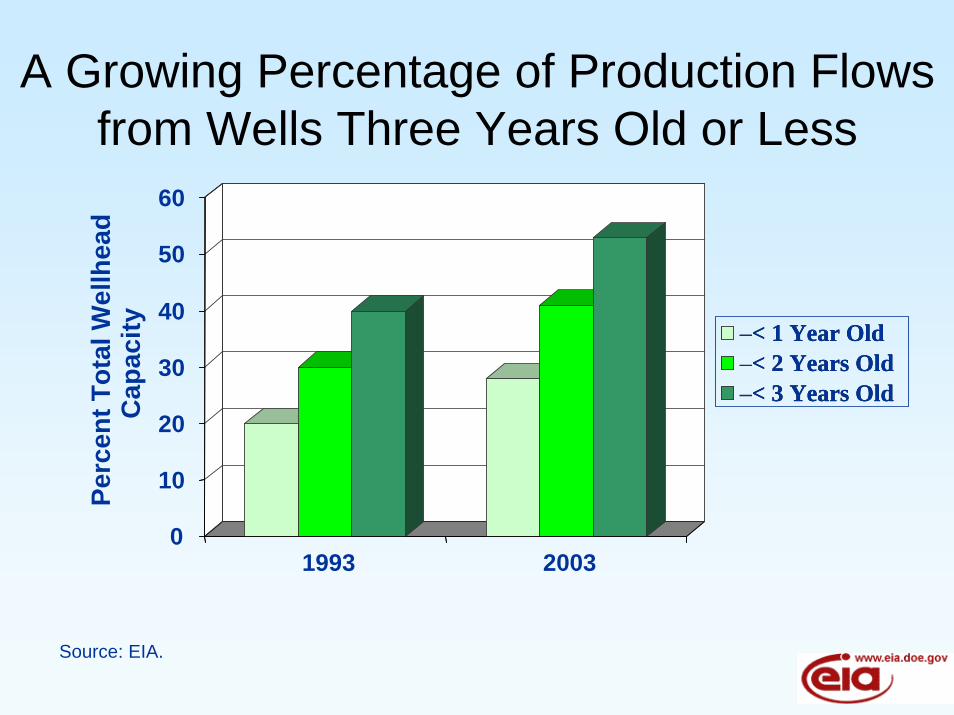
A Growing Percentage of Production Flows from Wells Three Years Old or Less
0
10
20
30
40
50
60
Perc
ent T
otal
Wel
lhea
d C
apac
ity
2003
–< 1 Year Old–< 2 Years Old–< 3 Years Old
1993
–< 1 Year Old–< 2 Years Old–< 3 Years Old
Source: EIA.
0
500
1,000
1,500
2,000
2,500
3,000
3,500
4,000
4,500
1997 1998 1999 2000 2001 2002 2003 2004 2005
Billio
n C
ubic
Fee
t
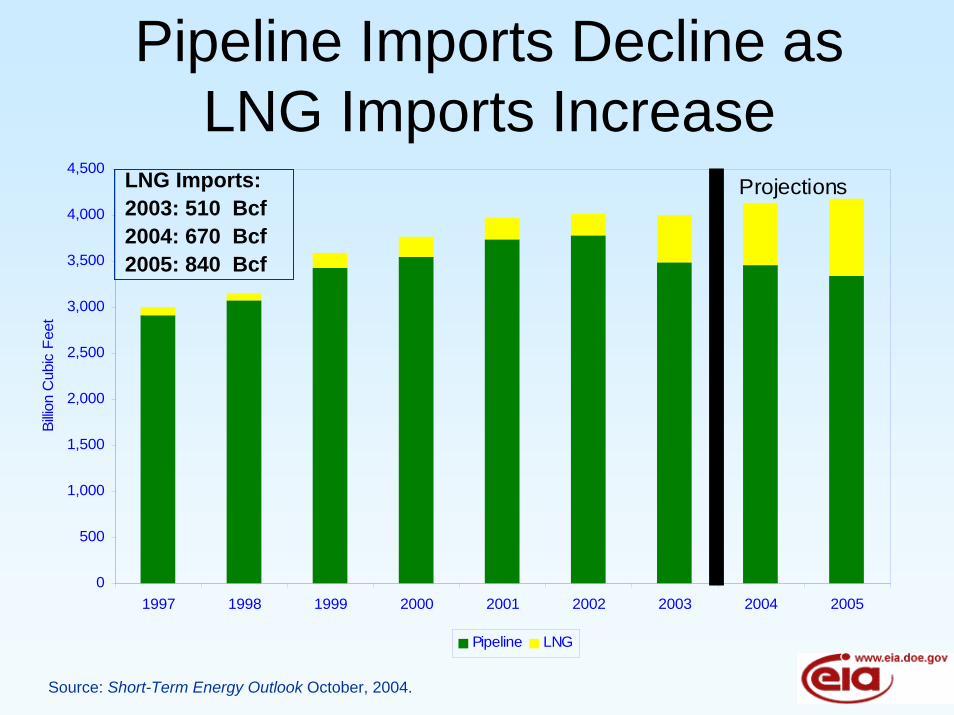
Pipeline LNG
Projections
Source: Short-Term Energy Outlook October, 2004.
Pipeline Imports Decline asLNG Imports Increase
LNG Imports:2003: 510 Bcf2004: 670 Bcf2005: 840 Bcf
-6%
-4%
-2%
0%
2%
4%
6%
8%
10%
12%
1993 1994 1995 1996 1997 1998 1999 2000 2001 2002 2003 2004 2005
Perc
ent C
hang
e
0
10
20
30
40
50
60
70
80
90
Bill
ion
Cub
ic F
eet p
er D
ay
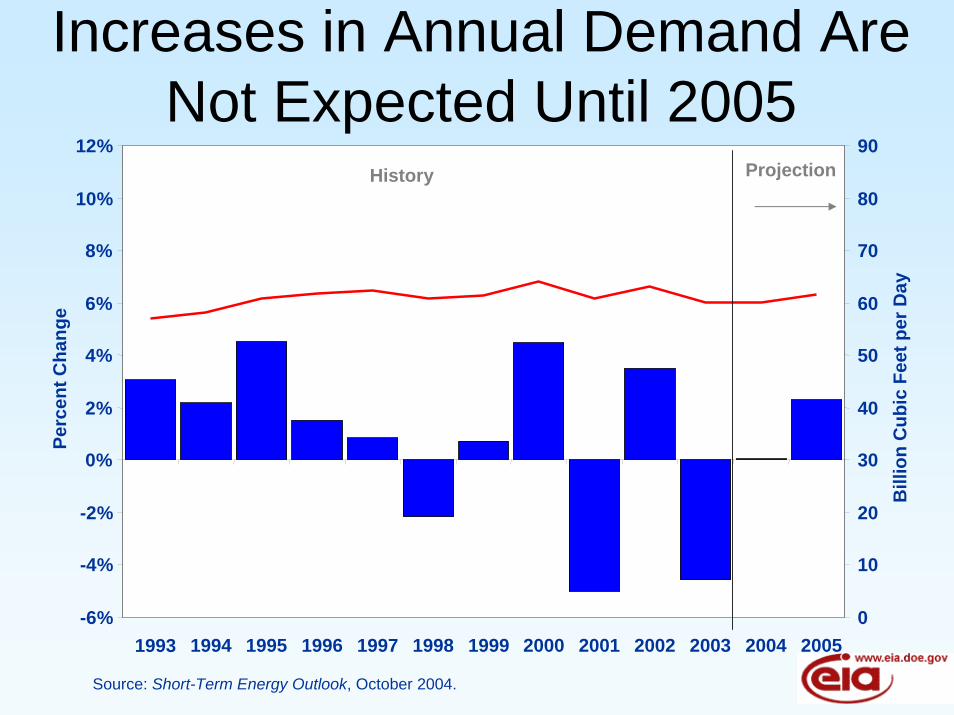
Increases in Annual Demand Are Not Expected Until 2005
History Projection
Source: Short-Term Energy Outlook, October 2004.
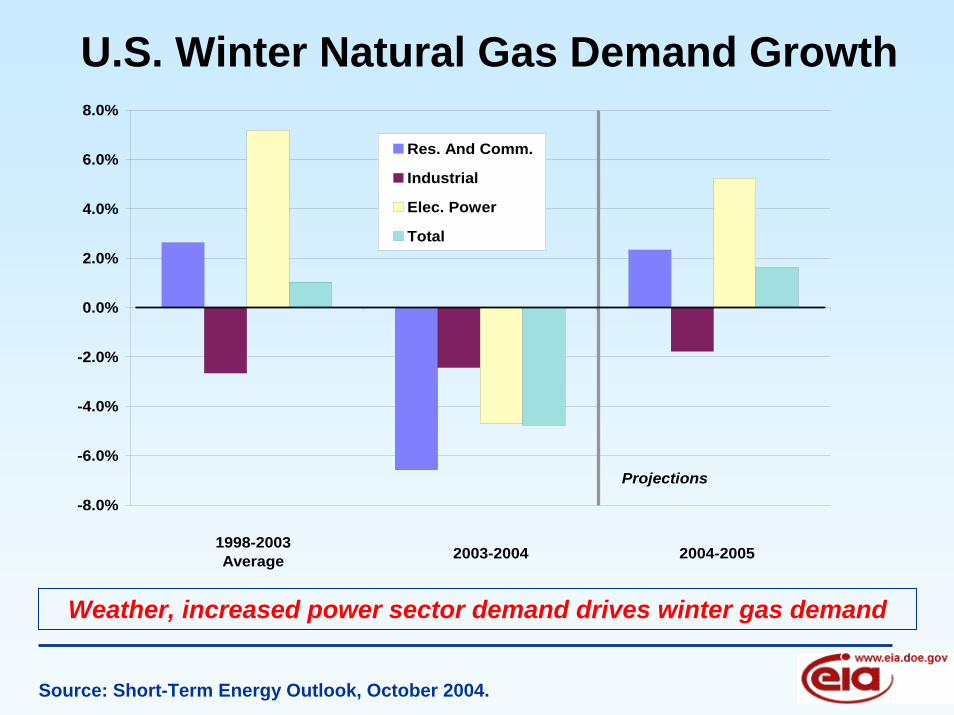
U.S. Winter Natural Gas Demand Growth
-8.0%
-6.0%
-4.0%
-2.0%
0.0%
2.0%
4.0%
6.0%
8.0%
Res. And Comm.
Industrial
Elec. Power
Total
Projections
1998-2003Average 2003-2004 2004-2005
Weather, increased power sector demand drives winter gas demand
Source: Short-Term Energy Outlook, October 2004.
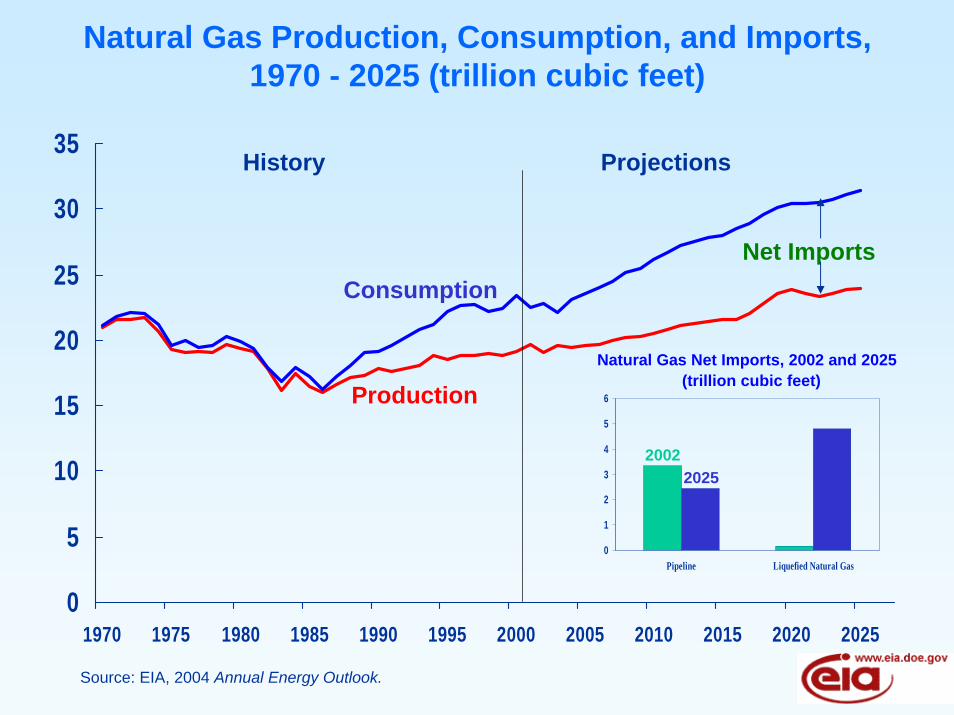
Natural Gas Production, Consumption, and Imports,1970 - 2025 (trillion cubic feet)
0
5
10
15
20
25
30
35
1970 1975 1980 1985 1990 1995 2000 2005 2010 2015 2020 2025
Consumption
Production
Net Imports
History Projections
0
1
2
3
4
5
6
Pipeline Liquefied Natural Gas
Natural Gas Net Imports, 2002 and 2025(trillion cubic feet)
20022025
Source: EIA, 2004 Annual Energy Outlook.
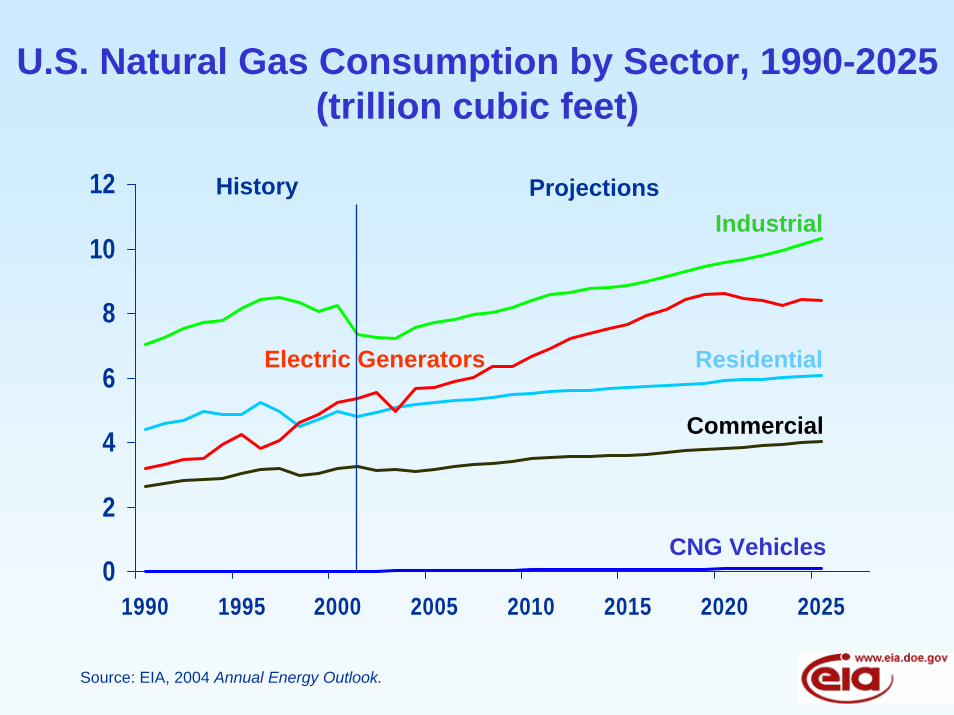
U.S. Natural Gas Consumption by Sector, 1990-2025(trillion cubic feet)
0
2
4
6
8
10
12
1990 1995 2000 2005 2010 2015 2020 2025
HistoryIndustrial
Electric Generators Residential
Commercial
CNG Vehicles
Projections
Source: EIA, 2004 Annual Energy Outlook.
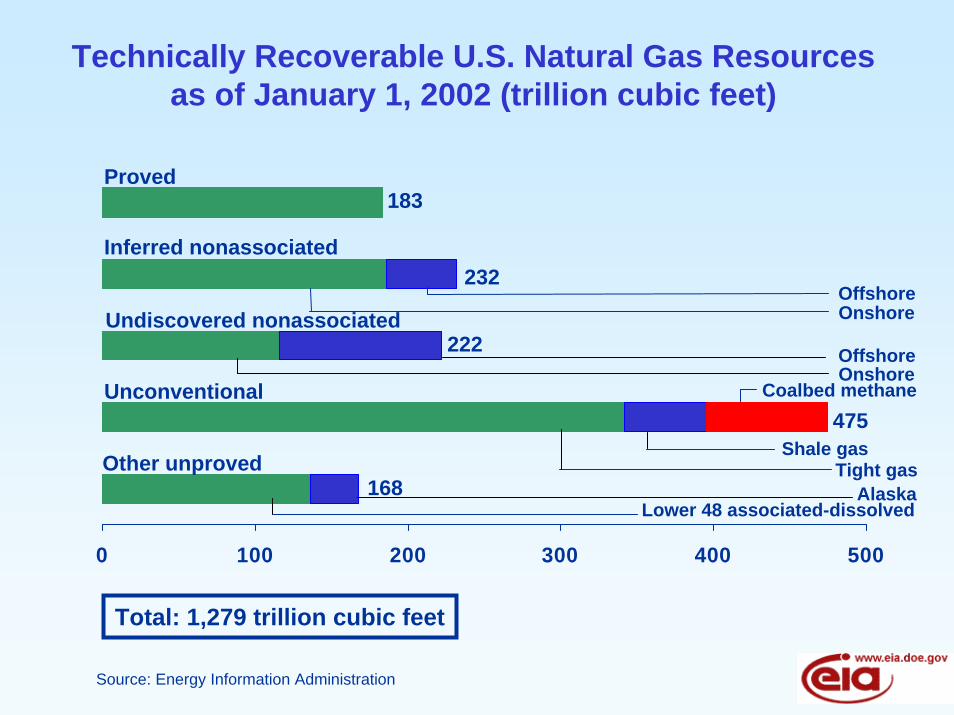
Technically Recoverable U.S. Natural Gas Resources as of January 1, 2002 (trillion cubic feet)
0 100 200 300 400 500
Undiscovered nonassociated
Inferred nonassociated
Unconventional
Other unproved
Proved
Offshore
Coalbed methane
Shale gasTight gas
AlaskaLower 48 associated-dissolved
Onshore
OffshoreOnshore
222
475
232
168
183
Total: 1,279 trillion cubic feet
Source: Energy Information Administration
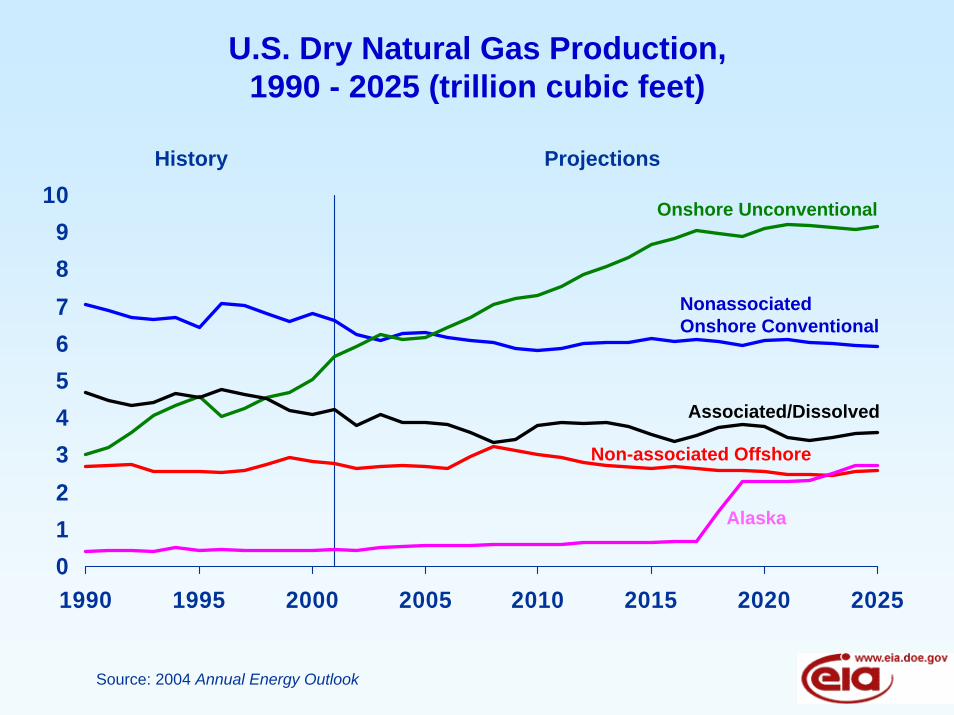
U.S. Dry Natural Gas Production, 1990 - 2025 (trillion cubic feet)
0123456789
10
1990 1995 2000 2005 2010 2015 2020 2025
History Projections
Associated/Dissolved
Non-associated Offshore
NonassociatedOnshore Conventional
Onshore Unconventional
Alaska
Source: 2004 Annual Energy Outlook
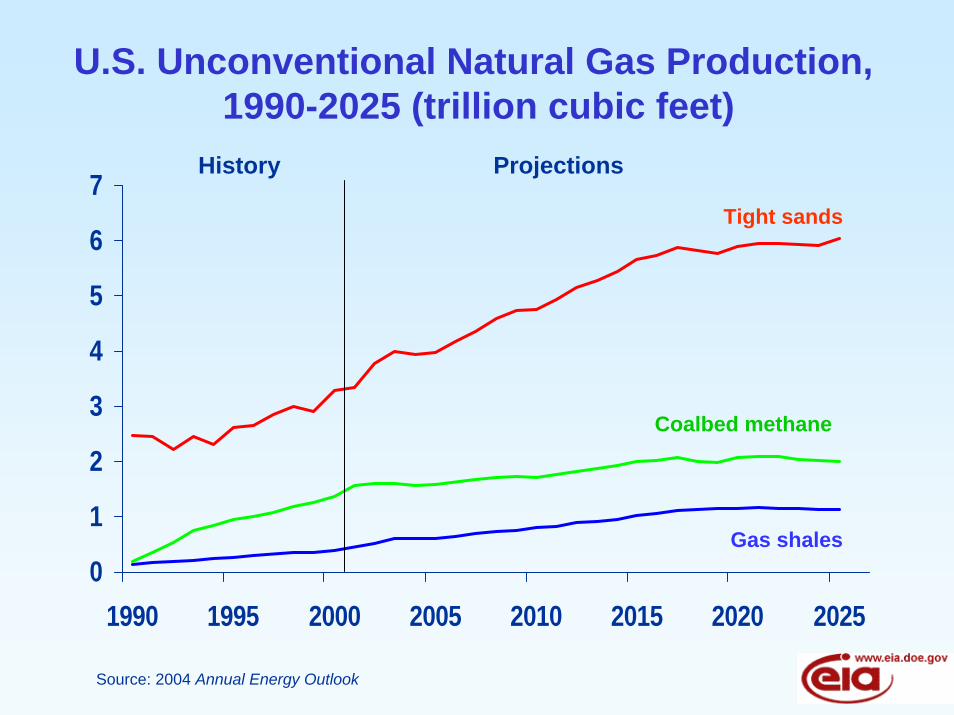
U.S. Unconventional Natural Gas Production,1990-2025 (trillion cubic feet)
0
1
2
3
4
5
6
7
1990 1995 2000 2005 2010 2015 2020 2025
History Projections
Tight sands
Coalbed methane
Gas shales
Source: 2004 Annual Energy Outlook
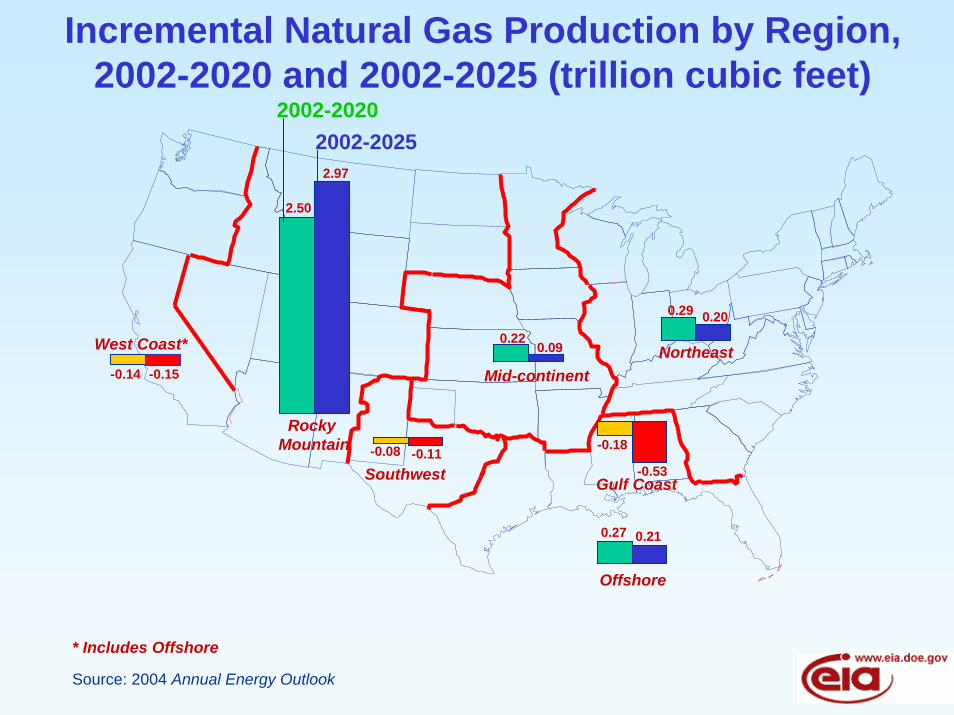
Incremental Natural Gas Production by Region,2002-2020 and 2002-2025 (trillion cubic feet)
Northeast
Gulf Coast
West Coast*
Rocky Mountain
Southwest
Mid-continent
Offshore
2.97
-0.08
0.09
0.20
0.21
-0.53
-0.15
0.29
-0.18
0.22
-0.11
2.50
0.27
-0.14
2002-20202002-2025
* Includes Offshore
Source: 2004 Annual Energy Outlook
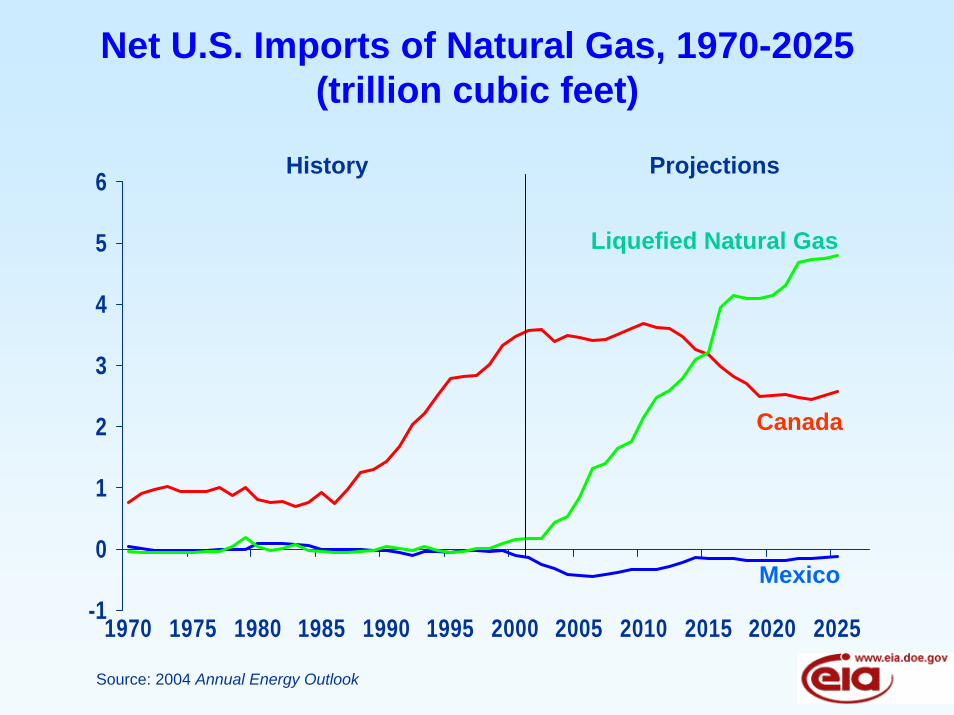
Net U.S. Imports of Natural Gas, 1970-2025(trillion cubic feet)
-1
0
1
2
3
4
5
6
1970 1975 1980 1985 1990 1995 2000 2005 2010 2015 2020 2025
History Projections
Canada
Liquefied Natural Gas
Mexico
Source: 2004 Annual Energy Outlook
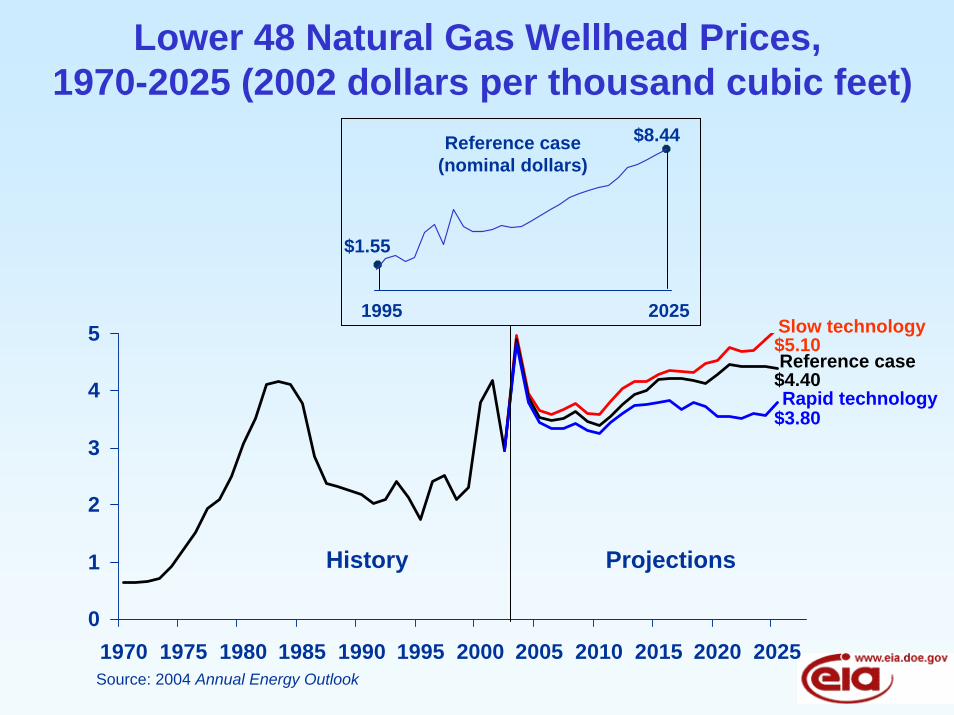
Lower 48 Natural Gas Wellhead Prices,1970-2025 (2002 dollars per thousand cubic feet)
0
1
2
3
4
5
1970 1975 1980 1985 1990 1995 2000 2005 2010 2015 2020 2025
1995 2025
Reference case(nominal dollars)
$1.55
$8.44
History Projections
$4.40
Slow technology
Reference case
Rapid technology$3.80
$5.10
Source: 2004 Annual Energy Outlook
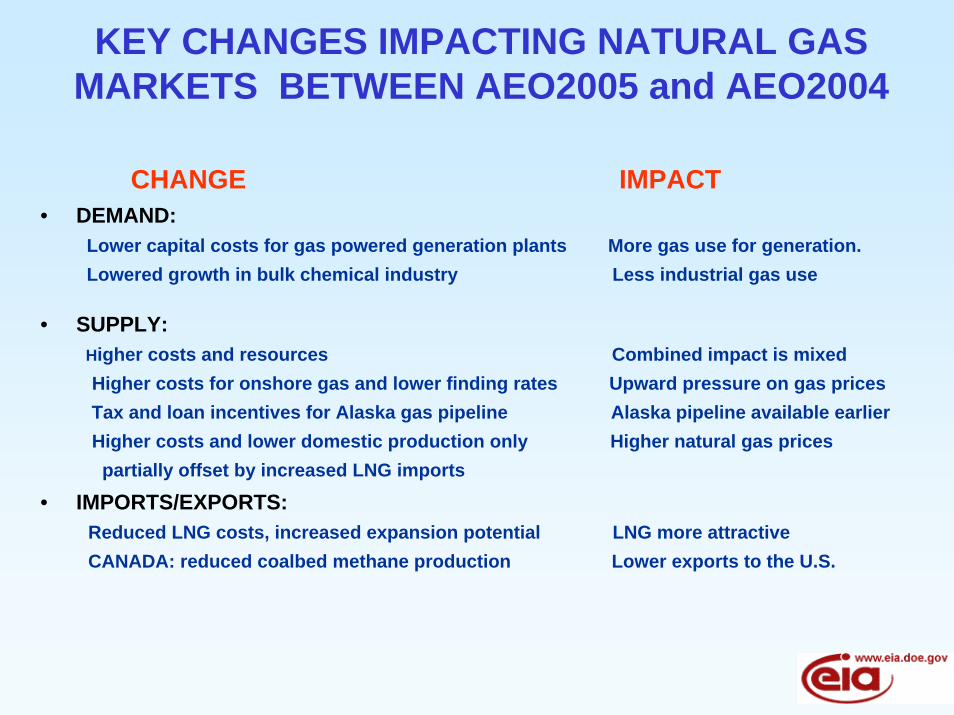
KEY CHANGES IMPACTING NATURAL GAS MARKETS BETWEEN AEO2005 and AEO2004
CHANGE IMPACT• DEMAND:
Lower capital costs for gas powered generation plants More gas use for generation.Lowered growth in bulk chemical industry Less industrial gas use
• SUPPLY:Higher costs and resources Combined impact is mixedHigher costs for onshore gas and lower finding rates Upward pressure on gas pricesTax and loan incentives for Alaska gas pipeline Alaska pipeline available earlierHigher costs and lower domestic production only Higher natural gas pricespartially offset by increased LNG imports
• IMPORTS/EXPORTS: Reduced LNG costs, increased expansion potential LNG more attractiveCANADA: reduced coalbed methane production Lower exports to the U.S.
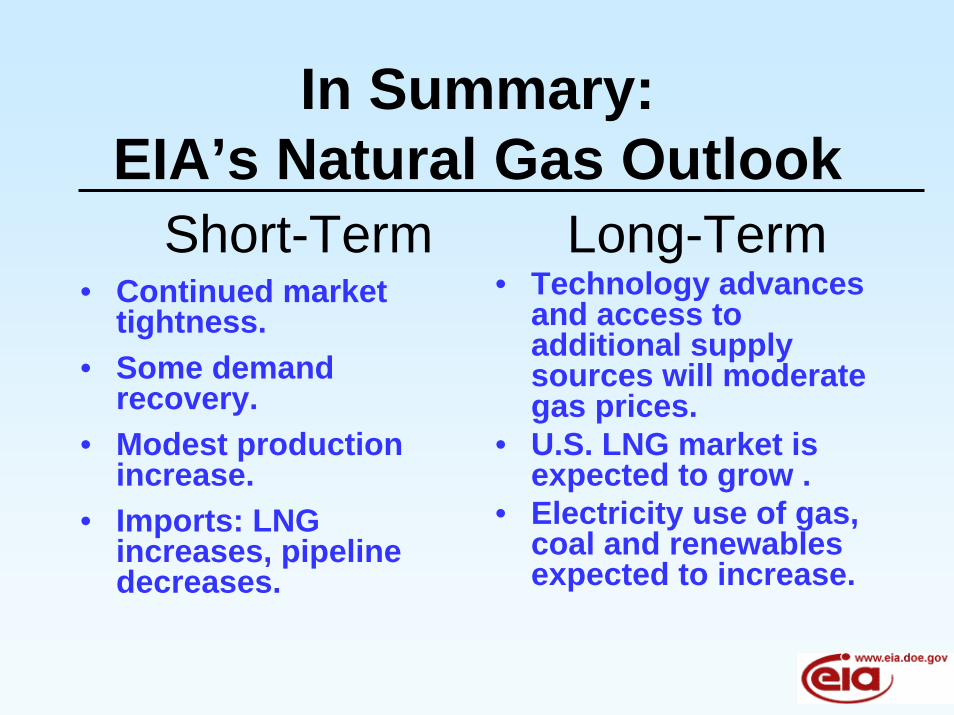
In Summary:EIA’s Natural Gas Outlook
Short-Term• Continued market
tightness. • Some demand
recovery.• Modest production
increase. • Imports: LNG
increases, pipeline decreases.
Long-Term• Technology advances
and access to additional supply sources will moderate gas prices.
• U.S. LNG market is expected to grow .
• Electricity use of gas, coal and renewablesexpected to increase.

www.eia.doe.gov