Embed Size (px)
Citation preview
Supporting Information.
shRNAmir-Ctrl Ave ± S.D.
(nmol/µg protein/hr)
shRNAmir-GLS Ave ± S.D.
(nmol/µg protein/hr) Leu +0.037 ± 0.018 +0.036 ± 0.007 Iso +0.036 ± 0.018 +0.035 ± 0.005 Val +0.029 ± 0.018 +0.024 ± 0.004 Ser +0.027 ± 0.008 +0.027 ± 0.004 Lys +0.027 ± 0.018 +0.021 ± 0.003 Thr +0.026 ± 0.019 +0.019 ± 0.003 Arg +0.016 ± 0.008 +0.013 ± 0.002 Cys +0.015 ± 0.007 +0.014 ± 0.002 Phe +0.014 ± 0.009 +0.011 ± 0.002 Gly +0.013 ± 0.008 +0.004 ± 0.002 Tyr +0.010 ± 0.008 +0.009 ± 0.001 Met +0.007 ± 0.004 +0.005 ± 0.001 His +0.007 ± 0.004 +0.005 ± 0.001 Try +0.001 ± 0.001 +0.000 ± 0.000 Orn -0.001 ± 0.001 -0.001 ± 0.001 Ala* -0.015 ± 0.001 -0.004 ± 0.001
* p = 0.007
Table S1: Amino acid utilization and secretion in LN229 cells expressing a control shRNAmir or an shRNAmir against GLS. Amino acids are ranked from the most rapidly consumed (positive values) to the most rapidly secreted (negative values). Glutamine and glutamate data from these cultures are in Fig. 1A. Data are the average ± SD for three independent 7-hour cultures.
Experiment 1 Experiment 2
Ctrl shRNAmir GLS shRNAmir Ctrl shRNAmir GLS shRNAmir C3/C4 0.25 0.39 0.19 0.31 Fc3 0.54 0.69 0.57 0.76 y 1.50 0.80 2.09 1.19 yRatio 0.53 0.57 GLU2 S 0.30 0.10 0.40 0.17 GLU2 D12 0.44 0.30 0.40 0.30 GLU2 D23 0.12 0.24 0.08 0.23 GLU2 Q 0.14 0.36 0.12 0.30
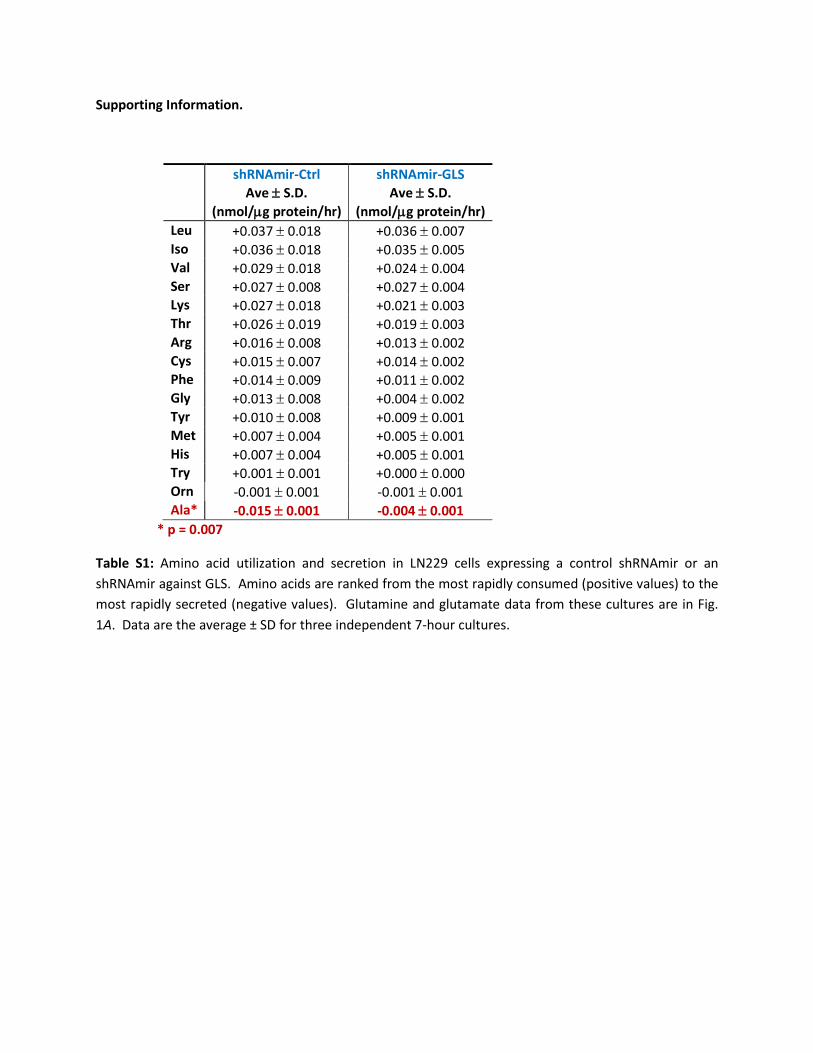
Table S2: Data from isotopomer analysis of 13C NMR spectra. Two independent experiments were performed; Experiment 1 generated the spectra in Fig. 2D. Isotopomers were analyzed and used to calculate fluxes according to published methods (1, 2) C3/C4 is defined as the total area of the glutamate C3 multiplet divided by the total area of the glutamate C4 multiplet. Fc3 is the fraction of acetyl-CoA that is 13C labeled in both carbons. To calculate this fraction, the doublet of doublets at glutamate C4 was multiplied by the ratio C4/C3. The rate of anaplerosis (y) relative to turning of the TCA cycle was estimated as described by Malloy et al (1) and assuming a large pool of unenriched anaplerotic substrate. yRatio is the ratio of y in the GLS shRNAmir cells to the Ctrl shRNAmir cells for each experiment. The values of 0.53 and 0.57 mean that anaplerosis fell by nearly half relative to TCA cycle flux. The other values are the relative contributions of the singlet (S), 1-2 doublet (D12) 2-3 doublet (D23) and doublet of doublets (quartet, Q) to the total area of the glutamate C2 multiplet (GLU2). Together these values represent the entire glutamate C2 area, and therefore their sum is 1.0. Note the increase in D23 and Q, and the decrease in D12, in the GLS shRNAmir cells.
Supporting Materials and Methods
Sequences for RNA interference: The following sequences were used in the vectors for RNA interference: shRNAmir-Ctrl (nonsilencing): 5’-TGCTGTTGACAGTGAGCGATCTCGCTTGGGCGAGAGTAAGTAGTGAAGCCACAGATGTACTTACTCTCGCCC AAGCGGAGTGCCTACTGCCTCGGA-3’ shRNAmir-GLS: 5’-TGCTGTTGACAGTGAGCGCCCACATAATCCTATGGTAAATTAGTGAAGCCACAGATGTAATTTACCATAGGATT ATGGGTTGCCTACTGCCTCGGA-3’ shGFP (control): 5’-GCCCGCAAGCTGACCCTGAAGTTCATTCAAGAGATGAACTTCAGGGTCAGCTTGCTTTTT-3’ shGLS: 5’-CCGGGCACAGACATGGTTGGTATATCTCGAGATATACCAACCATGTCTGTGCTTTTTG-3’ shRNAmir-PC (Fig. 2C): 5’-TGCTGTTGACAGTGAGCGAGCCCAGTTTATGGTGCAGAATTAGTGAAGCCACAGATGTA-3’ ShPC1 (Fig. 4): 5’-CCGGGCCAAGGAGAACAACGTAGATCTCGAGATCTACGTTGTTCTCCTTGGCTTTTTG-3’ ShPC2 (Fig. 4): 5’-CCGGCCTCAACTACTTGCCCAACATCTCGAGATGTTGGGCAAGTAGTTGAGGTTTTTG-3’ shPC (Fig. 5): 5’-CCGGCATGTTCATCTCTTGCCAAATCTCGAGATTTGGCAAGAGATGAACATGTTTTTG-3’ Cell cycle analysis: LN229 or SF-xL cells with control or GLS-targeting shRNAmirs were grown to 90%
confluence, then trypsinized and fixed with 50% ethanol at -20°C for 1 hour. DNA was labeled with
propidium iodide (Becton Dickinson) at 37°C for 15 minutes. Approximately 10,000 cells were collected for each assay, and analyzed using a FACSCalibur flow cytometer and Cell Quest software (Becton Dickinson).
Macromolecular synthesis assays: Cells were cultured in DMEM supplemented with 5 µCi of either D-[U-14C]-glucose or L-[U-14C]-glutamine (Perkin-Elmer). After the labeling period (see Figure legends), the cells were extracted using a modified Bligh-Dyer method as described previously (3). Lipids were recovered from the chloroform phase, evaporated to dryness, and reconstituted in a small amount of chloroform for scintillation counting. Proteins and nucleic acids were recovered from the interphase, pelleted and rinsed in methanol prior to scintillation counting.
Quantitative reverse transcriptase-polymerase chain reaction: RNA was harvested from 0.5-1.0 million cells using TRIzol Reagent (Invitrogen) or High Pure RNA Isolation Kit (Roche Applied Science) following the manufacturer’s user manual. cDNAs were synthesized with random hexamers using SuperScript II (Invitrogen) or with the iSCRIPT cDNA synthesis kit (BioRad). Gene-specific primers were designed using the on-line program D-LUX™ Designer Software from Invitrogen, and validated by analysis of template titration and dissociation curves. Primer sequences were:
Gene Name Accession # Sequence of Primers (5’ to 3’)
hGLS NM_014905 F: CAGTCTGGAGGAAAGGTTGCAG R: CAGACACACCCCACAAATCG
hGLS2 NM_013267 F: GAACAGAAAGACTATGACTCGCG R: CAACTTCGATGTGTCCTTCAGC
hPC NM_000920.3
F: GTACTACATGGGCTTGGCCG R: CCTTGATGCACAGGATGTGG
hRPL13A
NM_012423.2
F: AGCCACCCTGGAGGAGAAGA R: CTTCTCGGCCTGTTTCCG
10 µl qPCR reactions contained 25 ng of cDNA, each primer at 150 nM, and 5 µl of 2X SYBR Green PCR master mix (Applied Biosystems). Amplifications were performed on a 7900HT Fast Real-Time PCR System (Applied Biosystems) as described (4). Results of qPCR were evaluated by the comparative Ct method (user bulletin No.2, Perkin Elmer Life Sciences) using ribosomal protein L13a (RPL13A) as the invariant control gene.
ATP assay: One million cells were plated into 60-mm dishes and cultured for 48 hours. The cells were then rinsed in phosphate-buffered saline (PBS) and replenished with 2 mL of medium containing 4 mM or 0 mM glutamine. After seven hours the cells were collected in 1 mL of PBS, pelleted by centrifugation, and resuspended in 100µL lysis buffer (10mM Tris pH 7.5, 100mM NaCl, 1mM EDTA and 0.01%Triton X-100). ATP was measured by luminescence using a commercial kit (ATP Determination Kit, Invitrogen).
Measurement of 15NH4+: Enrichment in ammonia was measured essentially as described in Brosnan et al
(5). Ammonium from culture medium (50-100 µL) was converted to aminobutyrate by incubating with sodium oxobutyrate, glutamate dehydrogenase, and NADH (Sigma) for 30 min at 37oC. The sample was applied to an ion exchange column (AG 50W-X4, Bio-Rad), rinsed with water, and eluted with 4 N ammonium hydroxide. The eluates were evaporated and derivatized, then analyzed by GC/MS. The ratio of aminobutyrate m/z 130 (unenriched) and 131 (enriched) was measured for each sample, and the atom percent excess was calculated by comparing the ion ratio to a standard curve. Total ammonium, determined using a commercial kit (Megazyme), was multiplied by atom percent excess to yield nmoles of 15NH4
+.
Explanation of ions used in mass spectrometry experiments: Treatment with the derivatizing agent (Tri-Sil, Thermo) led to extensive addition of trimethylsilyl groups to all of the metabolites monitored in these experiments. To favor the formation of larger ions, the ionization source temperature was kept at 180oC. For every metabolite analyzed, abundant products containing all carbons from the parent molecule were formed and could be monitored for mass isotopomer analysis. The following derivatization products were monitored:
Citrate: 1,2,3-citric acid, 2-[(TMS)oxy]-, tris(TMS) ester, mass 480. Loss of one methyl group from TMS yielded an abundant molecule with a mass of 465.
Fumarate: 2-butenedioic acid (E)-, bis(TMS) ester, mass 245.
Malate: DL-Malic Acid, O-TMS-, bis(TMS) ester, mass 350. Formation of a product of mass 335 (formed through the loss of one methyl group from one of the TMS groups) was monitored.

Aspartate: L-Aspartic Acid, N-(TMS)-, bis(TMS) ester, mass 349. Loss of one methyl group from TMS yielded an abundant molecule with a mass of 334.
Legends for Supporting Figures:
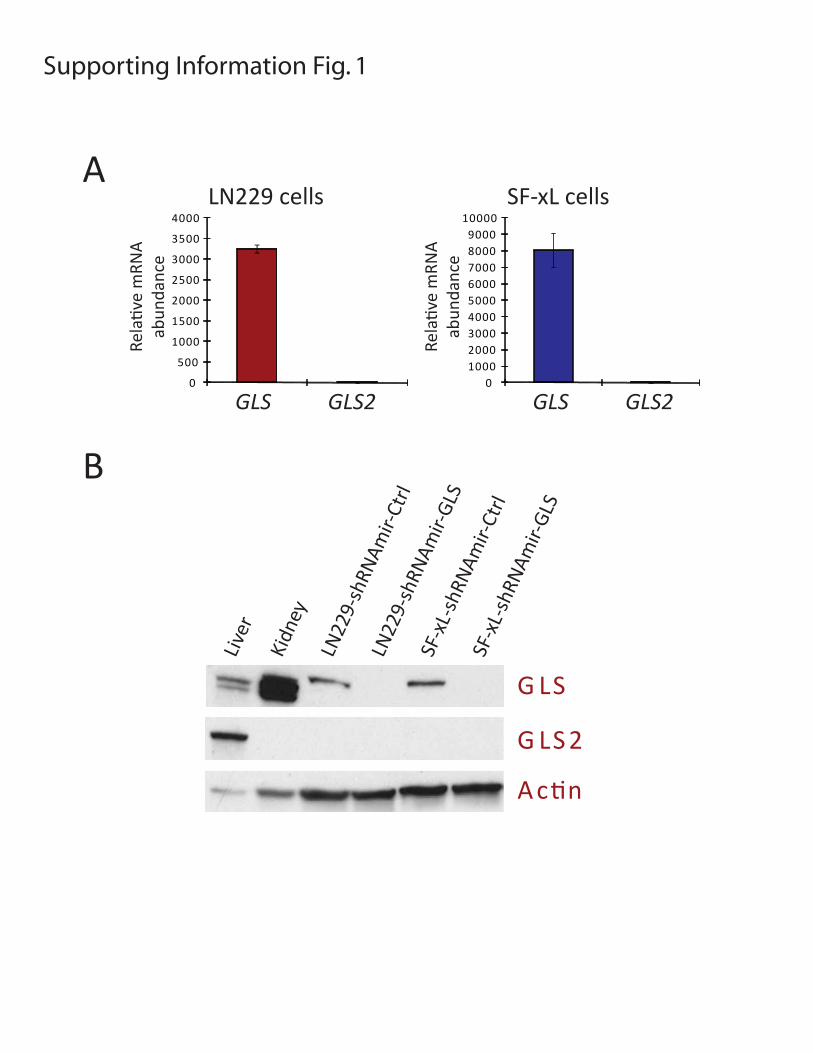
Figure S1: Expression of glutaminase isoforms in glioblastoma cells. A, Quantitative RT-PCR to determine relative abundance of GLS and GLS2 mRNAs in LN229 and SF-xL glioblastoma cells. B, Western blot for abundance of GLS and GLS2 protein in LN229 and SF-xL glioblastoma cells. Mouse liver protein is used as a positive control for GLS2, and mouse kidney protein is used as a positive control for GLS. No GLS2 protein was observed in these glioblastoma cells, even when GLS expression was silenced.
Figure S2: Effects of GLS silencing in SF-xL cells and tumors. A, Effect of GLS knockdown on nutrient utilization and metabolite secretion in SF-xL glioblastoma cells. Average and SD are shown for three independent 7-hour cultures. B, Growth of subcutaneous xenografts. n=5 tumors of each cell line for shRNAmirs (left), and 4 tumors of each cell line for shRNAs (right).
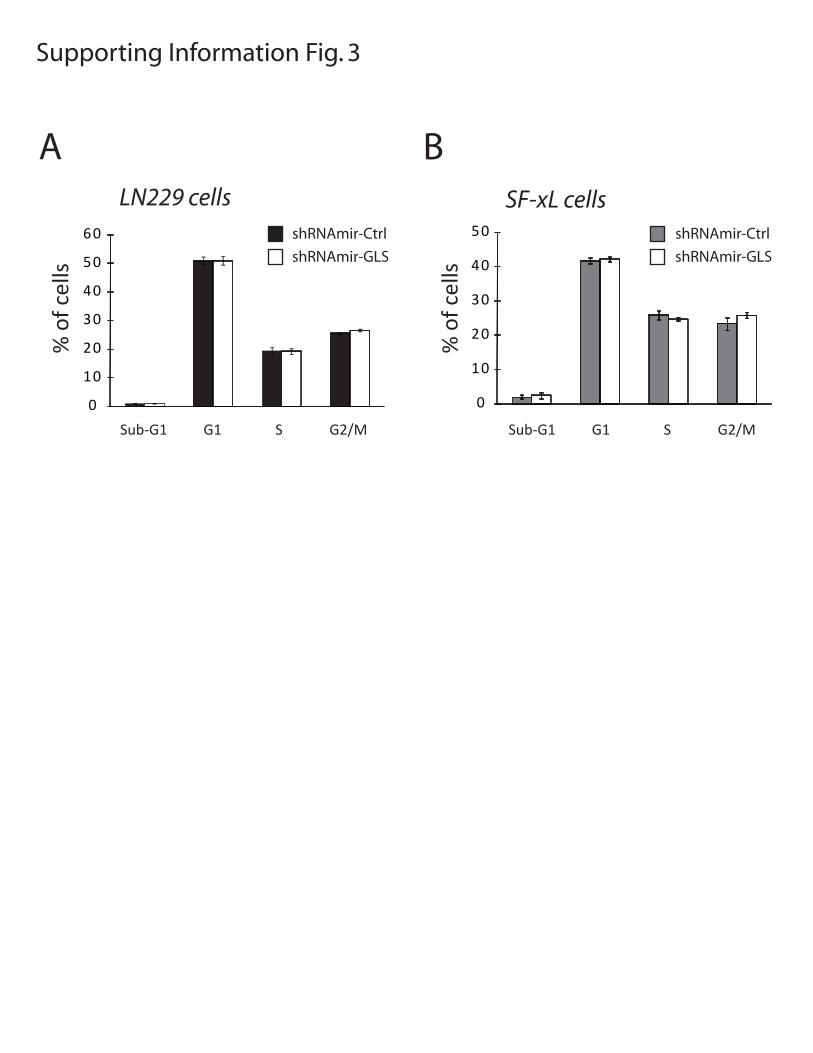
Figure S3: Effect of GLS silencing on cell cycle distribution. Cell cycle analysis on propidium iodide-stained LN229 (A) and SF-xL cells (B). Average and SD are shown for three independent cultures.
Figure S4: GLS silencing reduces glutamine-dependent lipid synthesis and increases the delivery of glucose carbon into pools of TCA cycle intermediates. A, Lipid synthesis in cells containing a control shRNAmir or an shRNAmir directed against GLS. The average and SEM are shown for three independent 1-day cultures. B, Enrichment of citrate and malate in SF-xL cells cultured with L-[3-13C]-glutamine. C, Enrichment of citrate and malate in cells cultured with D-[1,6-13C]-glucose. Data are the average ± SD of three independent 7-hour cultures.
Figure S5: Two possible mechanisms for increased 13C enrichment in TCA cycle metabolites of cells with suppressed GLS expression. The source of 13C in these experiments was D-[1,6-13C]-glucose. Filled blue symbols represent 13C. In the first scenario, the reduction of GLS activity limits the influx of
unlabeled glutamine-derived carbon to the TCA cycle via α-KG. 13C initially enters the cycle when glucose-derived acetyl-CoA (Ac-CoA) condenses with OAA, producing citrate (Cit) m+1. The Cit progresses around the cycle, delivering label into the pools of succinate, fumarate and malate (Succ/Fum/Mal) and oxaloacetate (OAA). The cartoon shows both possible positions of 13C within these molecules. The fractional enrichment in the OAA pool is increased compared to cells with active GLS, because less unlabeled anaplerotic substrate from glutamine enters the cycle. Therefore, there is a higher probability of condensing OAA m+1 with Ac-CoA m+1 on the second turn, producing Cit m+2. In the second scenario, activity of PC is induced. Glucose-derived pyruvate (Pyr) is carboxylated to produce OAA m+1. Equilibration with the succinate, fumarate and malate pools can occur because the enzymes connecting these metabolites are all reversible. Condensation of OAA m+1 with Ac-CoA m+1 produces Cit m+2 in the first turn of the TCA cycle. Abbreviations: PDH, pyruvate dehydrogenase; Glu, glutamate; Gln, glutamine.
Figure S6: Detailed description of labeling of glutamate isotopomers. A, This labeling scheme is included to aid the interpretation of the NMR spectra in Fig. 2D, especially the multiplet at glutamate

C2. The cells were cultured in medium containing D-[U-13C]-glucose. Here, filled blue symbols represent 13C. The scheme follows labeling through multiple rounds of the TCA cycle, shown as a linear pathway from left to right. The pathway above the dashed red line shows the effect of pyruvate carboxylation (PC) and the pathway below the red line shows the effect of unlabeled OAA originating from glutamine or other unlabeled precursors. Note that both pathways occur simultaneously, and the NMR spectra are the combined effect of all pathways. For simplicity, the scheme depicts only acetyl-CoA generated from glucose via pyruvate dehydrogenase (PDH); this acetyl-CoA is labeled in both carbons. B, Identification of peaks within the glutamate C2 multiplet. This multiplet is sensitive to labeling at carbons 1, 2 and 3 of glutamate. The illustration in panel A shows that if PC is active, D23 and Q appear as early as the 1st turn of the cycle. If PC is not active, these do not appear until the 3rd turn.
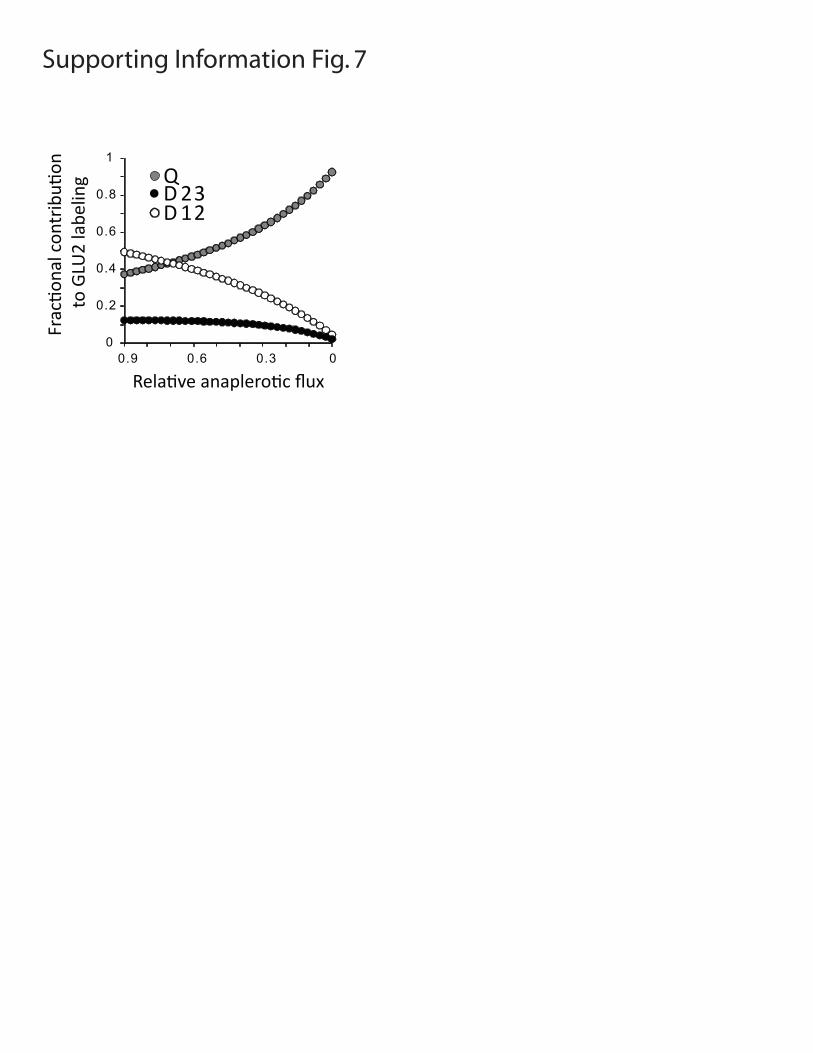
Figure S7: Predicted effect of decreasing glutamine-dependent anaplerosis on the fractional contribution of the quartet (Q), 2,3 doublet (D23) and 1,2 doublet (D12) to overall labeling in glutamate C2, during culture with D-[U-13C]-glucose. The data were generated using the modeling software tcaSIM with parameters of 95% 13C enrichment in pyruvate from D-[U-13C]-glucose and 35 turns of the TCA cycle. Note the progressive decline in D23, in contrast to the effect of increasing PC flux shown in Fig. 2B.
Figure S8: Metabolism of D-[3,4-13C]-glucose and [1-13C]-pyruvate. The source of 13C in these experiments was either D-[3,4-13C]-glucose or [1-13C]-pyruvate. In scenario 1, pyruvate dehydrogenase (PDH) is active but pyruvate carboxylase (PC) is inactive. Entry of carbon from pyruvate into the citrate pool therefore requires oxidative decarboxylation by the PDH complex to produce acetyl-CoA (Ac-CoA), releasing carbon 1 (and the 13C label) as CO2. No 13C enters the citrate (Cit) pool. In scenario 2, both PDH and PC are active. PC activity allows 13C to be transferred to oxaloacetate (OAA) and Cit. Abbreviations: Mal/Fum: malate/fumarate.
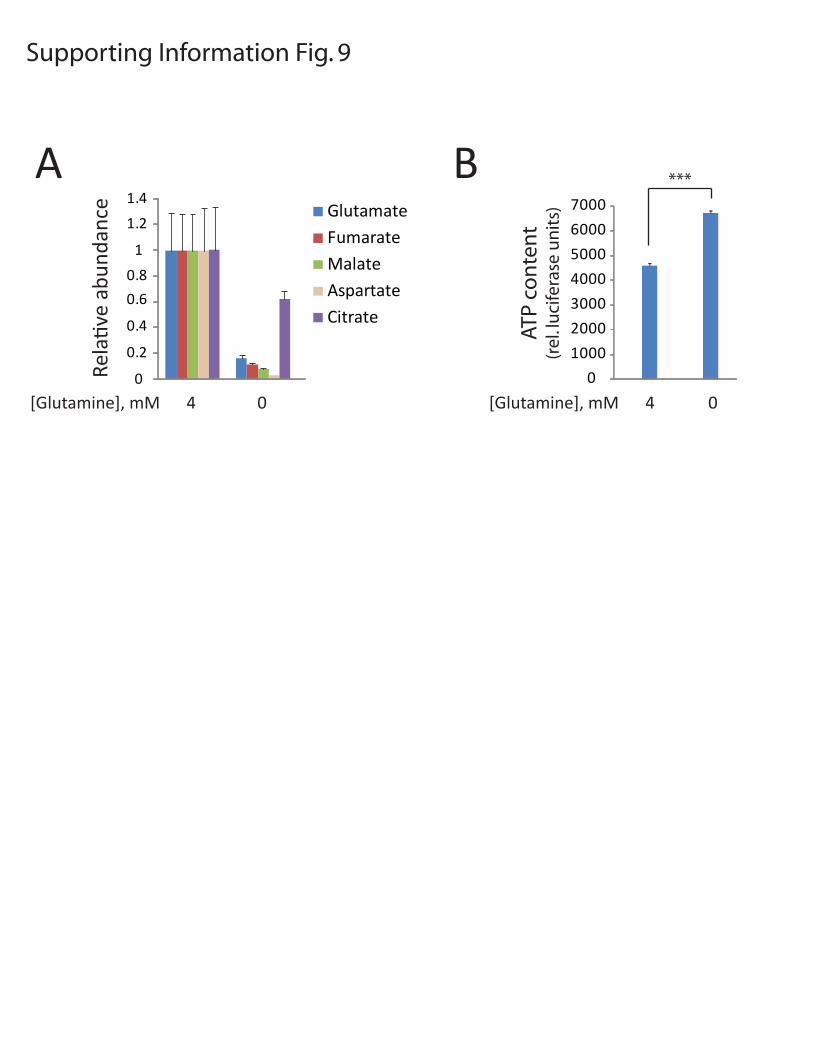
Figure S9: Abundance of intracellular metabolites in glutamine-replete and glutamine-deprived conditions. A, SF-xL cells were cultured in complete medium containing 4 mM glutamine, or deprived of glutamine for 7 hours. Metabolites were then extracted and analyzed by GC/MS. The area under the curve for each metabolite was compared to an internal standard (50 nmoles of sodium 2-oxobutyric acid) added to each extract, and this ratio was normalized to protein abundance from each culture. The abundance of each metabolite in glutamine-replete conditions was set to 1.0. The average and SD are shown for three independent cultures for each condition. B, ATP content was determined in cells cultured as in A. The average and SD are shown for three independent lysates. ***, p<0.0005.
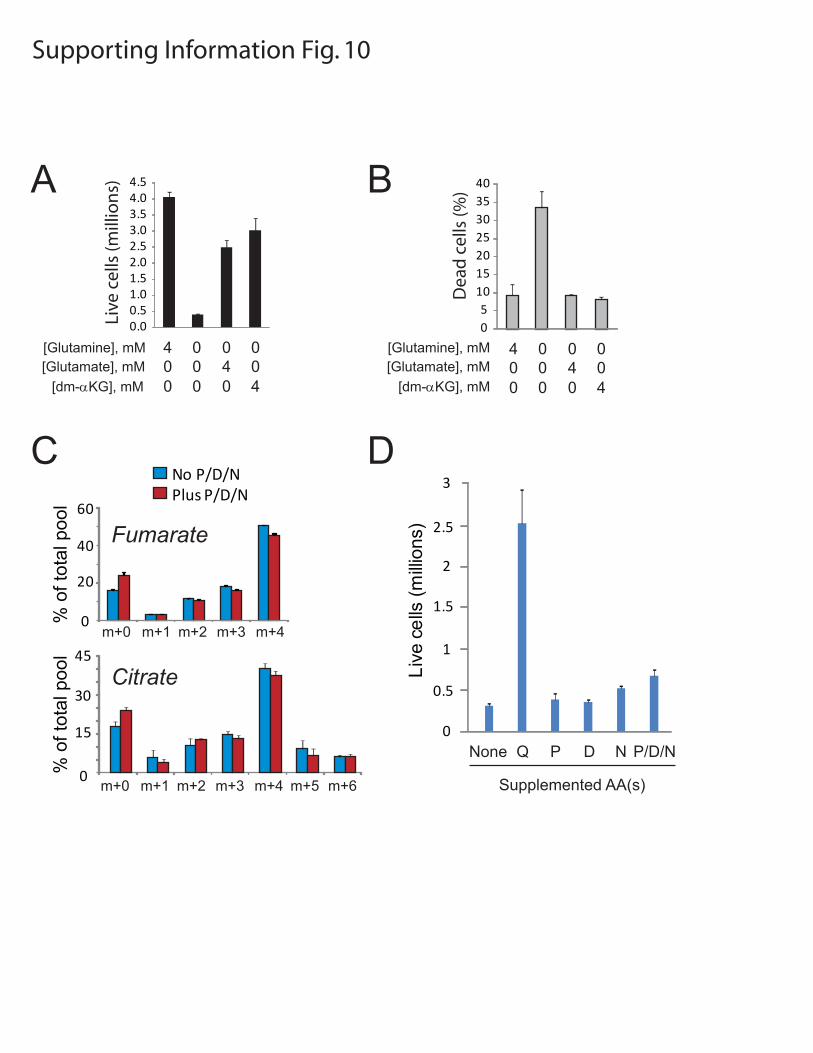
Figure S10: Alternative anaplerotic substrates in glioblastoma cells. Growth (A) and viability (B) of SF-xL cells were determined after 5 days in DMEM containing the indicated supplements. Glutamate and
dimethyl-α-ketoglutarate (dm-αKG) partially rescued growth and completely rescued viability in glutamine-deprived cells. C, SF-xL cells were cultured for 7 hours in DMEM containing 4 mM L-[U-13C]-glutamine, with or without three other amino acids with the potential to serve as anaplerotic precursors (P, proline; D, aspartate; N, asparagine). These amino acids were provided at concentrations normally
used in RPMI medium (proline 174 µM; aspartate 150 µM; asparagine 379 µM). GC/MS was then used to determine 13C enrichment in intracellular metabolites generated through anaplerosis. D, SF-xL cells
were plated at 2x10⁵/well in 6-well dishes and cultured for 3 days in DMEM either lacking or containing the indicated amino acids. The medium also contained 10 mM glucose and all of the other amino acids standard for DMEM. All data are reported as the average and SD of three independent cultures.
Figure S11: Pyruvate carboxylase mRNA expression and glucose consumption in glutamine-independent SF-xL cells. A, Quantitative RT-PCR to determine the abundance of the pyruvate carboxylase transcript (PC) relative to a control transcript (hRPL13A). In this experiment, the parental SF-xL cells were either grown in complete medium containing glutamine, or acutely deprived of glutamine for 7 hours. The glutamine-independent (aSF-xL) cells were chronically grown in 0 mM glutamine, or acutely given glutamine-replete medium for 7 hours. B, Cells were cultured as in panel A. Medium was collected after 7 hours and analyzed for glucose consumption. The absence of glutamine did not alter glucose consumption in either cell line, although the aSF-xL cells consumed less glucose than the parent cells. All data are reported as the average and SD of three independent cultures.
Figure S12: Glutamine-independent cells require pyruvate carboxylase to produce macromolecules from glucose, but only in the absence of glutamine. Glutamine-independent cells expressing a control shRNA (GFP) or an shRNA against pyruvate carboxylase (PC1) were cultured in medium supplemented with D-[U-14C]-glucose. In the presence of 4 mM glutamine, expression of PC was not required to generate 14C-labeled lipids or other macromolecules. However, in the absence of glutamine, PC silencing caused a significant reduction in macromolecular labeling. The average and SEM of three independent 1-day cultures are shown for each condition.
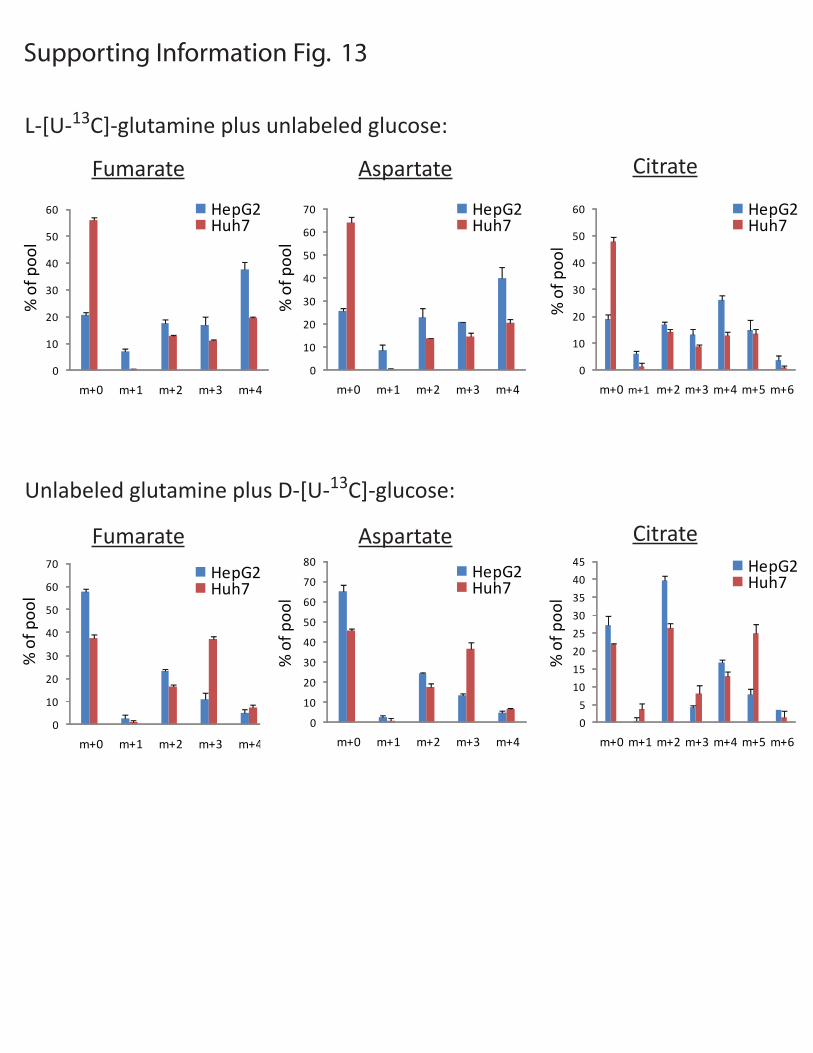
Figure S13: Anaplerosis in HepG2 and Huh-7 cells. HepG2 and Huh-7 cells were cultured in DMEM containing 10 mM unlabeled glucose and 4 mM L-[U-13C]-glutamine (top) or 10 mM D-[U-13C]-glucose and 4 mM unlabeled glutamine (bottom). After 7 hours, cellular metabolites were extracted and analyzed by GC/MS. In the top panel, the labeling in HepG2 cells revealed that the majority of fumarate, aspartate and citrate was derived from glutamine (m+0 is 25% or less). The large m+4 fractions are derived from the first turn of the TCA cycle, whereas the m+2 and m+3 are derived from subsequent turns. In the Huh-7 cells, these metabolite pools contain significantly less carbon from glutamine (m+0 is 45% or more). Thus glutamine is not the major source of carbon for the TCA cycle in Huh-7 cells. In
both cell lines, citrate m+5 likely results from reductive carboxylation of glutamine-derived α-KG, forming citrate (6). In the bottom panel, labeling with D-[U-13C]-glucose led to higher enrichment in Huh-7 cells than HepG2 cells. Aspartate m+3 (the transamination product of OAA m+3) and fumarate m+3 likely arise from pyruvate carboxylation. Citrate m+5 likely arises from the condensation of OAA m+3 (from pyruvate carboxylation) and acetyl-CoA m+2 (from pyruvate dehydrogenase). Together, the data demonstrate robust glutamine-dependent anaplerosis in HepG2 cells, whereas labeling in Huh-7 cells is more consistent with pyruvate carboxylase-mediated anaplerosis. Proof of pyruvate carboxylation in the Huh-7 cells is shown in Fig. 5A. All data are reported as the average and SD of three independent cultures.
Supporting References
1. Malloy CR, Sherry AD, & Jeffrey FM (1987) Carbon flux through citric acid cycle pathways in perfused heart by 13C NMR spectroscopy. FEBS Lett 212(1):58-62.
2. Malloy CR, Sherry AD, & Jeffrey FM (1990) Analysis of tricarboxylic acid cycle of the heart using 13C isotope isomers. Am J Physiol 259(3 Pt 2):H987-995.
3. DeBerardinis RJ, Lum JJ, & Thompson CB (2006) Phosphatidylinositol 3-kinase-dependent modulation of carnitine palmitoyltransferase 1A expression regulates lipid metabolism during hematopoietic cell growth. J Biol Chem 281(49):37372-37380.
4. Kurrasch DM, Huang J, Wilkie TM, & Repa JJ (2004) Quantitative real-time polymerase chain reaction measurement of regulators of G-protein signaling mRNA levels in mouse tissues. Methods Enzymol 389:3-15.
5. Brosnan JT, et al. (2001) Alanine metabolism in the perfused rat liver. Studies with (15)N. J Biol Chem 276(34):31876-31882.
6. Yoo H, Antoniewicz MR, Stephanopoulos G, & Kelleher JK (2008) Quantifying reductive carboxylation flux of glutamine to lipid in a brown adipocyte cell line. J Biol Chem 283(30):20621-20627.
Supporting Information Fig. 1
0
500
1000
1500
2000
2500
3000
3500
4000
0100020003000400050006000700080009000
10000
LN229 cells SF-xL cells
Rela
tive
mRN
Aab
unda
nce
Rela
tive
mRN
Aab
unda
nce
GLS GLS2 GLS GLS2
Live
r
Kidn
ey
G LS
G LS 2
A ctin
A
B
LN22
9-sh
RNAm
ir-Ct
rlLN
229-
shRN
Amir-
GLS
SF-x
L-sh
RNAm
ir-Ct
rlSF
-xL-
shRN
Amir-
GLS

A
(nm
ol/μ
g/hr
)
sh R NAmir-C tr lsh R NAmir-G L S
-3.0-2.5-2.0-1.5-1.0-0.5
00.51.01.52.0
∆Gluc ∆Lac ∆Gln ∆Glu (n
mol
/μg/
hr)
Ctrl GLSGLS
Actin
shRNA
sh G F Psh G L S
300600900
1,2001,500
1,800
00 10 20 30 40 50
V
ol (m
m3 )
Days
shRNAmir-CtrlshRNAmir-GLS
0
5001,0001,5002,0002,5003,000
0 10 20 30 40
V
ol (m
m3 )
Days
shGFPshGLS
Supporting Information Fig. 2
B
∆Gluc ∆Lac ∆Gln ∆Glu
Ctrl GLSGLS
Actin
shRNAmir
-3.0-2.5-2.0-1.5-1.0
-0.50
0.51.01.52.0
-3.5
0
10
20
30
40
50
60
Sub-G1 G1 S G2/M
0
10
20
30
40
50
Sub-G1 G1 S G2/M
% o
f cel
ls
% o
f cel
ls
Supporting Information Fig. 3
shRNAmir-Ctrl
shRNAmir-GLS
LN229 cells SF-xL cells
A B
shRNAmir-Ctrl
shRNAmir-GLS

% o
f tot
al p
ool
% o
f tot
al p
ool
GFP GLS
Malate M+1Label: D-[1,6- C]-glucose13
Malate M+1Label: L-[3- C]-glutamine13
01020304050607080
Citrate M+1
% o
f tot
al p
ool
01020304050607080
GFP GLSGFP GLS
% o
f tot
al p
ool
GFP GLS
Citrate M+2
02
B
Supporting Information Fig. 4
C
shRNA: shRNA:
468
101214161820
02468
101214161820
A
0500
1000150020002500300035004000
CP
M/m
illio
n ce
lls
Lipid synthesis from L-[U-14C]-glutamine
Ctrl GLSshRNAmir:0
5001000150020002500300035004000
CP
M/m
illio
n ce
lls
Lipid synthesis from D-[U-14C]-glucose
Ctrl GLSshRNAmir:

PDHPyr
Cit m+1
OAAm+1
Succ/Fum/Malm+1
OAA
TCA cycle
Glucose
1st turn
2nd turn
Cit m+2
Gln
Glu
GLS
PDHPCPyr
α-KG m+2
OAAm+1
Succ/Fum/Malm+1
TCA cycle
Glucose
Gln
Glu
GLS
Scenario 1: Reduced anaplerosis relative to TCA cycle activity; PC inactive
Scenario 2: Increased PC flux realtive to TCA cycle activity
Supporting Information Fig. 5
Ac-CoAAc-CoA
1 6 1 6
3
2
1 56
α-KG1 5
1 5
1 5
1 4
1 4
1 56
1 56
1 4
3
2 Cit m+2
1 4
1 56
1 5
1 56
1 5

PDHPyr
OAA
Succ/Fum/Mal
Glucose
1st turn
Ac-CoA
1 6
3
2
α-KG/Glutamate
1 5
1 4
1 4
PC1 5
6
Citrate
1 4
OAAAc-CoA
2nd turn 1 56
α-KG/Glutamate
1 5 1 4
OAAAc-CoA
3rd turn 1 56
α-KG/Glutamate
1 5
{ {
1 4
OAA
unlabeledOAA
{
Ac-CoA
4th turn 1 56
{
α-KG/Glutamate
1 5
{{1 5
61 5 1 4
1 56
1 5
1 4
Citrate Citrate Citrate
1 5
GLU2
MultipletS
D12D23
Q
2 3 4
56.2 56.0 55.8 55.6 55.4 55.2 55.0 54.8 54.6
S
QQQQ
D12 D12
D23 D23
GLU2 multiplet
Chemical shift (ppm)54.4
A
B
Supporting Information Fig. 6
12C13CEither 12C or 13C
unlabeledGlutamine
Other unlabeledprecursors
0
0.2
0.4
0.6
0.8
1
00.30.60.9
Q
D 12D 23
Relative anaplerotic flux
Supporting Information Fig. 7Fr
actio
nal c
ontr
ibuti
on
to G
LU2
labe
ling

Scenario 1: PDH active, PC inactive Scenario 2: Both PDH and PC active
Supporting Information Fig. 8
PDHPC
OAAm+1
Pyr
Cit m+1
Mal/Fumm+1
Ac-CoA
1
1 4
1 4
1 56
1 56
PDH
OAAm+0
Pyr
Cit m+0
Mal/Fumm+0
Ac-CoA
1
1 4
1 4
1 56
1 56
Glucose3 4
Glucose3 4
0
1000
2000
3000
4000
5000
6000
7000
ATP
con
ten
t(r
el. l
uci
fera
se u
nit
s)
Supporting Information Fig. 9
0
0.2
0.4
0.6
0.8
1
1.2
1.4GlutamateFumarateMalateAspartateCitrate
[Glutamine], mM 4 0
Rela
tive
abun
danc
e
A B
[Glutamine], mM 4 0
***
0
0.5
1
1.5
2
2.5
3
Live
cel
ls (m
illion
s)
Supplemented AA(s)
None Q P D N P/D/N
0.00.51.01.52.02.53.03.54.04.5
Live
cel
ls (m
illio
ns)
[Glutamine], mM[Glutamate], mM
[dm-αKG], mM
44
4
0 0 000
0 000
05
10152025303540
Dea
d c
ells
(%)
44
4
0 0 000
0 000[dm-αKG], mM
m+60
15
45
0
20
40
60
No P/D/NPlus P/D/N
m+0 m+1 m+2 m+3 m+4
m+0 m+1 m+2 m+3 m+4 m+5
Fumarate
Citrate30
% o
f tot
al p
ool
% o
f tot
al p
ool
A B
C D
Supporting Information Fig. 10
[Glutamine], mM[Glutamate], mM

0.0 0.2 0.4 0.6 0.8 1.0 1.2 1.4 1.6 1.8
PC m
RNA
(rel
ative
abu
ndan
ce)
[Glutamine], mM 4 0 4 0
SF-xL aSF-xL
Supporting Information Fig. 11
0
0.5
1
1.5
2
2.5
Glu
cose
uti
lizat
ion
(nm
ole
s/µg
pro
tein
/hr)
[Glutamine], mM 4 0 4 0
SF-xL aSF-xL
A BA

010002000300040005000600070008000
CP
M/m
illio
n ce
lls
Lipid synthesis from D-[U-14C]-glucose
GFP PC1shRNA GFP PC1[Glutamine], mM 0 0 4 4
0
2000
4000
6000
8000
10000
12000
Protein/nucleic acid synthesis from D-[U-14C]-glucose
CP
M/m
illio
n ce
llsGFP PC1shRNA GFP PC1
[Glutamine], mM 0 0 4 4
Supporting Information Fig. 12
0
10
20
30
40
50
60
m+0 m+1 m+2 m+3 m+4 m+5 m+6
% o
f poo
l
0
5
10
15
20
25
30
35
40
45
m+0 m+1 m+2 m+3 m+4 m+5 m+6
% o
f poo
l
Citrate
0
10
20
30
40
50
60
m+0 m+1 m+2 m+3 m+4
% o
f poo
l
HepG2Huh7
0
10
20
30
40
50
60
70
m+0 m+1 m+2 m+3 m+4
% o
f poo
l
Fumarate Aspartate
Supporting Information Fig. 13
0
10
20
30
40
50
60
70
m+0 m+1 m+2 m+3 m+4
0
10
20
30
40
50
60
70
80
m+0 m+1 m+2 m+3 m+4
HepG2Huh7
HepG2Huh7
HepG2Huh7
HepG2Huh7
HepG2Huh7
% o
f poo
l%
of p
ool
CitrateFumarate Aspartate
L-[U-13C]-glutamine plus unlabeled glucose:
Unlabeled glutamine plus D-[U-13C]-glucose: