Embed Size (px)
Citation preview
Strong interaction at interface of carbon fiber reinforced aromaticsemicrystalline thermoplastics
Tie Qi Li a,b, Ming Qiu Zhanga,* , Han Min Zengc
aMaterials Science Institute, Zhongshan University, Guangzhou 510275, People’s Republic of ChinabDepartment of Materials Science and Engineering, Guangdong University of Technology, Guangzhou 510090, People’s Republic of China
cLaboratory of Polymeric Composite and Functional Materials, The State Educational Commission of China, Zhongshan University, Guangzhou 510275,People’s Republic of China
Received 17 June 1998; received in revised form 18 August 1998; accepted 9 September 1998
Abstract
The interfacial structure of carbon fiber/polyetheretherketone (CF/PEEK) composites has been studied with Raman and X-ray photo-electron spectroscopy. Analysis of the fibers isolated from the composites proved that the polymer segments tended to form stronginteractions with the fiber on the surface. Study of the fiber with a thin layer of PEEK coating further revealed that melting of the polymerplays an important role in forming the strong interfacial interaction. In connection with the above experimental results obtained from modelsystems with extremely low polymer content, the physical nature of the interfacial interaction is known through Raman spectroscopicobservation of actual composites. Electronic matching between graphite crystallites of carbon fiber and the segments in special conformationis proved to be among the most important features of the intercalation-type interaction.q 1999 Elsevier Science Ltd. All rights reserved.
Keywords:Semicrystalline thermoplastics; Interfacial interaction; Composites
1. Introduction
It is known that stress transfer efficiency in a polymercomposite depends on the structure between reinforcementand the matrix [1–5]. Characterization of the interfacialstructure, however, is generally difficult [6,7], becausematerials in the interfacial region, referred to as an inter-phase or interlayer, occupy a small volume percentage ofthe composite.
In the case of thermosetting composites, the problem wascircumvented through experimental studies on modelsystems, usually consisting of a substrate similar to thecomposite reinforcement and pre-polymers of interest [8–12]. By means of thermal and viscoelastic studies of prac-tical composites [13], it was finally revealed that the inter-phase is the transitional region between organic componentsand an inorganic phase [12–15]. Strong interfacial interac-tions on the short-range, namely chemical bonds [9], andweak interfacial interactions such as a hydrogen bond [11],have been proved to be among the principal factors thatcontribute to stress transfer.
With respect to thermoplastic composites, interfacialstructure is less understood. While dispersive bonds canalso be expected to be present at the interface, strongshort-range interactions other than that through end groupsof polymers has not been known to the authors’ knowledge.This makes it difficult to understand the enhancement ofinterfacial adhesion with a rise in processing temperatureor in melt residual time found in aromatic polymer compo-sites such as carbon fiber reinforced polycarbonate (PC)[16,17] and polyetheretherketone (PEEK) [18–22].
To solve the dilemma, a high strength PAN-based carbonfiber and the polymer PEEK were chosen in the presentwork. Fibers isolated from the composites were studied tosee whether there is a strong interaction between the twocomponents. The structure of the fibers coated with a thinlayer of PEEK was characterized to probe into the effects ofpolymer melting. Based on the results from these modelsystems, Raman spectra of practical high-volume contentcomposites were analyzed with the objective to reveal thenature of the short-range fiber–polymer interaction.
2. Experimental
The polymer, Victrex PEEK, with viscosity molecular
Polymer 40 (1999) 4307–4313
0032-3861/99/$ - see front matterq 1999 Elsevier Science Ltd. All rights reserved.PII: S0032-3861(98)00658-2
* Corresponding author: Tel.:1 86-20-84186300 ext. 2576; Fax:1 86-20-84186564.
E-mail address:[email protected] (M.Q. Zhang)
weight of 29 300, and the 16-ply APC-2 laminates (consist-ing of AS4 carbon fiber and PEEK with fiber fraction of60 vol.%) were produced by ICI. The PAN-based carbonfiber, AS4, is a size-free product of Hercules. The AS4/PEEK prepregs were prepared by the AeromaterialResearch Institute, Beijing, through the powder pre-impreg-nation method. Both the APC-2 laminates and the AS4/PEEK prepregs used the untreated, size-free Hercules AS4as reinforcement.
Two types of Ply-Simulated-Laminates (PSL) [22] in the
form of [016] and [(0/90)2]8 laminates, referred to as unidir-ectional composites (UDC) and cross-ply laminates (XDL)in the following text, were molded from the prepreg with amatched mold in a programmable hot-press, one withconstitutive ply number,nCL, of four and the other withnCL � 2. A thermosetting polyimide film 50mm thick wasused as the separation film. The cooling rate was keptconstant at2 208C/min for all laminate preparation.
Carbon fibers in the prepregs and the laminates wereseparated from the matrix polymer with either sulfuricacid and/or chlorophenol. When sulfuric acid was used, a25× 25 mm2 composite specimen was kept in the acid for afortnight at room temperature. The obtained fiber bundles(AS4–S) were then washed with enough 0.1 N sodiumcarbonate solution and then with sufficient deionizedwater. Extraction with chlorophenol was performed in aSoxhlet apparatus for over 60 h. The isolated fiber bundles(AS4–Cl) were further extracted with acetone for 12 h toremove any residual solvent. All these fibers were thenvacuum-dried at room temperature and will be referred toas ‘extracted fibers’ in this paper. Gravimetric measurementrevealed that the fiber content in the composites studied hereis no less than 0.6675 by weight.
To obtain PEEK coated carbon fibers, bundles of AS4fiber, hand-wound on a polytetrafluoroethylene (PTFE)fixture, were immersed in a chlorophenol solution ofPEEK and de-gassed in a vacuum oven at 1508C for15 min. Excess solution was then squeezed off with anotherPTFE blade. The AS4 fiber soaked in the PEEK solution inthis way was then vacuum-dried at 1508C to remove thesolvent. Supposing the fiber bundle has a random-stackedcross-section and the amount of residual solvent is negli-gible, then the average thickness of the resin layer on thefiber surface can be estimated by:df ��1 1 wf =2�1=2 2 1�=2, inwhich df is the fiber diameter andwf the weight concentra-tion of polymer solution. Melting of the coated fiber wasperformed using a nitrogen-purged stove. The stove allowedthe heating and cooling rates to be 208C/min. The highesttemperature during the treatment was 4008C.
X-ray photoelectron spectra (XPS) were collected with aVacuum Generators’ Escalb MK II X-ray photoelectronspectrometer. Typical resolution was 0.8 eV at 240 W(Mg Ka , 12 kV). For purposes of correction of specimencharging, the C1s bands were calibrated by assuming thebinding energy of the benzene peak to be 284.6 eV. Fouriertransform Raman (FT-Raman) spectra were obtained withback-scattering geometry in a Bruker RS100 FT-Ramanspectrometer (laser source, Nd31:YAG at 1064 nm, power,40–60 mW, sampling step, 4 cm21). Each spectrum was thecumulative result of 500 scans unless otherwise notified.The major problem in collecting composite spectra arosefrom a thermal band, centered around 3160 cm21 with aLorentzian profile. Absorption by carbon fiber and thepoor thermal conductivity of the polymer were believed tobe the main causes for this noise. The problem was circum-vented by either sampling over a narrow wavenumber range
T.Q. Li et al. / Polymer 40 (1999) 4307–43134308
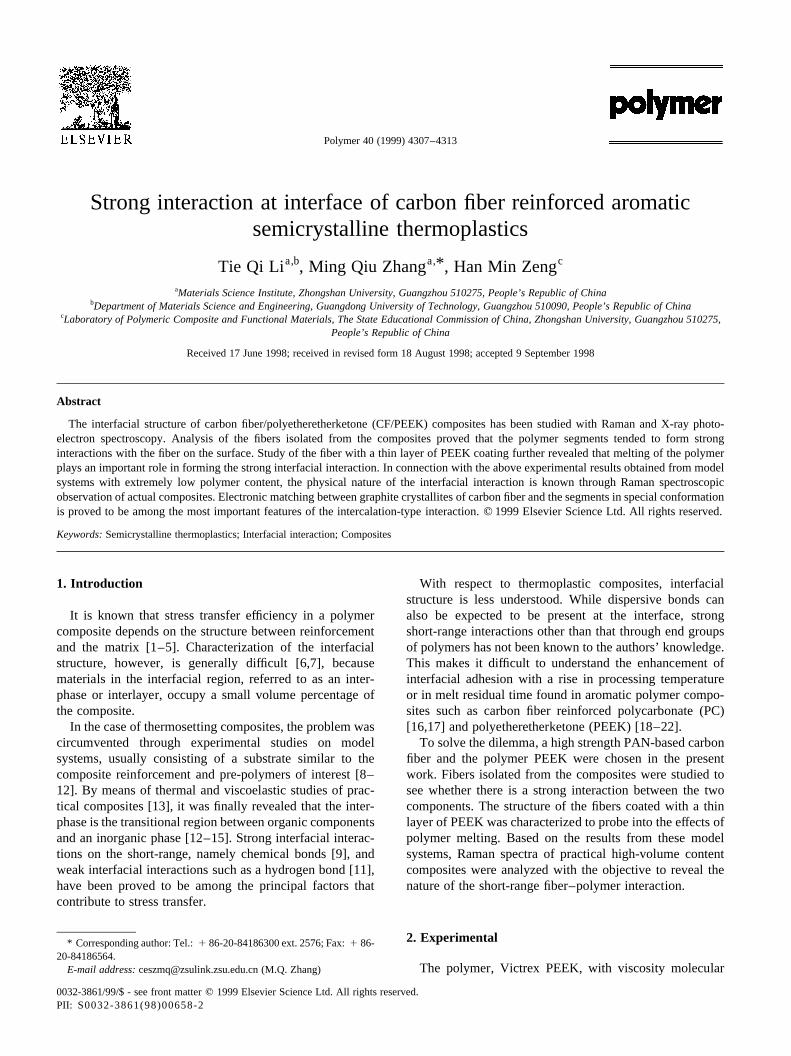
Fig. 1. XPS spectra of AS4 carbon fibers as-received and the extractedversions from APC-2 laminates: (a) O1s, (b) N1s, (c) C1s. Spectra were allnormalized to avoid effects of fiber alignment.
(for fibers) or by subtracting a best-fit Lorentzian compo-nent centered around 3200 cm21 with about 600 cm21 width(for composites). When Raman bands have to be subtractedfrom an as-measured composite spectrum, the Lorentzianthermal band was subtracted from the latter at first, andthen it was normalized over the wavenumber range between100 and 3500 cm21 according to the strength of the1145 cm21 PEEK skeleton vibration band [23]. A resinspectrum, which had also been normalized according tothe PEEK skeleton band, was further subtracted from theobtained spectrum. Whenever spectra deconvolution had tobe performed, Lorentzian functions were adopted.
3. Results and discussion
3.1. Structure of the extracted fibers
The results of the XPS study are presented in Fig. 1(a)–(c), illustrating O1s, N1s and C1s spectra of the AS4 fibersas-received and of the fibers isolated from APC-2 compo-sites, respectively. According to the calculated surfacecomposition of the fibers (Table 1), it can be seen thatcontents of chloride, sodium and sulfur in the extractedfibers are much lower than the oxygen fraction, suggestingnegligible effects of the residual solvents. The nitrogencontent of the original AS4 fiber determined in this workagrees well with the literature data [24]. In comparison tothis, the lower nitrogen content of the surfaces of theextracted fibers is indicative of fiber surface modificationsresulting from either the extraction or melt processing of thecomposites. Nitrogen is usually rich on the surface layer,
dozens of nanons thick in the PAN-based carbon fiber [25].The mean free path of the C1s and N1s photoelectrons fromordinary polymers is of the order of 3 nm [26]. With theemission angle of the photoelectron being 908 in the presentXPS experiments, the sampling depths of the photoelectronhere should be about 10 nm. This means that removal of thenitrogen-containing layer from the fiber is unimaginable. Asa result, the decrease in nitrogen content of the extractedfibers strongly suggests the existence of an anchored layer ofthe aromatic polymer that muffled the fiber surface duringmelt processing with a thickness that is identical to thesampling depth of the photoelectron, i.e. 10 nm [26].
Although specimen charging and mathematical uncer-tainty in C1s deconvolution prevent the authors fromanalyzing the exact composition of the fiber surface, C1sand O1s profiles would further confirm the analysis. FromFig. 1(a), it can be found that oxygen 1s spectra of the acid-extracted fibers lost the two-component feature that charac-terized AS4 fiber surface. Oxidization by the concentratedsulfuric acid near the fiber surface can be expected duringextraction. In contrast, O1s profile of the fibers isolated bychlorophenol shows no more than an increase in relativecontent of oxygen atoms in a more reductive chemicalenvironment.
Similarly, C1s spectra also show the difference betweenthe extracted fibers and the as-received one. From Fig. 1(c),it can be seen that there is no distinctivep–p* peak on thespectra of these three sorts of fibers. Leveling-off at bindingenergy higher than 291 eV can be found instead, indicatingthat the surface of the fibers is highly aromatic and possessesa complex structure. The smoothly decreasing shoulderbetween the peak at 284.6 eV and the carboxyl 289 eV, onthe other hand, suggests the diversity in the chemical envir-onment of the C–O and CyO bonds. Therefore, highershoulder intensity of C1s spectra of the extracted fibers(Fig. 1(c)) manifests that more carbon atoms should takethe form of diphenyl ether and ketone in the extracted fibers.Considering the fact that oxygen on the AS4 fiber surface ispredominantly presented in the form of phenol and carboxyl[27], the above results show clearly that there is an anchoredlayer of etheretherketone segments on the surface of theextracted fibers. The strong interaction between fibersurface and polymer matrix can be formed only throughthe processing.
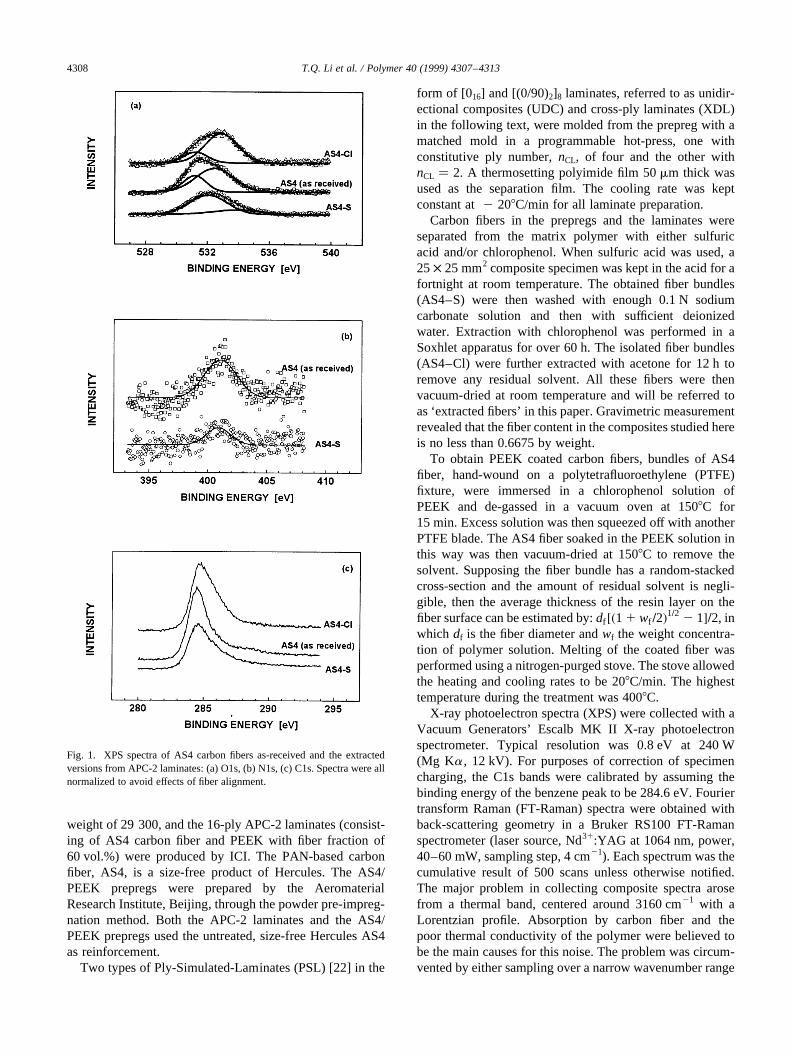
Fig. 2 illustrates the FT-Raman spectrum of the carbonfiber isolated from AS4/PEEK prepregs with chlorophenolextraction. It can be seen that the spectrum is characterizedby the two broad bands centered around 1600 and1290 cm21, respectively. Since the AS4 fiber is a PAN-based carbon fiber consisting of highly orientated graphitecrystallites [24], the two bands should be attributed to themicro-crystalline structure of graphite. The results of latticedynamics [28] show that the zone-center optical modes ofgraphite can be expressed as
G � A2u 1 2B2g 1 E1u 1 2E2g �1�
T.Q. Li et al. / Polymer 40 (1999) 4307–4313 4309
Table 1Surface composition of carbon fibersa
Fiber C/C N/C O/C Cl/C Na/C S/C
AS4 100 4.188 21.07 — 0.381 —AS4–Cl 100 — 20.12 1.091 — —AS4–S 100 1.731 20.72 0.247 0.742 0.742
a Atomic ratio based on carbon.
Fig. 2. FT-Raman spectrum of the carbon fibers extracted from its PEEKpowder prepregs by chlorophenol.
Except for the optical-inactiveB2g and the infrared-activeA2u andE1u modes, the Raman-active mode,E2g, was foundat 42 and 1581 cm21. For micro-crystalline graphite, Tuinis-tra and Koenig [29] discovered another mode,A1g, at1355 cm21, which was believed to be related to the crystalboundary. The scattering intensity ratio,I(E2g)/I(A1g), wasfound to be related to the micro-crystalline ordering andbulk modulus of the graphite fiber [29] and used in charac-terizing graphitization of carbon fibers [30]. In addition, theRaman shift ofE2g was applied to a micromechanics inves-tigation of carbon fiber reinforced composites [31]. There-fore, the band at 1600 cm21 in Fig. 2 no doubt belongs to theE2g mode of the carbon fiber.
Although the lattice dynamics of theA1g mode remain asubject for debate [28], its dispersive nature dictates that
the Raman band should depend on the exciting frequency.In fact, Vidano and co-workers [32] have found adecrease in the Raman shift by 35 cm21 per 5000 cm21
of exciting wavenumber when the exciting wavelengthincreased. A similar property ofAg mode was alsoobserved in polyacetylene [33]. In consideration of thefact that the laser source of the current work emittedradiation with a wavelength of 1.064mm, which was11 093 cm21 lower in wavenumber than that used byTuinistra and Koenig [29], theA1g mode should appearat 1277 cm21. Fig. 2 shows that the experimental result isin good agreement with the prediction. That is, the1290 cm21 band can be confirmed as the dispersivebranch of A1g, indicating that the carbon fiber,compounded with polyetheretherketone, still possesses amicro-crystalline graphite structure of the turbostraticcarbon.
On the other hand, the observed Raman shifts of theextracted fibers are all higher than the theoreticalvalues, which implies an oxidative chemical environ-ment at the edge of the graphite crystallites. Becausethe two Raman modes are related to the lattice of thegraphite micro-crystals in nature, violet shifts of thiskind demonstrate that the oxygen-containing functionalgroups of the matrix resin must have formed certain de-localized electron structures coupled with graphite crys-tallites. In comparison with the XPS results, it can beconcluded that the ether and ketone groups of PEEK inthe interfacial region tended to be in conjugation withthe graphite layers of carbon fiber. In other words, elec-tron interaction between the organic component and thefiber may be an additional aspect of the interfacialstructure in the composite.
T.Q. Li et al. / Polymer 40 (1999) 4307–43134310
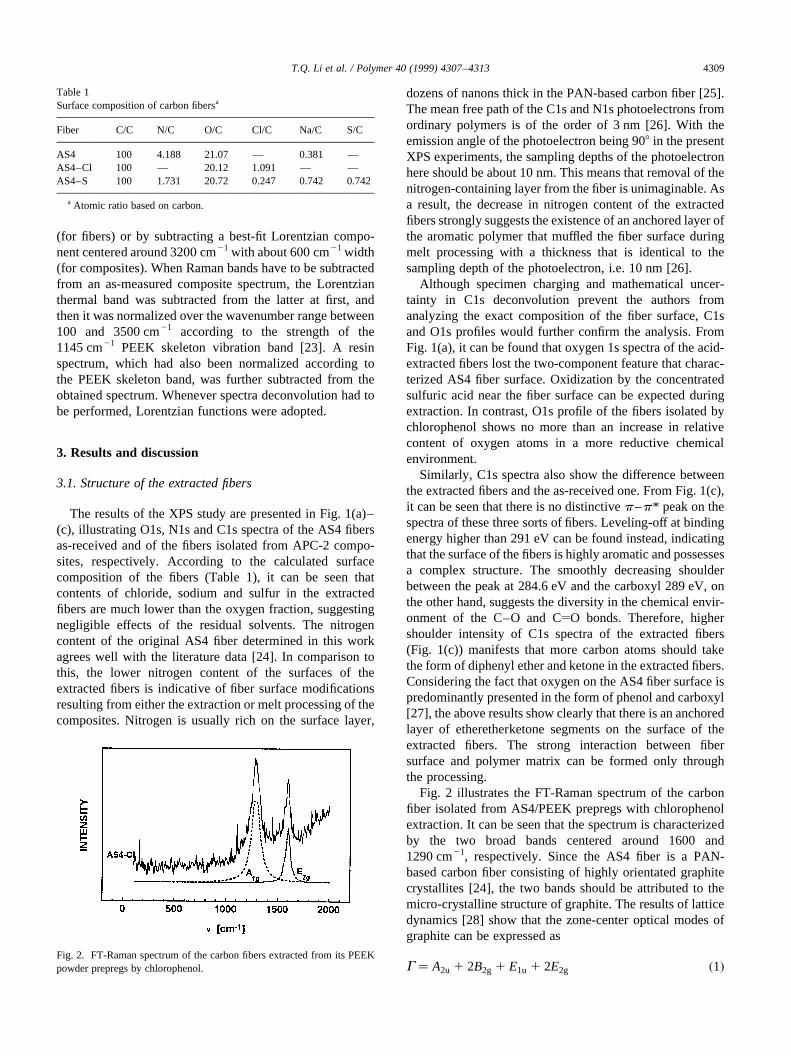
Fig. 3. Raman bands of the coated fibers in comparison to those of theuncoated version. (Each spectrum was obtained with 2000 scans and hadbeen normalized to intensity of its lower wavenumber fluorescence peak, ataround 281 cm21, before subtraction. Estimated coating thickness: 4.7 nm.)
Table 2Tentative assignment of the fiber surface Raman bands
Assignment AS4 AS4 with PEEK coating AS4 with PEEK coating, melted Usual activitya
IR RS
CyO stretch 1651.2 1653.1 1651.2 s s6-member ring stretch 1591.4 1608.8 — s s(quadrant) 1574.1 1576.0 1576.0Carbon fiber skeleton (5-member ring)
1550.9 1552.8 1552.8 d d
6-member ring stretchb (semi-circle)
1512.3 1516.2 — s w or n
1485.4 1487.3 1496.9Carbon fiber skeleton (transCH rock)
1450.6 1450.6 1450.6 m to s
PEEK skeletonb (cis CH rock) — 1414.0 — s nring C–O vibration 1369.6
1321.41388.91307.9
1369.61302.2
s to w n
C–O–C skeleton vibration 1157.5 1142.1 1124.7 m s to mCF skeleton (conj. CyC) 1109.3 1109.3 1109.3 s to myCH wagging 926.1 916.4 955.0 s wring bending 839.3 833.5 835.4
a s: strong; d: both active; w: weak; n: non-active; m: active with moderate intensity.b Aromatic ether and ketone band normally only IR-active in PEEK.
3.2. Structure of the thin layer of PEEK coated on a carbonfiber
The AS4 carbon fiber coated with a thin layer of PEEKwas studied to simulate the formation of the above interfa-cial structure. Fig. 3 illustrates the FT-Raman spectra of theAS4 fiber, the fiber coated with PEEK, and the coated fiberthat had experienced heat treatment at 4008C, respectively.In order to analyze the surface functional groups, the spectrawere collected with 2000 scans. It was found that with alonger sampling time, the thermal band (centered around3200 cm21) was much stronger and resulted in large uncer-tainty in analyzing Raman bands with moderate width ofdozens of reciprocal centimeters. Several narrow bands thatrelated to functional groups of the fibers (Table 2), however,are quite distinctive in the spectra. Taking notice of the factthat the relative intensities of these bands are close to whatwas found with shorter sampling time (Fig. 2), the fourstrongest bands (1063, 1109, 1451 and 1651 cm21) can beassigned to the conjugated sp2 carbon in the turbostraticpacking of graphite layers of carbon fibers and theoxygen-containing groups on the fiber surface. Intensities
and Raman shifts of these bands are almost the same in thesethree spectra (Fig. 3), supporting the above argument thatthe bulk structure of the carbon fiber remained unchangedthrough wetting with PEEK.
Unlike the above four stronger bands, Raman scatteringat around 1500 cm21 is quite different in the three spectra. Inthe spectrum of the un-coated AS4 fiber, there is no discern-ible feature within this range of wavenumber. In contrast, adoublet at 1512/1485 cm21 can be found in the spectrum ofthe coated fiber, which further turned to the 1497 cm21 bandin that of the melted coating version. Since XPS study of thecoated fiber shows no more than coverage of the fibersurface by the polymer, the bands should be attributed topolyetheretherketone. The quadrant stretching mode of therings, which is observable usually only in infrared-activeneat PEEK [34,35], also became Raman-active when thepolymer was adjacent to the carbon fiber surface. Due tothe fact that a change in a vibrational mode from IR-activeto Raman-active reflects an increase in polarizability [36],the above result suggests that the electron structure of PEEKnear the fiber surface must be more de-localized than usual.Obviously, PEEK in this special conformation can form anelectron interaction with the graphite layers of the carbonfiber.
3.3. Interfacial Raman spectra of AS4/PEEK composites
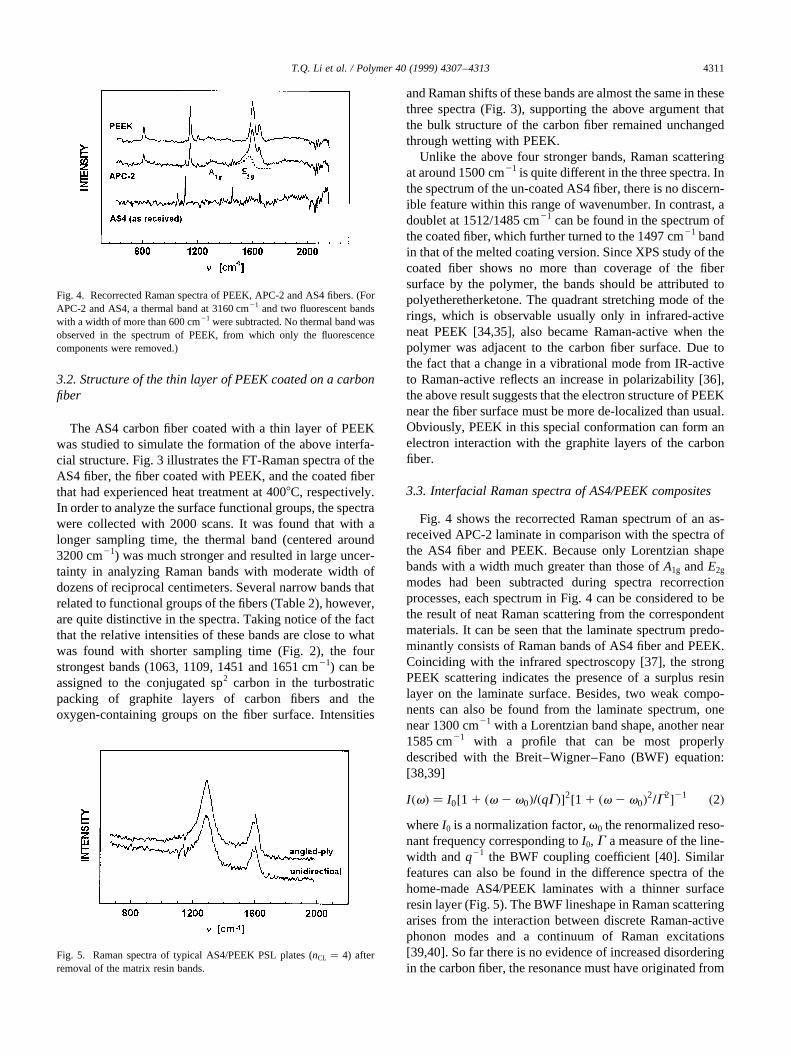
Fig. 4 shows the recorrected Raman spectrum of an as-received APC-2 laminate in comparison with the spectra ofthe AS4 fiber and PEEK. Because only Lorentzian shapebands with a width much greater than those ofA1g andE2g
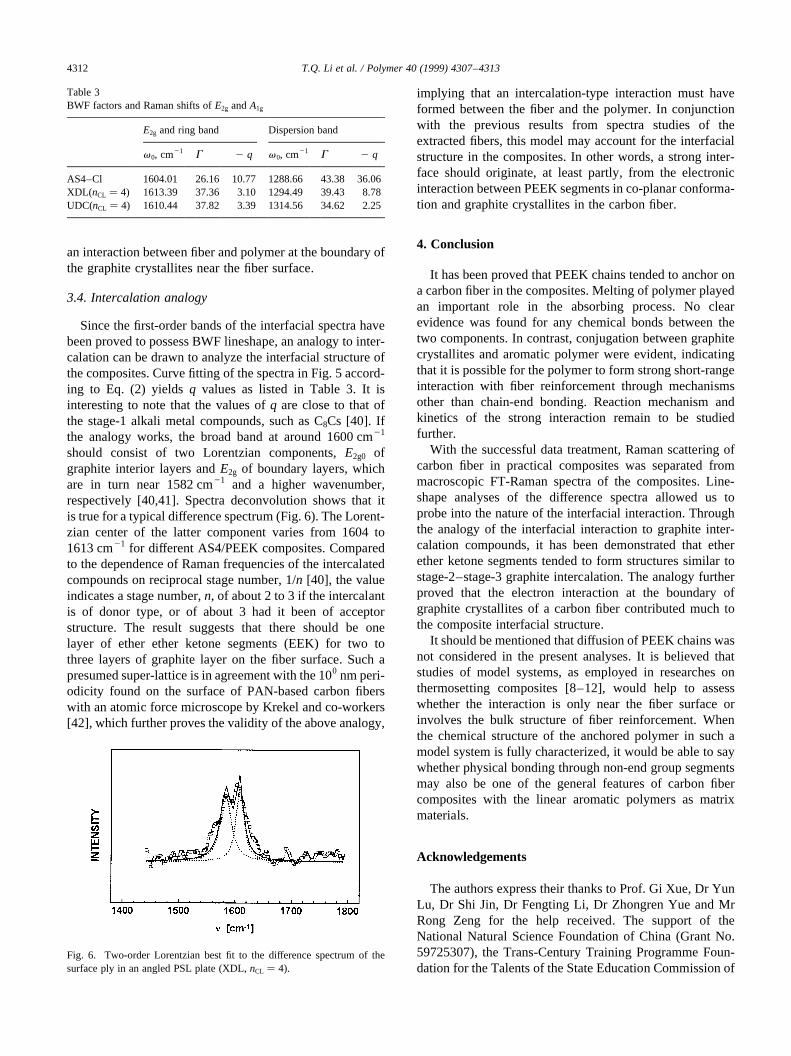
modes had been subtracted during spectra recorrectionprocesses, each spectrum in Fig. 4 can be considered to bethe result of neat Raman scattering from the correspondentmaterials. It can be seen that the laminate spectrum predo-minantly consists of Raman bands of AS4 fiber and PEEK.Coinciding with the infrared spectroscopy [37], the strongPEEK scattering indicates the presence of a surplus resinlayer on the laminate surface. Besides, two weak compo-nents can also be found from the laminate spectrum, onenear 1300 cm21 with a Lorentzian band shape, another near1585 cm21 with a profile that can be most properlydescribed with the Breit–Wigner–Fano (BWF) equation:[38,39]
I �v� � I0�1 1 �v 2 v0�=�qG��2�1 1 �v 2 v0�2=G2�21 �2�whereI0 is a normalization factor,v0 the renormalized reso-nant frequency corresponding toI0, G a measure of the line-width andq21 the BWF coupling coefficient [40]. Similarfeatures can also be found in the difference spectra of thehome-made AS4/PEEK laminates with a thinner surfaceresin layer (Fig. 5). The BWF lineshape in Raman scatteringarises from the interaction between discrete Raman-activephonon modes and a continuum of Raman excitations[39,40]. So far there is no evidence of increased disorderingin the carbon fiber, the resonance must have originated from
T.Q. Li et al. / Polymer 40 (1999) 4307–4313 4311
Fig. 4. Recorrected Raman spectra of PEEK, APC-2 and AS4 fibers. (ForAPC-2 and AS4, a thermal band at 3160 cm21 and two fluorescent bandswith a width of more than 600 cm21 were subtracted. No thermal band wasobserved in the spectrum of PEEK, from which only the fluorescencecomponents were removed.)
Fig. 5. Raman spectra of typical AS4/PEEK PSL plates (nCL � 4) afterremoval of the matrix resin bands.
an interaction between fiber and polymer at the boundary ofthe graphite crystallites near the fiber surface.
3.4. Intercalation analogy
Since the first-order bands of the interfacial spectra havebeen proved to possess BWF lineshape, an analogy to inter-calation can be drawn to analyze the interfacial structure ofthe composites. Curve fitting of the spectra in Fig. 5 accord-ing to Eq. (2) yieldsq values as listed in Table 3. It isinteresting to note that the values ofq are close to that ofthe stage-1 alkali metal compounds, such as C8Cs [40]. Ifthe analogy works, the broad band at around 1600 cm21
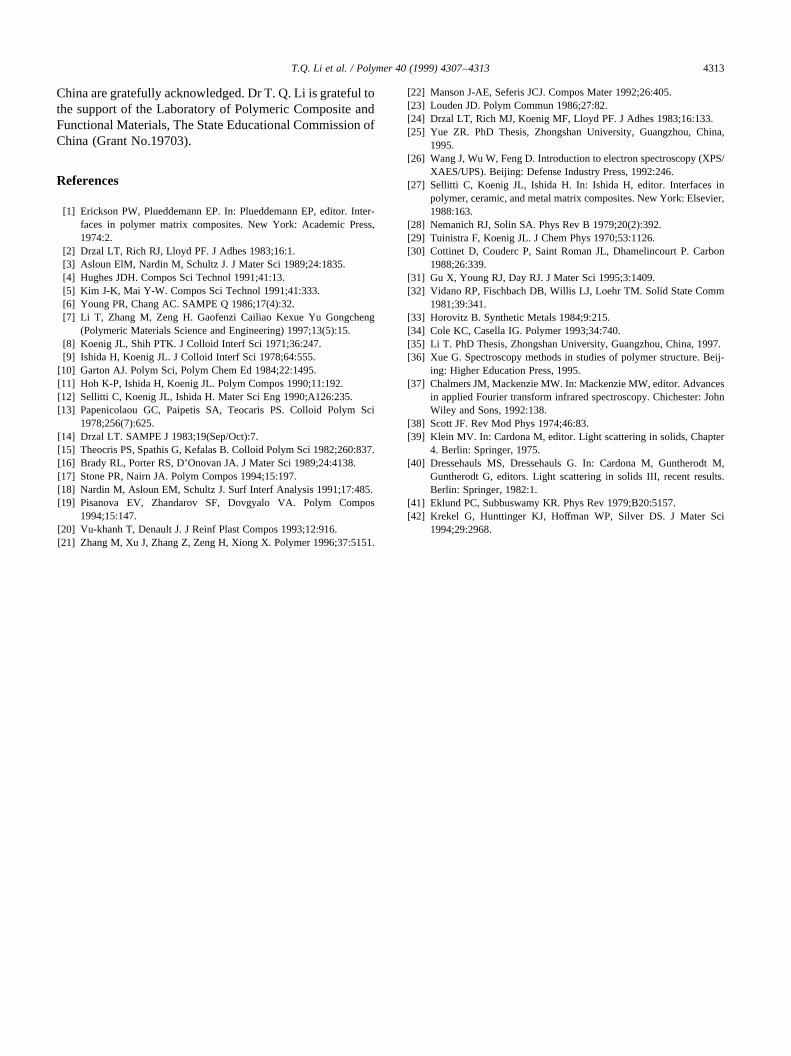
should consist of two Lorentzian components,E2g0 ofgraphite interior layers andE2g of boundary layers, whichare in turn near 1582 cm21 and a higher wavenumber,respectively [40,41]. Spectra deconvolution shows that itis true for a typical difference spectrum (Fig. 6). The Lorent-zian center of the latter component varies from 1604 to1613 cm21 for different AS4/PEEK composites. Comparedto the dependence of Raman frequencies of the intercalatedcompounds on reciprocal stage number, 1/n [40], the valueindicates a stage number,n, of about 2 to 3 if the intercalantis of donor type, or of about 3 had it been of acceptorstructure. The result suggests that there should be onelayer of ether ether ketone segments (EEK) for two tothree layers of graphite layer on the fiber surface. Such apresumed super-lattice is in agreement with the 100 nm peri-odicity found on the surface of PAN-based carbon fiberswith an atomic force microscope by Krekel and co-workers[42], which further proves the validity of the above analogy,
implying that an intercalation-type interaction must haveformed between the fiber and the polymer. In conjunctionwith the previous results from spectra studies of theextracted fibers, this model may account for the interfacialstructure in the composites. In other words, a strong inter-face should originate, at least partly, from the electronicinteraction between PEEK segments in co-planar conforma-tion and graphite crystallites in the carbon fiber.
4. Conclusion
It has been proved that PEEK chains tended to anchor ona carbon fiber in the composites. Melting of polymer playedan important role in the absorbing process. No clearevidence was found for any chemical bonds between thetwo components. In contrast, conjugation between graphitecrystallites and aromatic polymer were evident, indicatingthat it is possible for the polymer to form strong short-rangeinteraction with fiber reinforcement through mechanismsother than chain-end bonding. Reaction mechanism andkinetics of the strong interaction remain to be studiedfurther.
With the successful data treatment, Raman scattering ofcarbon fiber in practical composites was separated frommacroscopic FT-Raman spectra of the composites. Line-shape analyses of the difference spectra allowed us toprobe into the nature of the interfacial interaction. Throughthe analogy of the interfacial interaction to graphite inter-calation compounds, it has been demonstrated that etherether ketone segments tended to form structures similar tostage-2–stage-3 graphite intercalation. The analogy furtherproved that the electron interaction at the boundary ofgraphite crystallites of a carbon fiber contributed much tothe composite interfacial structure.
It should be mentioned that diffusion of PEEK chains wasnot considered in the present analyses. It is believed thatstudies of model systems, as employed in researches onthermosetting composites [8–12], would help to assesswhether the interaction is only near the fiber surface orinvolves the bulk structure of fiber reinforcement. Whenthe chemical structure of the anchored polymer in such amodel system is fully characterized, it would be able to saywhether physical bonding through non-end group segmentsmay also be one of the general features of carbon fibercomposites with the linear aromatic polymers as matrixmaterials.
Acknowledgements
The authors express their thanks to Prof. Gi Xue, Dr YunLu, Dr Shi Jin, Dr Fengting Li, Dr Zhongren Yue and MrRong Zeng for the help received. The support of theNational Natural Science Foundation of China (Grant No.59725307), the Trans-Century Training Programme Foun-dation for the Talents of the State Education Commission of
T.Q. Li et al. / Polymer 40 (1999) 4307–43134312
Table 3BWF factors and Raman shifts ofE2g andA1g
E2g and ring band Dispersion band
v0, cm21 G 2 q v0, cm21 G 2 q
AS4–Cl 1604.01 26.16 10.77 1288.66 43.38 36.06XDL(nCL � 4) 1613.39 37.36 3.10 1294.49 39.43 8.78UDC(nCL � 4) 1610.44 37.82 3.39 1314.56 34.62 2.25
Fig. 6. Two-order Lorentzian best fit to the difference spectrum of thesurface ply in an angled PSL plate (XDL,nCL � 4).
China are gratefully acknowledged. Dr T. Q. Li is grateful tothe support of the Laboratory of Polymeric Composite andFunctional Materials, The State Educational Commission ofChina (Grant No.19703).
References
[1] Erickson PW, Plueddemann EP. In: Plueddemann EP, editor. Inter-faces in polymer matrix composites. New York: Academic Press,1974:2.
[2] Drzal LT, Rich RJ, Lloyd PF. J Adhes 1983;16:1.[3] Asloun ElM, Nardin M, Schultz J. J Mater Sci 1989;24:1835.[4] Hughes JDH. Compos Sci Technol 1991;41:13.[5] Kim J-K, Mai Y-W. Compos Sci Technol 1991;41:333.[6] Young PR, Chang AC. SAMPE Q 1986;17(4):32.[7] Li T, Zhang M, Zeng H. Gaofenzi Cailiao Kexue Yu Gongcheng
(Polymeric Materials Science and Engineering) 1997;13(5):15.[8] Koenig JL, Shih PTK. J Colloid Interf Sci 1971;36:247.[9] Ishida H, Koenig JL. J Colloid Interf Sci 1978;64:555.
[10] Garton AJ. Polym Sci, Polym Chem Ed 1984;22:1495.[11] Hoh K-P, Ishida H, Koenig JL. Polym Compos 1990;11:192.[12] Sellitti C, Koenig JL, Ishida H. Mater Sci Eng 1990;A126:235.[13] Papenicolaou GC, Paipetis SA, Teocaris PS. Colloid Polym Sci
1978;256(7):625.[14] Drzal LT. SAMPE J 1983;19(Sep/Oct):7.[15] Theocris PS, Spathis G, Kefalas B. Colloid Polym Sci 1982;260:837.[16] Brady RL, Porter RS, D’Onovan JA. J Mater Sci 1989;24:4138.[17] Stone PR, Nairn JA. Polym Compos 1994;15:197.[18] Nardin M, Asloun EM, Schultz J. Surf Interf Analysis 1991;17:485.[19] Pisanova EV, Zhandarov SF, Dovgyalo VA. Polym Compos
1994;15:147.[20] Vu-khanh T, Denault J. J Reinf Plast Compos 1993;12:916.[21] Zhang M, Xu J, Zhang Z, Zeng H, Xiong X. Polymer 1996;37:5151.
[22] Manson J-AE, Seferis JCJ. Compos Mater 1992;26:405.[23] Louden JD. Polym Commun 1986;27:82.[24] Drzal LT, Rich MJ, Koenig MF, Lloyd PF. J Adhes 1983;16:133.[25] Yue ZR. PhD Thesis, Zhongshan University, Guangzhou, China,
1995.[26] Wang J, Wu W, Feng D. Introduction to electron spectroscopy (XPS/
XAES/UPS). Beijing: Defense Industry Press, 1992:246.[27] Sellitti C, Koenig JL, Ishida H. In: Ishida H, editor. Interfaces in
polymer, ceramic, and metal matrix composites. New York: Elsevier,1988:163.
[28] Nemanich RJ, Solin SA. Phys Rev B 1979;20(2):392.[29] Tuinistra F, Koenig JL. J Chem Phys 1970;53:1126.[30] Cottinet D, Couderc P, Saint Roman JL, Dhamelincourt P. Carbon
1988;26:339.[31] Gu X, Young RJ, Day RJ. J Mater Sci 1995;3:1409.[32] Vidano RP, Fischbach DB, Willis LJ, Loehr TM. Solid State Comm
1981;39:341.[33] Horovitz B. Synthetic Metals 1984;9:215.[34] Cole KC, Casella IG. Polymer 1993;34:740.[35] Li T. PhD Thesis, Zhongshan University, Guangzhou, China, 1997.[36] Xue G. Spectroscopy methods in studies of polymer structure. Beij-
ing: Higher Education Press, 1995.[37] Chalmers JM, Mackenzie MW. In: Mackenzie MW, editor. Advances
in applied Fourier transform infrared spectroscopy. Chichester: JohnWiley and Sons, 1992:138.
[38] Scott JF. Rev Mod Phys 1974;46:83.[39] Klein MV. In: Cardona M, editor. Light scattering in solids, Chapter
4. Berlin: Springer, 1975.[40] Dressehauls MS, Dressehauls G. In: Cardona M, Guntherodt M,
Guntherodt G, editors. Light scattering in solids III, recent results.Berlin: Springer, 1982:1.
[41] Eklund PC, Subbuswamy KR. Phys Rev 1979;B20:5157.[42] Krekel G, Hunttinger KJ, Hoffman WP, Silver DS. J Mater Sci
1994;29:2968.
T.Q. Li et al. / Polymer 40 (1999) 4307–4313 4313