Embed Size (px)
Citation preview

171
Chapter 6. Morphology of semicrystalline polymers 6.1. Introduction
The term ‘morphology’ refers here to the size and shape of crystals and crystal aggregates. It is true that the morphology of different polymers vary and that there are a great number of special cases uniique for a given polymer. However, it is fair to state that polyethylene is the model semicrystalline polymer and that it has provided data and ideas valuable in the study of other semicrystalline polymers. Polyethylene morphology is thus used as an instructive (rather general) example for the broader class of semicrystalline polymers in this chapter. The polymerisation methods available during decades have made it possible to make polyethylenes of different crystallinities and morphologies. The high pressure process first developed in the 1930s yielded branched polyethylene with ~50% crystallinity. Low pressure processes, developed in the 1950s utilizing metal-organic chemistry, yielded linear polyethylene (~75% crystallinity). Low- and medium-density polyethylenes were made by the low pressure technique replacing part of the ethylene with higher 1-alkenes. The metallocene technology was put into commercial use in the 1990s and it provides polyethylenes with a narrow molar mass distribution and a uniform distribution of comonomer units. Preparation techniques using chromatography made it possible to obtain fractions with a narrow molar mass distribution useful for scientific work. This availability of polyethylene samples of different molar masses and different degrees of branching is one of the reasons why polyethylene morphology has been the subject of so many papers. The recent availability of strictly monodisperse n-alkanes with several hundred carbon atoms using a preparation method developed by Paynter, Simmonds and Whiting (1) has provided new insight into several important aspects of polyethylene morphology. Polyethylene is used in large quantities and in many different applications. The properties of polyethylene are controlled by the morphology. 6.2. Crystal structure and properties of the crystal phase
The crystal structure of polyethylene was first determined by Bunn (2). The orthorhombic unit cell, identical with the crystal structure of straight-chain alkanes, is the most stable crystal structure. The unit cell with the space group notation Pnam-D2h contains 4 CH2 groups and the all-trans chains are parallel (Fig. 6.1a). The zigzag planes of the chains of the orthorhombic cell have different orientations (Fig. 6.1a). The dimensions at 23°C of the orthorhombic cell of linear polyethylene are according

172
to Busing (3): a= 0.74069 nm, b= 0.49491 nm and c= 0.25511 nm (chain axis) which gives a crystal density of 996.2 kg m-3. The angle between the zigzag planes of the two chains and the b axis of the unit cell was first determined by Bunn (2) to be 41°. A later study by Chatani et al. (4) on linear polyethylene gave a somewhat larger value, 45°. The orthorhombic unit cell of branched polyethylene is expanded along a and to a smaller degree along b (5-9), and this causes an increase in the setting angle to 49-51° for this class of polyethylene. Martinez-Salazar and Baltá Calleja (9) proposed that a fraction of the short branches, methyl and ethyl groups, are included in the crystals in the vicinity of 2g1 kinks. According to this view, the extra ‘room’ provided by the kinks is not sufficient to house larger pendant groups, and the cell expansion along a and b is negligible in butyl-branched polyethylene (7). The monoclinic cell with the space group notation C2/m-C2h, first discovered by Teare and Holmes (10) is less stable and is found in samples subjected to mechanical stress (Fig. 6.1b). The dimensions at 23°C of the monoclinic cell of linear polyethylene with 4 CH2 groups are according to Seto et al. (11): a= 0.809 nm, b= 0.253 nm (chain axis) and c= 0.479 nm, which gives a crystal density of 998 kg m-3. The zigzag planes of the chains of the monoclinic cell have a uniform orientation (Fig. 6.1b). The high-pressure hexagonal phase was discovered by Bassett et al. (12). A triple point involving three phases – melt, orthorhombic and hexagonal phases – is positioned at 250°C and 0.33 GPa (13). The hexagonal phase has very special properties: a regular hexagonal packing of conformationally disordered chains with extreme translational chain mobility that allows rapid crystal thickening.
Fig. 6.1. Crystal structures of polyethylene showing views along the chain axis: (a) orthorhombic unit cell; (b) monoclinic unit cell

173
The orthorhombic crystal phase of polyethylene has, like most polymer crystals, pronounced anisotropic properties. The elastic moduli along the three orthogonal crystallographic directions of the orthorhombic unit cell are at 23°C: 3.2 GPa along a and 3.9 GPa along b according to Sakaruda et al. (14) and 240-360 GPa along c (14-16). The thermal expansion coefficients at -70°C in the three crystallographic directions are, according to Davis et al. (17): 1.7
!
"10-4 K-1 (a), 0.59
!
"10-4 K-1 (b) and –0.12
!
"10-4 K-1 (c). The difference in the properties parallel to and perpendicular to the chain axis (c) is a direct consequence of the pronounced difference in the attractive bond forces between the atoms. The all-trans conformation of the crystalline chain sequence makes it susceptible only to bond angle deformation and stretching of covalent bonds. These deformation modes are not very compliant, as is demonstrated by the high elastic modulus along c. The attractive forces acting on the atoms in different chains (e.g. along a and b) are due to weak London forces. The polyethylene crystal is composed of very stiff all-trans chains but the weak forces between the chains make the crystal compliant to stresses acting in directions perpendicular to c. Optical and dielectric properties of the orthorhombic crystal phase are also anisotropic. The polarizability is greater along c than along a and b; the polarizabilities along a and b are approximately the same. The refractive index (n), which is related to the polarizability according to the Lorentz-Lorenz equation, is therefore greater along c (n= 1.575) than along a (n=1.514) and b (n= 1.519) according to data obtained by Bunn and de Daubeny (18). The stems in the orthorhombic crystal possess mobility at room temperature and higher temperatures. Boyd and co-workers presented truly elegant proofs of the translational mobility of the chains through the polyethylene crystal. The work has been summarized by Boyd (19,20). Lightly oxidized polyethylene with a few carbonyl groups showed a dielectric relaxation process (α process) at temperatures well above the glass transition temperature. The dielectric α process is extremely sharp; the Cole-Cole width parameter is 0.7-0.8 for linear polyethylene (21). The relaxation strength of the dielectric α process is proportional to the degree of crystallinity with an activation energy proportional to the crystal thickness up to a certain thickness level above which it remains constant (21). The molecular interpretation of the dielectric α process presented by Mansfield and Boyd (22) is schematically shown in Fig. 6.2. The dielectric process is exclusively crystalline. It involves a 180°C rotation of the carbonyl dipole and a c/2 translation of the chain along its own axis to keep the chain in register with surrounding chains. The 180° twist of the chain is accomplished through a smooth twist that propagates from one side of the crystal to the other. The motion of the twist from one site to the next (c/2 translation) involves the passage of a 17 kJ mol-1 energy barrier. The creation energy

174
of the smooth twist with 12 main chain bonds was calculated to be 54 kJ mol-1. There is no strain involved in any of the two terminal states. They are the same in that sense and the dielectric α process lacks mechanical activity. Polymers with small or no pendant groups, with short repeating units and with weak intermolecular forces are the polymers most likely to have an α process. Examples of polymers belonging to this category are polyethylene, isotactic polypropylene, polyoxymethylene and poly(ethylene oxide) (19,20).
Fig. 6.2. Dielectric α process in polyethylene showing initial and final states. The combined 180° rotation and c/2 translation of the central chain is accomplished by a smooth twist consisting of 12 carbon atoms out of register that propagates through the crystal.
Fig. 6.3. Mechanical α relaxation process in polyethylene. Drawn after Boyd (20). The efficient mechanism for translative motion of a stem through an orthorhombic crystal discovered by dielectric relaxation measurements has important implications for the mechanical behaviour of polyethylene. A mechanically stressed amorphous chain may ‘pull out’ a portion of the crystal chain by the α process (Fig. 6.3). Thus,

175
the mechanical α process requires the presence of both crystalline and amorphous components (23-26). The α process has a low activation energy and hence it is a possible mechanism for the required translative motion of crystal stems to accomplish crystal thickening. 6.3. The single crystal
The lamellar shape of the polyethylene crystal was discovered in 1957 independently by Keller (27), Fischer (28) and Till (29). The polymer chains in dilute solution were found to crystallize in 10 nm thick sheets; although the sheets were considerably larger, of the order of 10 µm, in the perpendicular directions (Fig. 6.4). The fascinating discovery that the chain axis was aligned along the thin direction of the sheets led Keller to suggest chain folding (Fig. 6.5). The coining of the concept of chain folding was the birth of modern crystalline polymer morphology, well worth celebrating by citing Andrew Keller (31):
‘However, the idea of a morphological hierarchy was alien to the scientific establishment in polymer science at that time. The authorities believed that everything worth knowing could be accounted for by simply considering the statistical behaviour of chain molecules. Crystallization in particular was seen as a chance coming together of adjacent chain portions forming little micellar bundles but no larger entities’. Keller entered the H. H. Wills Physics Laboratory, Bristol in 1955 and he was stunned by what he saw: ‘The most positive aspect was the extraordinary intellectual ferment coupled with open-mindedness which permeated the whole place’. ‘There was no distinction between high and low brow, it was all one intellectual adventure. That is how polymers eventually slotted in between quantum mechanics, dislocations, particle physics, liquid helium, design of new optical instruments and much else’. ‘Amongst my 'negative' experiences was first and foremost the nearly total lack of equipment’. ‘I cannot deny that the above experimental conditions were frustrating to the extreme, yet they were inducive to make the best use of the little there was and always to concentrate on the essentials, lessons well worth learning’. ‘Another negative experience was the total absence of anybody knowledgeable in polymers. As I was still unknown in the field nobody visited me and I had no funds to visit anybody else. Also my access to the polymer literature was highly limited. So I lived and worked for two full years in near complete isolation from the relevant scientific community’. ‘Further, when I told him (Sir Charles Frank) that I cannot see how long chains, which I found to lie perpendicular to the basal surface (by combined

176
electron microscopy and diffraction) of layers much thinner than the molecules are long (thickness assessed by electron microscopy shadowing and small-angle x-ray scattering), can do anything else but fold, he said 'of course' and encouraged me to publish immediately’. Keller ends with: ‘That is how in 1957 in an 'office' filled with fumes, sparks and scattered X-rays, amidst total isolation from, in fact ignorance of the rest of polymer science, single crystals and chain folding were recognised’.
Fig. 6.4. Transmission electron micrograph of a replicate of a single crystal of polyethylene decorated with polyethylene vapour. With permission from Wiley, New York (30).
Fig. 6.5. Schematic drawing of single crystal with regular chain folding

177
Fig. 6.6. Sectorization of polyethylene single crystals. The upper crystal shows only {110} sectors whereas the lower also has {100} sectors. With permission from Kluwer, Doordrecht, the Netherlands (120).
Fig. 6.7. Schematic drawing of tent-shaped polyethylene single crystals with only {110} sectors.

178
Single crystals of polyethylene grown from solution showed a number of other important features:
(a) Sectorization (Fig. 6.6); the four lateral surfaces of single crystals grown at low temperatures are crystallographically exact {110} planes. This nomenclature for single polymer crystals was introduced by Bassett et al. (32). The notation {110} is for the group of the following four planes:
!
110( ), 1 10( ), 1 1 0( ), 1 1 0( ) . Crystallization at higher temperatures led to the formation of crystals with six lateral surfaces; four {110} and two {100} faces. The latter is the group of the
!
100( ) and
!
1 00( ) planes. Bassett (33) discovered that the sub-cell in the different sectors was slightly distorted from the orthorhombic structure: the interplane spacing of the fold plane (e.g.
!
110( )) is shifted by a small quantity (0.001 nm) from the spacing of the ‘equivalent’ non-fold plane (e.g.
!
11 0( )).
(b) The single crystals grown from solution at moderate temperatures were, in their undistorted form, non-planar and shaped like tents. (Fig. 6.7). The base of the tent with the {110} lateral faces is not planar. The regular chain folding model would suggest, on the basis of these results, that each chain along the periphery of the crystal is shifted a certain distance along the chain axis with respect to the nearby chain. Furthermore, the {110} strips must also be gradually shifted along the c-axis (Fig. 6.7). Sectorization has been reported also for extended-chain crystals of n-alkanes (34). However, the tilt angle (the angle between the chain axis and the normal to the crystal surface) is considerably larger in the fold-chain single crystals (~35°) than in the extended-chain alkane crystals. Hence, sectorization and the non-planar shape are characteristic features of the single crystals, suggesting the dominance of regular chain folding. Other non-planar shapes such as corrugated layers and chair-shaped crystals have been reported (35-37). Melt-grown crystals may adapt to other, more complex geometries (see Section 5).
(c) Multilayer crystals with a central screw dislocation were commonly seen. A micrograph of a beautiful solution-grown multilayer crystal with regularly rotated terraces was presented by Keller (38). This ‘mechanism’ to multiply a single crystal layer into many crystal layers is important for the crystal growth from the melt to form spherulites.

179
6.4. Structural hierarchy in melt-crystallized polymers
The existence of crystal lamellae in melt-crystallized polyethylene was independently shown by Fischer (28) and Kobayashi (39). They observed stacks of almost parallel crystal lamellae with amorphous material sandwiched between adjacent crystals. At the time, another structure was well known, the spherulite (from Greek meaning ‘small sphere’). Spherulites are readily observed by polarized light microscopy and they were first recognized for polymers in the study of Bunn and Alcock (40) on branched polyethylene. They found that the polyethylene spherulites had a lower refractive index along the spherulite radius than along the tangential direction. Polyethylene also shows other superstructures, e.g. structures which lack the full spherical symmetry referred to as axialites, a term coined by Basset et al. (41).
Fig. 6.8. Schematic drawing of the morphological hierarchy of a polyethylene spherulite. The structural hierarchy of melt-crystallized polyethylene is schematically displayed in Fig. 6.8. The nature of the fold surface has been disputed and is the topic dealt with in this chapter. A closely related topic is the interfacial component present in melt-crystallized samples. The lateral habit of the crystal lamellae is another topic of this chapter. It has been very important for the development of the theory of polymer crystallization. Diffusion of small-molecule penetrants is confined to the

180
amorphous component and the extension of the diffusion path is affected by the lateral size and shape of the crystals. The link between the lamellar structure, planar or shaped like tents, and the superstructure, spherulites or axialites is discussed in some detail. The question asked is how it is possible to obtain a spherical structure from the tent-shaped or planar crystallites. Finally multi-component crystallization is discussed in the final section. This is the common case since commercial polyethylenes have a broad molar mass distribution and some materials also show heterogeneity in the degree of chain branching. Such polydisperse polymers show segregation of low molar mass and branched species. The general scheme is that the higher molar mass species or the less branched material crystallizes first in so-called dominant lamellae (a term introduced by Bassett) leaving the low molar mass or branched material in pockets between the dominant lamellae. The segregated material then crystallizes at a later stage in the so-called subsidiary lamellae. 6.5. Crystal thickness
Polyethylene crystals change shape with time at temperatures between the crystallization temperature and the final melting point (42). The process is commonly referred to as crystal thickening because the major effect is that the crystals increase their dimensions along the c axis. These changes may occur without any change in crystal volume, i.e. crystal thickening is associated with a lateral contraction of the crystals (Fig. 6.9). A second option is that crystal thickening is accompanied by a corresponding increase in crystal volume, i.e. amorphous material is converted into crystalline (Fig. 6.9). A third possibility proposed by Kawai (43) involves molecular fractionation as the mechanism for an ‘apparent’ crystal thickening: the higher molar mass species crystallize early in comparatively thin crystal lamellae, whereas the lower molar mass species, but still with a molar mass greater than Mcrit at the prevailing temperature (for further explanation see Section 6.9), crystallize more slowly at a lower ∆T. The equilibrium melting point of these species is lower than that of the higher molar mass species and hence, according to Eq. (6.2), they give rise to thicker crystals. This mechanism thus causes crystal thickening without any restructuring of crystal lamellae already formed.

181
Fig. 6.9. Schematic description of crystal thickening options: (a) Crystal thickening at constant crystal volume. (b) Crystal thickening accompanied by an increase in crystal volume. What is the thermodynamic reason for crystal thickening at constant crystal volume? The surface free energy of the fold surface has been determined from melting point-crystal thickness data to be 90±3 mJ m-2 (44-46), and the surface free energy of the lateral surfaces has been determined from linear growth rate data to be 12 mJ m2 (45). These data can be used to calculate the ratio of crystal thickness to crystal width of the equilibrium crystal (minimum free energy) to 90/12 = 7.5. If it is assumed that the equilibrium crystal is of the extended-chain type, then the non-lateral surfaces have approximately the same surface energy as the lateral surfaces. Hence, the crystal thickness-width ratio of such an equilibrium crystal would be 1. These numbers may be compared with the ‘typical’ value for the crystal thickness-width ratio for solution-grown crystals:
!
10 "10#910 "10
#6=10
#3 . Melt-grown crystals show corresponding values in the range from 10-2 to 10-3. Hence, there is always a thermodynamic driving force for crystal thickening. The thicker crystal has a lower free energy than the thinner analogue provided that the internal defects are kept at a constant level. Crystal thickening may also occur without any change in the lateral dimensions by converting amorphous material to crystalline. This also increases the stability of the crystals. The ‘old’ work on crystal thickening was confined to medium to high molar mass polyethylenes with molar mass polydispersity, and the results obtained were in some respects different from the more recent findings obtained on strictly monodisperse n-alkanes. Any structural rearrangement of the crystals resulting in a lower free energy requires translational mobility of the polymer chains in the crystals. Crystal thickening occurs only at temperatures higher than a certain minimum temperature necessary to overcome the kinetic barriers. The onset temperature (Tons) for crystal thickening is related to factors such as initial crystal thickness and it has recently been shown that the molar mass distribution is an important factor. Early data by

182
Mandelkern et al. (47) on polydisperse linear polyethylenes of intermediate molar mass showed that the onset temperature for crystal thickening increased with increasing initial crystal thickness (
!
Lc
* ):
!
Lc
*=11.5 nm, Tons = 114°C;
!
Lc
*=17.2 nm, Tons = 127°C. The occurrence of crystal thickening makes it imperative to distinguish between the thicknesses of the embryo crystal (
!
Lc
* ), i.e. the ‘baby’ crystal as it is immediately after its formation, and of the ‘mature’ crystal. Crystals grown at very low absolute temperatures (e.g. 75°C) from a solution of polydisperse medium to high molar mass polyethylene show no crystal thickening and the distinction between embryo and mature crystals is in these cases not relevant. Weaver and Harrison (48) crystallized linear polyethylene from xylene solution (0.12% polymer in the solution) at 90°C and showed by small-angle X-ray scattering, differential scanning calorimetry and Raman spectroscopy that no measurable crystal thickening occurred between 2 h and 168 h from the start of the crystallization process.
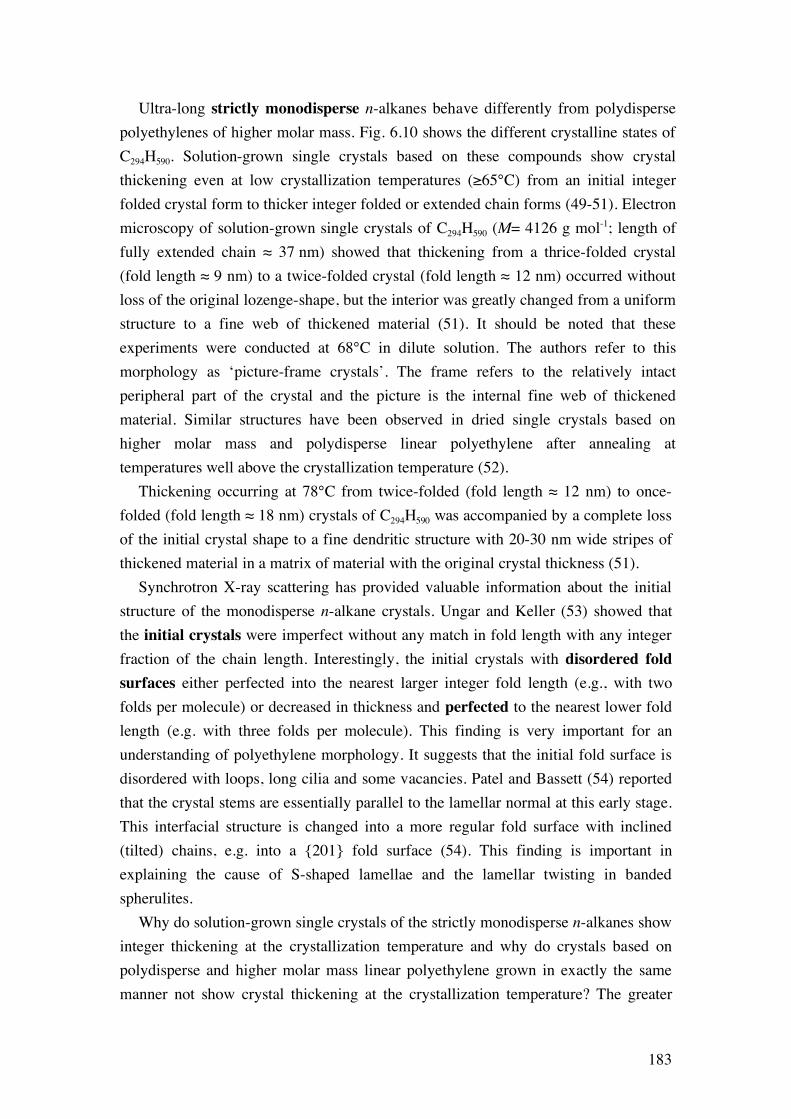
Fig. 6.10. Schematic representation of crystal thickening of C294H590. Drawn after findings of Hobbs et al. (51).
183
Ultra-long strictly monodisperse n-alkanes behave differently from polydisperse polyethylenes of higher molar mass. Fig. 6.10 shows the different crystalline states of C294H590. Solution-grown single crystals based on these compounds show crystal thickening even at low crystallization temperatures (≥65°C) from an initial integer folded crystal form to thicker integer folded or extended chain forms (49-51). Electron microscopy of solution-grown single crystals of C294H590 (M= 4126 g mol-1; length of fully extended chain ≈ 37 nm) showed that thickening from a thrice-folded crystal (fold length ≈ 9 nm) to a twice-folded crystal (fold length ≈ 12 nm) occurred without loss of the original lozenge-shape, but the interior was greatly changed from a uniform structure to a fine web of thickened material (51). It should be noted that these experiments were conducted at 68°C in dilute solution. The authors refer to this morphology as ‘picture-frame crystals’. The frame refers to the relatively intact peripheral part of the crystal and the picture is the internal fine web of thickened material. Similar structures have been observed in dried single crystals based on higher molar mass and polydisperse linear polyethylene after annealing at temperatures well above the crystallization temperature (52). Thickening occurring at 78°C from twice-folded (fold length ≈ 12 nm) to once-folded (fold length ≈ 18 nm) crystals of C294H590 was accompanied by a complete loss of the initial crystal shape to a fine dendritic structure with 20-30 nm wide stripes of thickened material in a matrix of material with the original crystal thickness (51). Synchrotron X-ray scattering has provided valuable information about the initial structure of the monodisperse n-alkane crystals. Ungar and Keller (53) showed that the initial crystals were imperfect without any match in fold length with any integer fraction of the chain length. Interestingly, the initial crystals with disordered fold surfaces either perfected into the nearest larger integer fold length (e.g., with two folds per molecule) or decreased in thickness and perfected to the nearest lower fold length (e.g. with three folds per molecule). This finding is very important for an understanding of polyethylene morphology. It suggests that the initial fold surface is disordered with loops, long cilia and some vacancies. Patel and Bassett (54) reported that the crystal stems are essentially parallel to the lamellar normal at this early stage. This interfacial structure is changed into a more regular fold surface with inclined (tilted) chains, e.g. into a {201} fold surface (54). This finding is important in explaining the cause of S-shaped lamellae and the lamellar twisting in banded spherulites. Why do solution-grown single crystals of the strictly monodisperse n-alkanes show integer thickening at the crystallization temperature and why do crystals based on polydisperse and higher molar mass linear polyethylene grown in exactly the same manner not show crystal thickening at the crystallization temperature? The greater

184
stability of the thicker fully developed crystal (with fewer folds) is not a matter of discussion. The crystal thickening cannot be a completely synchronized and instantaneous process; it must start at a ‘point’ somewhere on the crystal and then spread to neighbouring regions. In fact, the electron microscopy findings of Hobbs et al. (51) support this assumption. The first few stems involved form a nucleus with a higher free energy than the initial state; the free energy barrier should be proportional to the length of the outgrowth. Furthermore, when a chain with e.g. three folds converts into a chain with only two folds, one of the chain ends has to move from one fold surface to the other in order to reach the final state. In this process, a row vacancy will be created which will increase the free energy barrier. The experimental results for the strictly monochromatic n-alkanes clearly show that these free energy barriers are overcome at relatively low temperatures. A single crystal based on longer chain molecules with a distribution in molar mass can in principle undergo the same process, and the free energy barrier associated with nucleation should be of the same order of magnitude as for the strictly monodisperse n-alkanes. The longer chains will have a greater number of folds and thus require a higher degree of cooperation by the different stems of the molecule to accomplish a stepwise increase in crystal thickness. Only a few out of a great number of possible thermal processes would result in an integer (stepwise) increase in fold length. It is suggested that this is the main reason for the greater stability of solution-grown single crystals of higher molar mass, polydisperse polyethylene than of the corresponding single crystals based on strictly monodisperse n-alkanes. The isothermal thickening (avoiding very short times) of ‘mature’ crystals of conventional polyethylenes follows the equation (55):
!
Lc = Lc t = t0( ) + B T( ) logt
t0
+1"
# $ $
%
& ' ' (6.1)
where Lc is the crystal thickness at time t, Lc (t=t0) is the crystal thickness at time t0, and B(T) is a constant for a given temperature, which increases with increasing temperature. Eq. (6.1) with given parameter values is valid only within a limited time period. Hoel (56) showed that the crystal thickening as viewed in a lin (Lc)-log (time) diagram proceeded through two different stages: a period of rapid crystal thickening was followed by a period of considerably slower crystal thickening. The initial stages of crystal thickening of melt-grown crystals may be associated with discontinuous jumps in the crystal thickness (57,58). However, synchrotron X-ray scattering of a linear polyethylene fraction presented no evidence in favour of any early stepwise increase of the crystal thickness (59). Many papers have reported that melt-
185
crystallization of linear polyethylene at ≥125°C involves a gradual increase with crystallization time in both the degree of crystallinity and the crystal thickness as recorded after cooling to room temperature. These studies, which possibly present genuine facts, suffer from the deficiency that physical changes occur in the sample during cooling. Bark et al. (59) presented direct evidence – X-ray diffractograms were taken at the crystallization temperature – of the occurrence of simultaneous isothermal crystal thickening and an increase in the degree of crystallinity. Crystal growth in this case occurs by a gradual ordering of the interfacial region into a crystalline register. Some differences of opinion exist concerning the magnitude of the possible effect of molecular fractionation on the recorded crystal thickness as a function of crystallization time. Kawai (60) observed less crystal thickening in fractionated linear polyethylenes than in samples with a broad molar mass distribution. Hoffman and Weeks (61) also observed appreciable crystal thickening in fractionated samples. Later Raman spectroscopy studies on linear polyethylenes by Hoel (56) showed that crystal thickening induced by molecular fractionation was less important for the isothermal crystal thickening. A remarkable experiment was carried out by Blackadder et al. (62). They annealed a linear polyethylene grade by gradually heating it from 120°C to 135.8°C. The thermal treatment was conducted in vacuum to avoid thermal oxidation. The experiment took two years and the mass crystallinity and the melting point after subsequent cooling to room temperature were 92-94% and 136.6°C. These values are in the same range as those of pressure-crystallized linear polyethylene. The samples showed also considerable brittleness just as did the pressure-crystallized samples.
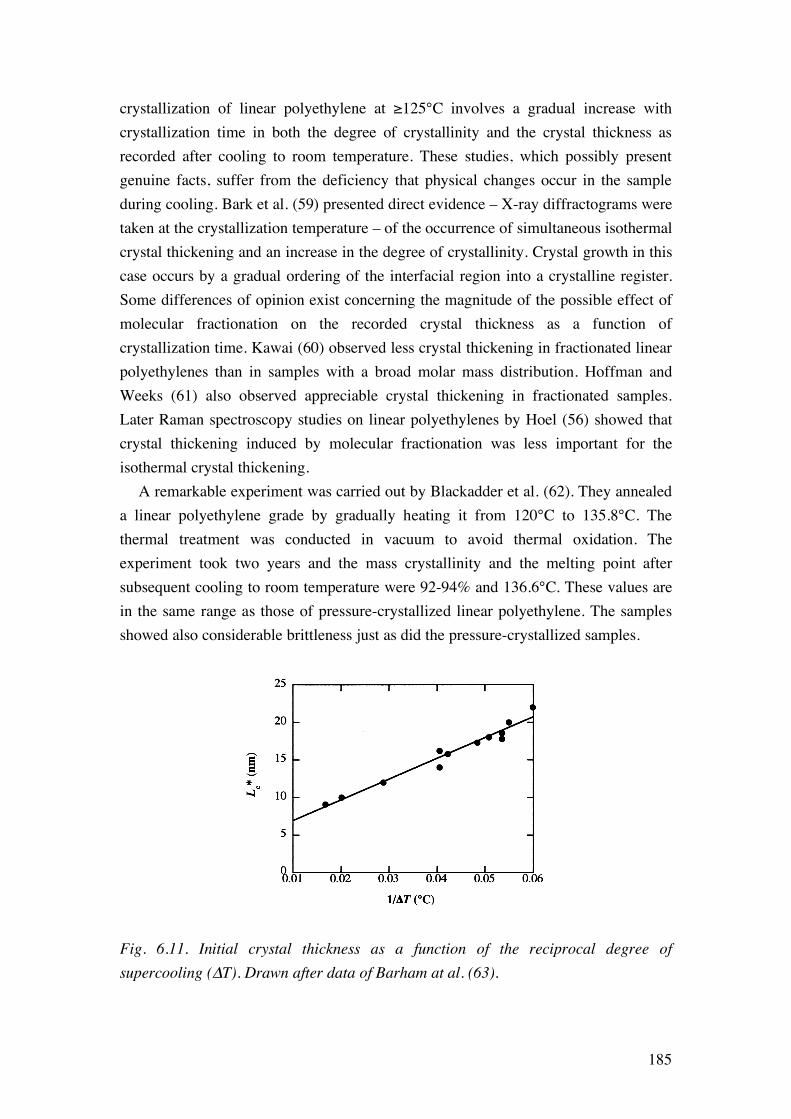
Fig. 6.11. Initial crystal thickness as a function of the reciprocal degree of supercooling (∆T). Drawn after data of Barham at al. (63).

186
Crystals grown from the melt at high temperatures (>120°C) show crystal thickening and it was a damanding task to assess the thickness of the initial crystals (
!
Lc
* ). This problem was solved by the Bristol group (63) in the 1980’s, and they showed that
!
Lc
* depended only on the degree of supercooling [
!
"T = Tm
0
#Tc, where
!
Tm
0 is the equilibrium melting point and Tc is the crystallization temperature] according to:
!
Lc
* in nm( ) =
276.4
"T+ 4.16 (6.2)
where
!
Tm
0=144.7°C. Fig. 6.11 shows the initial crystal thickness as a function of the reciprocal of the degree of supercooling for a series of melt-crystallized linear polyethylenes. The experimental data follow the straight line (Eq. (6.2)). Solution-grown crystals fall on the same line (63). Thus, Eq. (6.2) is general for linear polyethylene and includes crystals grown from both solution and melt. The variation in
!
Lc
* for a given ∆T according to the data presented by Barham et al. (63) – data for solution-grown single crystals from Organ and Keller (64) were included – was typically ±1 nm for crystals in the thickness range of 12-24 nm. Eq. (6.2) has the same form as the average crystal thickness according to the theory of Lauritzen and Hoffman (65):
!
Lc
*=2"T
m
0
#h0$c
%1
#T+&L (6.3)
When appropriate values for the parameters are inserted in Eq. (6.3) - ∆h0=293 kJ kg-1 (66), ρc=996 kg m-3 (3) and
!
Tm
0=144.7°C – the fold surface free energy is calculated to be 96.5 mJ m-2, which is similar to the values obtained from data of linear growth rate (90.5 mJ m-2) and melting point (93±8 mJ m-2) according to Hoffman et al. (46). If the lower reported equilibrium melting point, 141.4°C (44,67), is used in these calculations, 74.5 mJ m-2 is obtained for the fold surface free energy, which seems low in view of other reported data. It should be noted that a competing theory for polymer crystallization, the Sadler-Gilmer theory (68,69), predicts the experimentally found relationship, Eq. (6.2). Reported values for the equilibrium melting point of linear polyethylene cover a relatively wide range of temperature from 141°C to 145.5°C. Experimental data based on 10 µm thick single crystals obtained by high-pressure crystallization show melting points of 141.4 °C (67). The melting point depression originating from the finite crystal thickness is less than 0.1 °C according to calculations based on the Thomson-Gibbs equation. It was argued by Hoffman et al. (70) that the concentration of internal

187
defects in the 10 µm thick crystals may be considerably higher than the equilibrium defect content at normal pressure in the melting temperature range and that a small decrease in the heat of fusion (1%) would suffice to explain the difference between the experimental and some extrapolated values. The 141.1°C reported by Broadhurst (71,72) was based on the extrapolation of melting point data of n-alkanes. The extrapolation method used by Broadhurst assumed that both the enthalpy and entropy of melting are linear functions of the number of repeating units of the n-alkanes. Flory and Vrij (73) included in their analysis of the melting of n-alkanes the effect on the melting entropy of unpairing of the chain ends that are confined to the crystal surface. This process adds a term, R ln n (n is the number of repeating units of the n-alkane), to the entropy of melting and the equilibrium melting point for a n-alkane of infinite molar mass was determined by Flory and Vrij (73) to be 145.5±1.0 °C. The melting point data used by Flory and Vrij for the extrapolation was taken from Broadhurst (71). Grubb (74) found that the choice of data for extrapolation is also important for the extrapolated value obtained. The orthorhombic phase of n-alkanes with n≤ 44 transforms into the hexagonal phase before melting, and very long n-alkanes may not be strictly monodisperse and may even fold. The mean value of n used by Flory and Vrij was 44. Databases with mean values of n equal to 70 – straight-chain alkanes of n=160 were included in the analysis – yielded extrapolated values for the equilibrium melting point of 143.2°C (74). Extrapolation of melting point – crystallization temperature data gave an equilibrium melting point of 145°C (75). Determination of the equilibrium melting point by extrapolation of melting point-crystal thickness data and applying the Thomson-Gibbs equation yielded 141.5°C (44) and 142.0±0.3°C (46). It may however be argued that the assumption of constant fold surface free energy independent of crystal thickness is not valid and that the extrapolation to 1/Lc=0 should not be linear. 6.6. Nature of the fold surface
The conclusion drawn by Andrew Keller (27) on the basis of the lamellar shape and orientation of the c-axis that the chain must be folded was qualitative but, as it turned out later, essentially correct. The regularity or adjacency of the chain folding was at this stage impossible to assess. Keller realised this and continued searching for more definite answers. Tent-like structure of solution-grown single crystals, i.e. that the molecules are inclined to the lamellar normal, was explained by the dominance of a particular fold structure (32). Other early evidence for regular chain folding was presented by the Bristol group using nitric acid etching followed by size exclusion chromatography. Etched solution-grown single crystals showed several distinct peaks
188
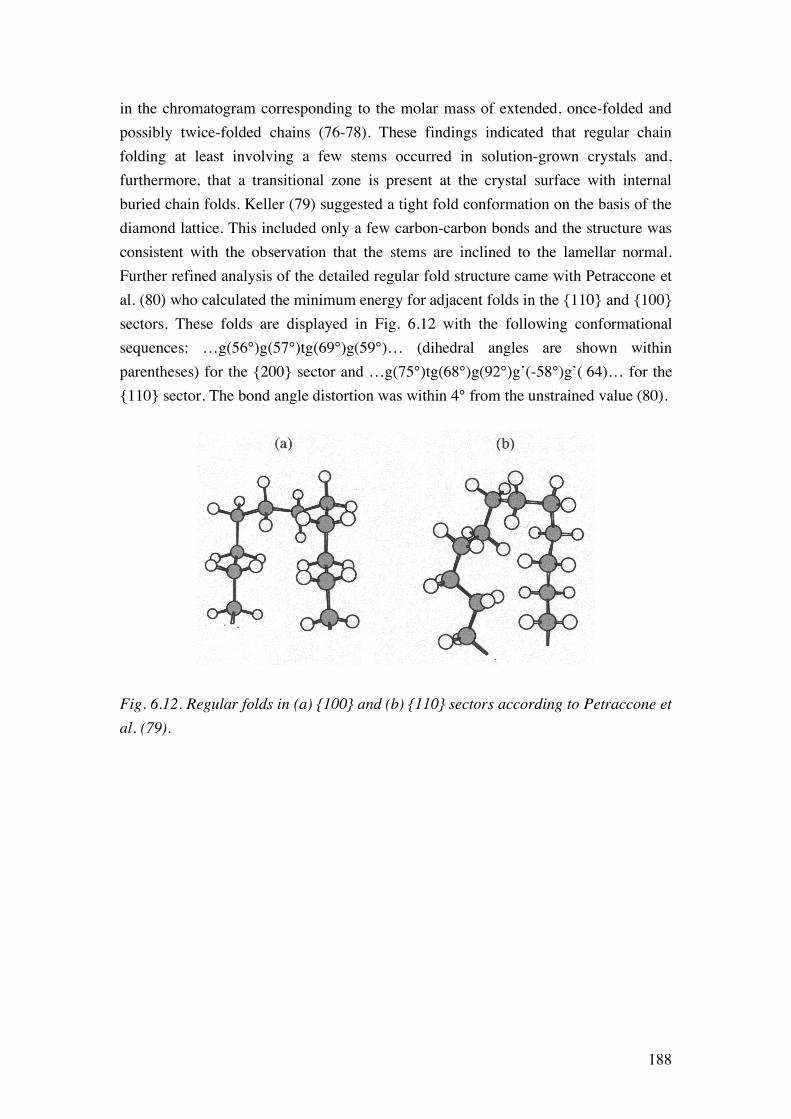
in the chromatogram corresponding to the molar mass of extended, once-folded and possibly twice-folded chains (76-78). These findings indicated that regular chain folding at least involving a few stems occurred in solution-grown crystals and, furthermore, that a transitional zone is present at the crystal surface with internal buried chain folds. Keller (79) suggested a tight fold conformation on the basis of the diamond lattice. This included only a few carbon-carbon bonds and the structure was consistent with the observation that the stems are inclined to the lamellar normal. Further refined analysis of the detailed regular fold structure came with Petraccone et al. (80) who calculated the minimum energy for adjacent folds in the {110} and {100} sectors. These folds are displayed in Fig. 6.12 with the following conformational sequences: …g(56°)g(57°)tg(69°)g(59°)… (dihedral angles are shown within parentheses) for the {200} sector and …g(75°)tg(68°)g(92°)g’(-58°)g’( 64)… for the {110} sector. The bond angle distortion was within 4° from the unstrained value (80).
Fig. 6.12. Regular folds in (a) {100} and (b) {110} sectors according to Petraccone et al. (79).

189
Fig. 6.13. The superfolding model according to Sadler and Keller (84) showing the conformation of a single molecule in a solution-grown single crystal. Fig. 6.12 shows that the fold of the {110} sector yields stems inclined to the lamellar normal. Regular folds have been identified in solution-grown crystals by infrared spectroscopy from the detailed spectrum of the CH2 wagging region – 1342 cm-1 peak assigned to ggtgg (81). Wolf et al. (82) were able to assign by vibrational analysis the infrared absorption peaks associated with {110} and {100} folds but they also pointed out that quantitative analysis was not possible because ‘standards’ with known concentrations of the different fold types were not available and the observed intensities of the peaks were extremely weak. Earlier infrared studies of solution-grown single crystals based on mixtures of deuterated and hydrogenated polyethylene reported by Cheam and Krimm (83) showed incompatibility with the random switchboard model of Flory (84). The data were instead consistent with a dominance of adjacent re-entry along the {110} and {100} planes. Neutron scattering studies of solution-grown single crystals based on mixtures of deuterated and hydrogenated polyethylene showed that the radius of gyration (s) decreased on crystallization, with a very weak molar mass dependence:
!
s"M0.1 (85). The ‘superfolding’ model
displayed in Fig. 6.13 was obtained on the basis of these data and data from higher scattering angles (85). The molecular trajectory is within the folded ‘ribbon’ and the folds with adjacent re-entry form clusters interrupted by ‘statistical loops’ bridging stems within the folded ribbon (85,86). The cluster aspects were based on both

190
neutron scattering data and infrared spectroscopy of single crystals of mixtures of deuterated and hydrogenated polyethylene. This model has been further substantiated by the studies of ultralong n-alkanes. Ungar et al. (87) showed that the fold length of solution-grown crystals was an integer fraction of the chain length thus confirming the occurrence of both adjacent and regular chain folding. They found that alkanes as short as 150 carbon atoms are capable of folding. Decoration techniques (see Fig. 6.4) developed by Wittman and Lotz (30) and atomic force microscopy (frictional force measurements) by Nisman et al. (88) show that chain folding is dominantly directed along the lateral sector faces of the single crystals. There are important differences between crystallization from the melt and crystallization from dilute solution especially for high molar mass polyethylene. The conformational changes necessary for crystallization occur readily in dilute solution. The chain entanglements present in the high molar mass melt will obviously strongly retard the conformational changes necessary to obtain a more complete folded macro-conformation. The competition for crystallization sites is also more severe in the crystallization from the melt. It can thus be expected, on the basis of these general remarks that the semi-crystalline morphology will possess a certain degree of memory of the original molten chain structure. This picture is clear viewing the fold structure of a single chain on a smaller scale including only a few stems. Studies by synchrotron X-ray scattering (53) and electron microscopy (54) show that the initial structure (on the scale of a few stems) is imperfect and non-inclined and that with time it perfects into the inclined {201} fold surface structure. These direct observations of fold structure were preceded by general arguments about regular chain folding with regard to amorphous density (89,90). The low amorphous density can be achieved only by having a large proportion of tight folds (Fig. 6.14). A simple calculation of the fraction of tight folds (ftf) can be made, based on the equation:
!
"a = "c #LaCl
# cos$ # 1% ftf( ) (6.4)
where ρa and ρc are the amorphous and crystalline densities, La is the thickness of the amorphous interlayer, C is the characteristic ratio of the Gaussian chain, l is the bond length and θ is the angle between c and the lamellar normal. Calculations based on realistic values for medium to high molar linear polyethylene yield ftf values close to 80% (120). Further theoretical arguments using the Gamblers ruin method in favour of regular chain folding was presented by Guttman et al. (91). The result of their exercise is that at least 2/3 of the entries must be tight folds in a cubic lattice. Small-angle neutron scattering data obtained at higher angles provide information about the fold structure. The neutron scattering data taken by Schelten et al. (92) and Sadler and

191
Keller (93) were analysed by several researchers. Yoon and Flory (94) reported that the random switchboard model was consistent with the experimental scattering profiles. A particularly unattractive feature of the random switchboard model is the overcrowding at the crystal interface, which makes the model physically unrealistic. Guttman et al. (95) came to a different result which also had the attractive feature of providing a realistic density at the interface: 70% of the folds were to neighbour or next neighbour positions (adjacent folding) thus leaving 30% for random re-entry. Direct experimental evidence for adjacent re-entry by regular folding in melt-crystallized systems was presented by Ungar et al. (87) in a study on n-alkanes of strictly uniform molar mass.
Fig. 6.14. Schematic description how overcrowding of the amorphous phase is avoided by adjacent, regular folding.
The single molecule trajectory on a larger (global) scale in melt-crystallized polyethylene (60 000<M< 383 000 g mol-1) was revealed by small-angle neutron scattering, but only after rapid cooling conditions to avoid segregation of the labelled deuterated chains (96,97). The radius of gyration was the same in the semi-crystalline state as in the melt prior to crystallization:
!
s = 0.46 " M1/ 2 (96). The possible
contraction of the chains on crystallization has not yet been revealed by neutron scattering due to the segregation problem. The crystal interface constitutes a third component of semicrystalline polyethylene. Several experimental techniques have been developed for the assessment of the mass fraction of the so-called interfacial component, which has properties different from the crystal core and the liquid-like amorphous phase. The Raman spectroscopy method developed by Mutter, Stille and Strobl (98), which senses conformation and packing different from the two other phases, gives similar mass fraction data of the interfacial component as the proton NMR method (senses differences in segmental mobility) as applied to polyethylene by Kitamaru et al. (99). The extensive data presented by Vonk and Pijpers (100) on interlayer thickness based on small-angle X-

192
ray scattering indicate a much sharper interface than has been reported by the two other methods. The segmental mobility constraint seems thus to have a longer ‘memory’ than chain packing. 6.7. Lateral habit of crystal lamellae
The lateral habit of solution-grown crystals has been extensively studied. The first studies go back to the pioneering work of Keller (27), Fischer (28) and Till (29). These early reports together with a later paper by Keller (52) established that lozenge-shaped crystals with only {110} were formed at low crystallization temperatures, 70°C in xylene. Crystallization at higher temperatures (~85°C) from the same solvent led to the formation of ‘truncated lozenge-shaped’ crystals with six lateral faces: four {110} and two {100}. The recognition of crystals showing curved {100} faces was due to Keith (101). The lateral habit of solution-grown crystals was systematically studied by Organ and Keller (102) over a wide range of temperature from 70°C to 115°C using a range of different solvents. Fig. 6.15 shows sketches of the crystals grown at different temperatures. The lateral habit depends primarily on the absolute crystallization temperature and to a lesser extent on the degree of supercooling (102). The crystals are more elongated along the b axis at higher crystallization temperatures. The two {100} faces show a progressively more pronounced curvature with increasing crystallization temperature. The same observation was made with regard to the {110} faces, although this change became obvious only at the highest temperatures of the study. The ratio of the dimensions along b and a was 3.25 at the highest crystallization temperature, 115°C (102).

193
Fig. 6.15. Lateral habit of solution- and melt-grown polyethylene single crystals. The drawing are based on electron micrographs of Organ and Keller (64) – grown from solution– and of Toda (106) – grown from the melt. Labaig (103) presented the first comprehensive study of the lateral habit of melt-grown single crystals of linear polyethylene. This study was based on the development of a new preparation method revealing melt-grown single crystals. Important later studies using the technique developed by Labaig and other techniques (extraction of samples first isothermally crystallized and then rapidly quenched) were reported by Bassett et al (104), Keith et al. (105), Toda (106) and Toda and Keller (37). Crystallization was performed at temperatures where spherulites (<127°C) and axialites (>127°C) are formed. A new shape was discovered in these studies, the lenticular single crystal (Fig. 6.15). The systematic study by Toda (106) of melt-grown single crystals of linear polyethylene with a molar mass of 14 000 g mol-1

194
crystallized at different temperatures between 125°C and 131°C showed the lateral habits displayed in Fig. 6.15. Crystals grown in the Regime II temperature range (<127°C) showed the features of truncated lozenges with curved {200} and {110} faces. Regime I crystallization (>127°C) yielded highly elongated (along b) lenticular crystals. The aspect ratios of these crystals were of the order of 10. Toda (106) argued that tiny {110} faces must surround the tips although no direct evidence for this supposition could be obtained from the micrographs. Hence, the {110} faces growing along the b axis – the radial direction in spherulites and axialites –determine the linear growth rate of the superstructure. This means that the substrate length, i.e. the lateral dimension of the unit of independent crystal growth, becomes very small at high crystallization temperatures. This should have a retarding effect on the Regime I linear growth rate because the latter is proportional to the substrate length (45). The crystals that grow at temperatures above 127°C have {201} fold surfaces, which means that the tilt angle (angle between the crystalline chain axis and the normal of the fold surface) is 35° (104,105). These single crystals are usually planar (54,103-105) but lower molar mass linear polyethylenes also show ridged lamellae with {201} fold surfaces (107). Keith et al. (105) noted asymmetries in the lateral habit in the crystal grown at high temperatures. The shape of the lenticular crystals with {201} fold surfaces was asymmetric; the lateral growth was slower at the face with ‘overhanging’ folds. 6.8. Relation between growth of crystal lamellae and superstructure
The scientific problem discussed in this section is how it is possible that crystal lamellae (planar or tent-shaped) can fill the three-dimensional space of a spherulite. A stack of parallel lamellae can obviously not be the answer. The number of radially growing crystal lamellae fronts must increase with increasing radial distance (r) from the centre of the spherulite in order to preserve the same degree of crystallinity throughout the spherulite. Provided that the size of the crystal lamellae front is the same at different radial positions, the number of growing crystal lamellae fronts must then be proportional to r2. The only sensible solution to this problem is that there has to be one or several means by which (1) the number of growing crystal fronts increases during the course of spherulite crystallization and (2) splaying or branching of crystal lamellae occurs. The analogy with the tree provides some insight into the problem, although important differences exist between the branched structure of a tree and the arrangement of crystal lamellae in a polyethylene spherulite.