Embed Size (px)
Citation preview

i
Strength and Ductility of HPS70W Tension
Members and Tension Flanges with Holes by
Robert J. Dexter, Steven A. Alttstadt, and Christopher A. Gardner
University of Minnesota
122 CivE, 500 Pillsbury Dr. S.E.
Minneapolis, MN 55455-0116
March 2002
Sponsors:
High Performance Steel Task Group
BURNS HARBOR MILL, INDIANA
ii
Acknowledgements
The authors are grateful for the funding provided by PSI, the contractor providing
services to Turner-Fairbank Highway Research Center of the Federal Highway
Administration (FHWA). William Wright of FHWA was the technical monitor and
Mohammad Khan of PSI was the contract monitor.
The research was part of the interagency High Performance Steel (HPS) project, a
cooperative research program involving the American Iron and Steel Institute (AISI), the
Federal Highway Administration (FHWA), and the Naval Surface Warfare Center (NSWC).
The AISI steel bridge task force leads the project, in close cooperation with the AASHTO
T-14 Committee (Steel Bridges). This project was part of the research conducted by the HPS
Design Advisory Group of the steel bridge task force. In particular, the authors would also
like to thank Camille Rubeiz, Director, Transportation and Infrastructure, AISI, Dennis Mertz,
Chairman of the HPS Design Advisory Group, and Edward Wasserman, Chairman of
AASHTO T-14 Committee.
AISI also provided a supplemental grant for student support. The steel was donated
by Bethlehem Steel Corporation and the test specimens were fabricated at no cost by PDM
Bridge in Eau Claire, Wisconsin.
The authors would also like to thank Paul M. Bergson for oversight of and assistance
with the experimental work in the Structural Laboratory at the University of Minnesota.
iii
Abstract
Experimental and analytical research was conducted to determine the strength and
ductility performance of tension members and the tension flange of flexural members
fabricated with HPS70W steel and to examine the applicability of current AASHTO tension-
member and tension-flange design specifications for HPS70W. Wide-plate tests were
conducted to investigate the behavior of members with a variety of net-sections (An) due to
one or more holes that reduced the gross-section area (Ag) and to compare the HPS70W to
HPS100W and ordinary Grade 50 steel. These tests were also simulated using elastoplastic
shell finite-element analyses. HPS70W tensile ductility capacity is well within required
ranges for structural steel and performed well in these experiments. It was confirmed that the
yield-to-tensile strength ratio (Y/T) was a key parameter determining the ductility, and that
the behavior of all grades of steel could be predicted based on the ratio (An/Ag)/(Y/T). More
than adequate ductility is provided at (An/Ag)/(Y/T) ratio of 1.0. A three-point bending test of
a large-scale girder demonstrated the good performance of the tension flange in flexure and
provided a link to the tests on tension members. Recommendations are made for improved
design provisions for tension flanges with holes.

iv
Table of Contents
Acknowledgements ..................................................................................................ii
Abstract...................................................................................................................iii
Table of Contents ................................................................................................... iv
1 Introduction ........................................................................................................1
2 Experiments and analyses ................................................................................ 23
3 Statistical analysis of Y/T data ......................................................................... 72
4 Recommendations and conclusions ................................................................. 79
5 References ........................................................................................................ 92

1
1.0 Introduction
An experimental and analytical research program was conducted to investigate the strength
and ductility of steel tension members and the tension flanges of steel flexural members. The
primary objectives of this investigation were to determine the adequacy of the tensile ductility
of HPS70W steel and to evaluate the applicability to HPS70W steel of current AASHTO
tension-member and tension-flange design provisions, which were developed primarily on the
basis of tests on components fabricated from mild steel. HPS70W is a “high-performance
steel” meaning that it has higher strength (a minimum specified yield strength (MSYS) of 70
ksi) while also having higher fracture toughness, better weldability, and other improved
properties relative to conventional bridge steel with a MSYS of 50 ksi or less.
There are concerns, however, about the ductility of any high-strength steel that stem
primarily from a tests by McDermott (1969) on girders made of A514 steel (MSYS of 100
ksi). These girders had predicted failure modes of either local or lateral buckling of the
compression flange. Two of these girders unexpectedly experienced premature necking on the
tension flange, shortly followed by complete tension flange fracture. This behavior was
attributed to inadequate strain hardening of the A514 steel.
The strain hardening potential of steel is often characterized in terms of the yield to
tensile strength ratio (Y/T), and A514 steel has an average Y/T of about 0.94 (Brockenbrough
1995). The average Y/T for HPS70W is about 0.84, which is greater than the Y/T for
conventional Grade 50 bridge steel (typically about 0.77). Because of the variability, the Y/T
for HPS70W can range as high as the values for A514 steel in some cases, hence the concern
about the tensile ductility of this steel also. Although not discussed by McDermott, the A514
steel of that time often had poor fracture toughness, so this could also have been a factor in

2
the observed premature tension flange failures in his experiments. Since HPS70W steel has
extraordinary fracture toughness, this would not be a factor for HSP70W girders.
A study by Kulak and Fisher (1969) of A514 bolted splice connections in tension
members noted a finding related to McDermott’s study. Kulak and Fisher observed
premature localization of yielding and fracture on the net sections of bolted joints when the
An/Ag was less than the Y/T of the A514 steel.
The primary emphasis of the testing and analysis in this first phase of this research
project was tension members, which were simulated using wide-plate specimens. The cross
section of the wide-plate specimen was 8 inch wide by 0.75 inch thick. Wide-plate tests were
performed with various net-section areas (An) due to one or more holes that reduced the gross-
section area (Ag). The tensile ductility of the HPS70W specimens was compared to results
from identical specimens of A709 Grade 50 steel, with greater strain hardening and
presumably greater ductility, and HPS100W, with a less strain hardening and presumably less
ductility.
It was found that HPS70W performed well in these experiments and that the tensile
ductility capacity is well within required ranges for structural steel. The controlling factor in
ductility of these tensile members was shown to be ratio of the (An/Ag) ratio to the Y/T ratio
( (An/Ag) / (Y/T) ). This ratio can also be thought of as the ratio of the nominal fracture limit-
state (An*T) to the nominal gross-section yielding limit-state (Ag*Y). More than adequate
ductility is provided at (An/Ag)/(Y/T) ratio of 1.0, although the ductility increases sharply as
this ratio exceeds 1.1 (as the fracture limit-state exceeds the gross-section yielding limit state).
A single HPS70W girder test was also conducted in this first phase of the research.
This test demonstrated that HPS70W did not exhibit premature necking or inadequate tensile

3
ductility in flexure, in this one case. More girders will be tested in a second phase of this
research to more fully investigate the behavior of tension flanges of HPS70W girders under a
range of conditions.
In addition, the statistical variation of Y/T was studied to determine adequate margins
of safety to use in design equations when all that is known is the ratio of the minimum
specified values of yield strength and tensile strength (Fy /Fu) rather than the actual Y/T.
Recommendations are made for improved AASHTO provisions for tension flanges with
holes.

4
1.1 High-performance steel
High Performance Steel (HPS) is a term that is sometimes used to describe a range of
high-strength low-alloy (HSLA) steels. These HPS have very low carbon content (less than
0.01%) and typically get their higher yield strength, 65 ksi or greater, from some kind of
thermal and/or mechanical processing; including:
1) quenching and tempering (Q&T),
2) precipitation hardening (PH)
3) controlled rolling (CR),
4) combined controlled rolling with accelerated cooling (water spraying), known as
thermo-mechanical controlled processing (TMCP).
Primarily because of the reduced carbon, HPS typically have excellent weldability
(resistance to hydrogen cracking) and fracture toughness, especially in comparison to
traditional high-strength steels that get their strength from the hardenability of carbon and
other alloys. Because of these advantages, the higher strength, and other advantages, HPS
have been widely used since the 1980’s in military ships, gas transmission pipelines, offshore
structures, and other demanding applications.
If the size of the market for HPS could be expanded to include civil infrastructure and
other applications, the steel could be produced more affordably. Therefore, in 1994, a
cooperative research program involving the American Iron and Steel Institute (AISI), the
Federal Highway Administration (FHWA), and the Naval Surface Warfare Center (NSWC)
led to the introduction of a specific type of High Performance Steel (HPS), which can now be
specified as ASTM A709 Grade HPS70W, or, equivalently, as AASHTO M270 Grade

5
HPS70W. Today, what was once a more general term, HPS, will be used to refer to this
specific type of bridge steel.
HPS70W has minimum specified yield strength (MSYS) of 70 ksi. In addition to
higher strength, HPS70W offers enhanced weathering properties, increased weldability, and
increased fracture toughness. The cost advantages of HPS70W have now been demonstrated in
bridge projects in many states, particularly Nebraska, Tennessee, New York and Pennsylvania.
As with all new and innovative structural materials, however, an experimental base must
be established for HPS70W and other similar low-carbon HSLA steels. The applicability of
current codes and specifications to the new steel must be evaluated and if necessary, new
specification provisions should be recommended. To this end, Wright et al (2001) has
characterized fracture behavior of HPS70W plate girders and obtained fracture toughness data
for HPS70W. Weldability and hydrogen-induced-cracking studies have been performed at
LeTourneau University.

6
1.2 Review of HPS70W flexural test data
The focus on much of the experimental and numerical research studies of HPS70W so
far has been on the flexural capacity and ductility of compact and non-compact bare steel HPS
plate girders (White and Barth, 1998; Yakel, Mans, Azizinamini, 1999; Green et al, 2000;
Barth 2000; Fahnstock 2000; Yakel 2002). The ductility is governed by the compression
flange local buckling limit state, as would occur in positive bending during unshored
construction or at the piers in the negative moment region of continuous girders.
AASHTO Specifications limit non-compact girders (slender compression flange) to
yield moment capacity while compact sections may reach their plastic moment strength.
Sections that are compact and satisfy more stringent bracing requirements are also allowed
some inelastic moment redistribution, i.e. 10% of the maximum elastic pier moments can be
redistributed to positive bending moment.
A standard measure of ductility for flexural members is the inelastic rotational
ductility. To illustrate the computation of the rotational ductility, the girder test performed in
this research will be briefly described, although details of the test and the results are described
further in Section 2.3. The asymmetric girder, shown in Figure 1.1, was proportioned with a
very thick (8-inch wide by 3.5-inch thick) compression flange in order to get the location of
the neutral axis at the top of the web. The high neutral axis location was intended to simulate
the positive moment flexural behavior of a composite section and associated high strain
demand in the tension flange.

7
Figure 1.1 - Large-scale girder test specimen geometry
In order to maximize the tensile strain demand, the girder was designed to suppress
web buckling, local flange buckling, and lateral torsional buckling. The girder was tested in
three-point bending on a 20-foot span. The HPS-70W tension flange was 8-inches wide and
0.75-inches thick, the same cross section as the wide-plate test specimens. The web was 26
inches deep, giving an overall depth of 30.25 inches.
Rotation angles were measured at the end of the girder and deflection was measured at
the center of the girder, from which an estimate of the rotation at the center of the girder was
obtained. Rotation angles at the end and at the center of the girder are illustrated in Figure
1.2.

8
Figure 1.2 – Definition of rotation angles at the end and at the center of a beam
Figure 1.3 shows the moment vs. end rotation curve for the HPS70W girder test
performed in this research project. The plastic moment capacity of the girder (2950 ft-kips) is
shown as a horizontal dotted line. An estimate of the rotation corresponding to the plastic
moment is used to separate the plastic deformation from the elastic deformation.
Identification of the experimentally measured rotation at the proportional limit or at the point
where the plastic moment is reached is difficult and imprecise. Therefore, an easily
calculated quantity, the elastic rotation, is used as a reference rotation. The elastic rotation
(Θy) is the elastically calculated rotation corresponding to an elastic moment equal to the
plastic moment capacity. In Figure 1.3, Θy is equal to 2.34% radians and this is shown as a
vertical dotted line.

9
Figure 1.3 - Moment rotation curve for three-point bending test of HPS70W girder
The maximum plastic rotation (Θp) is the rotation at failure or at the point when the
moment rotation curve crosses back below the plastic moment capacity. In the case of this
girder test (the data shown in Figure 1.3), the girder failed suddenly and catastrophically by
lateral-torsional buckling at a rotation of about 11.4% before it crossed back below the plastic
moment capacity.
The rotational ductility (R) is calculated as follows (Lukey and Adams 1969):
( )y
ypRθ
θθ −= Eq. 1.1
From the data in Figure 1.3, the rotational ductility for this HPS70W girder was about 3.9.
Beam End Rotation
0
1000
2000
3000
0% 4% 8% 12%radians
Mo
men
t (k
*ft)
θθy= .0234
Mp=2951 k*ft
(θθp-θθy)/θθy=3.87
θθp=0.114

10
A specific level of rotational ductility (i.e. R = 3) has been established as sufficient to
allow girders and beams to allow for some inelastic moment redistribution in flexure
(Galambos, et al, 1997). Because of concerns that high-strength steels cannot provide this
rotational ductility, AASHTO has historically limited the strength of sections with MSYS greater
than 65 ksi to the yield moment.
The recent studies of negative bending of HPS70W (White and Barth, 1998; Yakel,
Mans, Azizinamini, 1999; Green et al, 2000; Barth 2000; Fahnstock 2000; Yakel 2002) show
that compact HPS70W plate girders are able to develop their plastic moment capacity but are
not able to provide rotational ductility of 3 in negative bending. As a result, the 10%
redistribution provisions stated in section 6.10.4.4 of the AASHTO LRFD Bridge Design
Specification and the inelastic methods of analysis as stated in section 6.10.10 should not be
used in with HPS70W plate girders. These recommendations are now reflected in the 2000
interim version of the LRFD Specifications. Similar finings were found at Lehigh University
for plate girders made with HPS100W (MSYS of 100 ksi) (Fahnstock 2000).
As demonstrated in the A514 girder tests of McDermott (1969) discussed above, it is
also possible that the tension flange could limit the rotational capacity of a girder, especially
in the positive moment regions. Therefore, specific levels of tensile flange ductility are also
required for girders and also for tension members. Tension flange or tension member
ductility may be limited by brittle fracture, necking and tensile rupture in the gross section, or,
if there are any holes in the cross section, by tensile rupture on the net section (so called net-
section fracture).
Experimental work assessing the tension flange ductility of HPS70W is very limited.
Before the girder test performed in this study (the results in Figure 1.3), two composite girder

11
tests were conducted at University of Nebraska – Lincoln (Mans 2002). One of the specimens
was designed to maximize the strain in the tension flange -- 1.2% strain was measured before
crushing of the concrete. The strain in the girder test performed in this study exceeded 6%,
in comparison. Therefore this test created extremely large tensile flange ductility demand,
far in excess of what would typically be experienced in a typical bridge girder in either
positive or negative bending.

12
1.3 Relationship of strain hardening to tensile ductility
The tensile ductility is limited by the strain at which necking begins. Theoretically, it
can be shown that there is a connection between the strain at which necking begins (also the
point of ultimate strength in a tension test) and the strain hardening of the steel. The
theoretical connection can be shown for the case when the inelastic region of a stress–strain
curve is represented by a power law:
nNaturalTrue Kεσ =
Eq. 1.2
where K is the strength coefficient and n is the strain-hardening exponent. It can be shown
that the necking strain is equal to the strain-hardening exponent, n (Ripling and Polakowsky,
1966).
Steel such as A514 steel, with a high Y/T that may exceed 0.9, may have a strain
hardening exponent as low as 0.08 (indicating that necking could start prematurely at about
8% strain). Ordinary Grade 50 steel, with low Y/T less than 0.8, have a strain hardening
exponent on the order of 0.2 (indicating that necking will not start until 20% strain).
Therefore, the elevated Y/T ratio of high-strength steels could result in a dramatic
reduction in their tensile ductility and associated rotation capacity. It is oversimplifying,
however, to idealize the stress-strain curve as a power law or to characterize the tensile
behavior with a single parameter (Y/T). Each steel grade has a different shape of the stress-
strain curve (Brockenbrough 1995). It is difficult to isolate the individual effects of an upper
yield point, length of the yield plateau, slope of the stress-strain curve in the inelastic range,
etc.
13
1.4 Design specification provisions
The various specification provisions for tension members and tension flanges of
flexural members are discussed next, especially the specification provisions that affect
ductility. In the AASHTO specifications for bridges, tensile ductility is assured by limiting the
selection of structural steels to those included in AASHTO material specifications for bridge
steels. These specifications were developed over the years to guarantee that bridge steel would
provide good fracture toughness and elongation.
The second, more explicit, provision of adequate ductility is through design
requirements. Although the design provisions for bridge girders appear to be primarily
focused on strength alone, many of the provisions are intended to provide adequate ductility
as well as strength. For example, Section 6.10.4.2.2 of the AASHTO LRFD Bridge Design
Specifications requires a check on the plastic neutral axis location for composite plate girders
in positive bending to assure that the steel yields significantly before concrete crushing
occurs.
There are also explicit specification provisions that account for the effect of holes in
the tension flanges of girders on the flexural capacity. These provisions prevent net-section
fracture of the tension flange. Since net section fracture is not a concern in compression,
there is no limit on the flexural capacity due to holes in the compression flange. Also, the net
section does not need to be taken onto account for deflection calculations, which can be based
on the gross-section moment of inertia. The additional elastic curvature that occurs at the net
section by virtue of the reduced moment of inertia occurs only over a very short length, and
therefore it does not contribute significantly to the deflection.
14
If there is localization of the plastic strain on the net-section without significant plastic
strain occurring on the gross section away from the net section, this will lead to a net-section
fracture in a girder tension flange. In this case, or if there is premature necking of the gross
section of the tension flange, the deformation and associated increase in curvature is localized
and only extends over a short length. There is little additional global rotation, which is the
integral of the curvature over the length. This observation is analogous to the observation that
in a tensile test, there is little additional elongation (when the elongation is expressed as a
percentage of the gage length) after necking starts, since the additional straining takes place
over a necking length which is much shorter than the gage length.
Therefore, in order to develop adequate rotational capacity for girders, it is essential to
avoid the limit state of net-section fracture of the tension flange. This is often accomplished
by limiting the applied moment on the cross section with the holes so the axial force in the
tension flange is much less than the net-section fracture capacity. For example, splice
connections in continuous girders are often located at the points of dead-load contraflexure,
where the moment demand is very small relative to the net section flexural capacity. To be
conservative, the net section flexural capacity is computed in terms of the yield moment on
the net section.
Even if the net-section fracture limit state is to be avoided, an estimate of the net-
section capacity is required. As mentioned previously, it is usually accepted that the yield
moment computed using the elastic section modulus based on the flange net area can always
be attained. However, it is not clear that in all circumstances that a flange net section can
reach the limit state of the ultimate strength on the net section. When there are holes in the
flange, there is a stress concentration factor of 3 at the edge of the hole. Therefore, the

15
material immediately adjacent to the holes begins yielding at a much lower load level and
must absorb considerable strain in order to develop the limit state of ultimate tensile strength
across the net section.
However, it is not always possible to locate holes in tension flanges in areas of low
moment demand. There may be holes in the tension flange near points of maximum moment
demand. Holes may be for miscellaneous details such as for angle connections between
connection plates and flanges (some states are reluctant to weld connection plates to the
tension flange), for bridge-mounted signs, or for fall protection during erection. If these holes
are sufficiently small, they should not affect the moment capacity, i.e. that the plastic moment
capacity on the gross section can still be reached.
Traditionally, in various steel design specifications, no reduction in the moment
capacity (relative to the plastic or elastic moment capacity of the gross section) was required
if the ratio of the net section area of the tension flange to the gross area of the flange (An/Ag)
was greater than 0.85. This rule has been referred to as the 15% rule, since the holes can be
up to 15% of the original flange gross area. If the An/Ag was less than 0.85, then the net
section area of the flange was used in calculating the section properties and, typically, only
the yield moment could be used rather than the plastic moment.
More recently, in Load and Resistance Factor Design (LRFD) specifications, the
allowable An/Ag is defined in terms of the minimum specified yield and tensile strengths. For
example, in the American Institute of Steel Construction (AISC) specifications, Equation
B10-1 (shown below as Equation 1.3) says that no reduction in the moment capacity of a
flexural member needs to be made for holes in the tension flange if:
����������� 0.75Fu �A n > 0.9 Fy Ag Eq. 1.3
16
where: Fu = specified minimum tensile strength of flange (ksi)
Fy = specified minimum yield strength of flange (ksi)
0.75 = AISC resistance factor for net-section fracture of tension members, and
0.9 = AISC resistance factor for flexure and for gross-section yielding of tension
members
Equation 1.3 compares two limit states for tension members, assuring that the net-section
fracture strength exceeds the gross-section yielding strength, i.e. assuring that net-section
fracture will not occur because the gross-section yielding will always occur first, acting like a
fuse. In this case, the holes may be ignored and the plastic moment capacity may be
calculated using the gross section area of the tension flange for design.
The resistance (or φ) factors are for the most part supposed to provide uniform
reliability for the various limit states. If this were true, then it would be appropriate to include
them in Equation 1.3. However, φ for net-section fracture was chosen to achieve much
greater reliability than for gross section yielding, because net-section fracture is a relatively
undesirable failure mode (Galambos, 1985). Therefore, net-section fracture would not be
expected to occur unless the net section was much smaller than implied by Equation 1.3. In
other words, Equation 1-3 is very conservative.
Equation 1.3 can be rearranged as:
An/Ag > (0.9/0.75) (Fy /Fu) = γ (Fy /Fu) (1.4)
where γ is equal to 1.2, which is the ratio of the φ factors.. (Note that these AISC φ factors are
different from the corresponding AASHTO φ factors (0.95/0.8) although their ratio is nearly
identical, so this does not impact the effect of these provisions.)

17
As mentioned previously, it was found in the present study that the ductility is very
good provided An/Ag > Fy /Fu, and the ductility increases rapidly as An/Ag > 1.1 (Fy/Fu).
Therefore, this AISC Equation B 10-1 has the right form, although it is not clear if γ needs to
be as great as 1.2, i.e. if the ratio of the φ factors should be used.
For A36 steel, (Fy /Fu = 0.62), AISC Equation B 10-1 would allow holes up to 25% of
the cross section to be ignored, which would be more generous than the 15% rule. However,
for typical Grade 50 steel (Fy /Fu = 0.77), AISC Equation B 10-1 would allow only 8% of the
cross section to be removed for holes. Thus, these provisions are clearly much more
restrictive than the traditional 15% rule for higher-strength steel. For HPS70W (Fy /Fu = 0.82)
it is not possible to have any reasonably sized hole and avoid a reduction in the moment
capacity.
If the inequality of Equation 1.3 is not satisfied, then the AISC provisions require that
the moment capacity be limited to the yield moment on a cross section with the following
effective tension flange area:
ny
ue A
F
FA
6
5= Eq. 1.5
If the stress is limited by using the reduced section modulus based on Ae, then net-section
fracture is not possible and need not be explicitly checked. Note that the fraction 5/6 is the
inverse of the factor γ in Equation 1.4 or the ratio of the φ factors. Equation 1.5 reveals the
dependence of this design provision on steel’s Y/T value, which is theoretically linked to the
material’s ductility capacity.
In the AISC provisions, there is a discontinuity in the flexural capacity at the point
when the inequality of Equation 1.3 is no longer satisfied. When the inequality is satisfied,

18
the moment capacity could be as large as the plastic moment capacity of the gross section. At
the point when the inequality is not satisfied, the moment capacity drops to the elastic yield
moment on the gross section (since Ae is equal to Ag at this point).
For decreasing An, Equation 1.5 allows the design to be based on the yield moment
while simultaneously insuring that the nominal stress on the net section of the tension flange
does not exceed 0.75 Fu. For Grade 36 steel, Equation 1.5 indicates that Ae can be up to 34%
greater than An. (Obviously, Ae should not be taken as greater than the gross area (Ag)). For
Grade 50 steel, Ae is only 8% greater than An.
If the ratio of the φ factors were not in Equation 1.3 and 1.5, then these equations
would insure that the nominal stress on the net section would not exceed Fu rather than 0.75
Fu. In this case, Ae could be 30% greater than An for Grade 50 steel. So whether the ratio of
the φ factors appears in these Equations has an especially significant impact for Grade 50 and
higher strength steel.
There is reason to believe that the criterion for net section fracture of a tension flange
does not need to be as stringent as the 0.75 Fu criterion for net section fracture of a tension
member. The behavior of a tension flange in a girder is much different than the behavior of a
tension member, for which the resistance factor of 0.75 was obtained. If a tension member is
under fixed load and the stress on the net section reaches the actual tensile strength, then
fracture occurs instantly. However, the deformation of a tension flange is limited by the
restraint provided by the web and therefore is under a loading state closer to fixed
displacement, even if the girder itself is under fixed load. Although the tension flange can
carry no additional load, the strain on the net section cannot increase rapidly without a
19
corresponding localization of strain in the girder web. Therefore, it is possible that the stress
in a tension flange can reach Fu without causing instantaneous fracture.
There may even be some reserve capacity since the flexural capacity may continue to
increase slightly as a plastic stress distribution spreads over the web. The best possible
flexural capacity would be the plastic moment capacity on the net section. It typically requires
a strain in the tension flange of between 6 to 10 times the yield strain (1.5 to 2.5% strain for
HPS70W) for the plastic moment to develop on a cross section. There is some reason to
suspect that this may be possible for compact sections with holes in the tension flange, even if
the An/Ag ratio is much less than the Y/T ratio. For example, this was observed in girder tests
reported by Dexter and Gentilcore (2002) with large cracks in the tension flange. These
girders could reach the plastic moment on the remaining uncracked net section, provided they
had sufficient fracture toughness.
Therefore, the two key questions to be addressed in the additional girder tests to be
performed as part of the second phase of this research are:
1) whether limiting the stress in the tension flange to Fu gives a sufficiently
small probability of net-section fracture, or whether the net section stress
must be limited to 0.75 Fu as in a tension member; and if Fu is sufficient,
2) whether the tension flange can continue to strain up to 2.5% after reaching a
nominal stress on the net section equal to Fu so that the plastic moment on
the net section can be attained.
The AASHTO LRFD Specifications do not allow any holes at all if the plastic
moment capacity is to be used in design. If there are any holes, the maximum moment
capacity is limited to the yield moment. This seems more conservative than the AISC

20
Specifications, however the designs of bridge girders by the LRFD Specifications are usually
governed by a serviceability provision to avoid yielding at an overload condition, therefore
the plastic moment capacity is rarely needed.
Section 6.10.3.6 of the AASHTO LRFD Specifications require calculation of an
effective flange area. As shown in Equation 1.6 below, this effective flange area is calculated
as a combination of the net area of the flange plus a factor β times the gross area of the flange.
Ae = An + βAg ≤ Ag Eq. 1.6 in which:
β = (An/Ag) [ φuFu / φyFy – 1 ] ≥ 0.0 where in the AASHTO Specifications:
φu = resistance factor for net-section fracture of a tension member = 0.80
φy = resistance factor for gross--section yielding of a tension member = 0.95
Note that the factor β is analogous to the fraction of the gross area below which the
holes must be taken into account when computing the yield moment. Thus, β is somewhat
analogous to the old 15% rule, but the rule is now a function of the net and gross areas and the
materials yield and tensile strengths.
The AASHTO LRFD Specification Section 6.10.3.6 has also had a limitation on the
maximum diameter of the hole, 1.25 inches, above which the factor β must be taken as zero.
This limitation is based on the Allowable Stress Design (ASD) Table 10.32.1A in the
Standard Specifications, which states that the net section must be used when the holes exceed
this diameter. This ASD provision was designed to account for cases not adequately covered
when β was a flat 15%. It is presently proposed that this limitation on hole size be removed
since β is now explicitly calculated.

21
Section 6.10.3.6 also explicitly states that the compression flange area may be taken as
the gross area, regardless of whether there are holes in the compression flange. The
commentary states that net section fracture is not a concern for compression flanges.
Specification 6.10.3.6 can be simplified and shown to be essentially the same as
Equation 1.5:
Ae = An + ( An/Ag )[ φuFu / φyFy – 1 ] Ag Ae = An + An (φuFu / φyFy – 1 )
Ae = An + An (φuFu / φyFy ) – An
Ae = (φuFu / φyFy ) An
Ae = ( φu / φy ) ( Fu / Fy) An (Eq. 1.7)
However, in the AASHTO specifications, even if the percentage area of the holes is less than
β, the moment capacity must still be limited to the yield moment capacity.
For the AASHTO LRFD Specification, the ratio of the resistance factors results in a
factor of 0.84, and that the ratio of Fu/Fy must be less than 0.84 in order for there to be any
increase in the effective area above the net area. This factor of 0.84 is essentially the same as
the 5/6 in Equation 1.5 and the inverse of the factor γ used in Equation 1.4.
Each type of steel has a unique distribution of possible Y/T values and a unique
relationship between the mean Y/T and the ratio of the specified values Fu/Fy. For example,
Table 1.1 shows some statistics of the Y/T distribution for A514, HPS70W, various Grade 50
steels, and A36 plate. The data are assumed to be normally distributed and therefore the
distribution can .be described by the mean and the coefficient of variation (COV). The mean
Y/T is a slightly less than but nearly equal to the Fy /Fu ratio for the A36 and Grade 50 steels

22
while the mean Y/T for A514 and HPS70W is greater than the Fy/Fu ratio. Clearly the
specifications should reflect this difference.
Table 1.1: Parameters of Y/T distribution for HPS70W and other structural steels
Steel specified Fy /Fu mean Y/T Coefficient of Variation
*HPS70W 0.82 0.84 0.060
**A36 plate (t > 0.75”) 0.62 0.61 0.080
**A572 Gr 50 plate (t >0.5”) 0.77 0.72 0.052
**A588 Gr 50 plate (t <2”) 0.77 0.74 0.066
***A992 shapes 0.77
0.76
0.040
**A514 plate (t<2.5”) 0.87
0.94 0.017
*this study. **Brockenbrough, 1995 ***Dexter et al, 2001
The experimental results presented in Section 2.2 of this report suggest that, if the Y/T
is known, γ in Equation 1.4 need not exceed 1.0 (or equivalently that the number 0.84 in
Equation 1.5 or 1.7 need not be less than 1.0). However, in design, the Y/T is not known –
rather the only thing known is the ratio of the minimum specified values, Fy /Fu. The
statistical variation of Y/T was studied in detail in Section 4.3 to determine adequate margins
of safety to use in design equations. An upper bound or safe Y/T value was derived for the
grades of steel in Table 1.1 including HPS70W steel. The safe Y/T value was compared to
the Fy/Fu ratio to compute an appropriate γ factor for proposed improved design equations as
an alternative to the ratio of the φ factors.

23
2.0 Experiments and analyses
Tensile experiments were conducted on 8-inch wide 0.75-inch thick plates with
various net-section configurations. Plates without holes, with single holes of varying size,
with hole groups, and with splice connections were tested. The experiments, described in
Section 2.2, were conducted to characterize the effect of the net section on the tensile ductility
of HPS70W and compare it to the ductility of similar specimens made with HSP100W and
A709 Grade 50 steel.
In addition, one flexural test was also conducted. As discussed previously in Section
1.2, the girder featured a tension flange that was identical in cross section to the tension
specimens. There were no holes in the flanges. This test was conducted to compare the
behavior of the tension flange to the tension members and to characterize the ductility demand
for the tension flange. Details of the results of this test are discussed in Section 2.3.

24
2.1 Tensile properties of materials
The steel plates used to fabricate the wide-plate tensile specimens were obtained from
two different heats of HPS70W from Bethlehem-Lukens Plate. The plate may have been
made by either the Quenched and Tempering (QT) process, or Thermo-Mechanical Control
Processing (TMCP). Specimens were also made from one heat of A709 Grade 50 and from
one heat of HPS100W. These additional materials are meant to represent an upper bound and
lower bound for ductility, respectively, and to provide a frame of reference within which to
judge the HPS70W results.
The ¾” thick ASTM A709 HPS70W plates tested in this investigation were supplied
by Bethlehem-Lukens Plate and were produced in their Burns Harbor Mill. According to
ASTM A709, the MSYS for HPS70W is 70 ksi and the specified range of tensile strengths is
85 – 110 ksi. Table 2.1 compares the tensile properties of both HPS70W heats, labeled L and
H, according to the mill test report (MTR), measured with conventional 1.5” wide flat tensile
specimens, and measured with 8” wide monolithic (i.e. no holes) tensile specimens.
The HPS70W-L wide-plate, average coupon and average MTR values show good
agreement and the variation among the two test results is minimal. The yield strength of the
HPS70W-H heat appears to be slightly less than the L heat, although one of the MTR results
shows higher yield (94.4 ksi) and tensile strength (104 ksi), and also had the highest Y/T
(0.90). It is widely believed that the tensile test performed at the mill is typically performed
at a strain rate at the upper range of what is allowed under ASTM A370.

25
Table 2.1 – Comparison of Individual and Average Tensile Test Results
Material Fy
8” WIDE (ksi)
Fy COUPON (ksi)
Fy MILL (ksi)
Fu 8” WIDE (ksi)
Fu COUPON (ksi)
Fu MILL (ksi)
Y/T 8” WIDE
Y/T COUPON
Y/T MILL
HPS70W-L 79.95 81.50 79.50 80.50
77.80 79.60 78.70
89.81 95.00 94.70 94.85
89.80 90.00 89.90
0.89 0.86 0.84 0.85
0.87 0.88 0.88
HPS70W-H 76.00 75.90 75.50 75.70
79.90 94.40 87.15
86.89 92.30 88.80 90.55
94.00 104.4 99.20
0.87 0.82 0.85 0.84
0.85 0.90 0.88
A709 Gr 50 60.75 56.00 52.10 54.05
59.00 58.00 58.50
80.99 82.40 81.30 81.85
80.00 79.00 79.50
0.75 0.68 0.64 0.66
0.74 0.73 0.74
HPS100W 115.95 104.93 103.23 104.08
- 121.33 109.44 112.34 110.89
- 0.96 0.96 0.92 0.94
-
The ¾” thick A709 Grade 50 plates were supplied by a local distributor. The Grade
50 wide-plate, average coupon and average mill test results showed good agreement. As
shown in Table 2.1, the wide plate test had yield strength that was on the high side of the
other tests and consequently has a higher Y/T than the coupon tests.
The ¾” thick HPS100W plate tested in this investigation was donated to the project by
the Federal Highway Administration from their Turner-Fairbank Highway Research Center.
According to ASTM A709, the MSYS for HPS100W is 100 ksi and the MSTS range is 110 -
130 ksi. Due to limited load capacity of the test machine, 600 kips, the width of the gage
length of these specimens was reduced to 6 inches. These details can be material availability,

26
the wide plate tests for the HPS100W were only 6” wide rather than 8” wide as the other
specimens. Table 2.1 provides the tensile properties of the HPS100W plate according to the
6” wide-plate specimen results, and the coupon tests. Mill certifications could not be found
for the HPS100W steel plate. The wide plate test shows consistently higher yield and tensile
strengths than the coupon tests.
In summary, there is no consistent trend in the differences between the MTR, the
coupon tests, and the wide-plate tests. The most likely origin of the differences between these
tests is variation of material properties at the different locations in the plate. It is concluded
that there is no demonstrable effect of the width of the plates. Therefore, the results of the
wide plate tests should be equally applicable to other widths of tension members and flange
plates.

27
2.2 Wide-plate tests
Wide-plate specimens were tested to establish the fundamental behavior of HPS70W
tension members before testing more complex flexural members.
2.2.1 Wide-plate specimens
Figure 2.1 shows the basic specimen design. The width of the HPS100W specimens
was only 6”, due to limited load capacity. A variety of An/Ag ratios could be tested simply by
adjusting the diameter of the hole in the specimen, including no hole at all for the monolithic
tests.
Figure 2.1 – Geometry of Wide-Plate Tension Specimen
3"
4"
4"
3"
12" 12"3" 3"11"
4"
14"
3" 3" 3"3"
11"
4"
1 1/8" Dia. (typ)Detail A
D2
D1Detail A

28
The specimens were bolted into grips as shown in Figure 2.2. Nine 1” diameter A 490
bolts were used with a hole diameter of 1.125”.
Figure 2.2 – Wide-Plate Tension Specimen in Test Fixture
Specimen identification was based on a combination of steel grade, differentiation
between the H and L sample of HPS70W, and the fabricated net section property. This
identification system is explained in Figure 2.3. (For the Grade 50 and HPS100W test
specimens, there is no H and L because there is only one heat tested.)

29
Figure 2.3 – Identification System for Specimens
Six wide-plate tension specimens were flame cut from both the HPS70W-H plate and
the HPS70W-L plate. One monolithic specimen, designated as the “0.0” specimen, from each
of the HPS70W samples was then tested to failure to find the apparent yield and ultimate
strength values for the wide-plate specimen geometry. Based upon these strength results,
specimen HPS70W-1.1-H was fabricated by drilling a single, centroidal hole in the gage
length of an H and L sample to create an An/Ag ratio equal to 1.1(Y/T).
This initial net-section ratio was selected based on the observation that the design
specifications require that the An/Ag ratio be greater than 1.2(Y/T) to avoid a reduction in
moment capacity, and it was anticipated that these specifications would be shown to be too
conservative and therefore the specimens with An/Ag equal to 1.1(Y/T) should perform well.
If not, the An/Ag could be increased in the next set of experiments.
HPS70W - 1.0 - H
H - "high" sample of materialL - "low" sample of material
steel grade ratio of Y/T that An/Ag was fabricated(for above example: An/Ag = 1.0(Y/T))
OR12h ( 12-hole net section) or
12hSp ( 12-hole, spliced net section)

30
As it turned out, the “1.1” specimens, i.e. the specimens with An/Ag equal to 1.1(Y/T),
did perform well in all cases. Therefore, the additional tests were performed (one for each
heat) on “1.0”, and “0.9” specimens as shown in Table 2.2.
Table 2.2 – Test Matrix for Monolithic and Single Hole Specimens
Specimen Design An Hole Dia. (in)
Fabricated D1 (in)
Fabricated D2 (in)
Fabricated AVG D
(in)
Fabricated An/Ag
Fabricated An/Ag (Y/T)
HPS70W-0.0-H 0.000 0.000 0.000 0.000 1.000 -
HPS70W-0.0-L 0.000 0.000 0.000 0.000 1.000 -
HPS70W-0.9-H 1.688 1.699 1.696 1.698 0.789 0.902
HPS70W-0.9-L 1.563 1.596 1.569 1.583 0.806 0.905
HPS70W-1.0-H 1.000 1.040 1.031 1.036 0.872 0.997
HPS70W-1.0-L 0.875 0.873 0.882 0.878 0.894 1.004
HPS70W-1.1-H 0.297 0.300 0.299 0.300 0.964 1.102
Gr50-0.0 0.000 0.000 0.000 0.000 1.000 -
Gr50-1.0 2.080 1.996 2.004 2.000 0.750 1.007
Gr50-1.1 1.488 1.404 1.412 1.408 0.824 1.107
HPS100W-0.0 0.000 0.000 0.000 0.000 1.000 -
HPS100W-0.9 0.816 0.827 0.835 0.831 0.862 0.901
HPS100W-1.0a 0.240 0.259 0.273 0.266 0.956 1.000
HPS100W-1.0b 0.240 0.271 0.241 0.256 0.957 1.002
*Y/T Determined from 8” Monolithic Wide-Plate “0.0” Specimen Results
Because of a limited selection of drill bit sizes, the actual hole size was not exactly
that required to achieve the precise ratio of (An/Ag)/(Y/T) that was desired. Table 2.2
provides the final fabricated (An/Ag)/(Y/T) values in the last column, where the Y/T is that
measured in the monolithic “0.0” specimen.

31
The Y/T value of the HPS100W is so large that the hole size cannot be very large in
these specimens, as shown in Figure 2.4 for the specimen where the An/Ag was approximately
equal to the Y/T. A penny provides scale for the hole size. This illustrates the impracticality
of some of the design provisions for holes in tension flanges discussed in the previous section.
Figure 2.4 – Fabricated Hole Size for HPS100W-1.0(a)
In addition to these specimens with one hole, specimens with 12 holes and specimens
with a splice joint were also tested. Figure 2.5 shows the specimen with the splice joint. The
cross section of the main plate is the same as the other specimens. The splice plates are also
0.75 inches thick, ensuring the main plate is the critical component.

32
Figure 2.5 – HPS70W Splice Specimen
The test matrix for these splice specimens is shown in Table 2.3. An for these
specimens is the net-section area of the critical row of holes that experienced fracture during
testing. The Y/T from the monolithic wide plates is used to normalize the An/Ag ratios in the
table.
3"
4"
4"
3"
12" 12"3" 3"
14"
3" 3" 3"
11" 11"
13 1/16"
2 1/2" 2 1/2" 2 1/2"2 1/2"
1/16"*allowance for Kerf
1 1/2"1 1/2"
1 1/2" 1 1/2"
2"
2"
2"
2"
2"
2"
2"
2"
16 1/16"
3"
* While only one cover plate is shown on these plans, two cover plates are associated with this specimen, one for each side of the bolted splice region. Each cover plate consisted of 3/4" thick, HPS70W-L plate
for both splice specimens.
A B C D E F
W
t = gage length thickness
1 1/8" Dia. (typ)
1 1/16" Dia.Gage LengthHoles (typ)
1 1/16" Dia.Cover PlateHoles (typ)
33
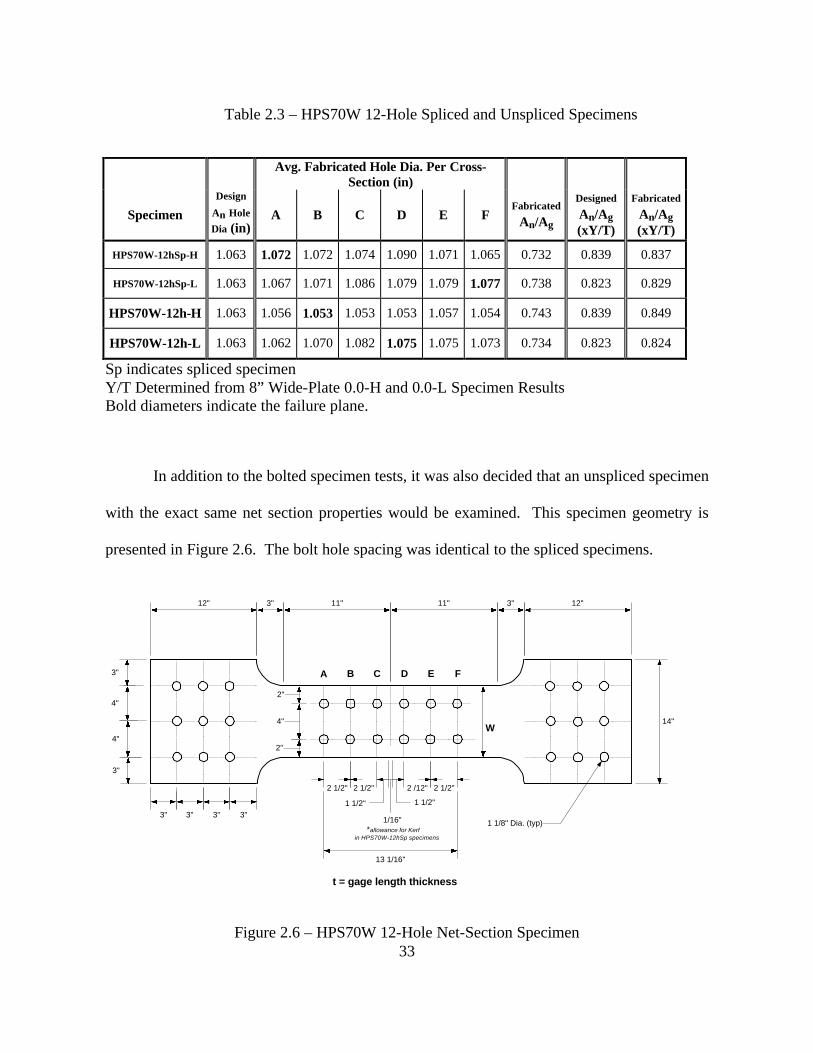
Table 2.3 – HPS70W 12-Hole Spliced and Unspliced Specimens
Avg. Fabricated Hole Dia. Per Cross-
Section (in)
Specimen
Design
An Hole
Dia (in) A B C D E F
Fabricated An/Ag
Designed An/Ag (xY/T)
Fabricated
An/Ag (xY/T)
HPS70W-12hSp-H 1.063 1.072 1.072 1.074 1.090 1.071 1.065 0.732 0.839 0.837
HPS70W-12hSp-L 1.063 1.067 1.071 1.086 1.079 1.079 1.077 0.738 0.823 0.829
HPS70W-12h-H 1.063 1.056 1.053 1.053 1.053 1.057 1.054 0.743 0.839 0.849
HPS70W-12h-L 1.063 1.062 1.070 1.082 1.075 1.075 1.073 0.734 0.823 0.824
Sp indicates spliced specimen Y/T Determined from 8” Wide-Plate 0.0-H and 0.0-L Specimen Results Bold diameters indicate the failure plane.
In addition to the bolted specimen tests, it was also decided that an unspliced specimen
with the exact same net section properties would be examined. This specimen geometry is
presented in Figure 2.6. The bolt hole spacing was identical to the spliced specimens.
Figure 2.6 – HPS70W 12-Hole Net-Section Specimen
3"
4"
4"
3"
12" 12"3" 3"
W14"
3" 3" 3"
11" 11"
2 1/2" 2 1/2" 2 1/2"2 /12"
1/16"*allowance for Kerf
in HPS70W-12hSp specimens
13 1/16"
1 1/2"1 1/2"3"
A B C D E F
2"
4"
2"
1 1/8" Dia. (typ)
t = gage length thickness
34
2.2.2 Wide-pate test procedure
In each specimen, strains were measured on the gross section with high-elongation
strain gages. In specimens with holes, two high-elongation gages were placed at equal
spacing between the edge of the net-section hole and the edge of the plate. Displacement
within the gage length was measured with two Linear Variable Differential Transformers
(LVDT) – one on the front and one on the back. The gage length for the HPS100W specimens
was about 35.5 inches while the gage length for all other specimens was about 26.5 inches.
Load and stroke rate were recorded from the universal testing machine.
The effect of strain rate was explored on HPS100W specimens, since this steel had the
greatest Y/T. Two HPS100W specimens were tested with (An/Ag)/(Y/T) ratios of 1.0. These
two tests were conducted at two different strain rates, i.e. 0.16% sec-1.and 0.007% sec-1. This
variation had no significant effect on the strength or elongation behavior and therefore these
two tests were considered identical in further analysis of the results. All other tests were
conducted at an intermediate strain rate of approximately 0.09% sec-1, which corresponds to a
test machine crosshead stroke rate of about 0.025 inches/sec
Following installation and instrumentation, an elastic cycle up to half of the yield load
was applied to each specimen. The instrumentation was then re-zeroed before the actual test
was conducted.

35
2.2.3 Results of the wide-plate tests
Figures 2.7 and 2.8 show two typical curves of load (normalized by the gross area) and
the LVDT elongation (which is the LVDT displacement normalized by the gage length) for
specimens HPS70W-0.0-H and HPS70W-1.0-L. The results for each LVDT are shown
separately, and it can be seen there is little difference or out-of-plane bending. Therefore, in
further discussion, the elongation will be derived from the average of the two LVDT
measurements.
Figure 2.7 – Load vs. elongation for monolithic specimen HPS70W-0.0-H
HPS70W-0.0-HGross Section Elongation Behavior
0
20
40
60
80
100
0 2 4 6 8 10 12 14 16 18
εε(%)
σσ(ks
i)
East LVDT
West LVDT

36
Figure 2.8 – Load divided by gross section area vs. elongation for HPS70W-1.0-L
In order to define the ductility in a standard way, a scheme for tension members was
devised that was analogous to the way flexural ductility is defined, as was shown in Figure
1.3. The yield strain could was defined as the MSYS (70 ksi for HPS870W) divided by the
elastic modulus (29,000 ksi), which is about 0.24%.
Alternatively, the apparent proportional limit from each load gross section stress vs.
elongation curve could have been used, or the elastic strain corresponding to the yield strength
of the particular material could have been used, either from the 8” wide monolithic specimen
or from the coupons. It was found that these other definitions of the yield strain caused
unexpected variation in the calculated ductility, and more consistent results were obtained
when the yield strain was defined in terms of the MSYS.
HPS70W-1.0-LGross Section Elongation Behavior
0
20
40
60
80
100
0 2 4 6 8 10 12 14 16 18
εε (%)
σσ (k
si)
East LVDT
West LVDT

37
The maximum elongation (εtotal) was defined as the elongation when the nominal
stress vs. elongation curve fell below the MSYS, as shown in Figure 2.9. The ductility (R)
was then calculated by subtracting the yield strain (εy) from the maximum elongation and then
dividing the difference by the yield strain, i.e.:
( )y
ytotalR
εεε -
= Eq. 2.1
For example, the tensile ductility calculated using this equation for the data in Figure 2.9 is
about 37.
Figure 2.9 – Load divided by gross section area vs. elongation for HPS70W-1.1-H showing
maximum elongation and tension ductility
HPS70W-1.1-HGross Section Elongation Behavior
0
20
40
60
80
100
120
140
0 2 4 6 8 10 12 14 16 18
εε (%)
Fg
(ksi)
FAg ult = 89.443 ksi
ευ = 8.017 %
FAg = 70.000 ksi
εtotal = 9.192 %
FAg ult
εεtotal
Figure A7
εεy HPS70W = 0.241 %
Fy HPS70W = 70 ksi

38
The total elongation quantities for the 12h and 12hSp cases were calculated in a
slightly different manner since the gross section stress did not exceed the MSYS. For these
cases, an apparent yield point in the gross-section stress vs. elongation behavior was projected
horizontally. The point at which the gross-section stress fell below this projection was taken
as the total elongation for the specimen.
In addition, for the purposes of comparison with the single-hole specimen data, the
total elongation quantities for the HPS70W-12h specimens have been divided by 6 to account
for the fact that the localized elongation took place simultaneously on all 6 lines of holes. For
the same reason, the HPS70W-12hSp elongation quantities have been divided by 2 to account
for the two lines of bolt holes that experienced localized inelastic elongation.
Table 2.4 summarizes the data from the tests on HPS70W. The tensile ductility as
defined in Equation 2.1 is given in the last column on the right. Precisely how much tensile
ductility is required of a tension flange in order to permit adequate rotational ductility of a
girder is not yet clear. For a given level of rotational ductility, the strain demand in the
tension flange depends strongly on whether it is positive or negative bending, the depth of the
girder, the moment gradient, composite behavior, compactness, and many other factors yet to
be quantified for a range of conditions.
For example, the experiments conducted at University of Nebraska – Lincoln (Mans
2002) indicated that the strain in the tension flange was a maximum of 1.2% before crushing
of the concrete. Note that every wide-plate specimen tested, even the splice specimens where
the An/Ag is equal to 0.83 times the Y/T, exhibit at least this much elongation. Given that the
yield strain for the MSYS of 70 ksi is 0.24%, this would correspond to a tensile ductility
demand of about 4.

39
Table 2.4 – Summary of HPS70W Wide-plate Tensile Test Results
Specimen Peak Load
FAn FAn Fu
FAg FAg Fy
Total Elongation
ε total
Net Plastic Elongation
ε plastic
ε plastic
εy
(kips) (ksi) (ksi) (%) (%) HPS70W-
0.0-H 538 86.8 1.00 86.8 1.14 14.59 14.35 59.5
HPS70W-0.0-L
557 89.8 1.00 89.8 1.12 13.34 13.10 54.3
HPS70W-0.9-H
446 91.0 1.05 71.7 0.94 2.38 2.14 8.8
HPS70W-0.9-L
463 93.5 1.04 75.3 0.94 2.72 2.48 10.2
HPS70W-1.0-H
517 94.6 1.09 82.5 1.09 2.72 2.48 10.2
HPS70W-1.0-L
523 92.8 1.03 82.9 1.04 2.94 2.70 11.2
HPS70W-1.1-H
549 92.8 1.07 89.4 1.18 9.19 8.95 37.1
HPS70W-12h-H
423 89.9 1.04 66.8 0.88 6.54 5.10 3.5*
HPS70W-12h-L
431 95.0 1.06 69.7 0.87 6.12 4.68 3.2*
HPS70W-12hSp-H
430 94.1 1.08 68.9 0.91 3.68 3.20 6.6**
HPS70W-12hSp-L
452 97.8 1.09 72.2 0.90 3.60 3.12 6.4**
*tensile ductility divided by 6 for comparison to results with single hole
**tensile ductility divided by 2 for comparison to results with single hole
Analysis of cross sections show that it takes between 6 to 10 times the yield strain in
the tension flange, in the case of HPS70W about 1.5 to 2.5% strain, to be able to develop the
plastic moment capacity (Mp) of a girder. In the girder test performed in this study (the result
shown in Figure 1.3), the strain was about 10 times the yield strain when Mp was first
developed. If this were the criterion for tensile ductility, then any specimen where the An/Ag
was equal to or greater than the Y/T would exhibit sufficient ductility to develop Mp.

40
At the end of the girder test, the strain in the tension flange exceeded 6%. This girder
was proportioned in a very unusual way to maximize the tension flange strain demand, as
explained later in Section 2.3, therefore this strain demand should represent an upper bound.
Note that only the “1.1 specimen”, i.e. the specimen where the An/Ag is equal to 1.1 times the
Y/T, had sufficient ductility to meet this demanding condition.
Six-percent strain corresponds to tensile ductility demand on this flange of about 24,
which corresponded to a rotational ductility of about 3.9. At a rotational ductility demand of
3 for this girder (widely accepted as adequate for plastic redistribution of moments), the
tension ductility demand would be about 18. In summary, adequate tensile ductility is
somewhere in the range from 6 to 18.
As the loading increased on the single-hole specimens, yielding began along four yield
lines radiating out from the center of the hole at an angle of approximately 45 degrees. A
period of strain hardening then occurred, and the yielding spread in the regions within the
initial yield lines, as shown in Figure 2.10.
The specimen shown in Figure 2.10 was fabricated with a An/Ag nominally equal to
0.9 (Y/T), significantly less than the 1.2(Y/T) (refer to Equation 1.4). These specimens never
yielded significantly on the gross section. The localization of strain in the net section was
characterized by gradual necking in both specimen thickness and width. A ductile fracture
initiated at the edge of the hole a quickly propagated across the net section, as shown in
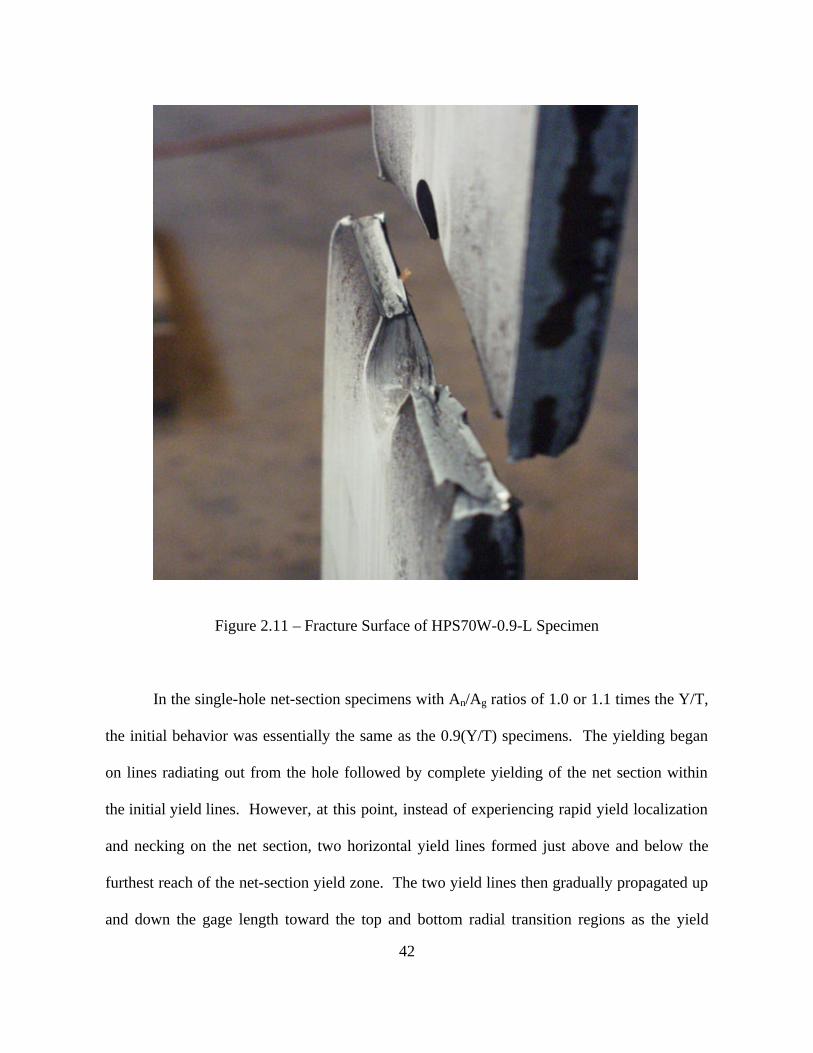
Figure 2.11. Note that although these specimens failed by net section fracture, they did
exhibit at least 2.4% strain and a tensile ductility of about 9.

41
Figure 2.10 – HPS70W-0.9-L specimen after testing
42
Figure 2.11 – Fracture Surface of HPS70W-0.9-L Specimen
In the single-hole net-section specimens with An/Ag ratios of 1.0 or 1.1 times the Y/T,
the initial behavior was essentially the same as the 0.9(Y/T) specimens. The yielding began
on lines radiating out from the hole followed by complete yielding of the net section within
the initial yield lines. However, at this point, instead of experiencing rapid yield localization
and necking on the net section, two horizontal yield lines formed just above and below the
furthest reach of the net-section yield zone. The two yield lines then gradually propagated up
and down the gage length toward the top and bottom radial transition regions as the yield

43
strength of the gross-section was developed. Throughout this period of gross-section
yielding, the net section continued to experience strain hardening and a resulting increase in
load capacity. Following complete yielding of the gross section, necking slowly developed in
the net section until specimen failure was experienced by net-section fracture.
Figure 2.12 shows the final state of the test for which the data were shown in Figure
2.9. This failure mode was typical of the 1.0 and 1.1(Y/T) specimens. As evidence of both
the increased An/Ag ratio and good material ductility, whitewash flaking and yielding can be
noted throughout the gage length of the specimen.
Figure 2.12– Final state of HPS70W-1.1-H specimen

44
Each of the 12 holes experienced the same, four-45° yield line behavior observed for
the single-hole specimens. These yield lines connected with those from the adjacent holes to
form a yield lattice, as in Figure 2.13. Following yielding along each hole plane, the material
contained enough strain hardening capacity to continue to increase its load capacity.
However, since the An/Ag is only about 0.83 times the Y/T for these specimens, gross section
yielding was not expected. Localized strain continued along the yield lattice and initiation of
necking on several different hole planes was then observed.
Figure 2.13 –Final state of HPS70W-12h specimen

45
The final failure was a two-step process. An initial fracture propagated through the
ligaments between the hole and the edge of the specimen. The remaining middle ligament
then proceeding through full strain hardening, necking and eventual fracture on a shear plane
oriented at 45 degrees relative to the loading. A close-up of the fracture surface is shown in
Figure 2.14.
Figure 2.14 – Fracture surface of HPS70W-12h specimen

46
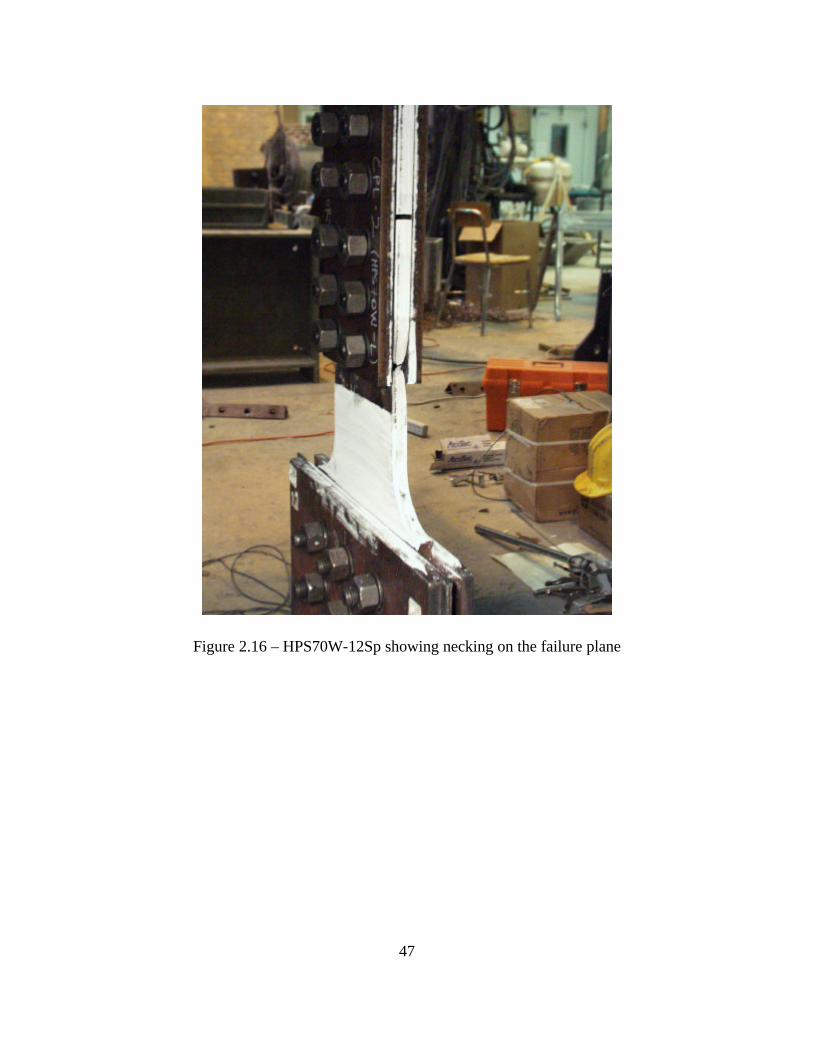
Even though the net section size of the bolted splice specimens was identical to that of
the 12-hole specimens (An/Ag equal to about 0.83 times the Y/T ratio), the behavior under
direct tension was completely different. In the splice specimen, some fraction of the load is
transferred from the pull plates into the splice plates at each row of bolts (Kulak and Fisher,
1969). Therefore, the yielding only takes place on the net section at the lead row of bolt
holes, since the load is reduced on all the other net sections. Figure 2.15 shows a yield line
emanating from the lead row of bolt holes. As it turns out, the deformation is approximately
equal from each of the lead rows (top and bottom of specimen), although necking and final
fracture eventually occurs on only one of these planes, as shown in Figure 2.16.
Figure 2.15 – Initial Formation of yield line from critical net section of HPS70W-12hSp
47
Figure 2.16 – HPS70W-12Sp showing necking on the failure plane

48
2.2.4 Finite-element modeling of the wide-plate tests
The specimens were modeled using ABAQUS software. Two-dimensional plane-
stress elements with reduced integration, element S8R5, were used. This is a thin-shell
element with eight nodes and four integration points. Due to symmetry along both the
vertical and horizontal plane of all wide-plate specimens, quarter-symmetry models using the
appropriate boundary conditions were constructed for each specimen. The longitudinal
displacements were imposed on the grip edge and transverse displacements were left
unrestrained. A typical specimen model is shown in Figure 2.17. The geometry of each
quarter-symmetry model was based upon the net-section and gage-length dimensions of each
test specimen.
Figure 2.17 – Typical Specimen Finite Element Model
Net Section Edge
Center Line Edge Grip Edge
49
The analyses included the effects of large deformations. The global results such as
gross-section stress and elongation from this mesh were compared to a more coarse mesh and
were found to have converged sufficiently. Results in the refined area near the hole are
obviously going to continue to improve as the mesh is refined. However, the changes in the
predicted stresses and strains near the hole as the mesh is further refined have little impact on
the global results.
The accuracy of the results, in terms of simulating the experimental results, was
dependent on the precise description of the stress-strain curve input to the ABAQUS model.
A complete true stress-true strain curve, derived from the monolithic wide-plate tests results,
was input in a piecewise linear manner. An analysis was then made with a model of the
monolithic specimen. The results were converted back to engineering stress-engineering
strain, and were then compared to the actual monolithic test results. The input true-stress vs.
true-strain data were adjusted if necessary until the results of the analysis of the monolithic
specimens were in good agreement with the results from the experiment.
This material stress-strain curve was then used to predict the results of the experiments
with various hole sizes. It was verified that in the elastic range the stress predicted at the
edge of the hole was equal to three times the nominal gross section stress. The gradient of
the stresses across the net section in the elastic range also compared almost exactly to the
analytical stress gradient curve from a solution method presented in Timoshenko and
MacCullough (1949).
Predicting large-deformation necking behavior of plates in tension can be very
difficult and in the end is sensitive to the type of imperfection used to trigger the localizations.
Therefore, it was not attempted in these finite-element analyses to predict the actual onset of

50
failure. Instead, the model would continue to predict continued deformation without
localization and failure. Nevertheless, it is useful to be able to predict the load vs. elongation
curve up to the failure point. Therefore, the finite-element results (net-section and gross-
section strength) are recorded from the finite-element analyses at the elongation
corresponding to the elongation at failure in the experiments.
Despite the numerous possible sources of variability, the deviations between the
experimental net-section and gross-section strength data and the finite element data were quite
small. For all three grades of steel, the finite element models slightly over-predicted the
measured ultimate capacities of the specimen net sections. The models also consistently
provided predictions of maximum developed gross-section stresses that were below the
experimentally measured quantities.
The ABAQUS analyses were very effective in confirming these experimental test
results. The finite element models also provided the study with results for hypothetical
specimens outside the range of net-section properties experimentally examined.

51
2.2.5 Analyses of the wide-pate test results
Analysis of the test results and finite-element results indicated that the load and
elongation of the various materials and specimens could be correlated if they were plotted in
terms of the ratio of An/Ag to the measured Y/T of the monolithic wide-plate specimens.
Another way to look at this parameter is as the nominal strength of the net section to the
nominal strength of the gross section (without resistance factors). Figure 2.18 shows the
maximum gross-section stress for the variety of HPS-70W specimens. In Figure 2.18, the An
was based on the actual net area, rather than the design approach where the hole size would be
increased by 1/16 inch in order to compute An.
Figure 2.18 - Experimental gross-section stress for HPS70W specimens
Development of Gross-Section Yield Strength Following Net-Section YieldingDUCTILITY CRITERION (1)
0
20
40
60
80
100
120
0.7 0.8 0.9 1.0 1.1 1.2
(An/Ag)(Y/T)
FA
g m
ax
- HPS70W-H (Y/T = 0.87) - HPS70W-L (Y/T = 0.89)
Fy HPS70W-L = 79.95 ksi
Fy HPS70W-H = 76.00 ksi

52
The 12-hole specimens and the spliced specimens are shown to the left at a
(An/Ag)/(Y/T) ratio between 0.8 and 0.9. The monolithic specimen results are shown at the
right end of the plot, at a (An/Ag)/(Y/T) ratio equal to the inverse of the Y/T (since An/Ag is
equal to one). The yield strength of both HPS70W samples, as taken from the apparent yield
point of the monolithic specimens, is indicated on Figure 2.18. A nearly linear upward trend
is observed in the data, which reaches the yield stress on the gross section at a (An/Ag)/(Y/T)
ratio slightly less than 1.0.
Figure 2.19 includes the results from the A709 Grade 50 and HPS100W specimen
tests and from finite-element simulations. To compare the results of all three materials in an
equivalent manner, the gross section stresses in Figure 2.19 are normalized by the yield
strength measured with the monolithic specimens. The data were also plotted in terms of the
An based on the hole size increased by 1/16 inch. This change has no effect on the gross-
section area, and therefore produces no change in the maximum gross-section stresses
developed. Thus, no vertical change in the data points of Figure 2.19 takes place. But, this
hole allowance does decrease the net-section area, having the result of shifting all the data
points in Figure 2.19 to the left slightly, as shown in Figure 2.20.
The second quantity examined is the ultimate capacity on the net section of the
specimen. Figure 2.21 shows the net section stress, which is the peak load divided by the
original net-section area, normalized by the ultimate strength of the monolithic specimen, as a
function of the (An/Ag)/(Y/T) ratio. The most impressive characteristic of Figure 2.21 is that
the ultimate strength is reached on the net section even for net-section ratios as low as 0.9 and
0.8.

53
(Finite-element results are shaded symbols.)
Figure 2.19 - Experimental and finite-element gross-section stress for all grades of steel
Figure 2.20 - Experimental gross-section stress for all grades of steel where An includes
the 1/16 inch allowance on the hole size
Development of Gross-Section Yield Strength Following Net-Section YieldingNormalized by Yield Strength, Finite Element Analysis Data Represented by Shaded Symbols
DUCTILITY CRITERION (1)
0.0
0.5
1.0
1.5
2.0
0.7 0.8 0.9 1.0 1.1 1.2
(An/Ag)(Y/T)
FA
g m
ax /
Fy
- HPS70W-H (Y/T = 0.87, Fy = 76.00 ksi ) - HPS70W-L (Y/T = 0.89, Fy = 79.95 ksi)
+ - A709 Grade 50 (Y/T = 0.74, Fy = 60.30 ksi) - HPS100W (Y/T = 0.96, Fy = 115.95 ksi)
Development of Gross Section Yield Strength Following Net Section YieldingNormalized by Yield Strength, Nominal Hole Diameter + 1/16"
DUCTILITY CRITERION (1)
0.0
0.5
1.0
1.5
2.0
0.7 0.8 0.9 1.0 1.1 1.2
(An/Ag)(Y/T)
FA
g m
ax /
Fy
- HPS70W-H (Y/T = 0.87, Fy = 76.00 ksi ) - HPS70W-L (Y/T = 0.89, Fy = 79.95 ksi)
+ - A709 Grade 50 (Y/T = 0.74, Fy = 60.30 ksi)
- HPS100W (Y/T = 0.96, Fy = 115.95 ksi)

54
(Finite-element results are shaded symbols.)
Figure 2.21 - Experimental and finite-element net-section stress for all grades of steel
Figure 2.22 shows the same data from the experiments re-plotted in terms of the An
including th 1/16 allowance on hole size. In addition to shifting the data to a slightly lower
(An/Ag)/(Y/T) ratio, the allowance also has the effect of increasing the apparent net-section
stress slightly. These effects are both conservative and therefore the actual net section data
can be used conservatively.
Development of Net-Section Ultimate StrengthNormalized by Ultimate Strength, Finite Element Symbols Represented by Shaded Symbols
DUCTILITY CRITERION (2)
0.0
0.5
1.0
1.5
2.0
0.7 0.8 0.9 1.0 1.1 1.2
(An/Ag)(Y/T)
F An
max
/ F
u
- HPS70W-H (Y/T = 0.87, Fu = 86.89 ksi ) - HPS70W-L (Y/T = 0.89, Fu = 89.81 ksi)
+ - A709 Grade 50 (Y/T = 0.74, Fu = 80.99 ksi) - HPS100W (Y/T = 0.96, Fu = 121.33 ksi)

55
Figure 2.22 - Experimental net-section stress for all grades of steel where An includes
the 1/16 inch allowance on the hole size
The most important criterion that was measured in these tests is the elongation and
ductility. The maximum gage length elongation with respect to (An/Ag)/(Y/T) ratio is shown
in Figure 2.23 for all grades of net-section specimens. A general upward trend is observed.
Elongation on the order of 3% was reached at an (An/Ag)/(Y/T) ratio of 1.0. This is more than
enough strain to satisfy the demand in ordinary composite flexural members, as in the
Development of Net Section Ultimate StrengthNormalized by Ultimate Strength, Nominal Hole Diameter + 1/16"
DUCTILITY CRITERION (2)
0.0
0.5
1.0
1.5
2.0
0.7 0.8 0.9 1.0 1.1 1.2
(An/Ag)(Y/T)
F An
max
/ F
u
- HPS70W-H (Y/T = 0.87, Fu = 86.89 ksi ) - HPS70W-L (Y/T = 0.89, Fu = 89.81 ksi)
+ - A709 Grade 50 (Y/T = 0.74, Fu = 80.99 ksi) - HPS100W (Y/T = 0.96, Fu = 121.33 ksi)

56
experiments conducted at University of Nebraska – Lincoln (Mans 2002). If greater
elongations were required, say for the demand of about 6% in the girder flexural test
described in the next section, then the (An/Ag)/(Y/T) ratio should be equal to or greater than
1.1.
Figure 2.23 - Maximum gage-length elongation for all steel grades
Total Gage Length Global Elongation (%)DUCTILITY CRITERION (3a)
0
2
4
6
8
10
0.7 0.8 0.9 1.0 1.1 1.2
(An/Ag)(Y/T)
ε ε to
tal (
%)
- HPS70W-H (Y/T = 0.87, εy = 0.241% )
- HPS70W-L (Y/T = 0.89, εy = 0.241%)
+ - A709 Grade 50 (Y/T = 0.74, εy = 0.172%)
- HPS100W (Y/T = 0.96, εy = 0.345%)

57
Alternately, the elongation data could be normalized by the yield strain, as in Figure
2.24. This is the way the data are normalized in the tension ductility calculation in Equation
2-1. However, there is more apparent scatter between different types of materials when
elongation is normalized by the yield strain. This normalization favors the grade 50 steel
(since the elongation is dividing by smaller denominator) and penalized the HPS100W
specimens (since it is dividing by larger denominator).
Figure 2.24 - Maximum gage-length elongation normalized by yield strain
The elongation results were not plotted in terms of the An that includes the 1/16 inch
allowance on the hole size. However, based on the previous comparisons, it is known that
this would not affect the elongations and would only cause a slight shift to a lower vales of
(An/Ag)/(Y/T) ratio.
Net-Plastic Gage Length Global Elongation (%)Normalized by εεy nominal
DUCTILITY CRITERION (3b)
0
10
20
30
40
0.7 0.8 0.9 1.0 1.1 1.2
(An/Ag)(Y/T)
εε tot
al /
εε y n
omin
al
- HPS70W-H (Y/T = 0.87, εy = 0.241% )
- HPS70W-L (Y/T = 0.89, εy = 0.241%)
+ - A709 Grade 50 (Y/T = 0.74, εy = 0.172%)
- HPS100W (Y/T = 0.96, εy = 0.345%)

58
In summary, these wide-plate test data show that the net section behavior for a range
of structural steels can be explained entirely by the (An/Ag)/(Y/T) ratio. The results show that
as long as the (An/Ag)/(Y/T) ratio is 1.0 or greater, gross section yielding can be achieved as
well as adequate ductility (i.e elongation greater than 3% or tensile ductility greater than 10).
Ultimate strength is achieved on the net section regardless of the (An/Ag)/(Y/T) ratio, even for
(An/Ag)/(Y/T) ratios as low as 0.8.
In the range tested, the finite element data shows good agreement with the
experimental results and among the various grades of steel.
The results show very little variability between each grade of steel. The lack of
variation between materials provides evidence to broaden the conclusions to all types of
structural steel.

59
2.3 Girder test
As discussed in Section 1.2, one girder with HPS70W web and tension flange was
fabricated and tested to failure. This girder was tested to investigate the potential for tension
flange rupture in a girder and to relate tension panel ductility to girder ductility.
2.3.1 Girder test specimen
The test specimen was shown in Figure 1.1. The specimen design was constrained by
the 660 kip capacity of the test machine. The HPS-70W tension flange was the same cross
section as the wide-plate tension test specimens; 8-inches wide and 0.75-inches thick. Since it
was impractical to build a composite section in the lab, a very large Grade 50 compression
flange 8 inches wide and 3.5 inches thick was used to shift the plastic neutral axis up to the
top flange and to eliminate the possibility of flange local buckling. The 26-inch deep web
(giving an overall depth of 30.25 inches) was made from 0.75-inch thick HPS-70W plate so
that shear buckling could not occur and no stiffeners were required. Bearing stiffeners on
both sides of the web were placed at midpsan and at the supports.

60
2.3.2 Girder test procedure
The girder was supported on roller supports with a span of 20 feet. McDermott’s tests
that resulted in tensile flange rupture were loaded in three-point bending, i.e. there was a
moment gradient at the location of the plastic hinge. Therefore in order to test the worst-case
scenario, this test was also conducted in three-point bending. Lateral braces were provided
five feet from the supports, and the compression flange was also braced by the test machine at
midspan, giving an unbraced length of 60 inches. The weak axis bending stiffness of the
compression flange is such that lateral-torsional buckling (LTB) should be suppressed for an
unbraced length of 92 inches (according to AASHTO LRFD design criteria).
High-elongation strain gauges were place along the tension flange and web. As seen in
Figure 2.25, five strain gauges were placed along the vertical line 15 inches from the
centerline to verify the linearity of the strain gradient and the neutral axis location. Six strain
gauges were placed along the tension flange from the center to the south support to measure
the strains at different locations along the length. Seven LVDT’s were place at along the
length of the girder to measure deflections. In addition, LVDT’s were placed at the south end
of the girder to measure the end rotation.

61
Figure 2.25 –View of girder specimen after testing showing permanent plastic rotation
as well as web strain gage locations
The loading was displacement controlled at a stroke rate of 0.0024 in/s, which
corresponded to a strain rate in the elastic range of 10-5 sec-1 in the tension flange. Several
elastic cycles up to 130 kips were applied before the final test was performed.
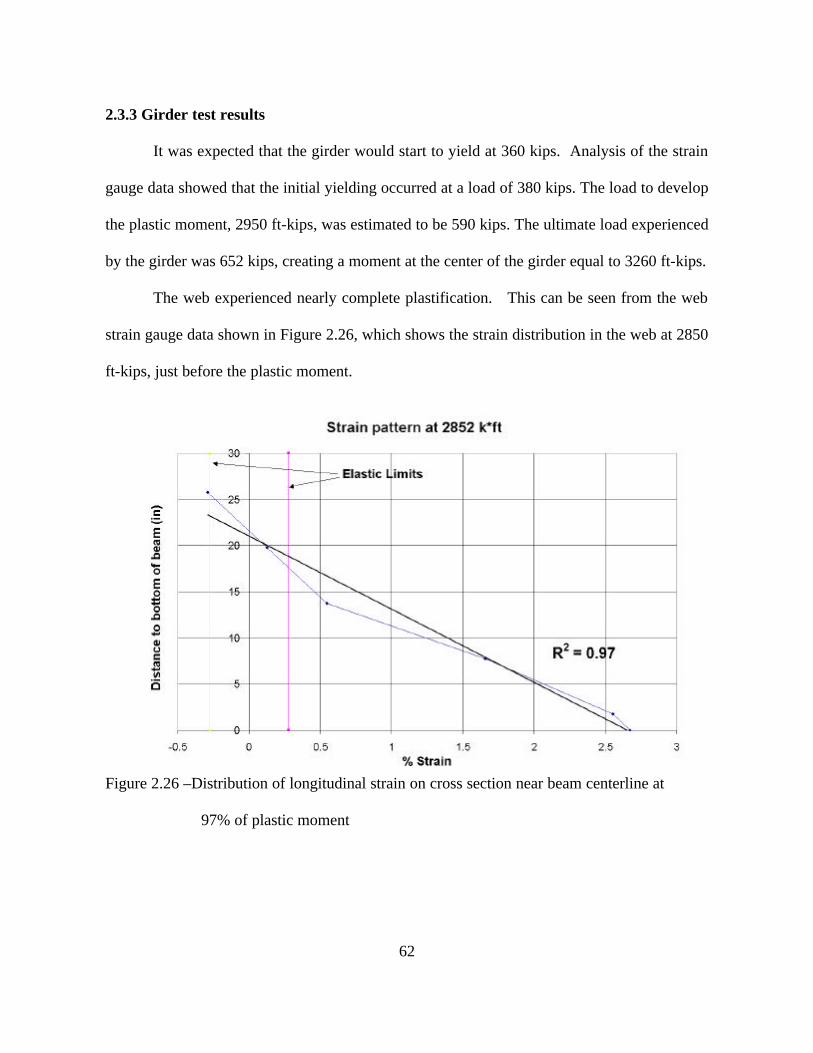
62
2.3.3 Girder test results
It was expected that the girder would start to yield at 360 kips. Analysis of the strain
gauge data showed that the initial yielding occurred at a load of 380 kips. The load to develop
the plastic moment, 2950 ft-kips, was estimated to be 590 kips. The ultimate load experienced
by the girder was 652 kips, creating a moment at the center of the girder equal to 3260 ft-kips.
The web experienced nearly complete plastification. This can be seen from the web
strain gauge data shown in Figure 2.26, which shows the strain distribution in the web at 2850
ft-kips, just before the plastic moment.
Figure 2.26 –Distribution of longitudinal strain on cross section near beam centerline at
97% of plastic moment

63
Figure 2.27 shows the deflected shape as measured with the LVDT’s near the end of
the test. Rotation was measured at the south end support with LVDT’s and was also
estimated from the midpoint deflection divided by the half span length (this will be referred to
as the ∆/L approximation). The end rotation is always slightly greater than the rotation from
the ∆/L approximation, as shown more clearly in the blown-up view of the deflected shape
near the end of the girder in Figure 2.28.
Figure 2.27 – Measured displaced shape of the beam near the end of the test compared to the
secant ∆/L approximation for a rigid-perfectly-plastic beam
0
1
2
3
4
5
0 20 40 60 80 100 120 140beam length (in)
def
lect
ion
fro
m in
itia
l (in
)
support
center of beam (load pt)
true beam shape
∆∆/L approximation

64
Figure 2.28 – Close-up view of the measured displaced shape near the support showing
difference between methods of measuring rotation
The moment rotation curve was shown in Figure 1.3. The maximum moment was
attained when the rotation got to be about 8.5%. The moment was approximately steady as
the rotation increased to about 11.4%, at which point there was a sudden lateral-torsional
buckling failure. A photograph of the tension flange after testing is shown in Figure 2.29. The
tension flange did not begin necking or premature rupture. The maximum strain measured on
the tension flange was 6.5% just before failure.
4
4.1
4.2
4.3
4.4
4.5
4.6
110 112 114 116 118 120 122 124 126 128 130
lenght of beam (in)
def
lect
ion
fro
m in
itia
l (in
)
support
True Beam Shapeθ/2θ/2=.041
∆/L approximation
θ/2θ/2=.035

65
Figure 2.29 – Photograph of the tension flange after testing
2.3.3 Analysis of the girder test
A simple cross-section analysis model was developed to predict the moment vs.
rotation behavior of hybrid unsymmetrical cross sections. The numerical solution is based on
flexure theory using the stress vs. strain data from the HPS70W coupon test. The coupon
stress-strain curve was divided into the traditional regions including elastic, yield plateau, and
strain hardening. The elastic region was modeled assuming a modulus of elasticity of 29,000
ksi. The elastic curvature φ was determined according to M/EI. The curvature was integrated
along the length of the girder to find the rotation and associated deflections.

66
When the yield point was reached on the tension flange, the remaining incremental
behavior was found with an iterative elastic-plastic model. The yield plateau was perfectly
plastic with strength equal to the measured yield strength (80 ksi for the web and tension
member and 61 ksi for the compression flange). The neutral axis is based on the stress
distribution and the stress is dependent on the strain. However, the neutral axis must be
known before the strain can be predicted, since all that is known from the curvature is the
strain gradient.
A spreadsheet was set up with these relations. An initial guess of the neutral axis was
made, and then the apparent location of the neutral axis was determined from equilibrium on
the cross section. The stress in each section is computed from the strain. It is then
determined what stress distribution will be used. There are five possible modes, depending on
the magnitudes of the strains.
The first mode, shown in Figure 2.30a, is the common flexural behavior where the
tension flange, compression flange and web all remain in the elastic range. The second mode
is when the tension flange has yielded, while the compression region is still unyielded, as
shown in Figure 2.30b. The third mode is characterized by the start of yielding on the outer
most fibers of the compression flange, as shown in Figure 2.30c. At this point, the neutral
axis is moving up the girder toward the top flange.
The fourth mode, Figure 2.30d, is characterized by the yielding of the compression
section of the web and the start of strain hardening in the tension flange. At this point the
neutral axis starts to shift back toward the tension flange. Finally, the fifth mode is the
characterized by the strain hardening in the compression flange, as shown in Figure 2.30e.
This fifth mode was sufficient to characterize the maximum moments and curvatures.

67
a) Assumed stress distribution in the elastic range (first mode)
b) Assumed elastic-plastic stress distribution after tension flange yielding (second mode)
c) Assumed elastic-plastic stress distribution after compression flange yielding (third mode)

68
d) Assumed elastic-plastic stress distribution after web yielding in compression and tension
flange strain hardening (fourth mode)
e) Assumed elastic-plastic stress distribution after strain hardening in compression flange
(fifth mode)
Figure 2.30 – Cross-section analysis of girder

69
The result from these calculations was an array of moment-curvature pairs. The
moment diagram is deterministic, so a curvature can be found for each discrete point on the
moment diagram. The yield moment was calculated and used to determine the length on the
girder that was inelastic, as shown in Figure 2.31.
Figure 2.31 – Bending moment diagram for the half beam length
The inelastic part of the beam length was then divided into segments 1.5 inches in
length and an average curvature was assigned to each segment, as shown in Figure 2.32. This
curvature diagram was integrated to get rotations and displacements. This analysis can predict
the moment-rotation behavior up to failure but it does not predict when the failure will occur.
Figure 2.33 shows a comparison of the predicted moment vs. rotation curve to the measured
moment vs. rotation curve, which was originally shown in Figure 1.3. The tension flange
strain from this analysis was also reasonably consistent with the measured strain in the tension
flange.

70

71
Figure 2.32 – Curvature diagram for the half beam length
Figure 2.33 – Comparison of predicted and measured moment-rotation curves
0.0%
0.1%
0.2%
0.3%
0.4%
0.5%
0 40 80 120
Inches from Loading Point
Cur
vatu
re (
radi
ans)
φφYield
Beam Rotation
0
1000
2000
3000
0.00 0.04 0.08 0.12
radians
Mo
men
t (k
*ft)
θθy= .0234
Mp=2951 k*ft
Theoretical
Observed
(θθp-θθy)/θθy=3.87
θθp=0.114

72
3.0 Statistical analysis of Y/T data
The wide-plate test results presented in Section 2.2 suggest that adequate ductility (i.e
elongation greater than 3% or tensile ductility greater than 10) is obtained as long as the
(An/Ag)/(Y/T) ratio is 1.0 or greater. In other words, if the Y/T is known, γ in Equation 1.4
need not exceed 1.0 (or equivalently that the number 0.84 in Equation 1.5 or 1.7 need not be
less than 1.0). However, as discussed in Section 1.4, the Y/T is not known exactly, only the
ratio of the minimum specified values Fu/Fy. As was shown in Table 1.1, each type of steel
has a unique distribution of possible Y/T values and a unique relationship between the mean
Y/T and the ratio of the specified values Fu/Fy.
Statistical data on the variation of Y/T were studied to determine adequate margins of
safety to use in the design equations. An upper bound or safe Y/T value was derived for the
grades of steel in Table 1.1 including HPS70W steel. The safe Y/T value was compared to
the Fy/Fu ratio to compute an appropriate γ factor for proposed improved design equations as
an alternative to the ratio of the φ factors.
Data for A36, A572, A588, and A514 steel plate was obtained from a study by
Brockenbrough (1995), while data for A992 shapes were obtained from a study by Dexter et
al (2001). Tensile test data for 2459 heats of HPS70W were obtained from two mills of one
producer.
Figure 3.1 shows the Y/T plotted as a function of thickness It can be seen that the
high Y/T values are typically found in thcknesses less than 2 inches. In fact, only one heat of
the almost 300 heats greater than 2 inches thick had Y/T greater than 0.91. The data were
analyzed separately for thickness up to and including 1 inch, from 1 to 2 inches, and greater
than 2 inches. There was not a significant difference between the Y/T statistics for the data

73
up and including 1 inch and the data from 1 to 2 inches. Therefore it was decided to group
all the data from both mills up to and including 2.0 inches thick into one database for
statistical analysis. If the design rules derived from these data are applied to thicker plates,
the result will be conservative since the thicker plates tend to have lower Y/T.
Figure 3.1: Y/T data for HPS70W
Y/T as a function of thickness
0.6
0.7
0.8
0.9
1
0 1 2 3 4Plate thickness (in)
Y/T mill 1
mill 2
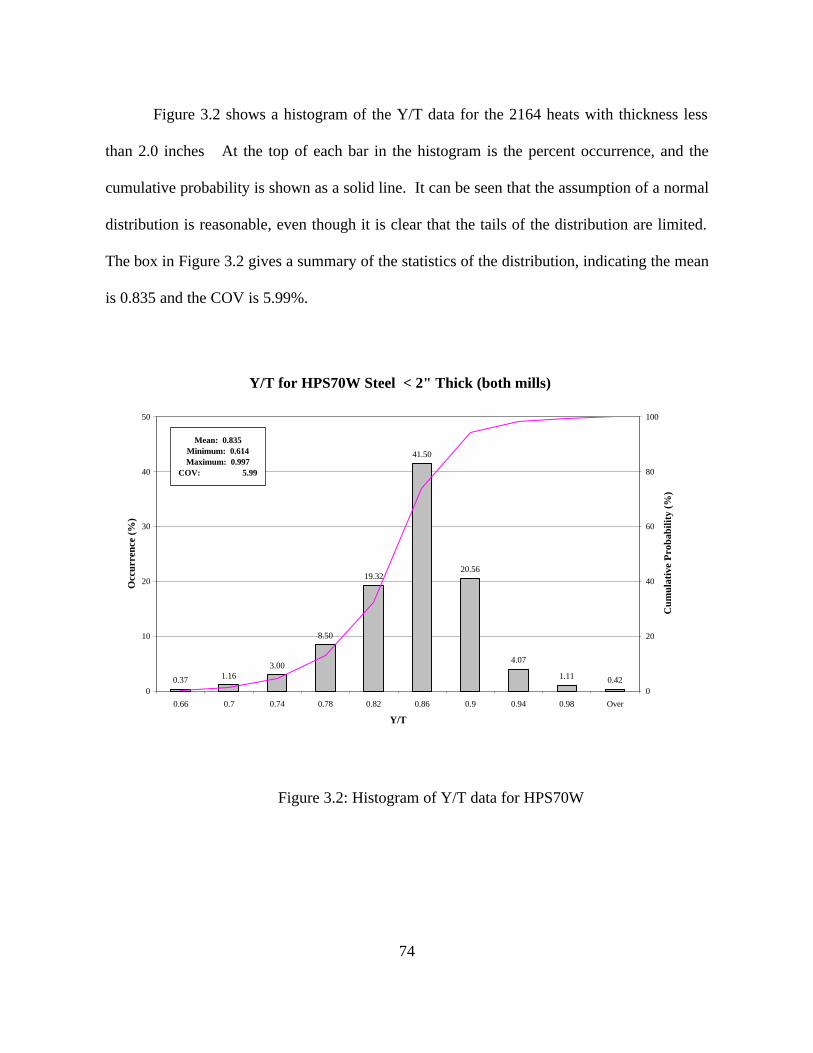
74
Figure 3.2 shows a histogram of the Y/T data for the 2164 heats with thickness less
than 2.0 inches At the top of each bar in the histogram is the percent occurrence, and the
cumulative probability is shown as a solid line. It can be seen that the assumption of a normal
distribution is reasonable, even though it is clear that the tails of the distribution are limited.
The box in Figure 3.2 gives a summary of the statistics of the distribution, indicating the mean
is 0.835 and the COV is 5.99%.
Figure 3.2: Histogram of Y/T data for HPS70W
Y/T for HPS70W Steel < 2" Thick (both mills)
0.37 1.163.00
8.50
19.32
41.50
20.56
4.07
1.11 0.420
10
20
30
40
50
0.66 0.7 0.74 0.78 0.82 0.86 0.9 0.94 0.98 Over
Y/T
Occ
urre
nce
(%)
0
20
40
60
80
100
Cum
ulat
ive
Pro
babi
lity
(%)
Mean: 0.835 Minimum: 0.614 Maximum: 0.997
COV: 5.99

75
As discussed in Section 2.1, the two heats of HPS70W had Y/T of 0.87 and 0.89, i.e. about
one standard deviation greater than the mean. Thus, the heats of HPS70W that were tested
represent the high range of Y/T for this steel.
Given an appropriate reliability index β, an upper-bound or safe Y/T value may be
selected for HPS70W steel or any other steel. (Note, this β is not the same as the β in
Equation 1.6.) The safe Y/T value can be compared to the ratio of the minimum specified
values to see if there is a need for a γ factor greater than 1.0 in the design equation. Note that
this process is the opposite of typical applications of reliability such as yield strength, where a
lower-bound yield strength �F y is used in design. In the case of the Y/T ratio, a greater Y/T
is more detrimental, so an upper-bound Y/T is used in design.
The AISC reliability equation, modified for this problem, is:
γ Rn Y/T = Rm Y/T × e 0.55 β� Vr Eq. 3-1 �� γ Rn Y/T = γ (FY/Fu)
Rm Y/T = mean value of Y/T
β = reliability index
Vr = COV of the Y/T distribution
It is not clear what the appropriate level of reliability should be in order to obtain a
safe value of Y/T to use in design equations. If the Y/T turns out to be greater than the safe
value, the consequences are only that a net section failure may occur rather than a gross
section failure, i.e. only the ductility is reduced but the strength is not reduced. Therefore it
seems reasonable that the reliability index β could be less than is used for strength limit states.
A β of 2.6 was used for strength limit states in members in the AISC calibration while 3.5 was
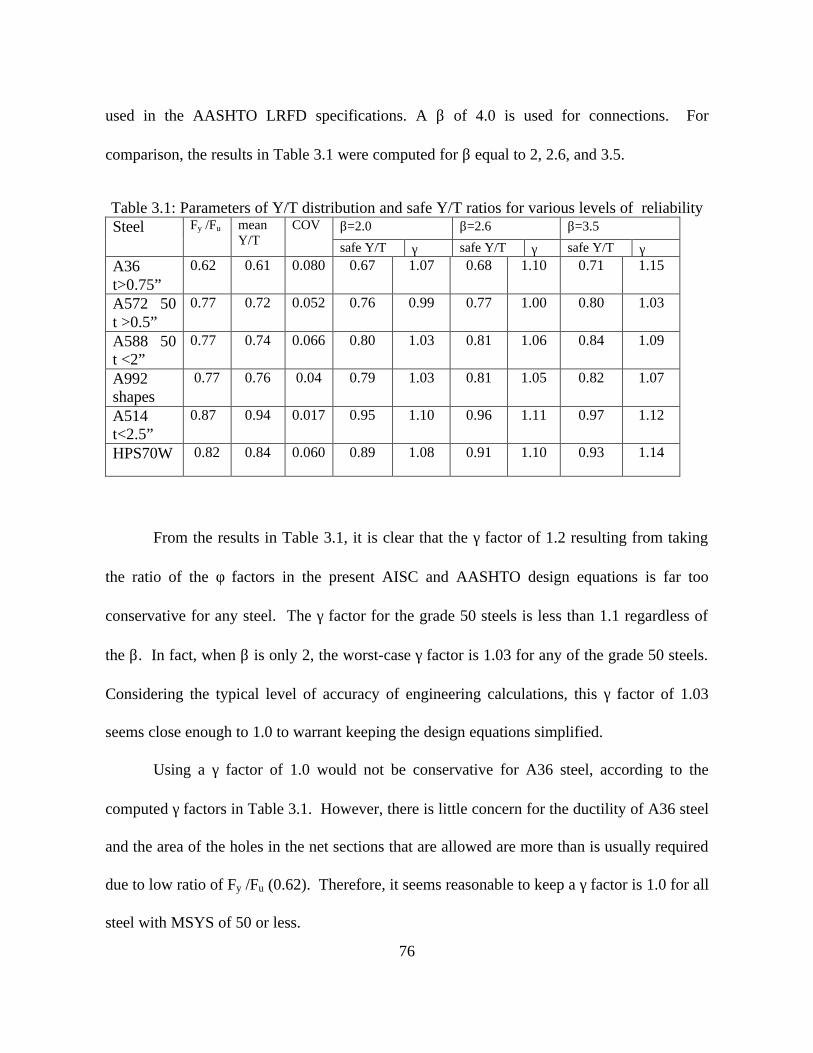
76
used in the AASHTO LRFD specifications. A β of 4.0 is used for connections. For
comparison, the results in Table 3.1 were computed for β equal to 2, 2.6, and 3.5.
Table 3.1: Parameters of Y/T distribution and safe Y/T ratios for various levels of reliability
β=2.0 β=2.6 β=3.5 Steel Fy /Fu mean Y/T
COV
safe Y/T γ safe Y/T γ safe Y/T γ A36 t>0.75”
0.62 0.61 0.080 0.67 1.07 0.68 1.10 0.71 1.15
A572 50 t >0.5”
0.77 0.72 0.052 0.76 0.99 0.77 1.00 0.80 1.03
A588 50 t <2”
0.77 0.74 0.066 0.80 1.03 0.81 1.06 0.84 1.09
A992 shapes
0.77
0.76
0.04
0.79 1.03
0.81 1.05
0.82
1.07
A514 t<2.5”
0.87
0.94 0.017 0.95 1.10 0.96 1.11 0.97 1.12
HPS70W 0.82 0.84 0.060 0.89 1.08 0.91 1.10 0.93 1.14
From the results in Table 3.1, it is clear that the γ factor of 1.2 resulting from taking
the ratio of the φ factors in the present AISC and AASHTO design equations is far too
conservative for any steel. The γ factor for the grade 50 steels is less than 1.1 regardless of
the β. In fact, when β is only 2, the worst-case γ factor is 1.03 for any of the grade 50 steels.
Considering the typical level of accuracy of engineering calculations, this γ factor of 1.03
seems close enough to 1.0 to warrant keeping the design equations simplified.
Using a γ factor of 1.0 would not be conservative for A36 steel, according to the
computed γ factors in Table 3.1. However, there is little concern for the ductility of A36 steel
and the area of the holes in the net sections that are allowed are more than is usually required
due to low ratio of Fy /Fu (0.62). Therefore, it seems reasonable to keep a γ factor is 1.0 for all
steel with MSYS of 50 or less.

77
Even though the statistics of A514 and HPS70W are quite different, by coincidence
the γ factors associated with each level of reliability are approximately the same. Therefore, it
seems reasonable to define a γ factor of 1.1 for all steel with a MSYS greater than 50 ksi. A
higher level of reliability (β = 2.6) is provided for the safe Y/T value for high-strength steels
than is provided for Grade 50 steels and this is appropriate given the greater concern for the
ductility of high-strength steels. If other high-strength steels are used, a survey of their Y/T
should be conducted and the γ factors calculated especially for that steel using Equation 3.1
with β of at least 2.6. Also, the distributions of Y/T values should be reevaluated for all steels
every decade to see if they are changing due to changes in raw materials and production.
These reliability analyses anticipate that the Y/T for these steels may occasionally be
greater than the “safe” Y/T calculated above. This is analogous to the accepted fact that the
yield strength may occasionally be below the MSYS. In both cases, the possibility of the
material property being outside the specified range is included in the calculation of the
probability of failure, and that probability is deemed to be acceptably small. Therefore, it is
not recommended that specification limits on the Y/T be imposed.
However, one consideration that may indicate a need to limit the Y/T value is that a
bridge is often constructed from a single heat of HPS70W. The reliability analysis assumes
that the material properties in the structure are randomly distributed, so that there is an
acceptably small risk that out-of-specification materials will happen to be located at locations
of maximum demand. However, if the structure is constructed from one heat and that heat
happened to have a high Y/T greater than the safe value, every cross section would be
potentially affected by that high Y/T.

78
Presently, the Y/T of A992 steel is explicitly limited to 0.85. If a decision is made to
put explicit limits on the Y/T for HPS70W or other steels in ASTM A709, the “safe” value
may be considered as a specification limit on Y/T. For example, for HPS70W, the safe value
of Y/T for HPS70W was 0.91. The data in Figure 3.1 and 3.2 show that there would be a
significant percentage of present-day heats that would be rejected if this were required.
Considering that the strength of the member is not in question if the Y/T exceeds the safe
value, but rather only the ductility, and considering that the limiting Y/T for A992 is well
above the safe value for that steel, a limiting Y/T value of 0.92 might be more appropriate
than 0.91. Figure 3.2 shows that approximately 5% of present-day heats would be rejected
with a Y/T limit of 0.92.
79
4.0 Recommendations and conclusions
4.1 Recommended specification changes 4.1.1 AISC Specifications
Since the revised recommendations for what was in Section B10 will now involve
strength rather than just the cross section, it is appropriate to eliminate Section B10 and move
to Sections F5, F6, and F7. Section F5 will have the new recommendations for holes in the
tension flange. Section F6 should be entitled “HYBRID GIRDERS” and should contain the
paragraph on hybrid girders. Section F7 should be entitled “FLANGES AND COVER
PLATES” and should contain the rest of the text that was in Section B10. The note at the end
of Section F1.1 should refer to section F5 rather than B10. Section F5 should read as
follows:
F5. BEAMS WITH HOLES IN THE FLANGES
The major axis section properties for rolled or welded shapes, plate girders or cover-plated
beams with holes in the compression flange may be computed using the gross section of the
compression flange with no deduction for the holes if:
• the compression flange is composite with a concrete slab;
• the holes are standard size and contain the correct size bolts; or,
• the holes of any type comprise no more than 15% of the compression flange area.
The major axis section properties for rolled or welded shapes, plate girders or cover-plated
beams with holes in the tension flange may be computed using the gross section of the tension
flange with no deduction for the holes if:
FuAfn ≥ YtFyAfg (F5-1)

80
where
Afg = gross tension flange area, in.2 (mm2)
Afn = net tension flange area calculated in accordance with the provisions
of Sections B1 and B2, in.2 (mm2)
Fu = specified minimum tensile strength, ksi (MPa)
Fy = specified minimum yield strength, ksi (MPa)
Yt = 1.0 for steel with Fy ≤ 50 ksi (350 MPa)
= 1.1 otherwise
If FuAfn < YtFyAfg, the nominal flexural strength Mn at the location of the holes in the tension
flange shall be determined as follows:
Mn = Fn Sx (F5-2)
where the nominal flexural stress Fn shall be determined as follows:
Fn = fgt
fnu
AY
AF (F5-3)
The minor axis section properties for rolled or welded shapes, plate girders or cover-plated
beams with holes in either flange may be computed using the gross section with no deduction
for the holes if the holes in either flange comprise no more than 15% of the area of that
flange.

81
4.1.2 AASHTO Specifications
Section 6.10.3.6 of the AASHTO LRFD Specifications should be changed to read as
follows:
6.10.3.6 EFFECT OF HOLES IN THE FLANGES
The effect of holes in flanges shall be considered for the strength limit state but need not be
considered for other limit states. The major axis section properties for flexural members with
holes in the compression flange may be computed using the gross section of the compression
flange with no deduction for the holes if:
• the compression flange is composite with a concrete slab;
• the holes are standard size and contain the correct size bolts; or,
• the holes of any type comprise no more than 15% of the compression flange area.
The major axis section properties for rolled or welded shapes, plate girders or cover-plated
beams with holes in the tension flange may be computed using the gross section of the tension
flange with no deduction for the holes if:
FuAfn ≥ YtFyf Afg (6.10.3.6-1)
where
Afg = gross tension flange area, in.2 (mm2)
Afn = net tension flange area as specified in Article 6.8.3, in.2 (mm2)
Fu = specified minimum tensile strength of the flange specified in Table
6.4.1-1, ksi (MPa)
Fyf = specified minimum yield strength of the flange, ksi (MPa)
Yt = 1.0 for steel with Fy ≤ 50 ksi (350 MPa)
= 1.1 otherwise

82
If no deduction is required for the holes in either flange, the nominal flexural resistance may
be determined using Sections 6.10.4.2.1 or 6.10.4.2.2 as applicable. If a deduction for the
holes is required for the compression flange or if FuAfn < YtFyf Afg for the tension flange, then
the nominal flexural resistance shall be determined in accordance with Section 6.10.4.2.4. In
this case, the nominal flexural resistance Fn for a tension flange if FuAfn < YtFyf Afg shall be
determined as specified in Section 6.10.4.2.4 but shall also be limited to:
Fn = fgt
fnu
AY
AF (6.10.3.6-2)
If a deduction is required for holes in a compression flange Equation 2 shall also be used
where Afg, Afn, Fu,, Fyf, and Yt are properties of the compression flange.
.
The minor axis section properties for flexural members with holes in either flange may be
computed using the gross section with no deduction for the holes if the holes comprise no
more than 15% of either flange area.

83
4.1.3 ASTM A709/AASHTO M270 Specifications
There were a few heats out of the more than 2400 heats of HPS70W that were
examined that had Y/T of 0.98, and that is alarmingly high. However, there are occasional
Y/T this high in Grade 50 steels as well. If the present design provisions or even the less
conservative proposed design provisions are followed, the risk of these high Y/T causing
premature necking or net-section fracture are acceptably small, therefore it could be argued
that explicit specification limits on Y/T are not required. Furthermore, the risk is primarily
that the ductility will be insufficient, the consequences of which are usually less problematic
than the consequences of insufficient strength.
However, since the steel flange plates or tension members for an entire bridge may
come from one heat, if that one heat happed to have a Y/T of 0.98, the risk of insufficient
ductility of the overall bridge may be unacceptable. This might be a valid reason for
imposing explicit specification limits on the Y/T. However, if limits arte considered, they
should be considered for all bridge steels and not just HPS70W, since there is a risk of having
high Y/T values in any Grade 50 steel as well. The benefit of imposing this limit must be
balanced against the additional cost of the steel due to rejected heats. The “safe” upper-bound
Y/T could be considered as a rational choice for the Y/T limit – in the case of HPS70W the
safe Y/T was 0.91. One point greater or 0.92 would have a much lower impact in terms of
rejected heats, and therefore would be a better choice.

84
4.2 Recommended future work 1. Additional wide plate tests should be performed to get results from additional heats of
HPS70W and to investigate the effects of:
• thicker plates
• punched holes, plasma-punched holes, and flame-cut holes
• increased hole density for the same (An/Ag)/(Y/T) ratio
• clamping force in bolted splices.
2. Additional girder tests should be performed to get some replication of the results, test
additional heats of HPS70W, and to investigate:
• the behavior of Grade 50 comparison tests
• the behavior of girders fabricated from steel with an extreme Y/T of about 0.97
• the effect of hybrid girders with an HPS70W tension flange and Grade 50 web
• the effect of variation in web depth
• the effect of four-point bending
• the effect of a full bolted splice
• whether limiting the stress in the tension flange to Fu gives a sufficiently small
probability of net-section fracture, or whether the net section tress must be
limited to 0.75 Fu as in a tension member; and,
• if Fu on the net section is tolerable, whether the tension flange can continue to
strain up to 2.5% after reaching a nominal stress on the net section equal to Fu
so that the plastic moment on the net section can be attained

85
3. Analyses of these experiments should be performed to enhance interpretation of the
results and to investigate the relationship between the ductility of a tension member and
the rotational ductility of a plate girder.

86
4.2 Conclusions
1. HPS70W performed extremely well in both tension and flexural tests. In the flexural
test, the girder reached the plastic moment capacity and continued to deform and
increase in load capacity until lateral torsional buckling took place at moment of 110%
of the plastic moment capacity, at 6.5% strain in the tension flange and 11% rotation
(which corresponds to a rotational ductility of 3.87). Tensile and rotational ductility
exceeded the minimum requirements and were comparable to the ductility of similar
members fabricated with Grade 50 steel.
2. All grades of steel seem to behave in a similar manner such that the strength and
ductility can be predicted on the basis of the parameter (An/Ag)/(Y/T); i.e. the net-to-
gross area ratio (An/Ag) divided by the yield-to-tensile ratio (Y/T). This parameter is
equivalent to and can also be thought of as (T An) / (Y Ag); i.e. the nominal net-section
strength limit state (T An) divided by the nominal gross-section yielding limit state (Y
Ag). In the wide-plate tests, gross-section yielding and adequate ductility (elongation
greater than 10 times yield strain) was provided at (An/Ag)/(Y/T) of 1.0 for all grades
of steel.
3. In plots of elongation in the wide-plate tests vs. (An/Ag)/(Y/T), the correlation of
various steel grades was more consistent in terms of elongation than when the
elongation was normalized by the yield strain, indicating that this way of normalizing
tensile ductility may not be the appropriate, and that it may be better to characterize
tensile ductility just in terms of elongation.

87
4. The behavior of tension members up to the point of failure can be predicted with
reasonable accuracy using the shell finite elements.
5. The behavior of the flexural members up to the point of failure can be predicted with
reasonable accuracy using a simple cross-sectional moment-curvature analysis.
6. Statistical analysis of the mill report tensile properties for more than 2400 heats of
HPS70W revealed the mean Y/T was 0.84 and the coefficient of variation (COV) for
the Y/T was 0.06, which is similar to the COV of A36 and various Grade 50 steels.
7. The present AISC and AASHTO provisions for tension members and for holes in
flexural members would be conservative when applied to HPS70W or any other steel.
8. The present AISC and AASHTO provisions for flexural members with holes require a
factor of 1.2 such that the ratio of An/Ag is greater than or equal to 1.2(Fy/Fu). The
wide-plate experiments showed that adequate ductility was provided when An/Ag is
greater than or equal to Y/T. These design provisions will result in adequate ductility
when the Y/T is less than or equal to 1.2(Fy/Fu). This is almost always the case for all
steels, so these provisions are conservative for all steels including HPS70W and even
A514. However, these design provisions are excessively conservative and cause great
difficulty in design. Furthermore, these design provisions result in varying levels of
ductility for different steels since the relationship between the ratio of the minimum
specified values (Fy/Fu).and the mean Y/T varies for each steel.
9. Alternative provisions for flexural members with holes were derived. The proposed
provisions are based on a “safe” upper-bound Y/T with a probability of being
exceeded about the same as the accepted probability of the yield strength being less
than the minimum specified value (Fy). The statistical distribution of the Y/T for

88
many different grades of steel was examined, and it was found that for all Grade 50
steels the safe Y/T value was about equal to Fy/Fu, whereas for HPS70W and higher-
strength A514 steel the safe Y/T was approximately 1.1(Fy/Fu). This distinction is
reflected in the proposed design provisions.

89
5.0 References
AASHTO (1999), AASHTO LRFD Bridge Design Specifications, American Association of
State Highway and Transportation Officials, Washington D.C
AISC (1998), Manual of Steel Construction, Load & Resistance Factor Design, Second
Revision of the Second Edition, Chicago, Illinois
Beer, F. P., and Johnston, E. R., Mechanics of Materials, 2nd Edition, McGraw-Hill, New
York, 1992, p. 367-371
Bartlett, F.M., R.J. Dexter, M.D. Graeser, J.J. Jelinek, B.J. Schmidt, and T.V. Galambos
“Updating Standard Shape Material Properties Database for Design and Reliability”,
submitted to AISC Engineering Journal, Dec. 2001.
Brockenbrough, R. L., & Associates, “Effect of Yield-Tensile Ratio on Structural Behavior -–
High-Performance Steels for Bridge Construction,” Final Report to Naval Surface Warfare
Center and Federal Highway Administration, March 1995
Dexter, R. J., Graeser, M., Saari, W. K., Pascoe, C., Gardner, C. A., and Galambos, T. V.
(2000), "Structural shape material property survey,” Technical report for Structural Shape
Producers Council, University of Minnesota, Minneapolis, MN.

90
Dexter, R. J., and Ferrell, M., “Effects of weld metal strength and defects on the ductility of
HSLA-100 plates.” Material Engineering Procedures, 14th International Conference on
Offshore Mechanics and Arctic Engineering Conference, Salama et al., eds., Vol. III, ASME,
New York, 1995, p. 449-454
Dexter, R.J. and M.L. Genrtilcore “Analysis of Plane Stress Ductile Fracture Propagation by
Simulating Necking”, to appear in ASCE Journal of Structural Engineering, 2002.
Fisher, J.W., Galambos, T. V., Kulak, G.L., and Ravindra, M.K., “Load and Resistance Factor
Design Criteria for Connectors”, Journal of the Structural Division, ASCE, Vol. 104, No.
ST9, September, 1978.
Galambos, T. V., “Reliability of Connections, Joints, and Fasteners,” Structural Engineering
Report No. 85-05, Washington University, St. Louis, MO, 1985.
Galambos, T. V., Hajjar, J. F., Earls, C. J., and Gross, J. L., “Required Properties of High-
Performance Steels,” National Institute of Standards and Technology, Report No. 6004, May
1997
Green, P. S., The Inelastic Behavior of Flexural Members Fabricated from High Performance
Steel, Ph.D. dissertation, Lehigh University, Bethlehem, PA, 2000
91
Kim, H. J., and Yura, J. A., “The effect of ultimate-to-yield ratio on the bearing strength of
Bolted Connections,” Journal of Constructional Steel Research, Vol. 49, 1999, p. 255-269
Kulak, G. L., and Fisher, J. W., “Behavior of large A514 steel bolted joints,” ASCE J. Struct.
Div., September 1969, p. 1873-1886
Lukey, A.F., and Adams ,P.F., “Rotation Capacity of Beams under Moment Gradient”,
Journal of the Structural Division, ASCE, Vol. 95, No. ST6, June 1969
Mans, P., Yakel, A.J., and Azizinamini, A., "Full Scale Testing of Composite Plate Girders
Constructed Using 70-ksi High Performance Steel," Journal of Bridge Engineering, ASCE, in
press.
McDermott, J. F., “Plastic bending of A514 steel beams,” ASCE J. Struct. Div., September
1969, p. 1851-1871
Salmon, C. G., and Johnson, J. E., Steel Structures, Design and Behavior, 4th Edition, Harper
Collins, New York, 1996, p. 73-75
Timoshenko, S., and MacCullough, G. H., Elements of Strength of Materials, 3rd Edition, D.
Van Nostrand Company, New York, 1949

92
White, D. W., Barth, K. E., and Bobb, B. M., “Strength and Ductility of HPS70W Girders,”
Georgia Institute of Technology Final Report to American Iron and Steel Institute, December
1998
Wright, W. J., Tjiang, H., and Albrecht, P., “Fracture Toughness of Structural Steels,” Final
Technical Report to Federal Highway Administration Turner-Fairbank Highway Research
Center, January 2001
Yakel, A. J., Mans, P., and Azizinamini, A., “Flexural Capacity of HPS70W Bridge Girders,”
National Bridge Research Organization at the University of Nebraska Technical Report,
November 1999