Embed Size (px)
Citation preview
1
STRENGTH AND DUCTILITY OF AXIALLY LOADED RC SHORT
COLUMNS CONFINED WITH CFRP AND GFRP WRAPS
by
Haider Osamah Al-Karaghool
A Thesis Presented to the Faculty of the
American University of Sharjah
College of Engineering
in Partial Fulfillment
of the Requirements
for the Degree of
Master of Science in
Civil Engineering
Sharjah, United Arab Emirates
January 2013

2
© 2013 Haider Osamah Al-Karaghool. All rights reserved.
3
Approval Signatures
We, the undersigned, approve the Master’s Thesis of Haider Osamah Al-Karaghool
Thesis Title: Strength and Ductility of Axially Loaded RC Short Columns Confined with
CFRP and GFRP Wraps
Signature Date of Signature
___________________________ _______________
Dr. Adil K. Tamimi
Professor
Department of Civil Engineering
Thesis Advisor
___________________________ _______________
Dr. Jamal A. Abdalla
Professor
Department of Civil Engineering
Thesis Co-Advisor
___________________________ _______________
Dr. Sherif A. Ahmed
Associate Professor
Department of Civil Engineering
Thesis Committee Member
___________________________ _______________
Dr. Basil M. Darras
Assistant Professor
Department of Mechanical Engineering
Thesis Committee Member
___________________________ _______________
Dr. Sameh M. El -Sayegh
Head, Department of Civil Engineering
___________________________ _______________
Dr. Hany El-Kadi
Associate Dean, College of Engineering
___________________________ _______________
Dr. Yousef Al-Assaf
Dean, College of Engineering
___________________________ _______________
Dr. Khaled Assaleh
Director of Graduate Studies

4
Acknowledgment
Being a successful person is not that easy to be. To achieve something in our life,
challenges and difficulties have to be eliminated in order to achieve the greatest success in
our lives. As a student who spent four years of undergraduate studies and two years of
graduate studies in the American University of Sharjah, my life was full of challenges and
difficulties that without the help and support of so many individuals, I wouldn't reach the
person I am today.
First and foremost, I would like to thank my parents and family who supported me
throughout my educational life. In addition, special thanks to my advisor Dr. Adil Tamimi,
who acted as a senior design project advisor in undergraduate studies and a thesis advisor
in graduate studies, for his continues and enormous support and guidance over the past
years of study in the university.
In addition, I would like to thank Dr. Jamal Abdalla for being my co-advisor and
Dr. Sherif Ahmed and Dr. Bassil Darras for being my thesis defense committee. Also, I
would like to thank the faculty and staff of Civil Engineering department which includes
Dr. Sameh El Sayegh, Dr. Akmal Abdelfatah, Dr. Magdi El-Emam, Dr. Md. Maruf
Mortula, Eng. Arshi Faridi, Eng. Aqeel Ahmad, and Eng. Riyad Tamam. Also, I would
like to thank Ahmed A. Ghadban, Ahmad H. Al Rahmani, Mohannad Z. Naser, Adi S.
Abo-Obidah, Manal W. Kaakani, Rana A. Al Haje, Rami A. Al Haj, Noha T. Amer and
Assia Lasfer
.
5
Abstract
With the evolution of technology, construction industry has witnessed
enormous advancement in the production of concrete and construction materials. Such
materials have helped the community to produce structures that consume less energy,
environmental friendly, have less carbon foot print and are more durable with longer
life expectancy. However, old buildings that didn’t follow the latest technology are no
longer considered to have the previous qualities. In addition, they are no longer
considered safe due to the deterioration of the concrete, steel or both. As a result,
researchers continued to investigate different types of materials that can best
strengthen and rehabilitate aging concrete structures and render them safe. In this
investigation, RC short columns have been strengthened with CFRP and GFRP wraps
to increase their load carrying capacity and enhance their ductility. Thirty columns
were tested – fifteen of them were normally designed, i.e., they have the minimum
number of transverse reinforcement and the other fifteen were under designed, i.e.,
their transverse reinforcement is less than the minimum. The parameters investigated
were the type of material used for strengthening and the number of layers of CFRP
and GFRP used for wrapping the columns. Comparison of gains of axial strength and
ductility are presented in this research. It is observed that the axial load capacity of the
columns has increased, in the average, by 9.44 % and 24.56% when wrapped with one
and two CFRP layers, respectively while it has increased with, in the average, by
8.06% and 17.68% when wrapped with one and two layers of GFRP layers,
respectively. It is also observed that the ductility of the columns has increased when
wrapping with one or two layers of CFRP. It is also observed that the Ductility of the
columns has increased by 2.06% and 8.15% when wrapped with one and two layers of
CFRP, respectively while it has increased by 11.77% and 52.67% when wrapped with
one and two layers of GFRP layers, respectively. It can be concluded from this study
that CFRP wraps enhances the axial load capacity more than GFRP wraps while
GFRP wraps enhances the ductility more than the CFRP wraps.
Keywords: CFRP, GFRP, RC column, Strength, Ductility, Axial Load, Transverse
Reinforcement, Transverse Strain
6
Table of Contents
Abstract .......................................................................................................................... 5
List of Tables ............................................................................................................... 11
List of Figures .............................................................................................................. 12
CHAPTER 1 INTRODUCTION .............................................................................. 16
1.1 Problem Statement ........................................................................................ 16
1.2 Thesis Objectives .......................................................................................... 16
1.3 Scope of Work ............................................................................................... 18
1.4 Thesis Structure ............................................................................................. 18
CHAPTER 2 LITERATURE REVIEW ................................................................... 20
2.1 Introduction ................................................................................................... 20
2.2 Fiber Reinforced Polymers (FRP) ................................................................. 20
2.3 Properties ....................................................................................................... 21
2.4 Factors affecting FRP properties: .................................................................. 22
2.4.1 Effect of Moisture .................................................................................. 22
2.4.2 Effect of Alkalinity: ............................................................................... 22
2.4.3 Effect of Temperature ............................................................................ 22
2.4.4 Creep/Relaxation.................................................................................... 23
2.4.5 Fatigue.................................................................................................... 23
2.5 Advantages and Limitation of FRPs ............................................................. 24
2.5.1 Advantages of using FRP Composite Wraps ......................................... 24
2.5.2 Limitations of using FRP Composite Wraps ......................................... 24
2.6 Economic Considerations .............................................................................. 24
2.7 Confining RC Columns ................................................................................. 25
2.7.1 General ................................................................................................... 25
7
2.7.2 Methods of Confinement ....................................................................... 25
2.7.3 Failure Modes for Rectangular Columns ............................................... 27
2.7.4 Typical stress-strain curves of confined concrete .................................. 28
2.8 Ductility of FRP-Wrapped Columns ............................................................. 28
2.9 Previous Experimental Studies...................................................................... 29
CHAPTER 3 EXPERIMENTAL SETUP ................................................................ 36
3.1 Columns Configuration ................................................................................. 36
3.2 Main and Transverse Reinforcement ............................................................ 37
3.3 Concrete Mix Design .................................................................................... 38
3.4 Columns Preparation ..................................................................................... 39
3.5 Strain Gauge Fixing ...................................................................................... 40
3.6 CFRP and GFRP Properties .......................................................................... 41
3.7 Epoxy Preparation ......................................................................................... 41
3.8 Proposed Matrix ............................................................................................ 43
3.9 Columns Designation System ....................................................................... 43
3.10 Instrumentation and Testing Procedure......................................................... 44
CHAPTER 4 DISCUSSION OF EXPERIMENTAL RESULTS ............................ 45
4.1 N Group ......................................................................................................... 45
4.1.1 Load vs. Deflection ................................................................................ 45
4.1.2 Stress vs. Strain Diagram ....................................................................... 46
4.1.3 Transverse Strain ................................................................................... 46
4.1.4 Ductility Index ....................................................................................... 46
4.2 NC1 Group .................................................................................................... 47
4.2.1 Mode of Failure...................................................................................... 47
4.2.2 Load-Extension Diagram ....................................................................... 49
4.2.3 Stress-Strain Diagram ............................................................................ 50
4.2.4 Transverse Strain ................................................................................... 50
8
4.2.5 Ductility Index ....................................................................................... 51
4.3 NC2 Group .................................................................................................... 51
4.3.1 Mode of Failure...................................................................................... 51
4.3.2 Load-Extension Diagram ....................................................................... 53
4.3.3 Stress-Strain Diagram ............................................................................ 54
4.3.4 Transverse Strain ................................................................................... 54
4.3.5 Ductility Index ....................................................................................... 55
4.4 NG1 Group .................................................................................................... 55
4.4.1 Modes of Failure .................................................................................... 55
4.4.2 Load-Extension Diagram ....................................................................... 57
4.4.3 Stress-Strain Diagram ............................................................................ 58
4.4.4 Transverse Strain ................................................................................... 58
4.4.5 Ductility Index ....................................................................................... 59
4.5 NG2 Group .................................................................................................... 59
4.5.1 Mode of Failure...................................................................................... 59
4.5.2 Load-Extension Diagram ....................................................................... 61
4.5.3 Stress-Strain Diagram ............................................................................ 62
4.5.4 Transverse Strain ................................................................................... 62
4.5.5 Ductility Index ....................................................................................... 63
4.6 U Group ......................................................................................................... 63
4.6.1 Load-Extension Diagram ....................................................................... 63
4.6.2 Stress-Strain Diagram ............................................................................ 64
4.6.3 Transverse Strain ................................................................................... 65
4.6.4 Ductility Index ....................................................................................... 65
4.7 UC1 Group .................................................................................................... 65
4.7.1 Mode of Failure...................................................................................... 65
4.7.2 Load-Extension Diagram ....................................................................... 67
4.7.3 Stress-Strain Diagram ............................................................................ 68
4.7.4 Transverse Strain ................................................................................... 68
4.7.5 Ductility Index ....................................................................................... 69
4.8 UC2 Group .................................................................................................... 69
9
4.8.1 Mode of Failure...................................................................................... 69
4.8.2 Load-Extension Diagram ....................................................................... 71
4.8.3 Stress-Strain Diagram ............................................................................ 72
4.8.4 Transverse Strain ................................................................................... 72
4.8.5 Ductility Index ....................................................................................... 73
4.9 UG1 Group .................................................................................................... 73
4.9.1 Mode of Failure...................................................................................... 73
4.9.2 Load-Extension Diagram ....................................................................... 75
4.9.3 Stress-Strain Diagram ............................................................................ 76
4.9.4 Transverse Strain ................................................................................... 76
4.9.5 Ductility Index ....................................................................................... 77
4.10 UG2 Group .................................................................................................... 77
4.10.1 Mode of Failure...................................................................................... 77
4.10.2 Load-Extension Diagram ....................................................................... 79
4.10.3 Stress-Strain Diagram ............................................................................ 80
4.10.4 Transverse Strain ................................................................................... 80
CHAPTER 5 THEORETICAL RESULTS .............................................................. 82
5.1 Introduction to ACI 440.2R .......................................................................... 82
5.2 Design Equations........................................................................................... 82
5.3 ACI Prediction............................................................................................... 85
5.3.1 CFRP Confinement ................................................................................ 85
5.3.2 GFRP Confinement ................................................................................ 86
5.4 Experimental vs. Theoretical Results ............................................................ 87
CHAPTER 6 ANALYTICAL MODEL ................................................................... 89
6.1 Existing Models of FRP-Confined Concrete ................................................ 89
6.2 Prediction of a New Model ........................................................................... 89
6.2.1 Normal Design with CFRP .................................................................... 91
6.2.2 Normal Design with GFRP .................................................................... 91
6.2.3 Under Design with CFRP ...................................................................... 92
10
6.2.4 Under Design with GFRP ...................................................................... 92
6.3 Verification of the New Models .................................................................... 93
CHAPTER 7 SUMMARY OF RESULTS ............................................................... 94
7.1 Summary of the Lab Work ........................................................................... 94
7.2 Summary of the Mode of Failure .................................................................. 94
7.3 Summary of Load and Ductility Results ....................................................... 95
7.3.1 N Group ................................................................................................. 95
7.3.2 U Group ................................................................................................. 96
7.3.3 N vs. U Group ........................................................................................ 97
7.4 Summary of Transverse Strain results .......................................................... 97
7.4.1 N Group ................................................................................................. 97
7.4.2 U Group ................................................................................................. 98
7.4.3 N vs. U Group ........................................................................................ 98
Conclusion ................................................................................................................... 99
Proposed Future Work ................................................................................................. 99
References .................................................................................................................. 100
VITA .......................................................................................................................... 104
Appendix A Extra Figures and Diagrams ............................................................ 105
Appendix B Notations ......................................................................................... 117
11
List of Tables
Table 2-1: Qualitative Comparison of FRP materials [6] ............................................ 22
Table 2-2: A comparison of different methods of column strengthening .................... 27
Table 3-1: Concrete Mix Design Proportions .............................................................. 38
Table 3-2: Average load and strength results of concrete cubes and cylinders ........... 39
Table 3-3: Testing Results of FRP materials provided by the manufacturer ............... 41
Table 3-4: Properties of Primer.................................................................................... 41
Table 3-5: Properties of Saturant ................................................................................. 42
Table 3-6: Matrix designation system.......................................................................... 44
Table 5-1: Excel Sheet for the calculations of the confined load ................................ 85
Table 5-2: Theoretical Calculations-CFRP confined column ...................................... 86
Table 5-3: Theoretical Calculations-GFRP confined column ..................................... 87
Table 5-4: Theoretical vs. Experimental Results (Percentage Difference For N-Group)
...................................................................................................................................... 88
Table 5-5: Theoretical vs. Experimental Results (Percentage Increase for N-Group) 88
Table 6-1: Analysis of the experimental results .......................................................... 90
Table 6-2: Predicted values comparisosns ................................................................... 93
Table 7-1: Summary of Mode of Failure ..................................................................... 95
Table 7-2: N Group Load and Ductility Results .......................................................... 96
Table 7-3: U Group Load and Ductility Results .......................................................... 96
Table 7-4: N vs. U Group Load and Ductility Comparisons ....................................... 97
Table 7-5: N group Transverse strain comparisons ..................................................... 97
Table 7-6: U group Transverse strain comparisons ..................................................... 98
Table 7-7: N vs. U group Transverse strain comparisons ............................................ 98
12
List of Figures
Figure 2-1: AFRP [2] ................................................................................................... 21
Figure 2-2: CFRP [3] ................................................................................................... 21
Figure 2-3: GFRP [4] ................................................................................................... 21
Figure 2-4: Full Wrap .................................................................................................. 26
Figure 2-5: Partial Wrapping using discrete rings ....................................................... 26
Figure 2-6: Partial wrapping using continues spiral .................................................... 26
Figure 2-7: Typical Stress-Stain Curves of FRP confined square columns [24] ......... 27
Figure 2-8: Typical Stress-Strain Curves of FRP confined Concrete [28] .................. 28
Figure 3-1: Normal Design Reinforcement ................................................................. 37
Figure 3-2: Under Design Reinforcement .................................................................... 37
Figure 3-3: Normal design detailing for the reinforcement ......................................... 37
Figure 3-4: Under design detailing for the reinforcement ........................................... 37
Figure 3-5: Rebar Sample Stress vs. Strain curve........................................................ 38
Figure 3-6: Strength of Concrete Cubes ...................................................................... 39
Figure 3-7: Strength of Concrete Cylinders ................................................................. 39
Figure 3-8: Top view-original shape............................................................................ 39
Figure 3-9: Top view-rounded shape ........................................................................... 39
Figure 3-10: Column Configuration ............................................................................ 40
Figure 3-11: Strain Gauge Fixing ................................................................................ 40
Figure 3-12: Primer Part A .......................................................................................... 42
Figure 3-13: Primer Part B ........................................................................................... 42
Figure 3-14: Primer Effect [24] ................................................................................... 42
Figure 3-15: Saturant part A ........................................................................................ 43
Figure 3-16: Saturant Part B ........................................................................................ 43
Figure 3-17: Testing Equipment .................................................................................. 44
Figure 3-18: Specimen under testing ........................................................................... 44
Figure 4-1: N Load vs. Extension Diagram ................................................................. 46
Figure 4-2: N Axial vs. Transverse Strain ................................................................... 47
Figure 4-3: NC11 Two Sides view .............................................................................. 48
Figure 4-4: NC11 One Side view................................................................................. 48
Figure 4-5 : NC12 corner view ..................................................................................... 48

13
Figure 4-6: NC12 One side view ................................................................................. 48
Figure 4-7: NC13 Corner View ................................................................................... 49
Figure 4-8: NC13 Corner View ................................................................................... 49
Figure 4-9: NC1 Load vs. Extension Diagram ............................................................ 50
Figure 4-10: NC1 Axial vs. Transverse Strain............................................................. 51
Figure 4-11: NC21 Corner View ................................................................................. 52
Figure 4-12: NC21 Side View ..................................................................................... 52
Figure 4-13: NC22 Corner View ................................................................................. 52
Figure 4-14: NC22 Side View ..................................................................................... 52
Figure 4-15: NC23 Side View ..................................................................................... 53
Figure 4-16: NC23 Corner View ................................................................................. 53
Figure 4-17: NC2 Load vs. Extension Diagram .......................................................... 54
Figure 4-18: NC2 Axial vs. Transverse Strain............................................................. 55
Figure 4-19: NG11 Corner View ................................................................................. 56
Figure 4-20: NG11 Side View ..................................................................................... 56
Figure 4-21: NG12 Corner View ................................................................................. 56
Figure 4-22: NG12 Side View ..................................................................................... 56
Figure 4-23: NG13 Side View ..................................................................................... 57
Figure 4-24: NG13 Closer Side View .......................................................................... 57
Figure 4-25: NG1 Load vs. Extension Diagram .......................................................... 58
Figure 4-26: NG1 Axial vs. Transverse Strain ............................................................ 59
Figure 4-27: NG21 Corner View ................................................................................. 60
Figure 4-28: NG21 Top view ....................................................................................... 60
Figure 4-29: NG22 Corner View ................................................................................. 60
Figure 4-30: NG22 Side View ..................................................................................... 60
Figure 4-31: NG23 Side View ..................................................................................... 61
Figure 4-32: NG23 Different Side View ..................................................................... 61
Figure 4-33: NG2 Load vs. Extension ......................................................................... 62
Figure 4-34: NG2 Axial vs. Transverse Strain ............................................................ 63
Figure 4-35: U Load vs. Extension Diagram ............................................................... 64
Figure 4-36: U Axial vs. Transverse Strain ................................................................. 65
Figure 4-37: UC11 Corner View ................................................................................. 66
14
Figure 4-38: UC11 Close Corner View ....................................................................... 66
Figure 4-39: UC12 Corner View ................................................................................. 66
Figure 4-40: UC12 Corner View ................................................................................. 66
Figure 4-41: UC13 Corner View ................................................................................. 67
Figure 4-42: UC13 Close Corner View ....................................................................... 67
Figure 4-43: UC1 Load vs. Extension ......................................................................... 68
Figure 4-44: UC1 Axial vs. Transverse Strain............................................................. 69
Figure 4-45: UC21 Side View ..................................................................................... 70
Figure 4-46: UC21 Close Side View ........................................................................... 70
Figure 4-47: UC22 Corner View ................................................................................. 70
Figure 4-48: UC22 Top View ...................................................................................... 70
Figure 4-49: UC23 Corner View ................................................................................. 71
Figure 4-50: UC23 Side View ..................................................................................... 71
Figure 4-51: UC2 Load vs. Extension ......................................................................... 72
Figure 4-52: UC2 Axial vs. Transverse Strain............................................................. 73
Figure 4-53: UG11 Corner View ................................................................................. 74
Figure 4-54: UG11 Different Corner View ................................................................. 74
Figure 4-55: UG12 Corner View ................................................................................. 74
Figure 4-56: UG12 Side View ..................................................................................... 74
Figure 4-57: UG13 Corner View ................................................................................. 75
Figure 4-58: UG13 Side View ..................................................................................... 75
Figure 4-59: UG1 Load vs. Extension ......................................................................... 76
Figure 4-60: UG1 Axial vs. Transverse Strain ............................................................ 77
Figure 4-61: UG21 Corner View ................................................................................. 78
Figure 4-62: UG21 Side View ..................................................................................... 78
Figure 4-63: UG22 Side View ..................................................................................... 78
Figure 4-64: UG22 Corner View ................................................................................. 78
Figure 4-65: UG23 Corner View ................................................................................. 79
Figure 4-66: UG23 Side View ..................................................................................... 79
Figure 4-67: UG2 Load vs. Extension ......................................................................... 80
Figure 4-68: UG2 Axial vs. Transverse StrainDuctility Index .................................... 81
Figure 5-1: Equivalent circular section ........................................................................ 84
15
Figure 6-1: NC Analytical Model ................................................................................ 91
Figure 6-2: NG Analytical Model ................................................................................ 91
Figure 6-3: UC Analytical Model ................................................................................ 92
Figure 6-4: UG Analytical Model ................................................................................ 92
Figure A-1: N vs NC1 ................................................................................................ 105
Figure A-2: N vs NC2 ................................................................................................ 105
Figure A-3: N vs NG1................................................................................................ 106
Figure A-4: N vs NG2................................................................................................ 106
Figure A-5: U vs UC1 ................................................................................................ 107
Figure A-6: U vs UC2 ................................................................................................ 107
Figure A-7: U vs UG1................................................................................................ 108
Figure A-8: U vs UG2................................................................................................ 108
Figure A-9: NC1 vs UC1 ........................................................................................... 109
Figure A-10: NC2 vs UC2 ......................................................................................... 109
Figure A-11: NG1 vs UG1 ......................................................................................... 110
Figure A-12: NG2 vs UG2 ......................................................................................... 110
Figure A-13: NC1 vs NG1 ......................................................................................... 111
Figure A-14: NC2 vs NG2 ......................................................................................... 111
Figure A-15: UC1 vs UG1 ......................................................................................... 112
Figure A-16: UC2 vs UG2 ......................................................................................... 112
Figure A-17: N vs UC1 .............................................................................................. 113
Figure A-18: N vs UC2 .............................................................................................. 113
Figure A-19: N vs UG1.............................................................................................. 114
Figure A-20: N vs UG2.............................................................................................. 114
Figure A-21: NC1 vs NC2 ......................................................................................... 115
Figure A-22: NG1 vs NG2 ......................................................................................... 115
Figure A-23: UC1 vs UC2 ......................................................................................... 116
Figure A-24: UG1 vs UG2 ......................................................................................... 116
16
CHAPTER 1 INTRODUCTION
1.1 Problem Statement
Gulf Capital Countries (GCC) are well known for their hot climate and high-
humidity levels, going as high as 60°C and 80% during summer. Due to the high
temperature ranges, water evaporates causing the humidity level to rise. Upon
evaporation, the water consists of salts called “airborne salt” which adversely affect
the strength property of concrete by penetrating the surface. This effect takes place
when, upon penetration, they induce a chemical decomposition that results in
corroded reinforcements that degrades the strength of the structure. This drop in
concrete strength is a serious cause of concern. Consequently, the average life-cycle
of a concrete structure is considerably shorter when compared to the surrounding
regions.
Besides corrosion, other factors such as changes in the use of a structure and
new design codes also cause structure deficiency. Changes in structures occur upon a
change in live loads, for example an increase in traffic load due to traffic congestion.
New design codes, on the other hand, can potentially classify some buildings as
deficient.
Due to the difficulties associated with the production of high strength and
impermeable concrete mixtures that resist corrosion of steel rebars, a critical need for
innovative and well-engineered solutions has arisen. Fiber Reinforced Polymers
(FRP) is the solution put forth, with applications that range from the maintenance and
rehabilitation of deteriorating RC structures to the construction of new projects that
were once perceived as architecturally-challenging. High strength, high durability,
high corrosion resistance, high strength-to-weight ratio, ease of site installation,
electrochemical neutrality, and fire resistance are some of many encouraging pros that
make FRP materials the most favorable choice for strengthening structures.
1.2 Thesis Objectives
The origin of this idea was the need to find an alternative solution that would
not consider demolishing structures classified as unsafe. The outcome of this research
provided a better understanding of the FRP wrapping systems when applied on
17
structural concrete elements. This study examined the improvements of these systems
on the compressive strength and ductility. The primary objectives behind this research
were:
1. Studying the behavior of Normal-design RC column when strengthened with
CFRP and GFRP in one or two layers.
2. Studying the behavior of Under-designed RC columns when strengthened with
CFRP and GFRP in one or two layers.
3. Comparing the behavior of strengthened under-designed RC columns with the
non-strengthened Normal-design RC column.
4. Predicting the maximum confined concrete compressive strength based on
ACI-440 and compare it with the experimental results for Normal-design
columns.
5. Developing a parametric study that predicts the compressive strength of
confined concrete based on the properties of the wrapping system.
This study investigated the behavior of RC column in terms of strength and
ductility. In addition, it provided an indication as to whether or not the strengthening
of the under-designed RC column can be considered the alternative solution to
demolishing columns in the concrete building.

18
1.3 Scope of Work
This thesis evaluated strengthening reinforced concrete short columns with
CFRP and GFRP systems. This evaluation was based on the number of wrapping
layers and the type of design method followed for all the columns. Some of the
columns were designed to follow the minimum requirement based on ACI 318 code,
hence categorized as safe while the rest were designed based on reducing the number
of ties in order to ensure less strength handling. These columns were subjected to
different strengthening scenarios based on the wrapping material and number of
layers wrapped around the columns. After finalizing the wrapping process, columns
were tested to measure their load capacity and ductility.
1.4 Thesis Structure
This document is divided into seven chapters. Chapter 1 serves as the
introduction, providing a clear idea about the topic and a brief description of the
problem faced in the structural buildings. Lastly, it lists the objectives and the scope
of work covered in this research.
Chapter 2 serves as a literature review covering all the published research
materials dealing with the behavior of reinforced concrete members strengthened with
FRP systems. It starts with an introduction about FRP materials and their various
types. It also includes mechanical properties, advantages and limitations, and
economic considerations about the FRP materials. Finally, it summaries earlier
experiments carried out on structural concrete members strengthened with FRP
wrapping materials.
Chapter 3 discusses the experimental setup designed for this research. It
introduces the steel configuration of the two types of columns (Normal and Under)
according to ACI-318 code with a description of all the materials used (steel,
concrete, epoxy, CFRP and GFRP). This chapter also looks over the columns’ surface
preparation for strengthening with FRP wraps. Finally, it covers the proposed matrix
and the identification system for this research that was designed based on the
questioned parameters.
19
Chapter 4 examines the findings of the testing results for the entire matrix. For
each group, there is an overview and discussion about the mode of failure, the load vs.
deflection curve, the stress vs. strain curve, and the ductility index. The purpose of
these curves was to study the behavior of each column after testing.
Chapter 5 mentions the calculation process of the theoretical values for the
confined columns. The theoretical analysis was based on ACI-440.2R code. After an
introduction about the code, it describes the procedure followed in order to calculate
the theoretical confined concrete compressive strength. Furthermore, a spreadsheet is
introduced to demonstrate the inputs and outputs of the analysis. Sample calculations
to be compared to the actual results are also noted in this spreadsheet.
Chapter 6 provides the development of the analytical model, covering the first
model for predicting the theoretical value of compressive strength, and then recent
more accurate models created over the past few years. It also mentions the prediction
process of the new model that was used for all the cases that were considered. Finally,
a verification step was created to find how accurate the results of the new model were
when compared to the previous models.
Chapter 7 includes the summary for the entire body of work in this research,
illustrating the discussions for the mode of failure and the comparisons for the load,
deflection, and ductility results between all the groups.
20
CHAPTER 2 LITERATURE REVIEW
2.1 Introduction
In the last two decades, there has been an extensive demand for alternative
strengthening systems that would benefit structures in terms of strength and life-cycle
expectancy. Today, FRP composites are the most reliable material used for
strengthening structures, gaining this reputation due to various distinguished qualities
such as ease of installation, corrosion resistance, etc. While research is still ongoing
on such materials, not enough research is being carried out to study their strength and
ductility enhancement capabilities when applied on RC short columns (considered as
under-design columns). This chapter serves as a literature review for some of the
recent studies related to the behavior of different RC structural members subjected to
axial load.
2.2 Fiber Reinforced Polymers (FRP)
Fiber Reinforced polymer (FRP) is defined as composites resulting from
fusing two materials. One of the constituents is fibers, which are long strips of
fiberglass, aramid, or carbon. The other material is the polymer matrix. This material
serves as a binder that holds the fibers together to form the fiber reinforced polymer.
These binders can be found as epoxy, vinylester or polyester thermosetting plastic.
FRPs provide additional strength and stiffness to the structural members. Also,
they provide axial strength in the longitudinal direction and shear strength in the
transverse direction [1]. The following types of FRPs are most commonly used due to
their low cost, high thermal insulation, high tensile strength, and high fatigue
resistance, as opposed to steel or aluminum:
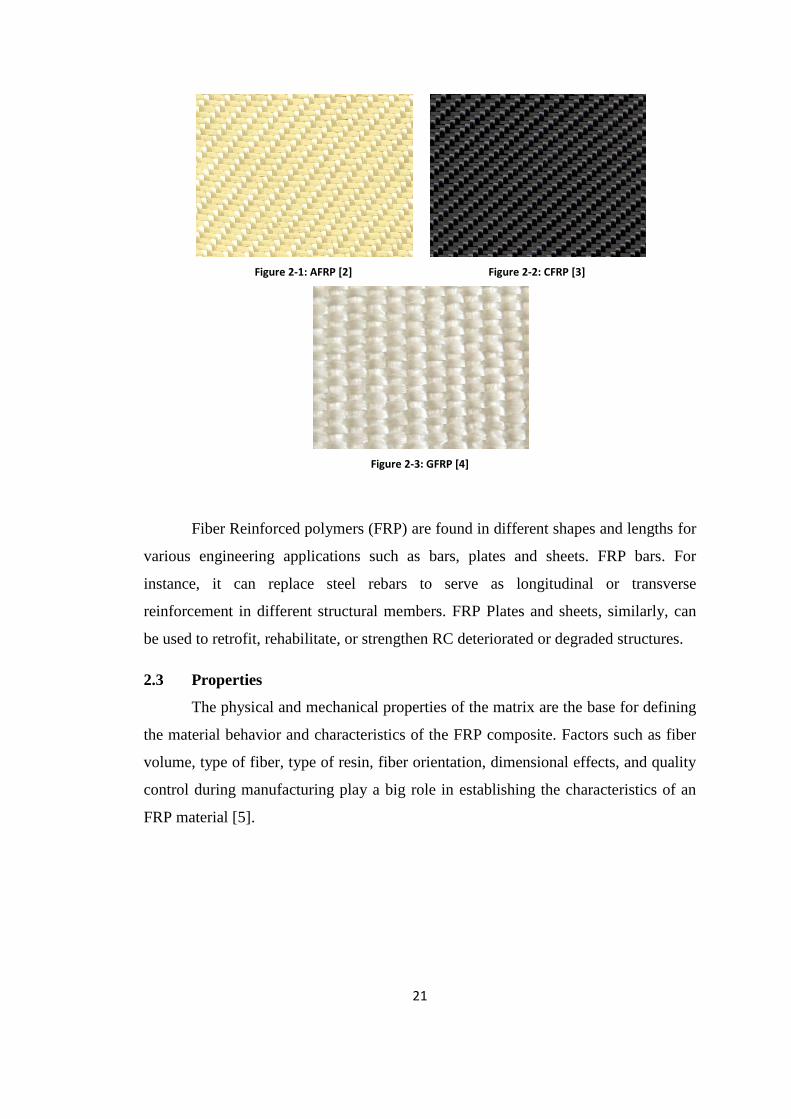
1. Glass (GFRP)
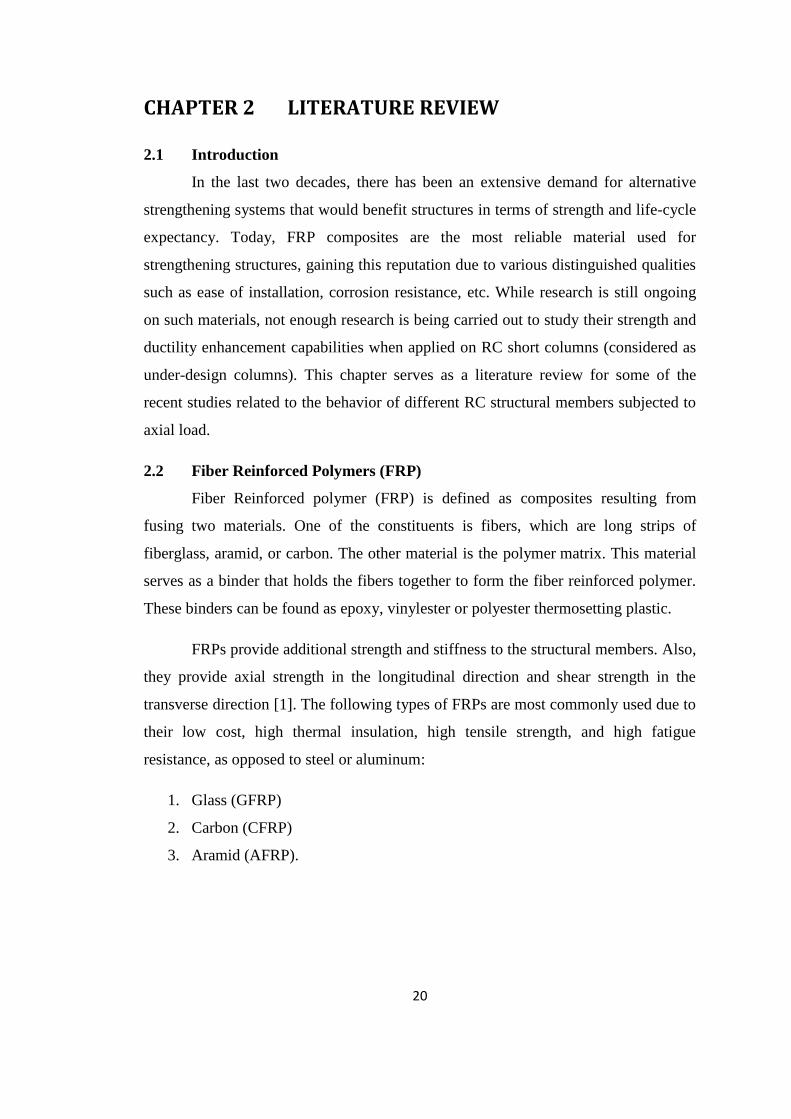
2. Carbon (CFRP)
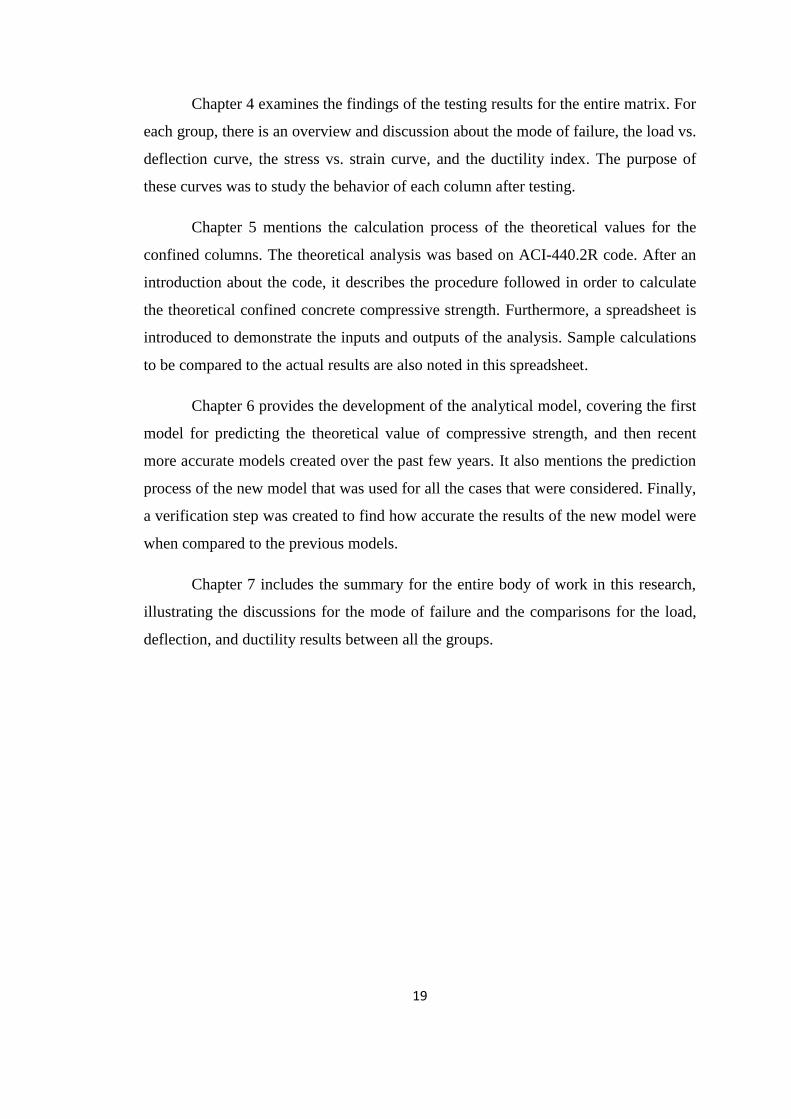
3. Aramid (AFRP).
21
Figure 2-1: AFRP [2]
Figure 2-2: CFRP [3]
Figure 2-3: GFRP [4]
Fiber Reinforced polymers (FRP) are found in different shapes and lengths for
various engineering applications such as bars, plates and sheets. FRP bars. For
instance, it can replace steel rebars to serve as longitudinal or transverse
reinforcement in different structural members. FRP Plates and sheets, similarly, can
be used to retrofit, rehabilitate, or strengthen RC deteriorated or degraded structures.
2.3 Properties
The physical and mechanical properties of the matrix are the base for defining
the material behavior and characteristics of the FRP composite. Factors such as fiber
volume, type of fiber, type of resin, fiber orientation, dimensional effects, and quality
control during manufacturing play a big role in establishing the characteristics of an
FRP material [5].

22
Table 2-1: Qualitative Comparison of FRP materials [6]
Criterion Aramid Carbon Glass
Young Modulus Good Very Good Adequate
Tensile Strength Very Good Very Good Very Good
Compressive Strength Inadequate Very Good Good
Long-term Behavior Good Excellent Very Good
Stiffness Good Very Good Adequate
Fatigue Behavior Good Excellent Adequate
Bulk Density Excellent Good Adequate
Alkaline Resistance Good Very Good Inadequate
Price Adequate Adequate Very Good
2.4 Factors affecting FRP properties:
2.4.1 Effect of Moisture
The infiltration of moisture in the FRP composites adversely affects
performance [6, 7]. Water penetration into FRPs is divided into two phases:
1. Mixed with the resin
2. Penetration into the cracks.
The former occurs during the mixing of the epoxy, where water molecules
evaporate in the air due to the humidity level and mix with the epoxy, resulting in a
decrease in the quality of the resin. In case of the latter, the penetration of water or
any other flaws happen occurs due to capillary flow [8, 9].
2.4.2 Effect of Alkalinity:
Durability is crucial in the design of concrete structures. Concrete is
considered to be high in alkalinity (pH=12.8) potentially leading to a reaction between
fibers (mainly glass), resulting in a reduction in composite strength, stiffness and
strength [1].
2.4.3 Effect of Temperature
Changes in temperature directly affect the rate of moisture absorption and the
mechanical properties of FRP [10, 11, 12, 13]. With an increase in temperature, the
23
mechanical properties of FRP composites decrease while accelerating the creep and
stress relaxation. This can be very clear when the temperature reaches glass transition
(Tg – 30°F and above) [14].
A decrease in the temperature, on the other hand, does not cause a severe
decrease in mechanical properties [15]; however, it can lead to possible increases in:
1. Tensile and flexural strength.
2. Fatigue strength and creep resistance.
3. Modulus of Elasticity.
Additionally, a decrease in FRP temperature can lead to possible decrease in:
1. Elongation and deflection.
2. Fracture toughness and impact strength.
3. Compressive strength.
4. Coefficient of linear expansion.
2.4.4 Creep/Relaxation
Generally, the increase of creep strains occurs due to poor matrix properties
and curing percentage. Moreover, resins (polymer) viscoelasticity play a vital role in
affecting creep stains of FRP materials [1]. Carbon based FRPs do not creep like other
type of FRPs; however, GFRPs exhibit a poor behavior under sustained loading. As a
result, the tensile strength of GFRPs plummets (as low as 20% of maximum) when
the material is subjected to permanent tension.
2.4.5 Fatigue
FRP composites accumulate damage micro-structurally as the number of load
cycles increases. Micro-structural damage includes fiber/matrix debonding and matrix
micro cracking. The fatigue behavior of composites materials depends on the fabric
lay-up sequence, temperature, moisture content, frequency, and maximum to
minimum stress/strain ratio [1]. It is interesting to notice that CFRP exhibit superior
fatigue performance to Steel. In fact, the dominant factor in the fatigue of FRP-
strengthened members is the fatigue of existing steel reinforcement.
24
2.5 Advantages and Limitation of FRPs
2.5.1 Advantages of using FRP Composite Wraps
Higher strength-to-weight ratio (15 and 35, respectively, for glass and carbon,
compared to that of steel)
Higher stiffness-to-weight ratio (1 and 3, respectively, for glass and carbon,
compared to that of steel)
Higher corrosion resistance
Lighter unit weight, resulting in less-expensive equipment for economical
handling, shipping, and transportation as well as lighter erection equipment
Higher durability, leading to lower life-cycle costs
Greater ductility, providing ample warning before collapse
Easier-to-reinforce micro-crack zones
Easier-to-control tension crack growth by the confining concrete
Better customization for specific needs
Faster field installation, resulting in more economical procedures for the
confinement of concrete in columns than steel jacketing
Simpler field corrections in case of installation defects of bonding of FRP with
concrete substrate
2.5.2 Limitations of using FRP Composite Wraps
Uncertainties about the durability of FRPs, as data about their long-term
performance is limited
Concerns of fire resistance
Limited knowledge of material properties and application procedures
Possible continuation of steel bar corrosion in warped concrete members
Lack of adequate laboratory and field data with respect to various structural
actions, including the shear-lag phenomenon due to an increase in the number
of fiber composite wrap layers
2.6 Economic Considerations
Compared to steel and aluminum, CFRP plates and sheets are considerately
more expensive. The raw material cost, alone, is often four times that of steel.
25
However, installation costs, transport and handling costs are much lower as opposed
to steel installation costs. Most importantly, the installation of CFRP is quick. A
reduced contract program obviously lowers the ancillary costs of access and plant
hire, propping and sit set-up. Even more significant are the reduced timescales for
road closures or traffic management.
Thus, with negligible planned expenditure on maintenance, the economics of
CFRP has become very attractive with the high cost of the carbon fiber composites
being counterbalanced sufficiently.
2.7 Confining RC Columns
2.7.1 General
Strengthening RC columns is the most common applications of FRP as it
enhances the load carrying capacity, ductility, and transverse strain. In addition, the
lateral confinement increases the axial strength and ductility. On the other hand, the
change in the transverse strain decreases with the increase in the lateral confinement.
Until the 1990s, there were two methods used for confining RC columns [16]:
1. Reinforced concrete cage
2. Grout-injected steel jackets.
Steel jacketing is more effective than caging because it provides an increase in
the cross-sectional area and weight of the structure. However, both methods require
intensive work and are difficult to install. Furthermore, both caging and steel
jacketing are made of steel which means that they are highly vulnerable to corrosion
due to the low resistance against weather attacks [16, 17].
2.7.2 Methods of Confinement
Three types of confinement are illustrated in this: wrapping, filament winding,
and prefabricated shell jacketing.
2.7.2.1 Wrapping
FRP wrapping is considered to be the most common method of strengthening
RC columns with FRP composites. This method, known as the wet lay-up method,
involves unidirectional FRP wraps being fully submerged in epoxy. The direction of
26
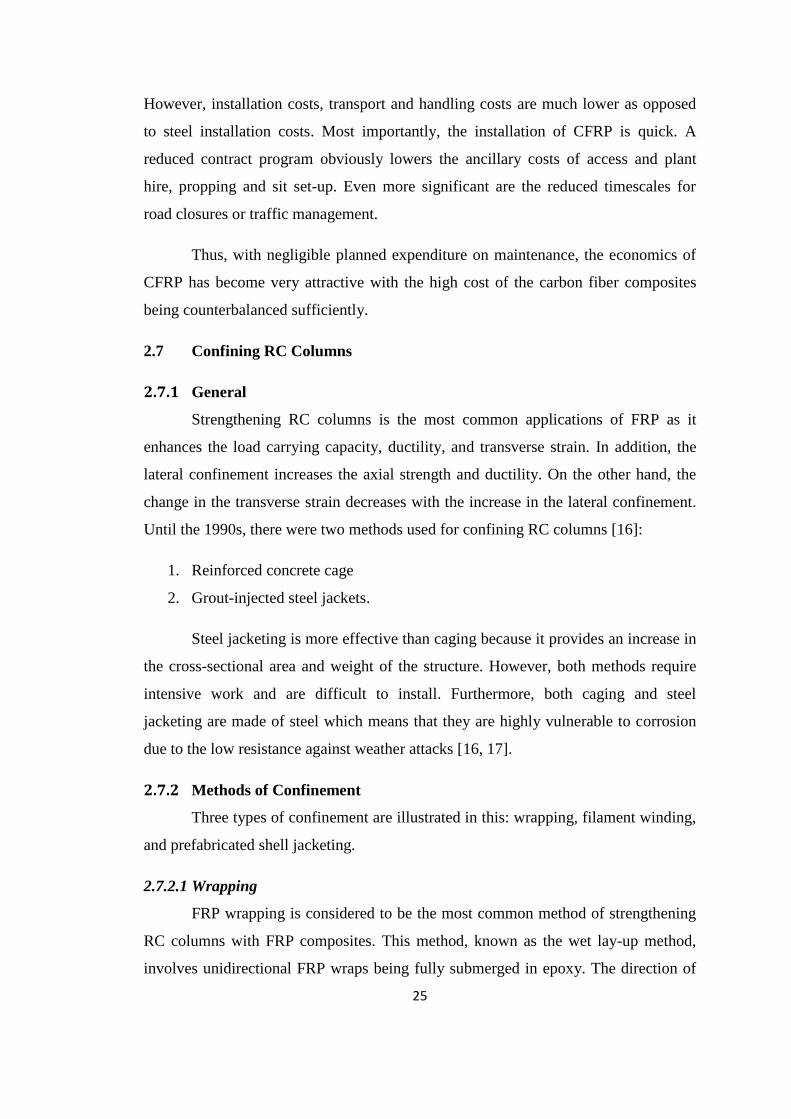
the wraps is perpendicular to the axis of the column. The methods of wrapping are
different from each other. An RC column can be fully wrapped with FRP composite
in one or more layers as shown in Figure 2-4. It can also be either partially wrapped
using discrete ring of one or multiple layers as shown in Figure 2-5. It can even be
wrapped using continues spirals of one or more layers as in Figure 2-6.
Figure 2-4: Full Wrap
Figure 2-5: Partial Wrapping using
discrete rings
Figure 2-6: Partial wrapping using
continues spiral
The first demonstration for enhancing the compressive strength of confined
RC members with external FRP wraps was made by Fradis and Khalili [18, 19].
2.7.2.2 Filament Winding
The filament winding follows the same principle of wrapping, except it uses
continues fiber straps instead of discrete sheets allowing it to be processed
automatically via computer software. Through filament winding, an FRP jacket with
specific thickness, fiber orientation and volume fraction can be obtained. Fradis and
Khalili [18] were the first to introduce the confinement of concrete by winding
continues resin-impregnated fiber strands. The first winding machine was developed
in Japan in the mid-1980s [20].
2.7.2.3 Prefabricated Shell Jacketing
The shells are fabricated under controlled conditions using fiber sheets or
strands with the impregnation of resins affected prior to field installation. They can be
fabricated in half-circles, half-rectangles [21, 22] and circles with a slit or in
continuous rolls [23], so they can be opened and placed around columns. For effective
FRP confinement, a full contact between the column and the FRP shell is essential.
This is ensured by bonding the shell to the column using adhesives or by injecting
27
shrinkage-compensated cement grout/mortar into the space between the shell and the
column [21, 22].
Table 2-2: A comparison of different methods of column strengthening
Method Advantages Disadvantages
Wrapping
Flexibility in coping with
different columns shapes
Ease in site handling, without the
need for special equipment
Least quality control
Most labor intensive
Filament Winding Improved quality control
Reduced on-site labor
Reduced flexibility in
coping with different
columns shapes
Special equipment
required
Prefabricated
Shells
Best Quality control
Least on-site labor
Useful for column shape
modification
Limited flexibility in
coping with different
columns shapes
Prefabrication Cost
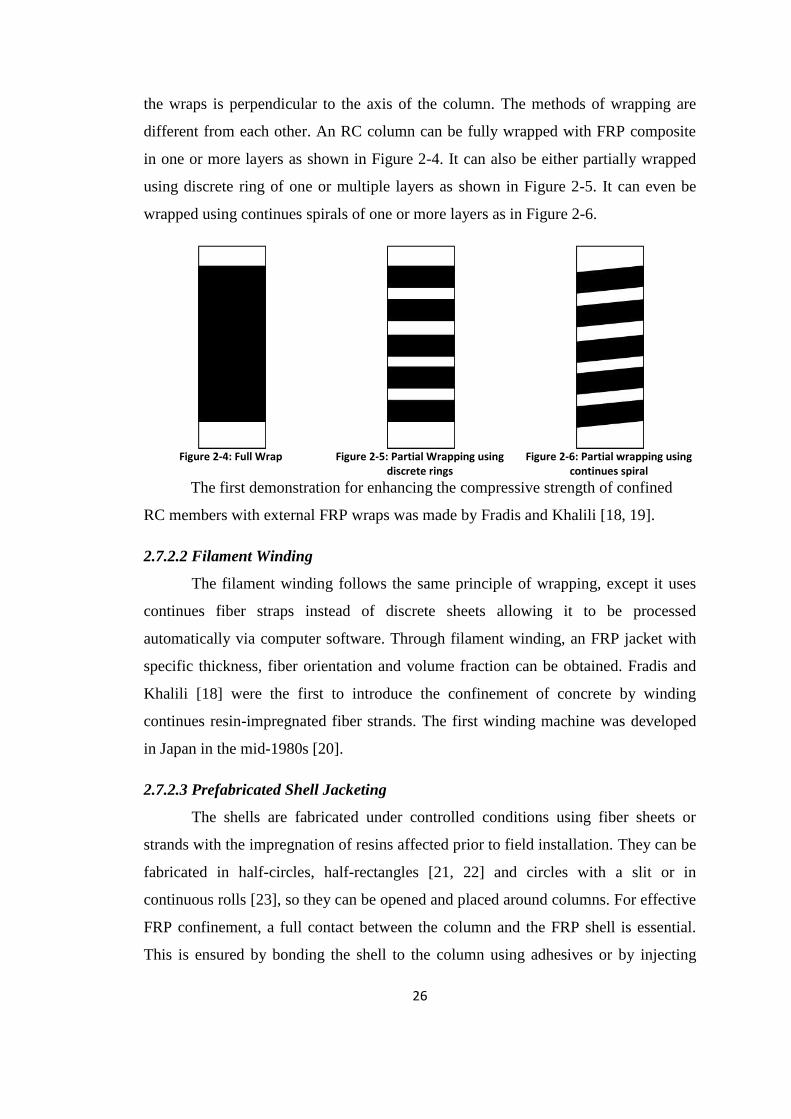
2.7.3 Failure Modes for Rectangular Columns
It is well-established that FRP confinement is less effective for rectangular
columns than for circular columns, despite rounding off the corners. The reasons for
this are that confining pressure is uniformly distributed and that only a part of the
concrete core is effectively confined.
Figure 2-7: Typical Stress-Stain Curves of FRP confined square columns [24]
Failure generally occurs at the corners by FRP tensile rupture. The
stress-strain curves are more likely to feature a descending branch and FRP
confinements provide little strength enhancement. In such cases, the ultimate strength
of the FRP-confined concrete is reached before the ultimate strain of FRP, where the
28
FRP-confined concrete carries a substantial stress which may or may not exceed the
strength of the unconfined concrete [25, 26, 27].
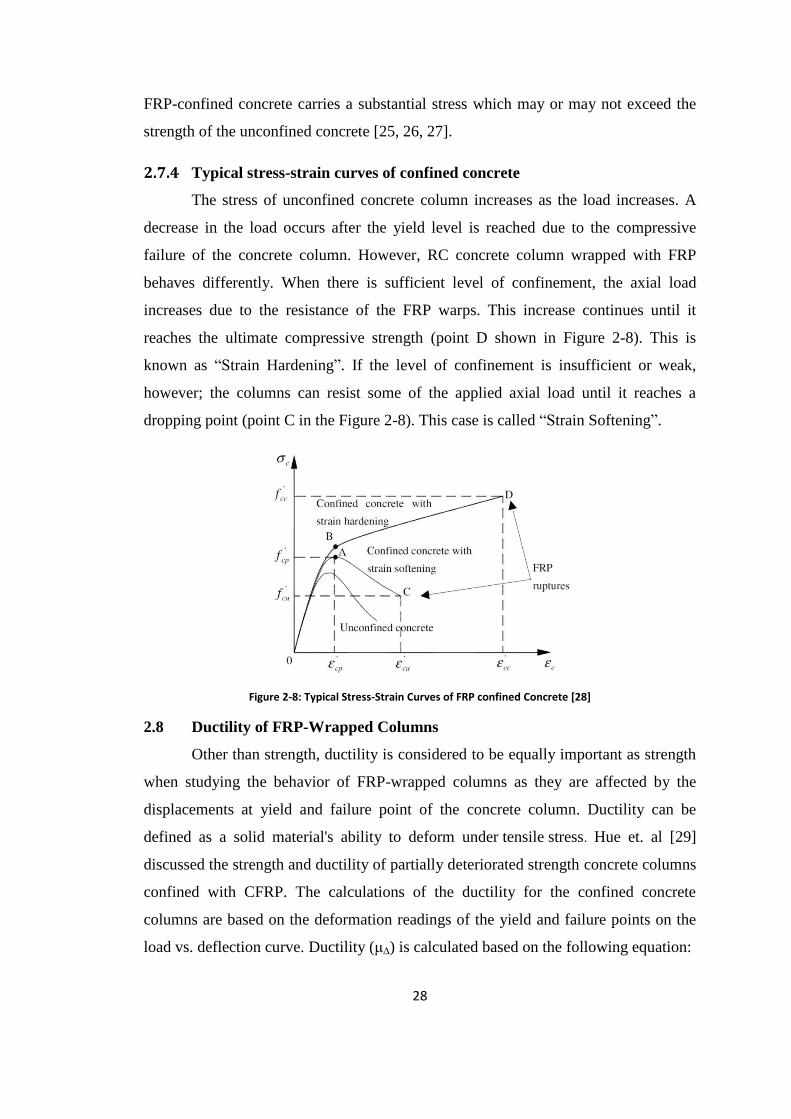
2.7.4 Typical stress-strain curves of confined concrete
The stress of unconfined concrete column increases as the load increases. A
decrease in the load occurs after the yield level is reached due to the compressive
failure of the concrete column. However, RC concrete column wrapped with FRP
behaves differently. When there is sufficient level of confinement, the axial load
increases due to the resistance of the FRP warps. This increase continues until it
reaches the ultimate compressive strength (point D shown in Figure 2-8). This is
known as “Strain Hardening”. If the level of confinement is insufficient or weak,
however; the columns can resist some of the applied axial load until it reaches a
dropping point (point C in the Figure 2-8). This case is called “Strain Softening”.
Figure 2-8: Typical Stress-Strain Curves of FRP confined Concrete [28]
2.8 Ductility of FRP-Wrapped Columns
Other than strength, ductility is considered to be equally important as strength
when studying the behavior of FRP-wrapped columns as they are affected by the
displacements at yield and failure point of the concrete column. Ductility can be
defined as a solid material's ability to deform under tensile stress. Hue et. al [29]
discussed the strength and ductility of partially deteriorated strength concrete columns
confined with CFRP. The calculations of the ductility for the confined concrete
columns are based on the deformation readings of the yield and failure points on the
load vs. deflection curve. Ductility (μ∆) is calculated based on the following equation:
29
Where represents the deflection at ultimate point and represents the deflection
at yield load in the load vs. deflection curve.
2.9 Previous Experimental Studies
In previous decades, extensive research was carried out on strengthening
reinforced concrete columns with various FRP materials in order to improve strength
and ductility. Such studies have helped develop standards for the design of concrete
mix with a specific compressive strength and type. Furthermore, the last century has
seen many methods being introduced for retrofitting reinforced concrete structures.
Such methods started off with using steel for such purposes and eventually migrating
to materials such as aluminum and FRPs.
R. Kumutha, R. Vaidyanathan, and M.S. Palanichamy [30] studied the
behavior of axially loaded rectangular columns strengthened with glass fiber
reinforced polymer (GFRP) wraps. The objectives of this study centered upon
evaluating the effectiveness of external GFRP strengthening for rectangular concrete
columns, evaluating the effect of number of GFRP layers on the ultimate load and
ductility of confined concrete, and evaluating the effect of the aspect ratio of the
column on the effectively confined cross-section. A total of nine specimens were
subjected to axial compression, including three control specimens. The specimens
were loaded to failure in axial compression and the specimen behaviour in axial and
transverse directions was investigated. The parameters of this study included the
aspect ratio of the cross-section (1, 1.25, and 1.66) and the number of GFRP layers (0,
1, and 2).
All nine reinforced concrete columns were also tested under concentric
loading and had the same dimensions: a length of 750mm and a cross-sectional area
of 15625mm2. The classification of columns followed certain designation represented
by three terms. The first term refers to the number of GFRP sheets making up the
jacket. The second term describes the shape of the column cross-section. ‘S’ refers to
a square cross-section and ‘R’ refers to a rectangular cross-section. The third term
which is a number in subscript refers to the aspect ratio of the column cross-section.
30
In conclusion, effective confinement with GFRP composite sheets resulted in
higher compressive strength. Better confinement was achieved when the number of
GFRP wrap layers was increased, resulting in enhanced load carrying capacity of the
column, in addition to overall improvement in ductility. The load carrying capacity of
the column decreased with an increase in aspect ratio of the cross-section. The test
results show a definite overall linear relationship between the strength of confined
concrete and lateral confining pressure provided by FRP.
Muhammad N.S. Hadi [31] presented the results procured by testing wrapped
columns subjected to eccentric loads. This paper provided a description of the loading
mechanism and results of testing nine prismatic circular columns tested under
eccentric load. The columns were wrapped with CFRP or GFRP. Nine short
cylindrical high strength concrete columns were designed for testing. Three columns
were reinforced with steel bars and the remaining six columns were made of plain
concrete. Three of the six plain columns were wrapped with unidirectional carbon
while the remaining three columns were wrapped with weave E-glass. The general
properties and the dimensions of column specimen are shown in the following table:
In his conclusion, external confinement with FRP composite appeared to
significantly augment the strength of concrete column. However, when the eccentric
load was introduced into the experiment, the strength loss was vastly evident. In
addition, the maximum load capacity of a confined column under eccentric load was
directly related to the magnitude of eccentricity. That is, a larger eccentricity results in
a smaller maximum load. However, the lateral deflection—another important design
criterion—had no direct relation with the eccentricities. Furthermore, externally
confined concrete column could undergo large deformation without rupture (the
extent of deformation could be decided by the strength of FRP composite). Finally,
when tested both concentrically and eccentrically, the CFRP wrapped columns
resulted in higher loads and ductility as opposed to GFRP-wrapped and steel-
reinforced columns
Omar Chaallal, Mohsen Shahawy, and Hunzer Hassan [32] presented the
results of a comprehensive experimental investigation on the behaviour of axially
loaded short rectangular columns strengthened with carbon fiber-reinforced polymer
(CFRP) wrap. The objectives of the study were assessing the effectiveness of external
31
CFRP strengthening for rectangular short concrete columns, assessing the effect of the
number of CFRP layers on the ultimate strength and ductility of the confined
concrete, assessing the effect of the aspect ratio of the column on the effectively
confined cross-section, and to monitor the influence of the compressive strength of
unconfined concrete on the gain in strength and ductility of the confined concrete. The
parameters considered in this study were:
1. The concrete strength (3 ksi and 6 ksi)
2. The aspect ratio of the cross-section (a/b= 1, 0,654, and 0.5)
3. The number of CFRP layers (0, 1, 2, 3, and 4).
As conclusion, the confinement provided by the CFRP improved both the
load-carrying capacity and the column ductility. This method of structural
rehabilitation was shown to be applicable to rectangular sections as well. In addition,
as the compressive strength of concrete increased, both the axial and transverse strains
decreased significantly. Square columns generally exhibited higher dilation ratios than
the rectangular columns. In fact, after a certain degree of confinement, the dilation
ratio decreases with respect to an increase in jacket stiffness. Furthermore, the
stiffness of the applied CFRP jacket is the key parameter in the external jacket retrofit
designing. The jacket must be sufficiently stiff to develop appropriate confining
forces at relatively low column axial strain levels. A stiff jacket also better controls
the dilation of the cross-section, resulting in larger axial strain capacities. Finally, a
gain in the compressive strength of CFRP confined concrete is governed by the
stiffness ratio of the FRP jacket between lateral direction and axial stiffness of the
column.
Manuel A.G. Silva [33] presented the results of the tests performed on axially
loaded RC columns (both square and circular cross-section) with and without jackets.
The FRP tested were made of either CFRP or AFRP (aramidic wraps). Moreover, a
comparison of gains of axial strength and ductility was presented along with aspects
of variation of the lateral pressure and FRP jackets ruptures. Tests were performed on
reinforced concrete cylinders and square prisms of 0.75m height and an aspect ratio
(height/diameter or width) equal to five. The prismatic columns of square cross-
section were divided into three groups according to corner sharpness:
1. R1 – sharp-edged corner
32
2. R2 – corner radius equal to 20mm
3. R3 – corner radius equal to 38mm, which corresponds to 1/4 of the width of
the square-section.
Columns with small chamfer, R0, were also tested.
In his conclusion, the improvement of axial load capacity from jackets of
AFRP or CFRP was equivalent for cylindrical columns. The improvement in ductility
could not be conclusively shown as higher for AFRP than for CFRP as they were
roughly similar for the cylindrical columns tested in this program. Columns of square-
section and sharp corners evidenced no improvement of capacity or ductility upon
confinement in CFRP jackets. For AFRP confinement, there was improvement of load
capacity, but no significant improvement in ductility. Lastly, estimated jacket rupture
lateral strains were considerably lower than ultimate strains obtained from flat
coupons owing to “strain localization phenomena” in the jacket. This is a result of
concentrated actions due to concrete crushing, buckling of longitudinal reinforcement
and rupture of stirrups.
Y. Toutanjii and Y. Deng presented an extensive research on axially loaded
members confined with AFRP [34]. They investigated the performance of AFRP
confined concrete columns in wet/dry and freeze/thaw conditions. A total of 24
cylindrical specimens were utilized, with dimension of 76mm x 305mm. 12 columns
were confined with AFRP and the other 12 were plain (control). Their mix design had
a water/cement ratio of 0.5, sand/cement ratio of 2.0, and gravel/cement ratio of 3.0.
The course aggregate contained crushed stone with a maximum size of 12.7mm with
fine aggregate composition of 50% river and 50% beach sand. All the specimens were
prepared via 28 days of curing at 25oC and 90% humidity. The average compressive
strength of concrete, for the 28-days curing, was 44MPa. The concrete cylinders were
wrapped with two layers of unidirectional AFRP composites and all samples were
loaded at a loading rate of 0.24MPa/s in uniaxial compression until failure.
The experimentation led to the conclusion that AFRP confinement constrains
the lateral strain producing a tri-axial stress field in the concrete. This improved the
compressive strength, maximum strain, and ductility of the columns. In addition,
durability test results indicated that wet/dry environment had little effect on the
compressive strength of AFRP-wrapped specimens. And finally, exposure to
33
freeze/thaw environments had marginal effect on the compression strength of AFRP-
wrapped columns.
Hua Wei, Zimin Wu, Xia Guo, and Fumin Yi [35] conducted an experimental
study on partially deteriorated strength concrete columns confined with CFRP, aiming
to study the mechanical behavior of deteriorated parts confined with CFRP. They
proposed two series of columns:
P-Series consisted of 15 columns in five groups with plain concrete in total.
Each group had three identical specimens. Each specimen was 150mm x
150mm in cross-section and 550mm in height. Each specimen also had three
segments with two grades of concrete strength: lower-strength casted at the
middle while the higher-grade casted at the top and bottom of the column.
S-Series consisted of five reinforced concrete columns. Each specimen had
200mm x 200mm x 1250 mm with 4 main reinforcement bars of 14mm
diameter, yield strength of 335MPa, and ultimate strength of 555MPa. They
also consisted of stirrups of 6mm diameter with yield strength of 345MPa,
lateral spacing of 150mm at the test part and 50mm lateral spacing at the
edges. Similar to P-Series columns, four columns were divided into three
segments with two grades of concrete strength and the fifth column had higher
grade of strength.
The letter “P” indicated columns with plain concrete and “S” indicated
reinforced column. “U”, similarly, marked unwrapped columns while “W” marked
wrapped column. Unwrapped column with a deteriorated strength parts (middle part)
were identified by “U1” while “U2” identified unwrapped columns with a single
higher compressive strength.
After testing, they concluded that partial confinement in deteriorated regions
with CFRP significantly enhances the performance of columns in terms of strength
and ductility. The load capacity of the entire column can also subsequently be
improved.
The ductility of confined specimens was enhanced significantly compared to
the partial deteriorated columns and the original columns. The gain in load capacity
34
was different with the layer of CFRP. The greater the number of CFRP layers, the
greater the gain in load capacities. Partial confinement on deteriorated parts can be
developed as an alternative approach in axial compressive conditions to avoid cost
and time-consumption.
Raafat El-Hach, Mark F. Green, and Gordon R. Wight [36] studied the Effect
of Severe Environmental Exposures on CFRP-wrapped concrete columns. In their
paper, the aim was to study the behavior of CFRP wrapped concrete cylinders when
subjected to harsh environmental conditions (heating-cooling cycles, freezing-thawing
cycles, and exposure to fresh and salt water) and compare this to the experimental
results with predicted values of ACI 440 and ISIS Canada 2001. The experimental
program involved testing 36 standard plain concrete cylinders (150mm diameter by
300mm in length) in six different environments closely simulating aggressive
conditions. In each group, three cylinders were confined by wrapping them with
epoxy bonded CFRP sheets at room temperature and three were left unwrapped. The
cylinders were wrapped twenty-two days after casting. All cylinders were tested to
failure in axial-compression at room temperature. The environmental conditions were:
1. Room temperature +20±3°C and relative humidity 50%±5% for 70 days.
2. Heating and cooling cycling (+23 to +45°C) for 33 cycles. Each cycle had a
maximum temperature of 45°C that was maintained for about 24 hour then
decreased to room temperature for another 24 hours.
3. Prolonged exposure to high temperature +45±5°C for 70 days. In this group, 3
cylinders were wrapped with the CFRP sheets before they were subjected to
the high temperature exposure. The other three were wrapped after exposure to
high temperature.
4. Heating-cooling cycling (+23 to +45°C) for 22 cycles. Each cycle had a
maximum temperature of 45°C maintained for roughly 24 hours then
decreased to room temperature for another 24 hours. This was followed by 33
freezing and thawing cycles. The freezing-thawing was performed by placing
the concrete cylinders in the cold room overnight at −18°C for 16 hours, and
removing them in the morning to thaw in a water bath at +18°C for 8 hours.
35
5. Heating-cooling cycling (+23 to +45°C) for 22 cycles followed by immersion
in fresh water (pH=8 at 23°C) for 33 days.
6. Heating-cooling (+23 to +45°C) for 22 cycles followed by immersion in salt
water pH=9 at 23°C for 33 days. The sodium chloride (NaCl) was a 3.5% by
weight solution to simulate exposure to seawater.
They concluded that with a confining wrap of two layers, the strength of the
concrete cylinders increases by up to 43 and 74% over unconfined cylinders kept at
room temperature and subjected to heating-cooling cycles. Axial strain in the confined
cylinders was approximately four times greater. Furthermore, heating-cooling cycles
reduced the compressive strength for the unwrapped cylinders. No significant
difference in strength between the wrapped cylinders subjected to heating-cooling and
the specimens kept at room temperature was found. Freezing-thawing exposure as
well as fresh-salt water immersion also had a slightly negative effect on the
compressive strength of both unwrapped and wrapped cylinders as opposed to room
temperature and heating-cooling exposure. Finally, the predicted ultimate FRP-
confined concrete compressive strength using the ACI 440 and ISIS Canada models
compared favorably with the experimental results.
Although many researchers have investigated the effect of FRP materials on
enhancing the performance of RC structures in normal and severe environmental
conditions or in circular and rectangular shapes, topics concerned with enhancing RC
columns with lower transverse reinforcement has not met researchers’ interest. In this
research, the behavior of these columns was investigated when enhanced with CFRP
and GFRP.
36
CHAPTER 3 EXPERIMENTAL SETUP
3.1 Columns Configuration
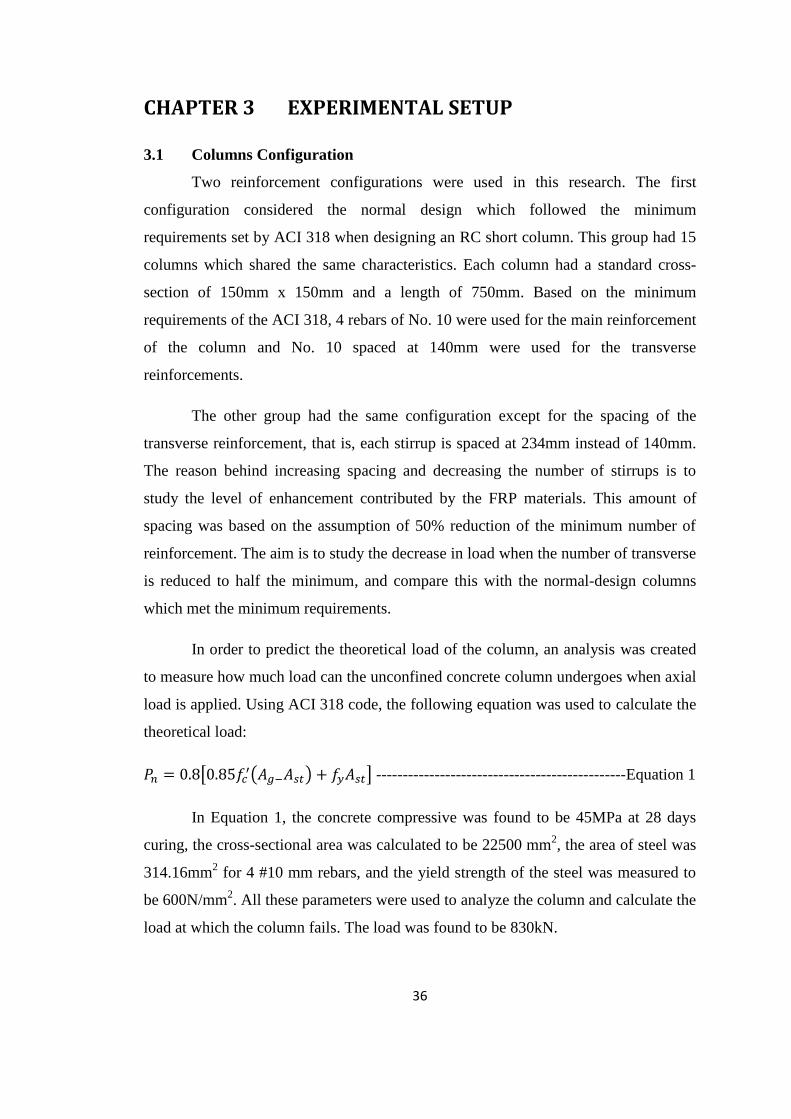
Two reinforcement configurations were used in this research. The first
configuration considered the normal design which followed the minimum
requirements set by ACI 318 when designing an RC short column. This group had 15
columns which shared the same characteristics. Each column had a standard cross-
section of 150mm x 150mm and a length of 750mm. Based on the minimum
requirements of the ACI 318, 4 rebars of No. 10 were used for the main reinforcement
of the column and No. 10 spaced at 140mm were used for the transverse
reinforcements.
The other group had the same configuration except for the spacing of the
transverse reinforcement, that is, each stirrup is spaced at 234mm instead of 140mm.
The reason behind increasing spacing and decreasing the number of stirrups is to
study the level of enhancement contributed by the FRP materials. This amount of
spacing was based on the assumption of 50% reduction of the minimum number of
reinforcement. The aim is to study the decrease in load when the number of transverse
is reduced to half the minimum, and compare this with the normal-design columns
which met the minimum requirements.
In order to predict the theoretical load of the column, an analysis was created
to measure how much load can the unconfined concrete column undergoes when axial
load is applied. Using ACI 318 code, the following equation was used to calculate the
theoretical load:
[ ( ) ] -----------------------------------------------Equation 1
In Equation 1, the concrete compressive was found to be 45MPa at 28 days
curing, the cross-sectional area was calculated to be 22500 mm2, the area of steel was
314.16mm2 for 4 #10 mm rebars, and the yield strength of the steel was measured to
be 600N/mm2. All these parameters were used to analyze the column and calculate the
load at which the column fails. The load was found to be 830kN.
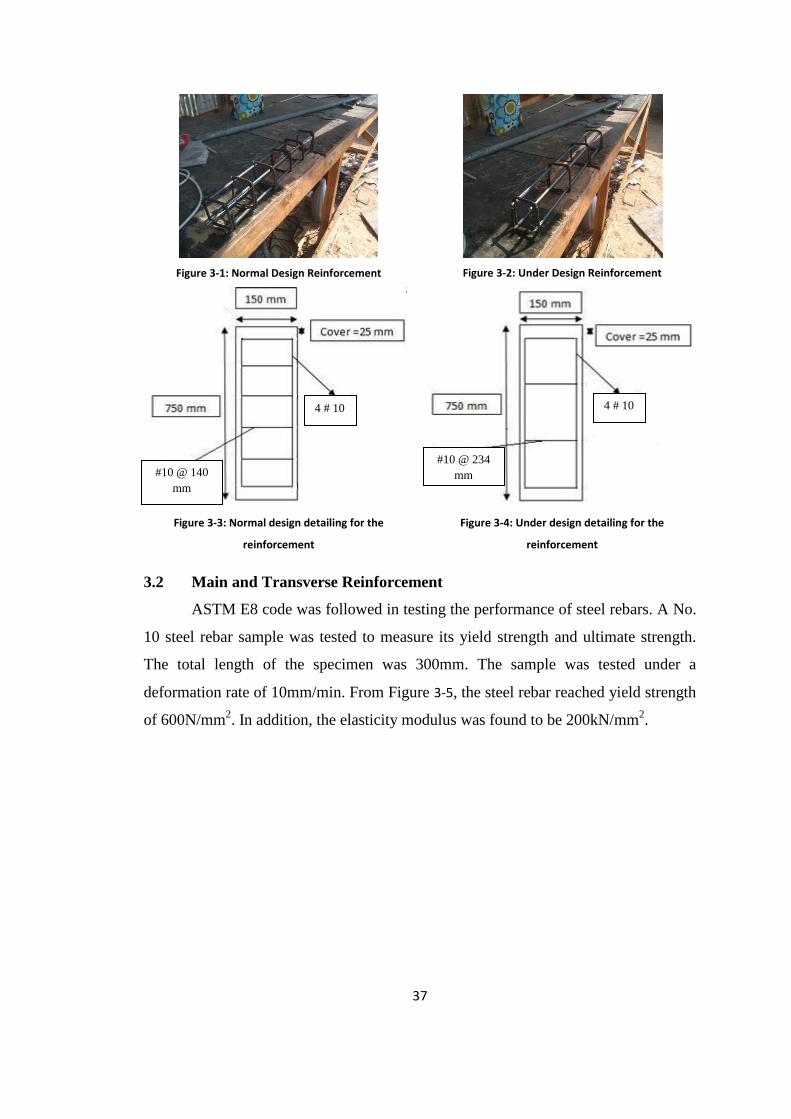
37
Figure 3-1: Normal Design Reinforcement
Figure 3-2: Under Design Reinforcement
Figure 3-3: Normal design detailing for the
reinforcement
Figure 3-4: Under design detailing for the
reinforcement
3.2 Main and Transverse Reinforcement
ASTM E8 code was followed in testing the performance of steel rebars. A No.
10 steel rebar sample was tested to measure its yield strength and ultimate strength.
The total length of the specimen was 300mm. The sample was tested under a
deformation rate of 10mm/min. From Figure 3-5, the steel rebar reached yield strength
of 600N/mm2. In addition, the elasticity modulus was found to be 200kN/mm
2.
4 # 10 4 # 10
#10 @ 140
mm
#10 @ 234
mm
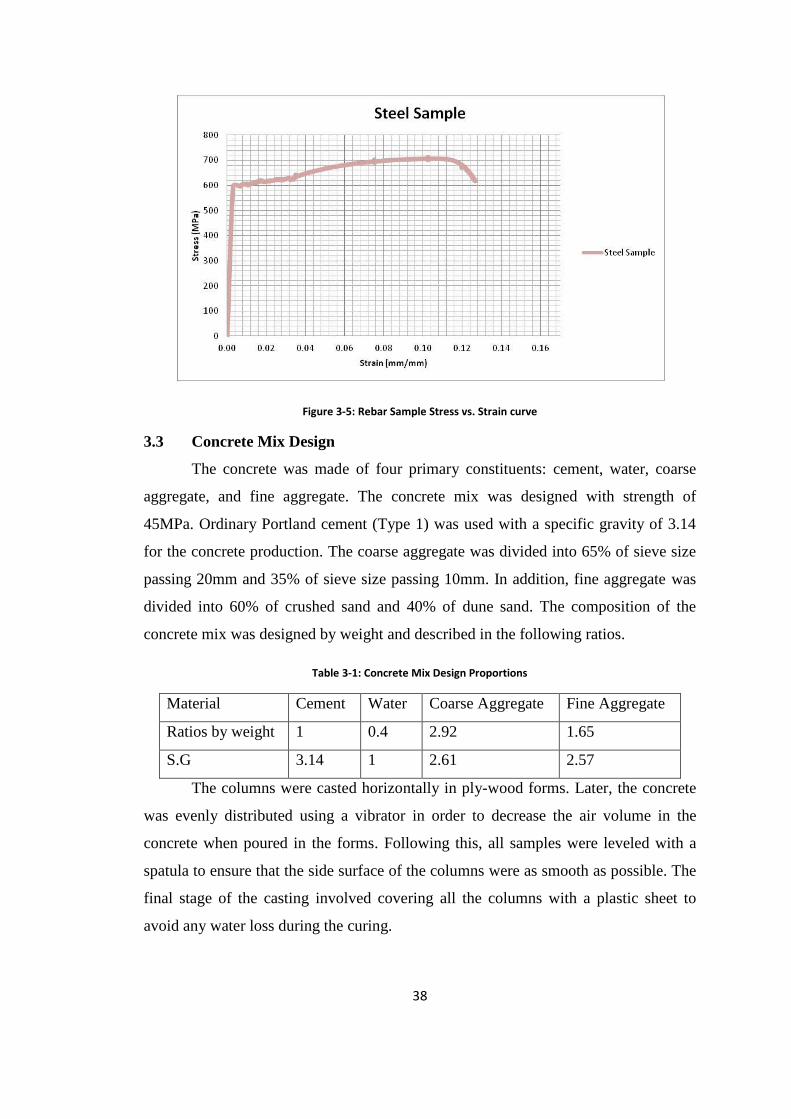
38
Figure 3-5: Rebar Sample Stress vs. Strain curve
3.3 Concrete Mix Design
The concrete was made of four primary constituents: cement, water, coarse
aggregate, and fine aggregate. The concrete mix was designed with strength of
45MPa. Ordinary Portland cement (Type 1) was used with a specific gravity of 3.14
for the concrete production. The coarse aggregate was divided into 65% of sieve size
passing 20mm and 35% of sieve size passing 10mm. In addition, fine aggregate was
divided into 60% of crushed sand and 40% of dune sand. The composition of the
concrete mix was designed by weight and described in the following ratios.
Table 3-1: Concrete Mix Design Proportions
Material Cement Water Coarse Aggregate Fine Aggregate
Ratios by weight 1 0.4 2.92 1.65
S.G 3.14 1 2.61 2.57
The columns were casted horizontally in ply-wood forms. Later, the concrete
was evenly distributed using a vibrator in order to decrease the air volume in the
concrete when poured in the forms. Following this, all samples were leveled with a
spatula to ensure that the side surface of the columns were as smooth as possible. The
final stage of the casting involved covering all the columns with a plastic sheet to
avoid any water loss during the curing.
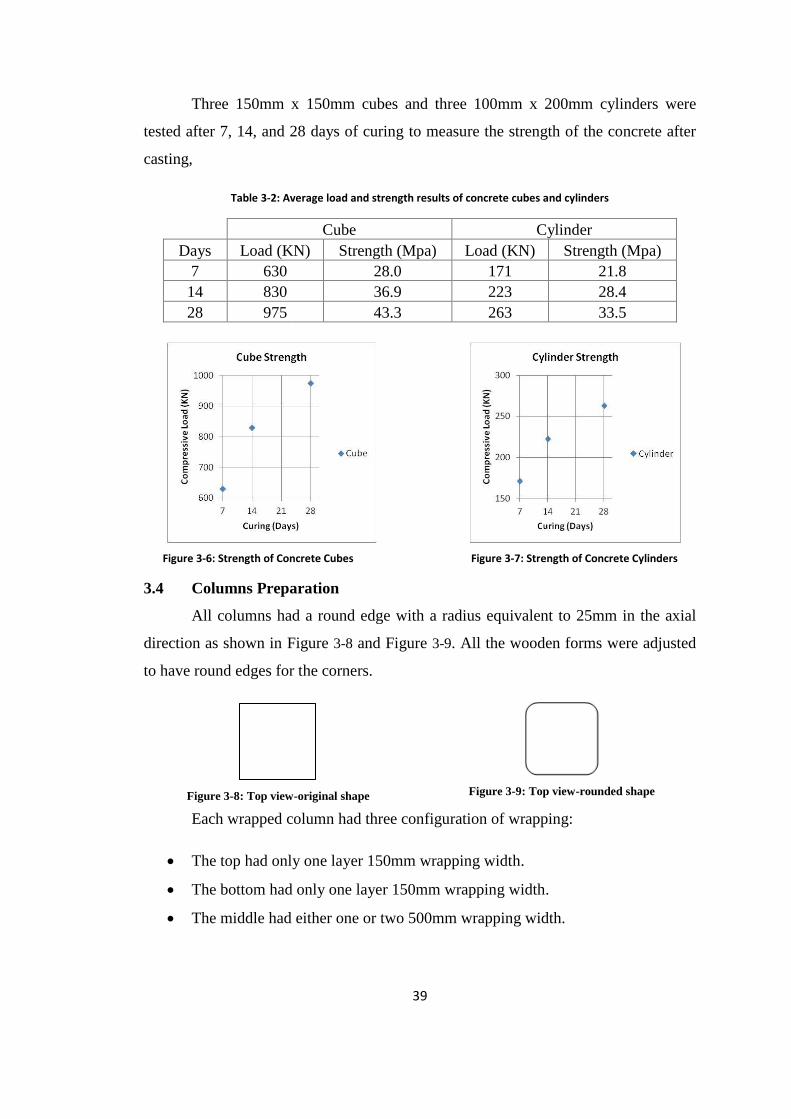
39
Three 150mm x 150mm cubes and three 100mm x 200mm cylinders were
tested after 7, 14, and 28 days of curing to measure the strength of the concrete after
casting,
Table 3-2: Average load and strength results of concrete cubes and cylinders
Cube Cylinder
Days Load (KN) Strength (Mpa) Load (KN) Strength (Mpa)
7 630 28.0 171 21.8
14 830 36.9 223 28.4
28 975 43.3 263 33.5
Figure 3-6: Strength of Concrete Cubes
Figure 3-7: Strength of Concrete Cylinders
3.4 Columns Preparation
All columns had a round edge with a radius equivalent to 25mm in the axial
direction as shown in Figure 3-8 and Figure 3-9. All the wooden forms were adjusted
to have round edges for the corners.
Figure 3-8: Top view-original shape
Figure 3-9: Top view-rounded shape
Each wrapped column had three configuration of wrapping:
The top had only one layer 150mm wrapping width.
The bottom had only one layer 150mm wrapping width.
The middle had either one or two 500mm wrapping width.
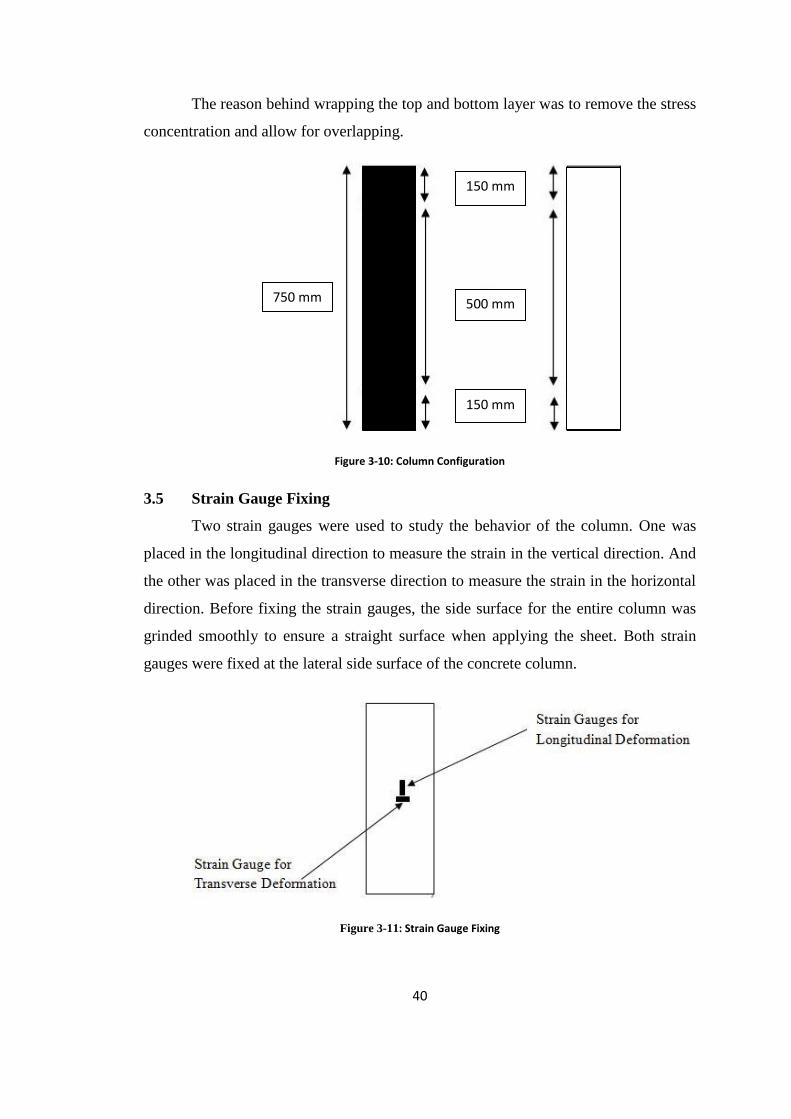
40
The reason behind wrapping the top and bottom layer was to remove the stress
concentration and allow for overlapping.
Figure 3-10: Column Configuration
3.5 Strain Gauge Fixing
Two strain gauges were used to study the behavior of the column. One was
placed in the longitudinal direction to measure the strain in the vertical direction. And
the other was placed in the transverse direction to measure the strain in the horizontal
direction. Before fixing the strain gauges, the side surface for the entire column was
grinded smoothly to ensure a straight surface when applying the sheet. Both strain
gauges were fixed at the lateral side surface of the concrete column.
Figure 3-11: Strain Gauge Fixing
150 mm
500 mm
150 mm
750 mm
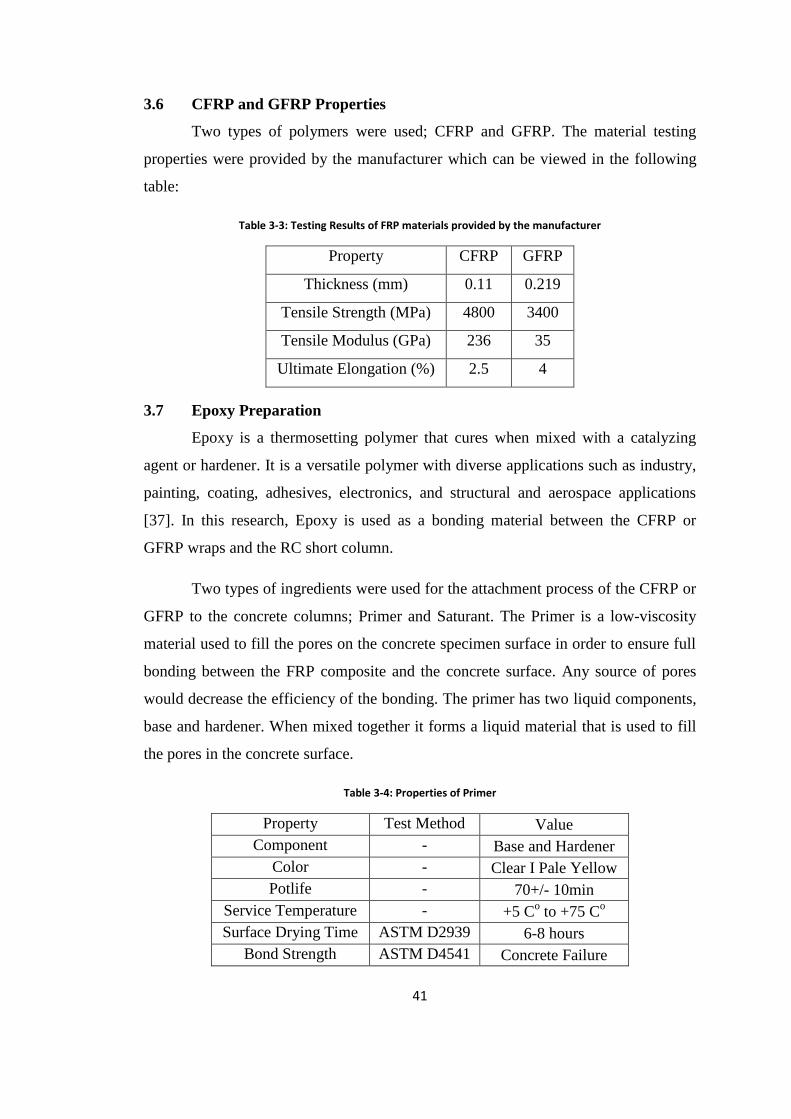
41
3.6 CFRP and GFRP Properties
Two types of polymers were used; CFRP and GFRP. The material testing
properties were provided by the manufacturer which can be viewed in the following
table:
Table 3-3: Testing Results of FRP materials provided by the manufacturer
Property CFRP GFRP
Thickness (mm) 0.11 0.219
Tensile Strength (MPa) 4800 3400
Tensile Modulus (GPa) 236 35
Ultimate Elongation (%) 2.5 4
3.7 Epoxy Preparation
Epoxy is a thermosetting polymer that cures when mixed with a catalyzing
agent or hardener. It is a versatile polymer with diverse applications such as industry,
painting, coating, adhesives, electronics, and structural and aerospace applications
[37]. In this research, Epoxy is used as a bonding material between the CFRP or
GFRP wraps and the RC short column.
Two types of ingredients were used for the attachment process of the CFRP or
GFRP to the concrete columns; Primer and Saturant. The Primer is a low-viscosity
material used to fill the pores on the concrete specimen surface in order to ensure full
bonding between the FRP composite and the concrete surface. Any source of pores
would decrease the efficiency of the bonding. The primer has two liquid components,
base and hardener. When mixed together it forms a liquid material that is used to fill
the pores in the concrete surface.
Table 3-4: Properties of Primer
Property Test Method Value
Component - Base and Hardener
Color - Clear I Pale Yellow
Potlife - 70+/- 10min
Service Temperature - +5 Co to +75 C
o
Surface Drying Time ASTM D2939 6-8 hours
Bond Strength ASTM D4541 Concrete Failure
42
Figure 3-12: Primer Part A
Figure 3-13: Primer Part B
Figure 3-14: Primer Effect [24]
The Saturant is a medium-viscosity material used as a bonding agent between
the concrete surface and FRP material. Upon the application of the primer, the
specimen was left under room temperature for the resin to be dried and cured.
Following this, the saturant was applied on the desired surface with a thickness no
less than 3mm. After the application of saturant, the FRP wraps were applied
immediately before the drying process of the saturant starts. In order to achieve full
bonding between the FRP wraps and the column, it is vital to submerge the FRP in the
epoxy (wet method). Alternatively, an equal amount of success can be found by
attaching the wrap around the column and then applying a second coat of saturant (dry
method).
Table 3-5: Properties of Saturant
Property Test Method Value
Component - Base and Hardener
Color - Grey/White/Light Blue
Potlife - 45-60 min
Service Temperature - +5 Co to +75 C
o
Bond Strength ASTM D4541 > 2 N/mm2
Compressive Strength BS 6319-2 70 N/mm2 at 7 days
43
Figure 3-15: Saturant part A
Figure 3-16: Saturant Part B
3.8 Proposed Matrix
The proposed matrix consists of 30 columns divided into three groups. The
first group has 6 unconfined columns serving as control columns, where 3 were
normal-designed columns and 3 were under-designed columns.
The second group comprises of 12 normal-designed confined columns. 3 of the
12 were normal-design columns wrapped with one layer of CFRP, 3 were normal-
designed columns wrapped with two layers of CFRP, 3 were normal-designed
columns wrapped with one layer of GFRP, and 3 were normal-designed columns
wrapped with two layers of GFRP.
Finally, the last group consists of 12 under-designed confined columns. This
group has 3 under-designed columns wrapped with one layer of CFRP, 3 under-
designed columns wrapped with two layers of CFRP, 3 under-designed columns
wrapped with one layer of GFRP, and 3 under-designed columns wrapped with two
layers of GFRP.
3.9 Columns Designation System
An identification system consists of four characters as “ABCD” was employed
to put a unique name for each confined column. The first character identifies the
design type followed for the column. For example, “N” stands for “normal-design”
which has the minimum number of transverse reinforcements. On the other hand, “U”
stands for “under-design” which has a reduced number of stirrups.
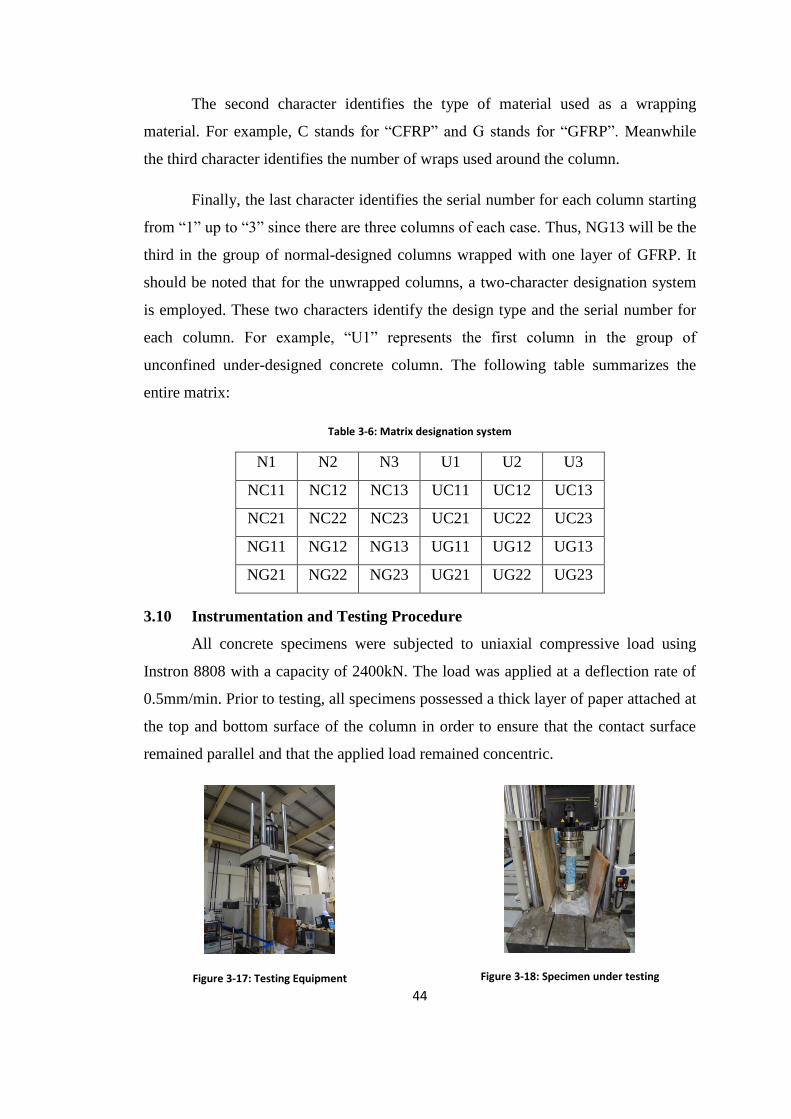
44
The second character identifies the type of material used as a wrapping
material. For example, C stands for “CFRP” and G stands for “GFRP”. Meanwhile
the third character identifies the number of wraps used around the column.
Finally, the last character identifies the serial number for each column starting
from “1” up to “3” since there are three columns of each case. Thus, NG13 will be the
third in the group of normal-designed columns wrapped with one layer of GFRP. It
should be noted that for the unwrapped columns, a two-character designation system
is employed. These two characters identify the design type and the serial number for
each column. For example, “U1” represents the first column in the group of
unconfined under-designed concrete column. The following table summarizes the
entire matrix:
Table 3-6: Matrix designation system
N1 N2 N3 U1 U2 U3
NC11 NC12 NC13 UC11 UC12 UC13
NC21 NC22 NC23 UC21 UC22 UC23
NG11 NG12 NG13 UG11 UG12 UG13
NG21 NG22 NG23 UG21 UG22 UG23
3.10 Instrumentation and Testing Procedure
All concrete specimens were subjected to uniaxial compressive load using
Instron 8808 with a capacity of 2400kN. The load was applied at a deflection rate of
0.5mm/min. Prior to testing, all specimens possessed a thick layer of paper attached at
the top and bottom surface of the column in order to ensure that the contact surface
remained parallel and that the applied load remained concentric.
Figure 3-17: Testing Equipment
Figure 3-18: Specimen under testing
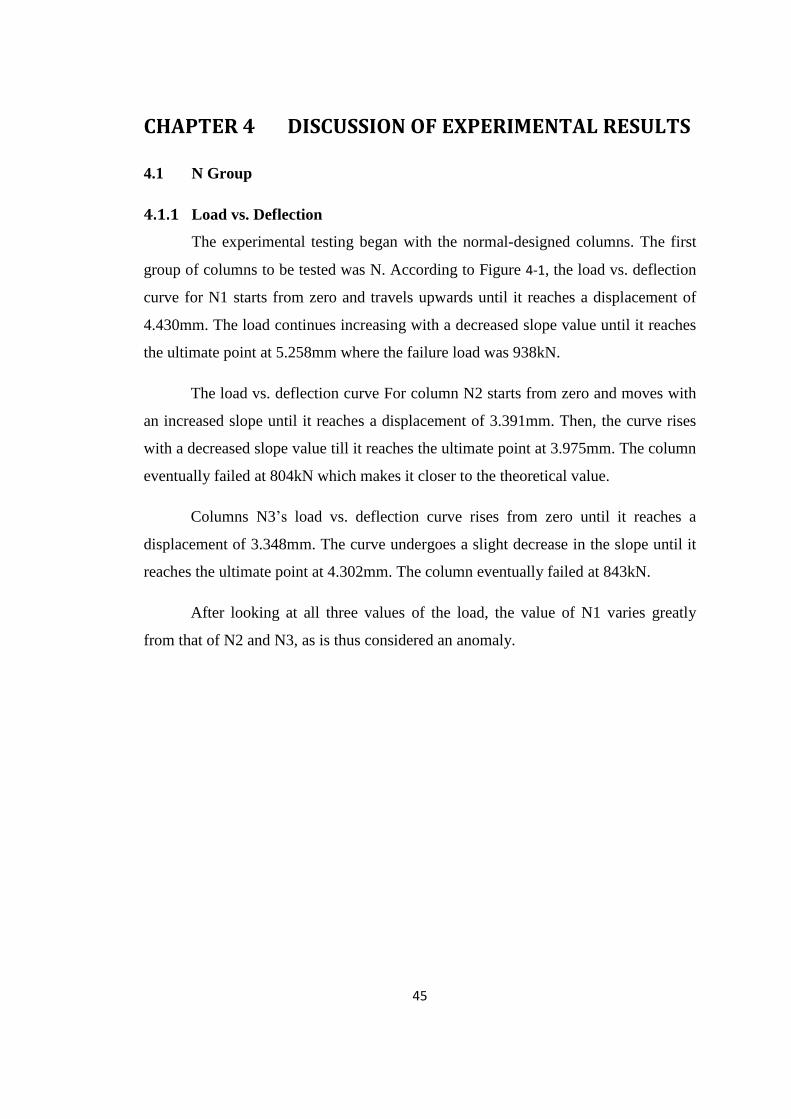
45
CHAPTER 4 DISCUSSION OF EXPERIMENTAL RESULTS
4.1 N Group
4.1.1 Load vs. Deflection
The experimental testing began with the normal-designed columns. The first
group of columns to be tested was N. According to Figure 4-1, the load vs. deflection
curve for N1 starts from zero and travels upwards until it reaches a displacement of
4.430mm. The load continues increasing with a decreased slope value until it reaches
the ultimate point at 5.258mm where the failure load was 938kN.
The load vs. deflection curve For column N2 starts from zero and moves with
an increased slope until it reaches a displacement of 3.391mm. Then, the curve rises
with a decreased slope value till it reaches the ultimate point at 3.975mm. The column
eventually failed at 804kN which makes it closer to the theoretical value.
Columns N3’s load vs. deflection curve rises from zero until it reaches a
displacement of 3.348mm. The curve undergoes a slight decrease in the slope until it
reaches the ultimate point at 4.302mm. The column eventually failed at 843kN.
After looking at all three values of the load, the value of N1 varies greatly
from that of N2 and N3, as is thus considered an anomaly.
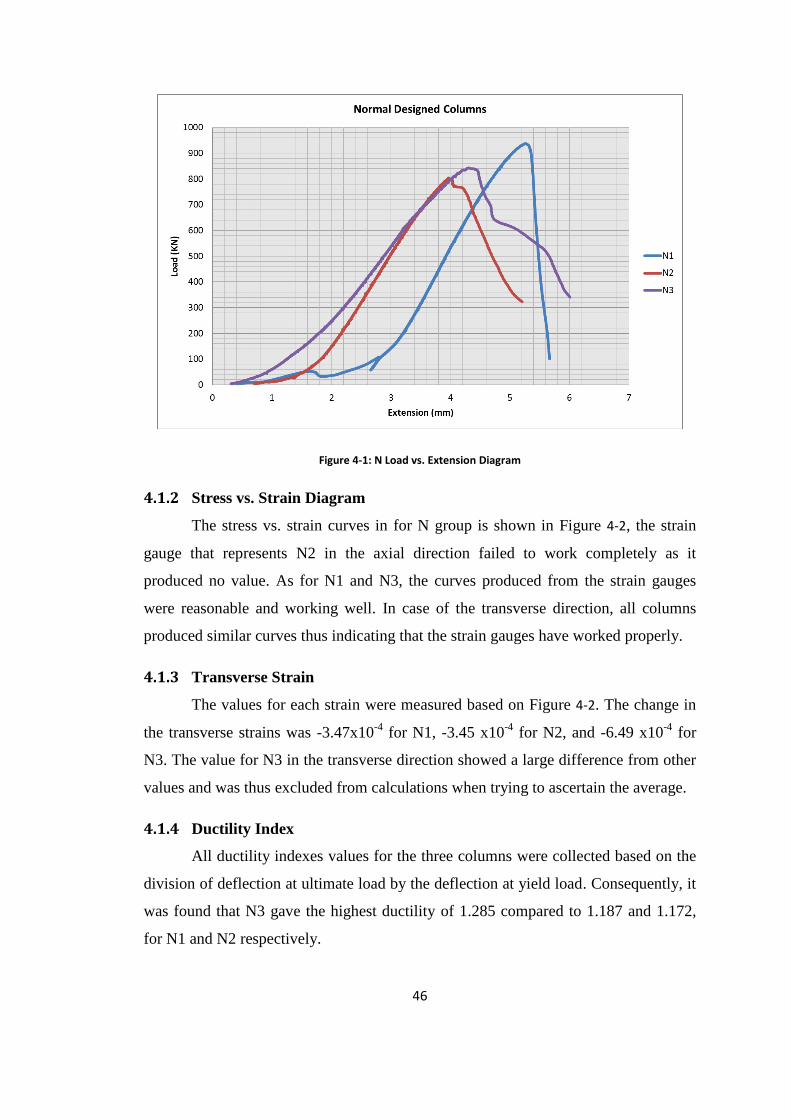
46
Figure 4-1: N Load vs. Extension Diagram
4.1.2 Stress vs. Strain Diagram
The stress vs. strain curves in for N group is shown in Figure 4-2, the strain
gauge that represents N2 in the axial direction failed to work completely as it
produced no value. As for N1 and N3, the curves produced from the strain gauges
were reasonable and working well. In case of the transverse direction, all columns
produced similar curves thus indicating that the strain gauges have worked properly.
4.1.3 Transverse Strain
The values for each strain were measured based on Figure 4-2. The change in
the transverse strains was -3.47x10⁻⁴
for N1, -3.45 x10⁻⁴
for N2, and -6.49 x10⁻⁴
for
N3. The value for N3 in the transverse direction showed a large difference from other
values and was thus excluded from calculations when trying to ascertain the average.
4.1.4 Ductility Index
All ductility indexes values for the three columns were collected based on the
division of deflection at ultimate load by the deflection at yield load. Consequently, it
was found that N3 gave the highest ductility of 1.285 compared to 1.187 and 1.172,
for N1 and N2 respectively.
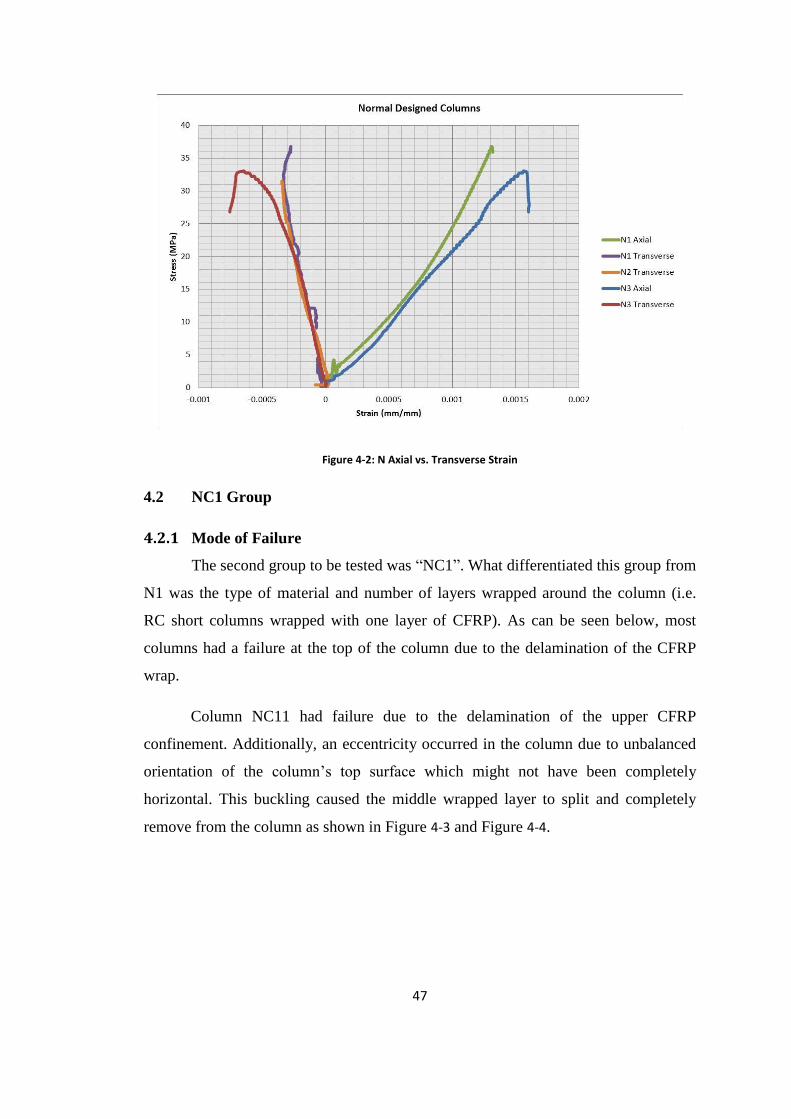
47
Figure 4-2: N Axial vs. Transverse Strain
4.2 NC1 Group
4.2.1 Mode of Failure
The second group to be tested was “NC1”. What differentiated this group from
N1 was the type of material and number of layers wrapped around the column (i.e.
RC short columns wrapped with one layer of CFRP). As can be seen below, most
columns had a failure at the top of the column due to the delamination of the CFRP
wrap.
Column NC11 had failure due to the delamination of the upper CFRP
confinement. Additionally, an eccentricity occurred in the column due to unbalanced
orientation of the column’s top surface which might not have been completely
horizontal. This buckling caused the middle wrapped layer to split and completely
remove from the column as shown in Figure 4-3 and Figure 4-4.
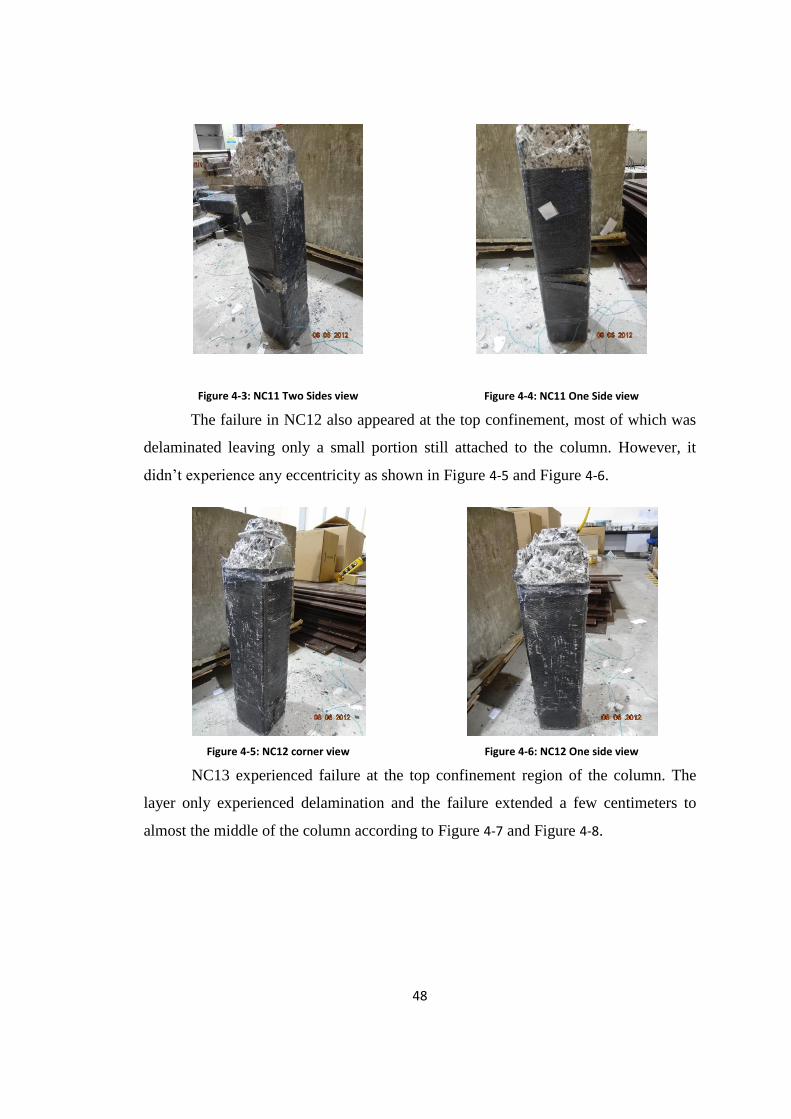
48
Figure 4-3: NC11 Two Sides view
Figure 4-4: NC11 One Side view
The failure in NC12 also appeared at the top confinement, most of which was
delaminated leaving only a small portion still attached to the column. However, it
didn’t experience any eccentricity as shown in Figure 4-5 and Figure 4-6.
Figure 4-5: NC12 corner view
Figure 4-6: NC12 One side view
NC13 experienced failure at the top confinement region of the column. The
layer only experienced delamination and the failure extended a few centimeters to
almost the middle of the column according to Figure 4-7 and Figure 4-8.
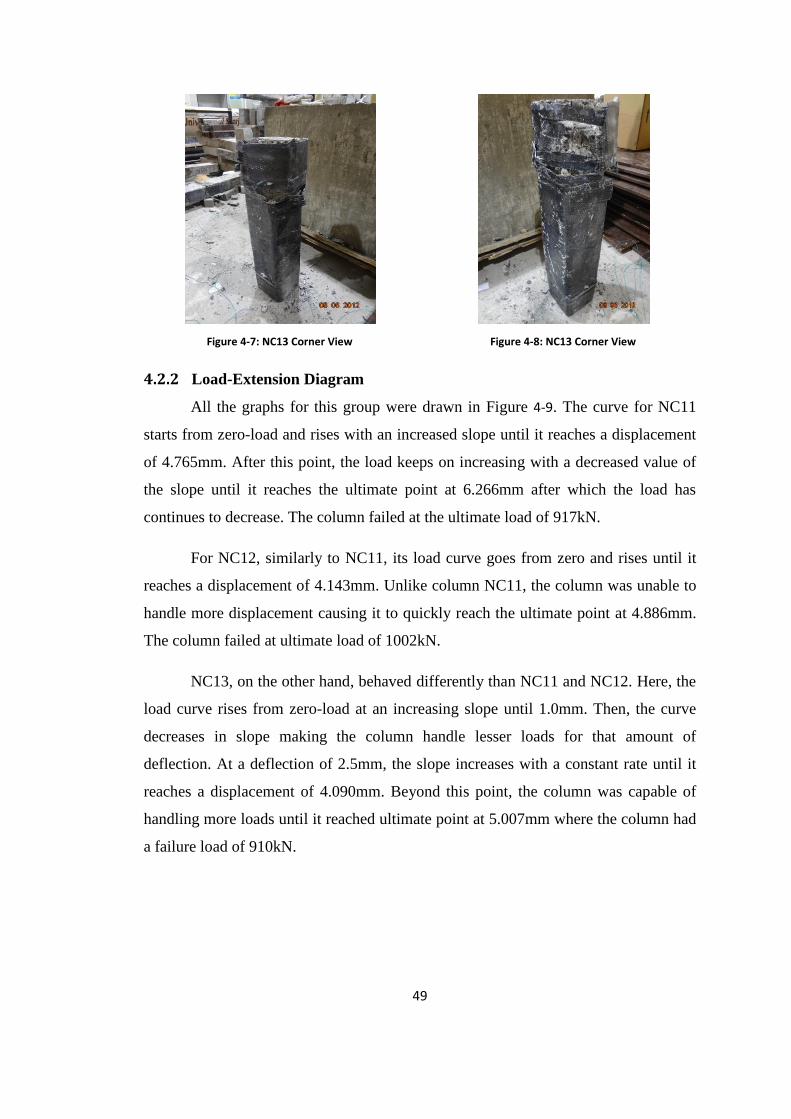
49
Figure 4-7: NC13 Corner View
Figure 4-8: NC13 Corner View
4.2.2 Load-Extension Diagram
All the graphs for this group were drawn in Figure 4-9. The curve for NC11
starts from zero-load and rises with an increased slope until it reaches a displacement
of 4.765mm. After this point, the load keeps on increasing with a decreased value of
the slope until it reaches the ultimate point at 6.266mm after which the load has
continues to decrease. The column failed at the ultimate load of 917kN.
For NC12, similarly to NC11, its load curve goes from zero and rises until it
reaches a displacement of 4.143mm. Unlike column NC11, the column was unable to
handle more displacement causing it to quickly reach the ultimate point at 4.886mm.
The column failed at ultimate load of 1002kN.
NC13, on the other hand, behaved differently than NC11 and NC12. Here, the
load curve rises from zero-load at an increasing slope until 1.0mm. Then, the curve
decreases in slope making the column handle lesser loads for that amount of
deflection. At a deflection of 2.5mm, the slope increases with a constant rate until it
reaches a displacement of 4.090mm. Beyond this point, the column was capable of
handling more loads until it reached ultimate point at 5.007mm where the column had
a failure load of 910kN.
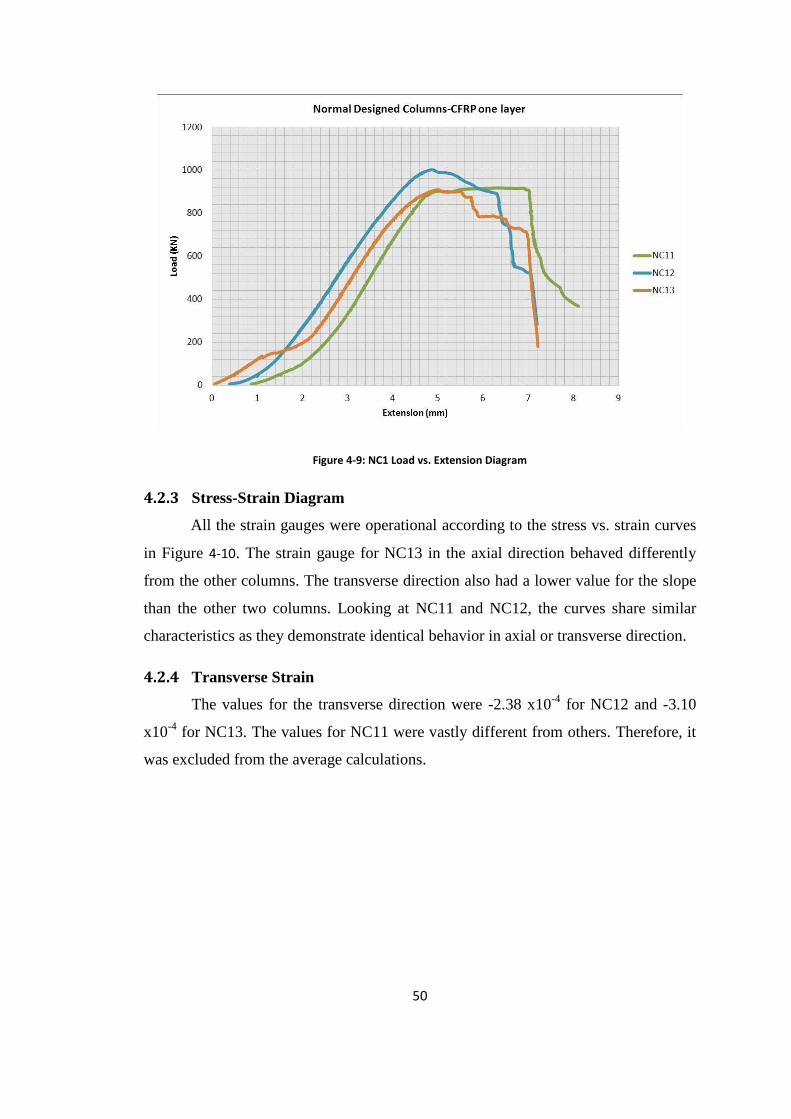
50
Figure 4-9: NC1 Load vs. Extension Diagram
4.2.3 Stress-Strain Diagram
All the strain gauges were operational according to the stress vs. strain curves
in Figure 4-10. The strain gauge for NC13 in the axial direction behaved differently
from the other columns. The transverse direction also had a lower value for the slope
than the other two columns. Looking at NC11 and NC12, the curves share similar
characteristics as they demonstrate identical behavior in axial or transverse direction.
4.2.4 Transverse Strain
The values for the transverse direction were -2.38 x10⁻⁴
for NC12 and -3.10
x10-4
for NC13. The values for NC11 were vastly different from others. Therefore, it
was excluded from the average calculations.
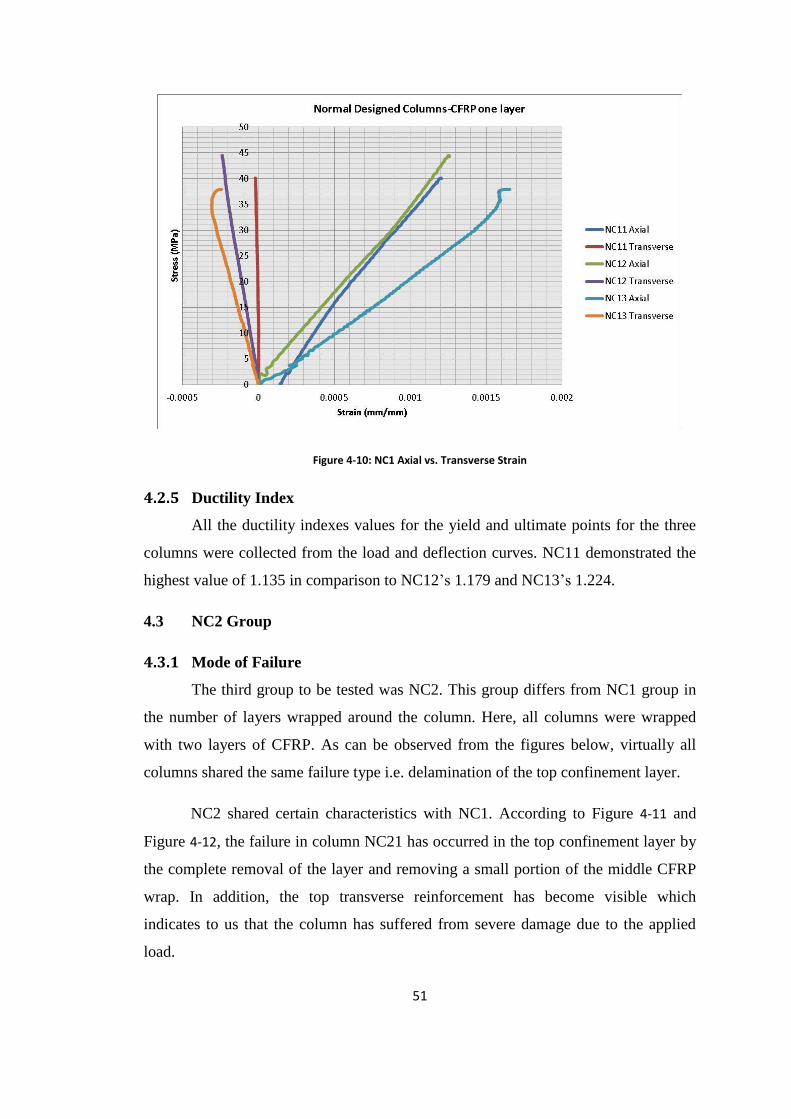
51
Figure 4-10: NC1 Axial vs. Transverse Strain
4.2.5 Ductility Index
All the ductility indexes values for the yield and ultimate points for the three
columns were collected from the load and deflection curves. NC11 demonstrated the
highest value of 1.135 in comparison to NC12’s 1.179 and NC13’s 1.224.
4.3 NC2 Group
4.3.1 Mode of Failure
The third group to be tested was NC2. This group differs from NC1 group in
the number of layers wrapped around the column. Here, all columns were wrapped
with two layers of CFRP. As can be observed from the figures below, virtually all
columns shared the same failure type i.e. delamination of the top confinement layer.
NC2 shared certain characteristics with NC1. According to Figure 4-11 and
Figure 4-12, the failure in column NC21 has occurred in the top confinement layer by
the complete removal of the layer and removing a small portion of the middle CFRP
wrap. In addition, the top transverse reinforcement has become visible which
indicates to us that the column has suffered from severe damage due to the applied
load.
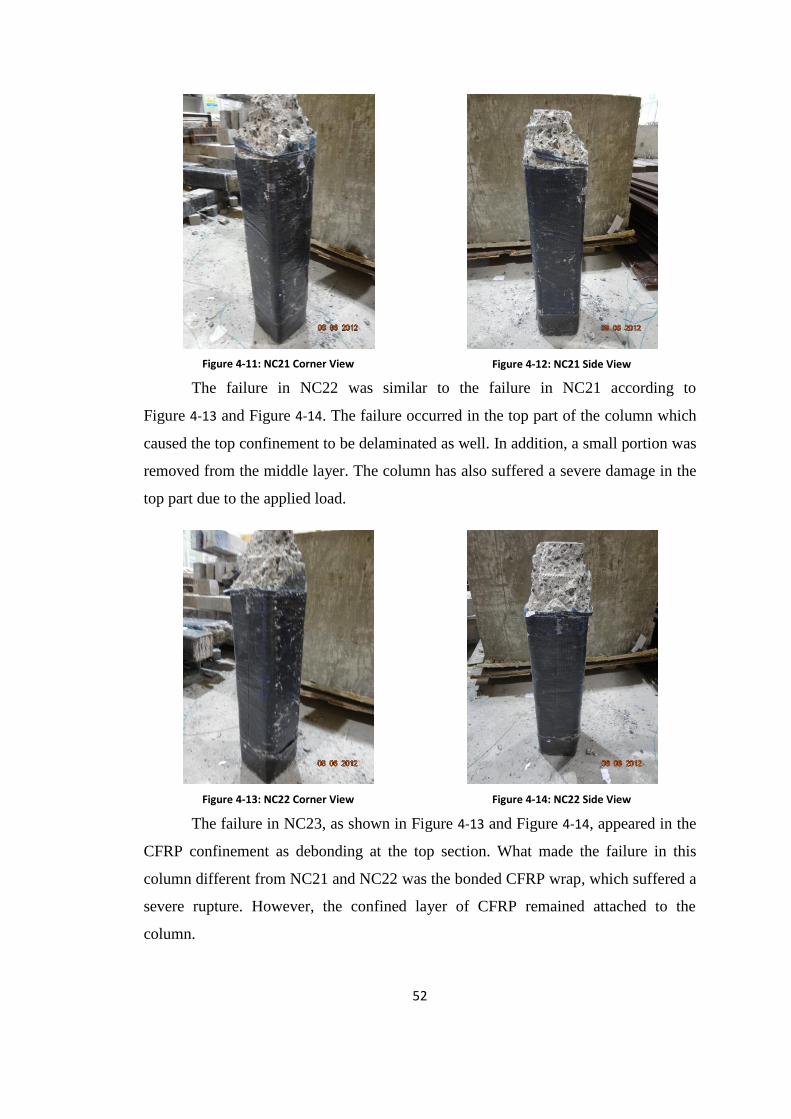
52
Figure 4-11: NC21 Corner View
Figure 4-12: NC21 Side View
The failure in NC22 was similar to the failure in NC21 according to
Figure 4-13 and Figure 4-14. The failure occurred in the top part of the column which
caused the top confinement to be delaminated as well. In addition, a small portion was
removed from the middle layer. The column has also suffered a severe damage in the
top part due to the applied load.
Figure 4-13: NC22 Corner View
Figure 4-14: NC22 Side View
The failure in NC23, as shown in Figure 4-13 and Figure 4-14, appeared in the
CFRP confinement as debonding at the top section. What made the failure in this
column different from NC21 and NC22 was the bonded CFRP wrap, which suffered a
severe rupture. However, the confined layer of CFRP remained attached to the
column.
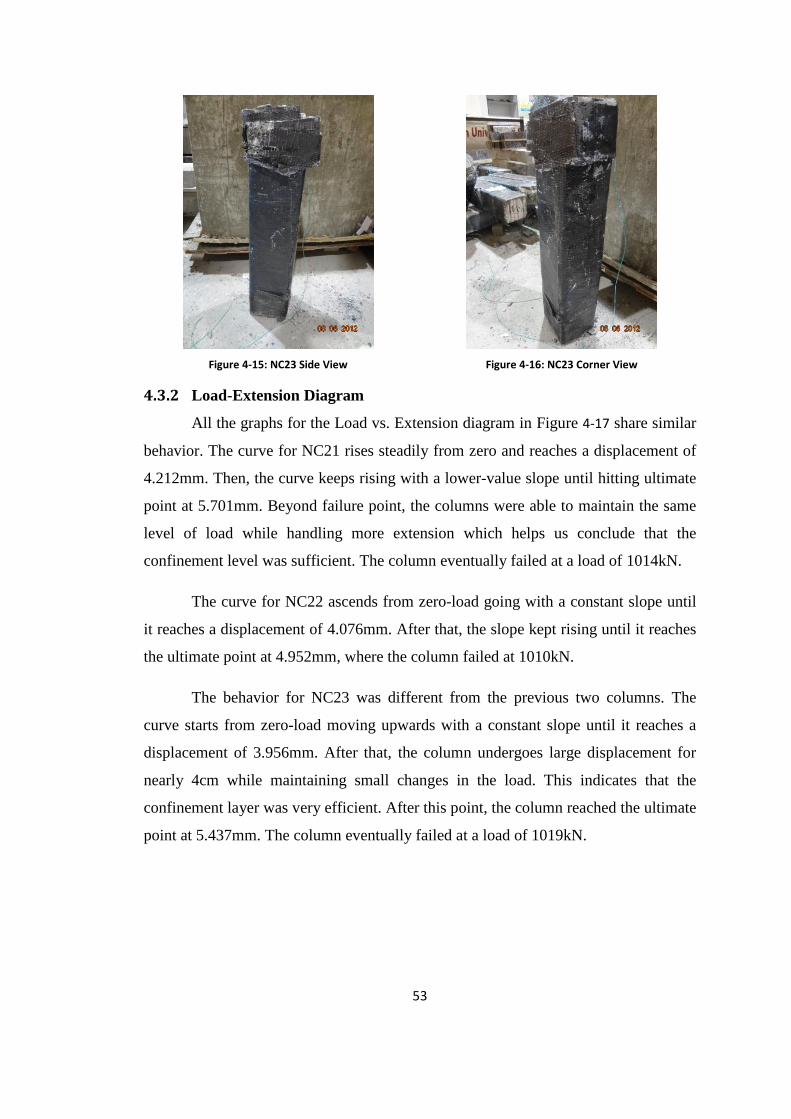
53
Figure 4-15: NC23 Side View
Figure 4-16: NC23 Corner View
4.3.2 Load-Extension Diagram
All the graphs for the Load vs. Extension diagram in Figure 4-17 share similar
behavior. The curve for NC21 rises steadily from zero and reaches a displacement of
4.212mm. Then, the curve keeps rising with a lower-value slope until hitting ultimate
point at 5.701mm. Beyond failure point, the columns were able to maintain the same
level of load while handling more extension which helps us conclude that the
confinement level was sufficient. The column eventually failed at a load of 1014kN.
The curve for NC22 ascends from zero-load going with a constant slope until
it reaches a displacement of 4.076mm. After that, the slope kept rising until it reaches
the ultimate point at 4.952mm, where the column failed at 1010kN.
The behavior for NC23 was different from the previous two columns. The
curve starts from zero-load moving upwards with a constant slope until it reaches a
displacement of 3.956mm. After that, the column undergoes large displacement for
nearly 4cm while maintaining small changes in the load. This indicates that the
confinement layer was very efficient. After this point, the column reached the ultimate
point at 5.437mm. The column eventually failed at a load of 1019kN.
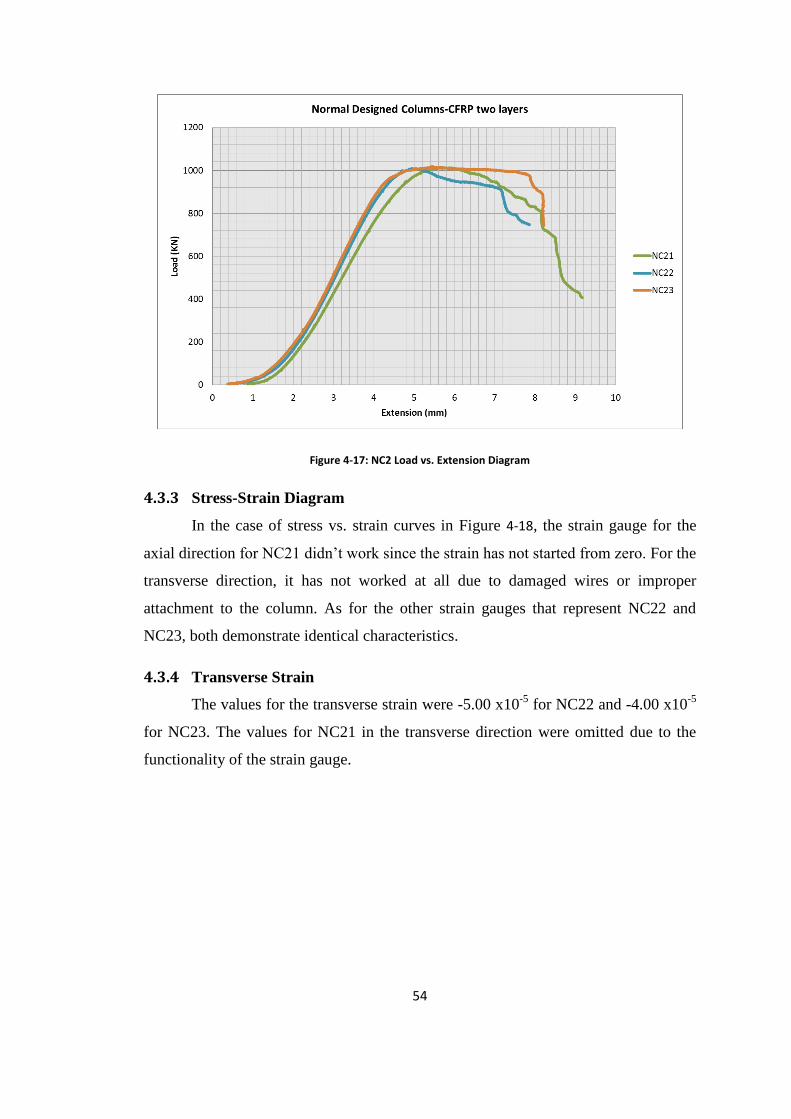
54
Figure 4-17: NC2 Load vs. Extension Diagram
4.3.3 Stress-Strain Diagram
In the case of stress vs. strain curves in Figure 4-18, the strain gauge for the
axial direction for NC21 didn’t work since the strain has not started from zero. For the
transverse direction, it has not worked at all due to damaged wires or improper
attachment to the column. As for the other strain gauges that represent NC22 and
NC23, both demonstrate identical characteristics.
4.3.4 Transverse Strain
The values for the transverse strain were -5.00 x10⁻⁵
for NC22 and -4.00 x10⁻⁵
for NC23. The values for NC21 in the transverse direction were omitted due to the
functionality of the strain gauge.
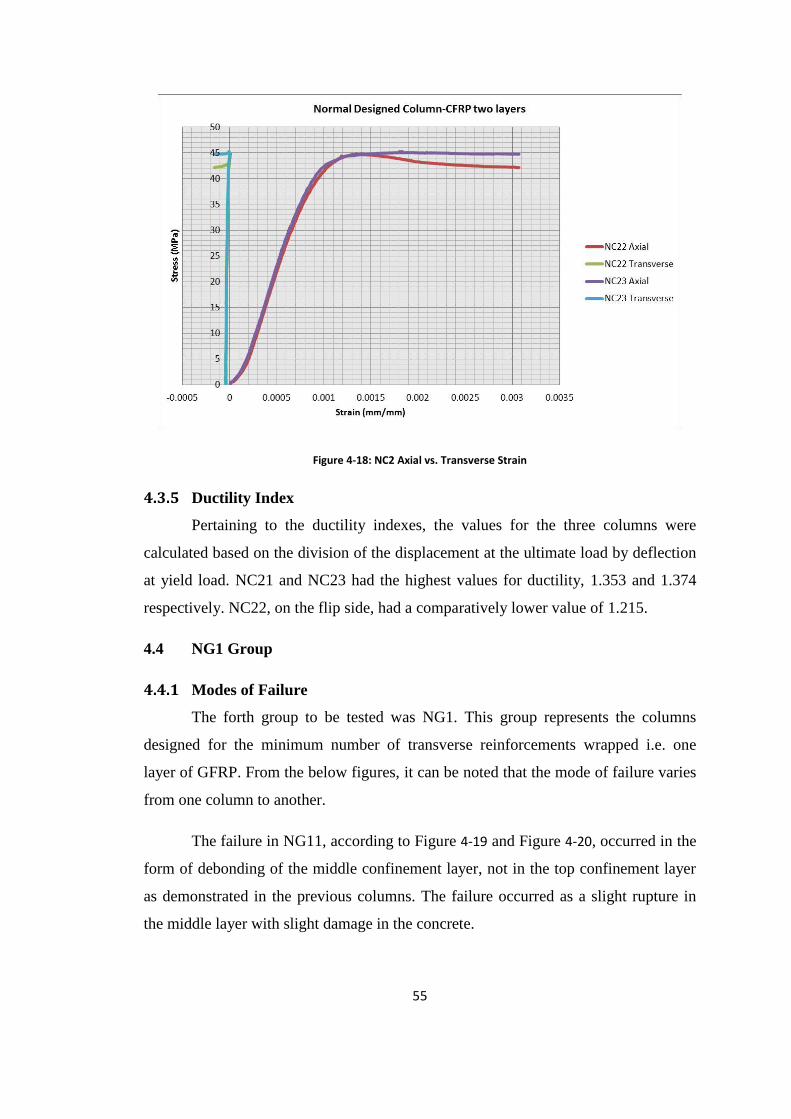
55
Figure 4-18: NC2 Axial vs. Transverse Strain
4.3.5 Ductility Index
Pertaining to the ductility indexes, the values for the three columns were
calculated based on the division of the displacement at the ultimate load by deflection
at yield load. NC21 and NC23 had the highest values for ductility, 1.353 and 1.374
respectively. NC22, on the flip side, had a comparatively lower value of 1.215.
4.4 NG1 Group
4.4.1 Modes of Failure
The forth group to be tested was NG1. This group represents the columns
designed for the minimum number of transverse reinforcements wrapped i.e. one
layer of GFRP. From the below figures, it can be noted that the mode of failure varies
from one column to another.
The failure in NG11, according to Figure 4-19 and Figure 4-20, occurred in the
form of debonding of the middle confinement layer, not in the top confinement layer
as demonstrated in the previous columns. The failure occurred as a slight rupture in
the middle layer with slight damage in the concrete.
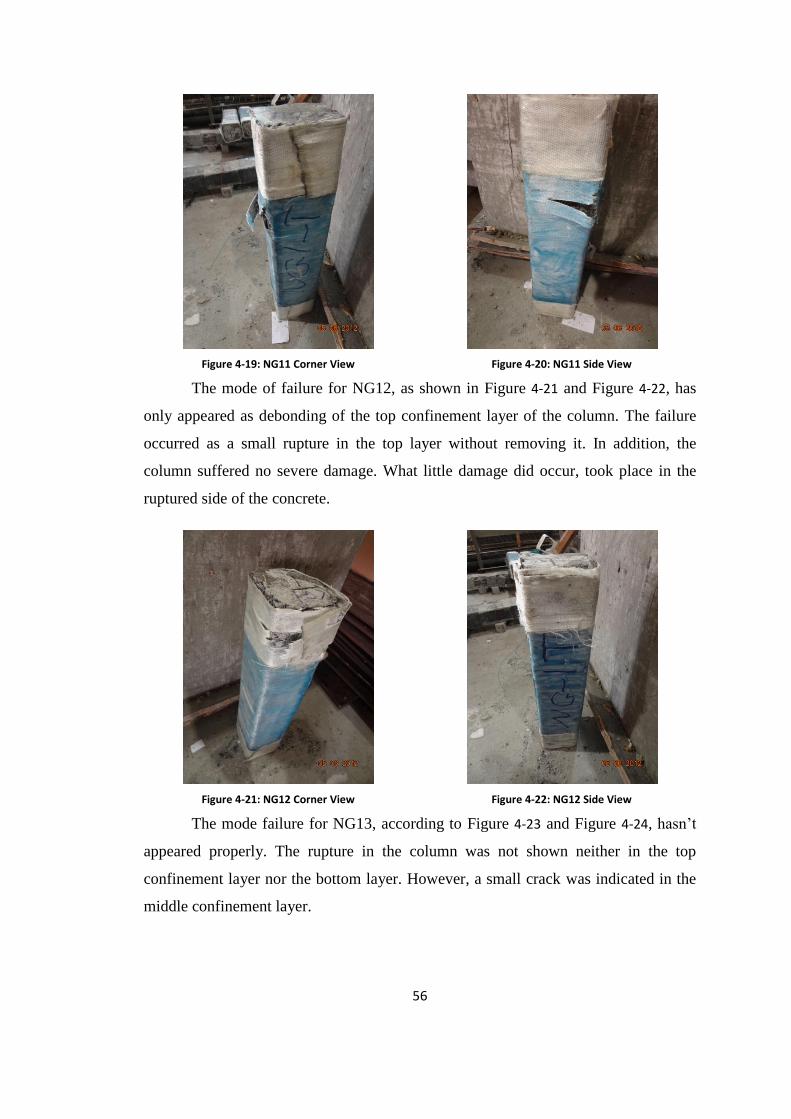
56
Figure 4-19: NG11 Corner View
Figure 4-20: NG11 Side View
The mode of failure for NG12, as shown in Figure 4-21 and Figure 4-22, has
only appeared as debonding of the top confinement layer of the column. The failure
occurred as a small rupture in the top layer without removing it. In addition, the
column suffered no severe damage. What little damage did occur, took place in the
ruptured side of the concrete.
Figure 4-21: NG12 Corner View
Figure 4-22: NG12 Side View
The mode failure for NG13, according to Figure 4-23 and Figure 4-24, hasn’t
appeared properly. The rupture in the column was not shown neither in the top
confinement layer nor the bottom layer. However, a small crack was indicated in the
middle confinement layer.
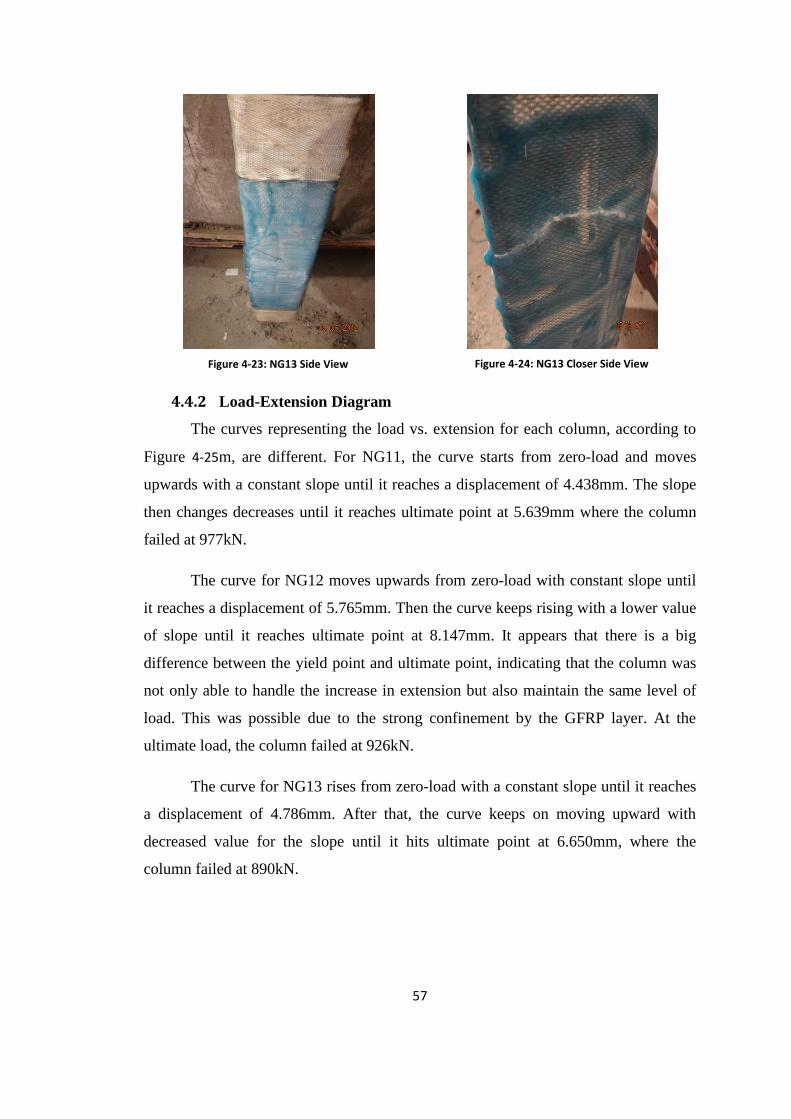
57
Figure 4-23: NG13 Side View
Figure 4-24: NG13 Closer Side View
4.4.2 Load-Extension Diagram
The curves representing the load vs. extension for each column, according to
Figure 4-25m, are different. For NG11, the curve starts from zero-load and moves
upwards with a constant slope until it reaches a displacement of 4.438mm. The slope
then changes decreases until it reaches ultimate point at 5.639mm where the column
failed at 977kN.
The curve for NG12 moves upwards from zero-load with constant slope until
it reaches a displacement of 5.765mm. Then the curve keeps rising with a lower value
of slope until it reaches ultimate point at 8.147mm. It appears that there is a big
difference between the yield point and ultimate point, indicating that the column was
not only able to handle the increase in extension but also maintain the same level of
load. This was possible due to the strong confinement by the GFRP layer. At the
ultimate load, the column failed at 926kN.
The curve for NG13 rises from zero-load with a constant slope until it reaches
a displacement of 4.786mm. After that, the curve keeps on moving upward with
decreased value for the slope until it hits ultimate point at 6.650mm, where the
column failed at 890kN.
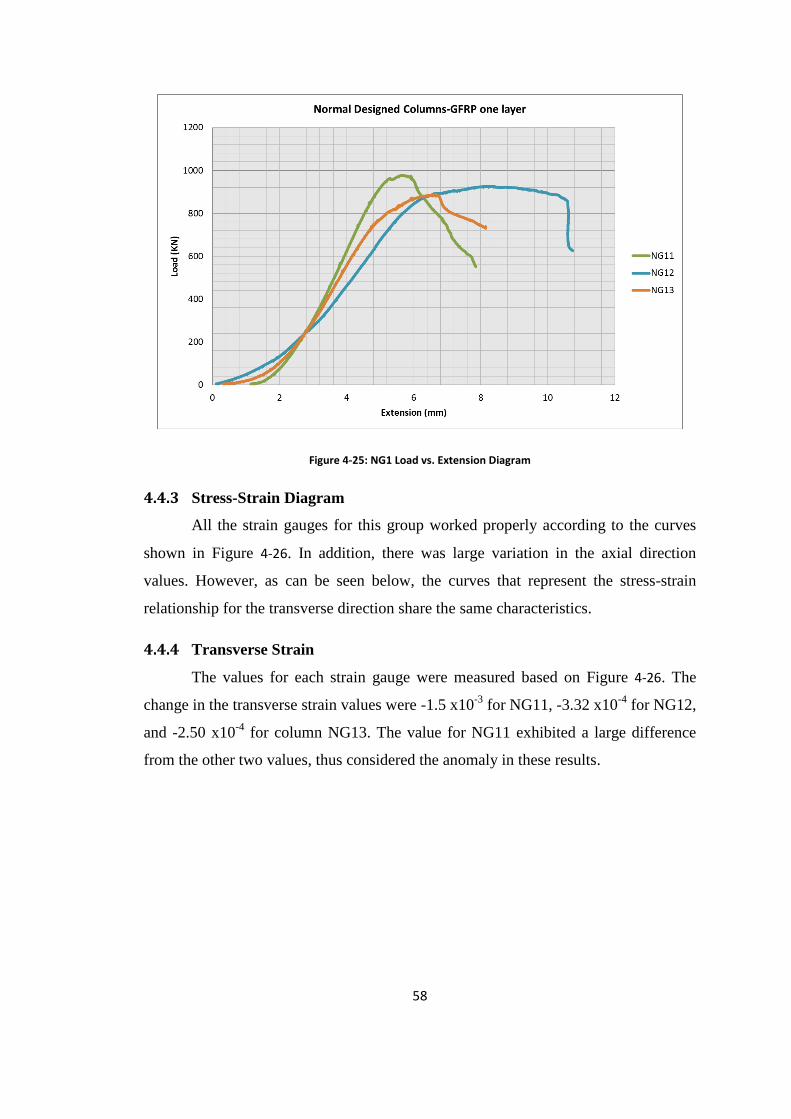
58
Figure 4-25: NG1 Load vs. Extension Diagram
4.4.3 Stress-Strain Diagram
All the strain gauges for this group worked properly according to the curves
shown in Figure 4-26. In addition, there was large variation in the axial direction
values. However, as can be seen below, the curves that represent the stress-strain
relationship for the transverse direction share the same characteristics.
4.4.4 Transverse Strain
The values for each strain gauge were measured based on Figure 4-26. The
change in the transverse strain values were -1.5 x10⁻³
for NG11, -3.32 x10⁻⁴
for NG12,
and -2.50 x10⁻⁴
for column NG13. The value for NG11 exhibited a large difference
from the other two values, thus considered the anomaly in these results.

59
Figure 4-26: NG1 Axial vs. Transverse Strain
4.4.5 Ductility Index
The ductility indexes values for the three columns vary. Column NG12 has
made the highest value for the ductility (1.413) compared to column NG11 (1.271)
and NG13 (1.390).
4.5 NG2 Group
4.5.1 Mode of Failure
The fifth group to be tested was NG2. This group represented columns that
were wrapped with two layers of GFRP. From the below figures, it is clear that the
mode of failure varies from one column to another.
The mode of failure for column NG21, as shown in Figure 4-27 and
Figure 4-28, was demonstrated as debonding of some part of the top confinement
wrap. The remaining portions the top confinement layer remained attached to the
column.
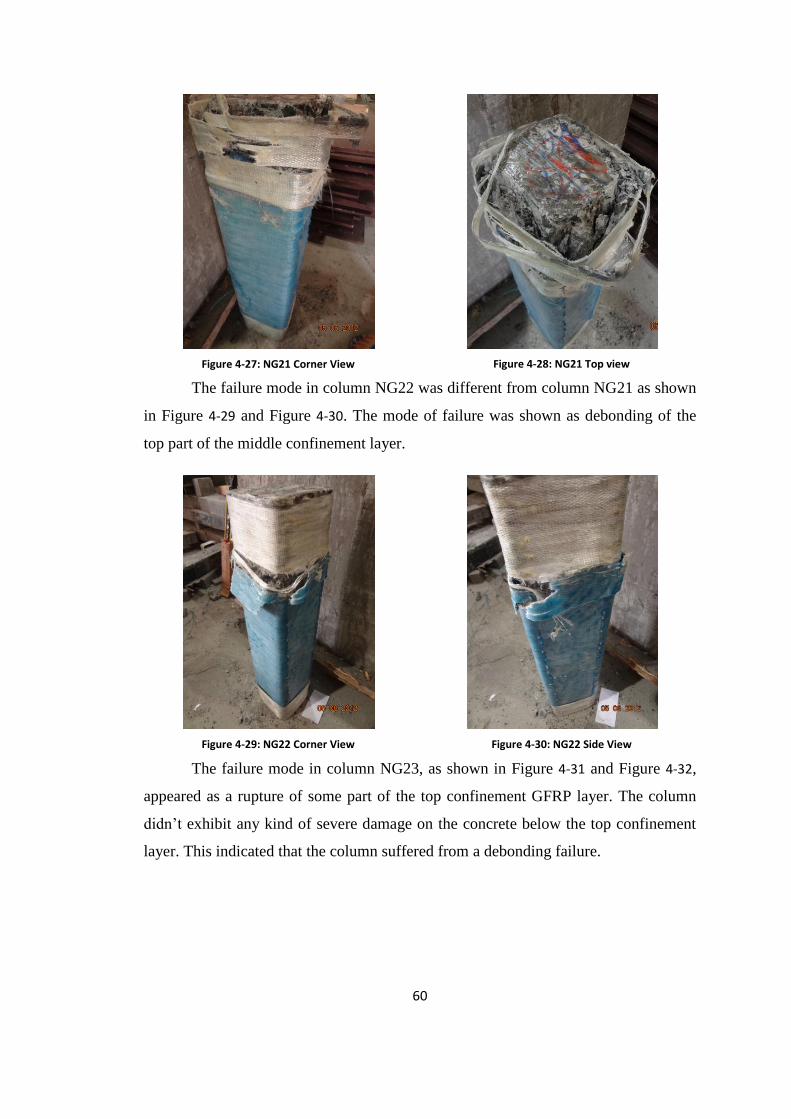
60
Figure 4-27: NG21 Corner View
Figure 4-28: NG21 Top view
The failure mode in column NG22 was different from column NG21 as shown
in Figure 4-29 and Figure 4-30. The mode of failure was shown as debonding of the
top part of the middle confinement layer.
Figure 4-29: NG22 Corner View
Figure 4-30: NG22 Side View
The failure mode in column NG23, as shown in Figure 4-31 and Figure 4-32,
appeared as a rupture of some part of the top confinement GFRP layer. The column
didn’t exhibit any kind of severe damage on the concrete below the top confinement
layer. This indicated that the column suffered from a debonding failure.

61
Figure 4-31: NG23 Side View
Figure 4-32: NG23 Different Side View
4.5.2 Load-Extension Diagram
The load vs. extension curves for the columns in this group, as shown in
Figure 4-33, are almost similar to each other. For column NG21, the curve starts from
zero-load moving upwards with a constant slope until it reaches a displacement of
3.543mm. After that, the curve rises with a lower value for the slope until it arrives at
the ultimate point of 7.178mm. The difference between the yield and ultimate points
is large. This indicates that the column was able to handle large deflection while
maintaining almost the same level of load. The column finally failed at 1044kN.
The curve for NG22 moves upwards from zero with a constant slope, until it
reaches a displacement of 3.139mm. Later on, the curve keeps rising with a lower
value of the slope until it reaches ultimate point at 7.489mm. Column NG22 achieved
the maximum load compared to all other columns in the matrix. This column failed at
1141kN.
The curve for NG23 starts from zero-load and moved upwards with a constant
slope until it reaches a displacement of 4.040mm. After that, the curve goes on rising
before hitting ultimate point at 4.656mm. Here, the difference between the yield and
ultimate point is smaller than column NG23. However, the column maintained an
identical load after passing the ultimate point which can give us an indication of
strong confinement. This column eventually failed at 1035kN.
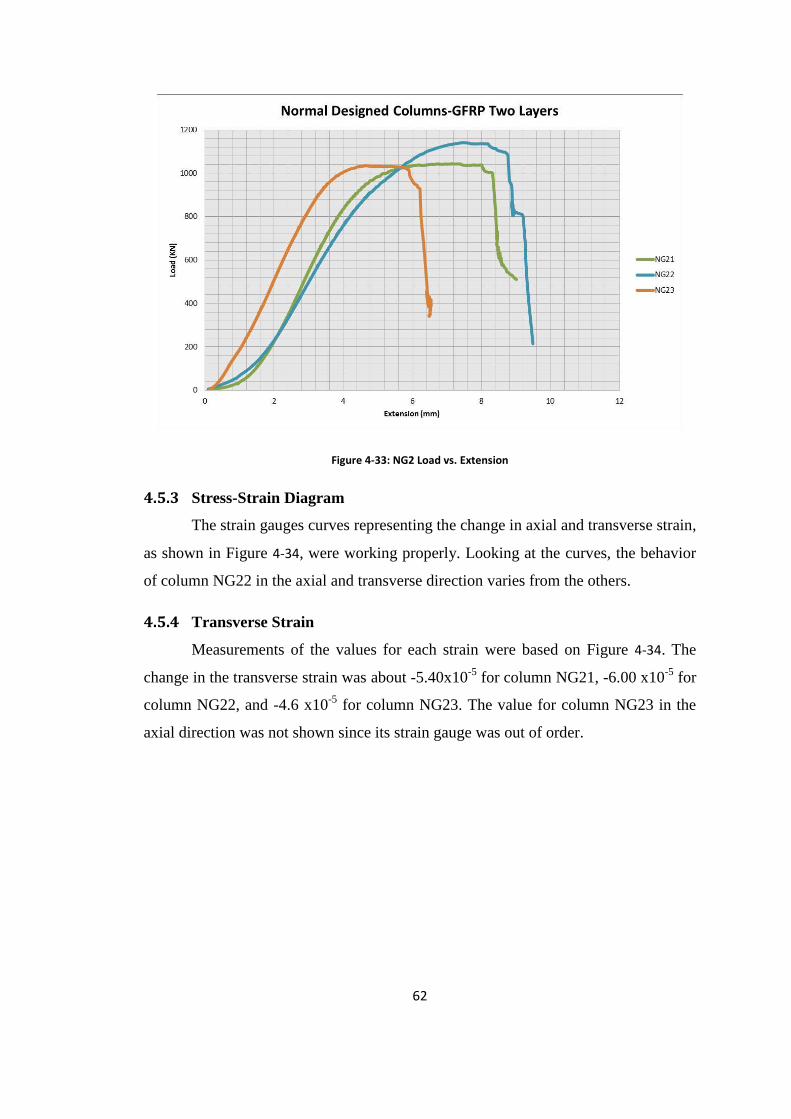
62
Figure 4-33: NG2 Load vs. Extension
4.5.3 Stress-Strain Diagram
The strain gauges curves representing the change in axial and transverse strain,
as shown in Figure 4-34, were working properly. Looking at the curves, the behavior
of column NG22 in the axial and transverse direction varies from the others.
4.5.4 Transverse Strain
Measurements of the values for each strain were based on Figure 4-34. The
change in the transverse strain was about -5.40x10⁻⁵
for column NG21, -6.00 x10⁻⁵
for
column NG22, and -4.6 x10⁻⁵
for column NG23. The value for column NG23 in the
axial direction was not shown since its strain gauge was out of order.
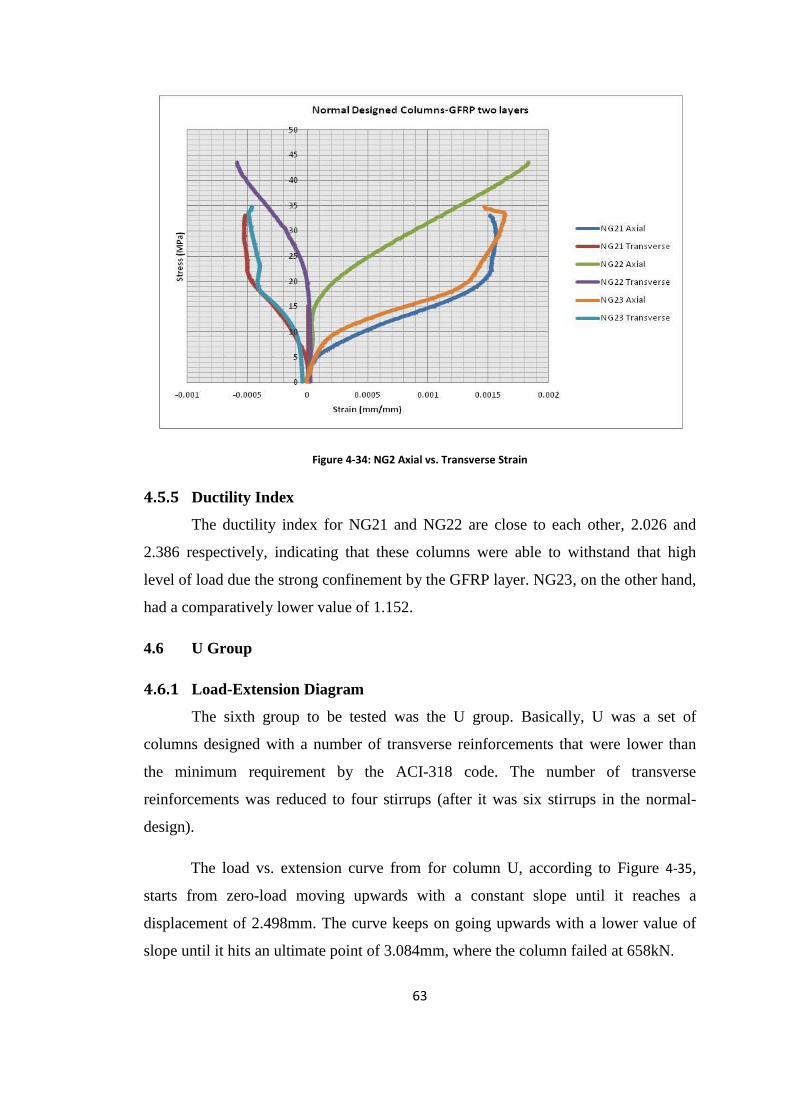
63
Figure 4-34: NG2 Axial vs. Transverse Strain
4.5.5 Ductility Index
The ductility index for NG21 and NG22 are close to each other, 2.026 and
2.386 respectively, indicating that these columns were able to withstand that high
level of load due the strong confinement by the GFRP layer. NG23, on the other hand,
had a comparatively lower value of 1.152.
4.6 U Group
4.6.1 Load-Extension Diagram
The sixth group to be tested was the U group. Basically, U was a set of
columns designed with a number of transverse reinforcements that were lower than
the minimum requirement by the ACI-318 code. The number of transverse
reinforcements was reduced to four stirrups (after it was six stirrups in the normal-
design).
The load vs. extension curve from for column U, according to Figure 4-35,
starts from zero-load moving upwards with a constant slope until it reaches a
displacement of 2.498mm. The curve keeps on going upwards with a lower value of
slope until it hits an ultimate point of 3.084mm, where the column failed at 658kN.
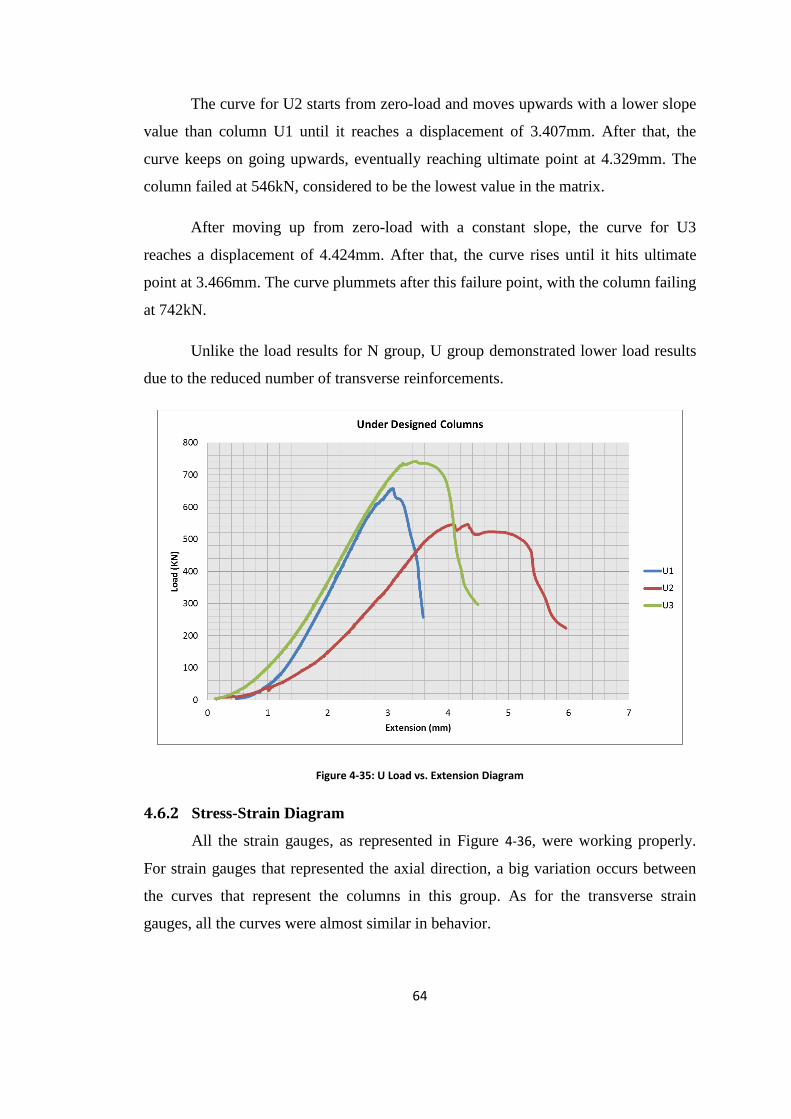
64
The curve for U2 starts from zero-load and moves upwards with a lower slope
value than column U1 until it reaches a displacement of 3.407mm. After that, the
curve keeps on going upwards, eventually reaching ultimate point at 4.329mm. The
column failed at 546kN, considered to be the lowest value in the matrix.
After moving up from zero-load with a constant slope, the curve for U3
reaches a displacement of 4.424mm. After that, the curve rises until it hits ultimate
point at 3.466mm. The curve plummets after this failure point, with the column failing
at 742kN.
Unlike the load results for N group, U group demonstrated lower load results
due to the reduced number of transverse reinforcements.
Figure 4-35: U Load vs. Extension Diagram
4.6.2 Stress-Strain Diagram
All the strain gauges, as represented in Figure 4-36, were working properly.
For strain gauges that represented the axial direction, a big variation occurs between
the curves that represent the columns in this group. As for the transverse strain
gauges, all the curves were almost similar in behavior.
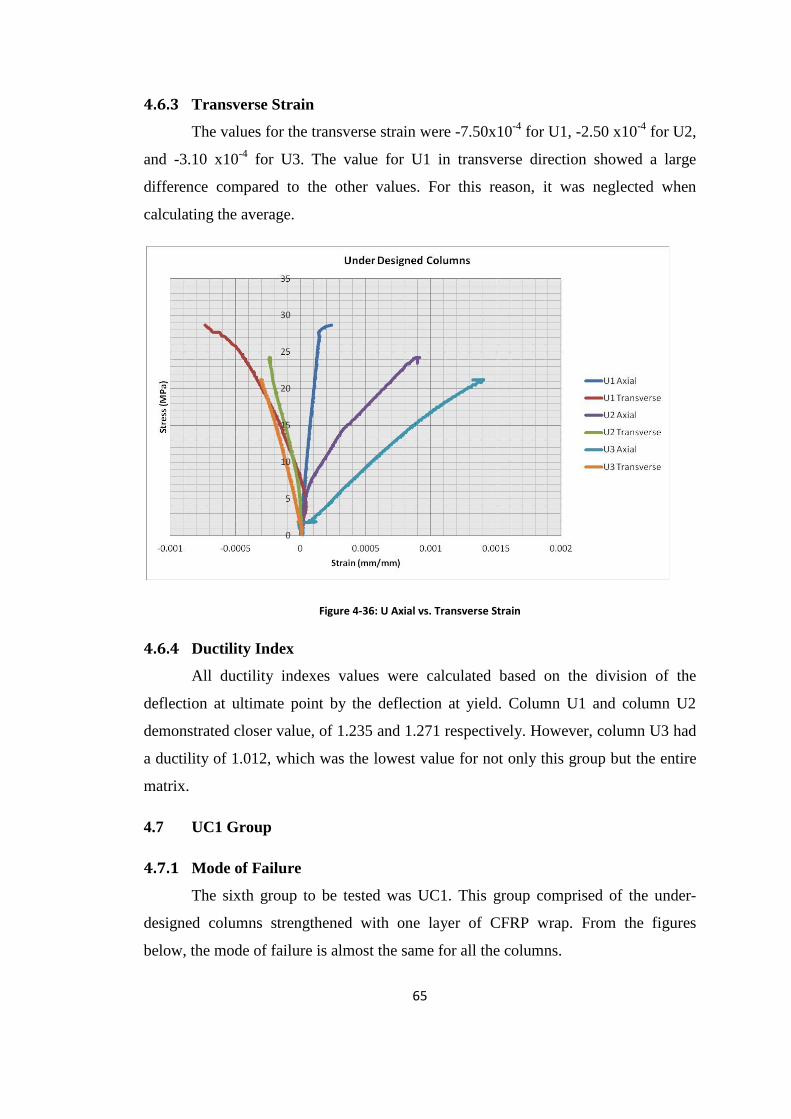
65
4.6.3 Transverse Strain
The values for the transverse strain were -7.50x10⁻⁴
for U1, -2.50 x10⁻⁴
for U2,
and -3.10 x10⁻⁴
for U3. The value for U1 in transverse direction showed a large
difference compared to the other values. For this reason, it was neglected when
calculating the average.
Figure 4-36: U Axial vs. Transverse Strain
4.6.4 Ductility Index
All ductility indexes values were calculated based on the division of the
deflection at ultimate point by the deflection at yield. Column U1 and column U2
demonstrated closer value, of 1.235 and 1.271 respectively. However, column U3 had
a ductility of 1.012, which was the lowest value for not only this group but the entire
matrix.
4.7 UC1 Group
4.7.1 Mode of Failure
The sixth group to be tested was UC1. This group comprised of the under-
designed columns strengthened with one layer of CFRP wrap. From the figures
below, the mode of failure is almost the same for all the columns.
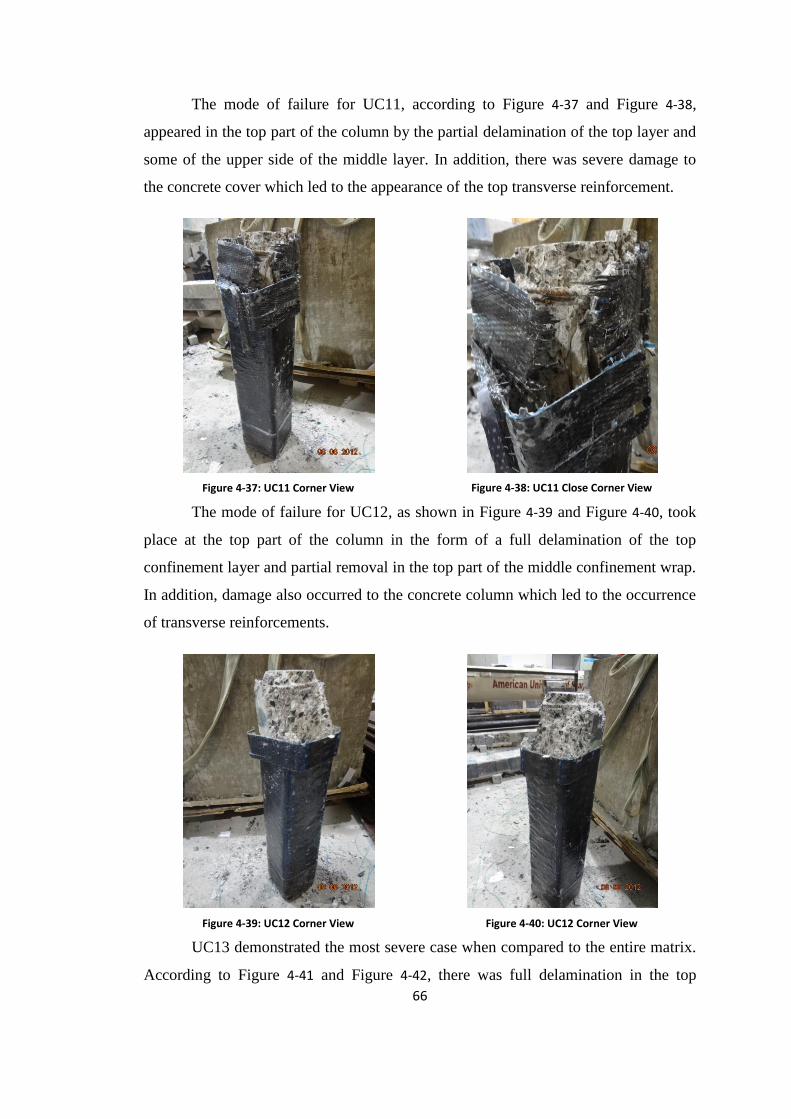
66
The mode of failure for UC11, according to Figure 4-37 and Figure 4-38,
appeared in the top part of the column by the partial delamination of the top layer and
some of the upper side of the middle layer. In addition, there was severe damage to
the concrete cover which led to the appearance of the top transverse reinforcement.
Figure 4-37: UC11 Corner View
Figure 4-38: UC11 Close Corner View
The mode of failure for UC12, as shown in Figure 4-39 and Figure 4-40, took
place at the top part of the column in the form of a full delamination of the top
confinement layer and partial removal in the top part of the middle confinement wrap.
In addition, damage also occurred to the concrete column which led to the occurrence
of transverse reinforcements.
Figure 4-39: UC12 Corner View
Figure 4-40: UC12 Corner View
UC13 demonstrated the most severe case when compared to the entire matrix.
According to Figure 4-41 and Figure 4-42, there was full delamination in the top
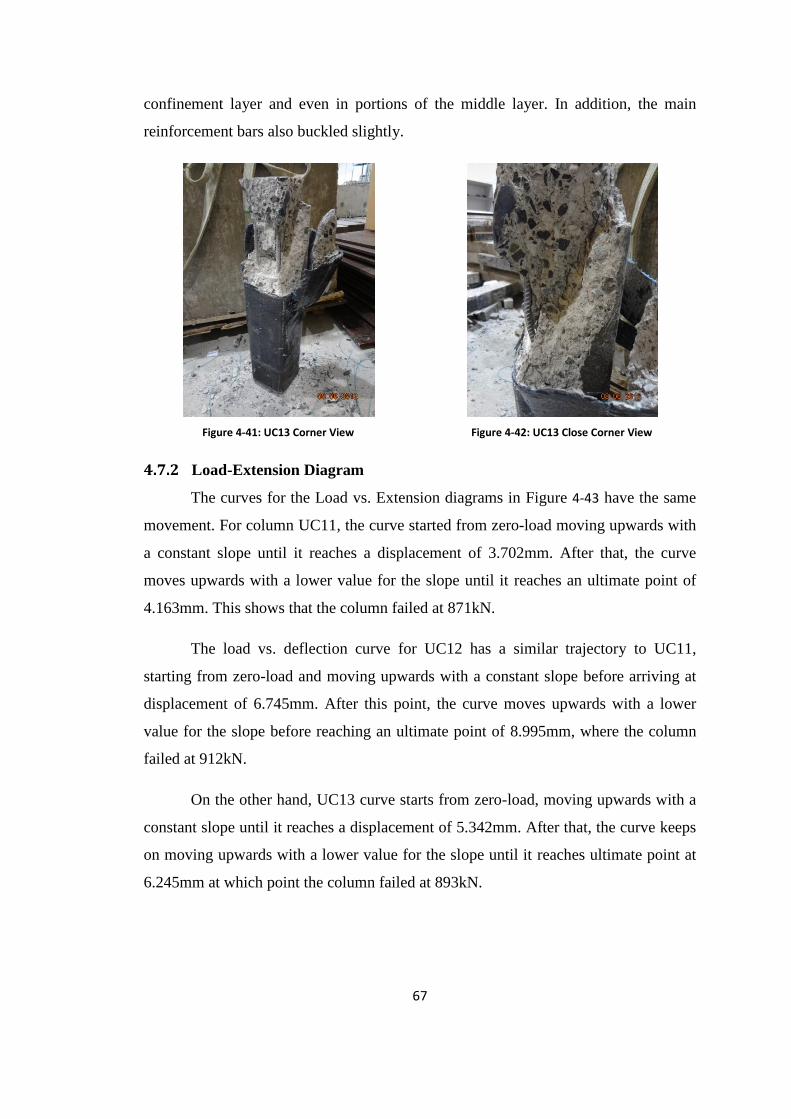
67
confinement layer and even in portions of the middle layer. In addition, the main
reinforcement bars also buckled slightly.
Figure 4-41: UC13 Corner View
Figure 4-42: UC13 Close Corner View
4.7.2 Load-Extension Diagram
The curves for the Load vs. Extension diagrams in Figure 4-43 have the same
movement. For column UC11, the curve started from zero-load moving upwards with
a constant slope until it reaches a displacement of 3.702mm. After that, the curve
moves upwards with a lower value for the slope until it reaches an ultimate point of
4.163mm. This shows that the column failed at 871kN.
The load vs. deflection curve for UC12 has a similar trajectory to UC11,
starting from zero-load and moving upwards with a constant slope before arriving at
displacement of 6.745mm. After this point, the curve moves upwards with a lower
value for the slope before reaching an ultimate point of 8.995mm, where the column
failed at 912kN.
On the other hand, UC13 curve starts from zero-load, moving upwards with a
constant slope until it reaches a displacement of 5.342mm. After that, the curve keeps
on moving upwards with a lower value for the slope until it reaches ultimate point at
6.245mm at which point the column failed at 893kN.
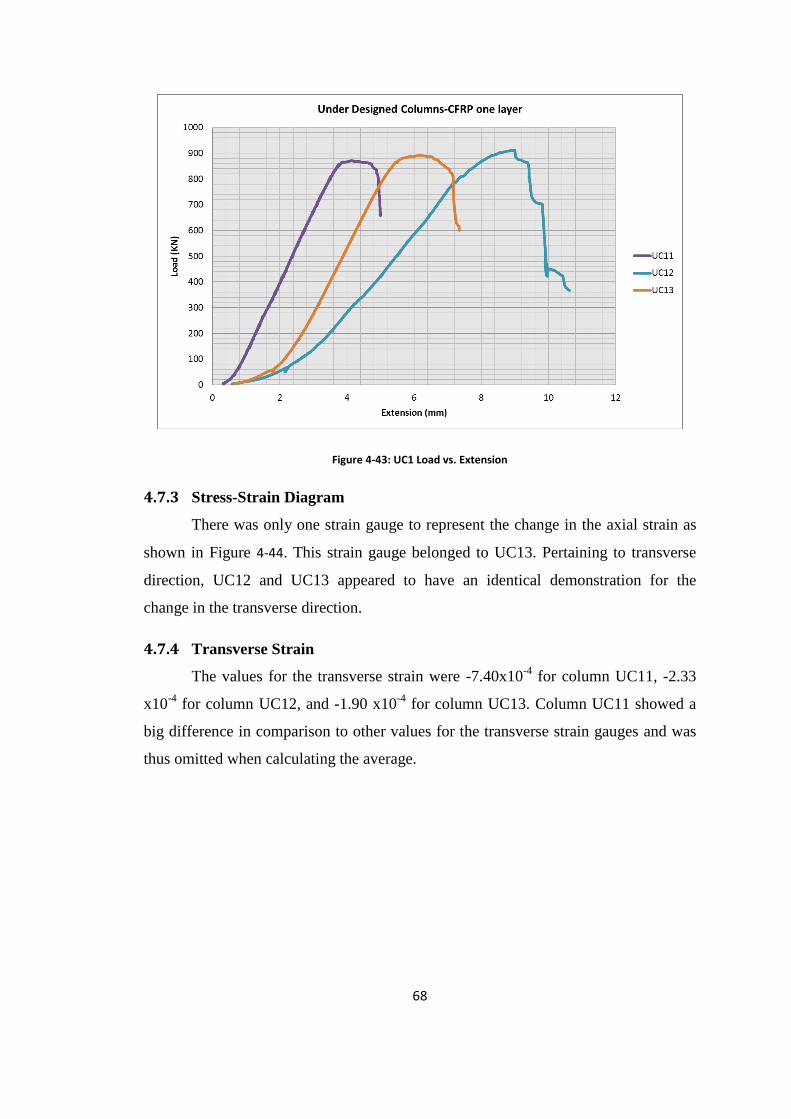
68
Figure 4-43: UC1 Load vs. Extension
4.7.3 Stress-Strain Diagram
There was only one strain gauge to represent the change in the axial strain as
shown in Figure 4-44. This strain gauge belonged to UC13. Pertaining to transverse
direction, UC12 and UC13 appeared to have an identical demonstration for the
change in the transverse direction.
4.7.4 Transverse Strain
The values for the transverse strain were -7.40x10⁻⁴
for column UC11, -2.33
x10-4
for column UC12, and -1.90 x10⁻⁴
for column UC13. Column UC11 showed a
big difference in comparison to other values for the transverse strain gauges and was
thus omitted when calculating the average.
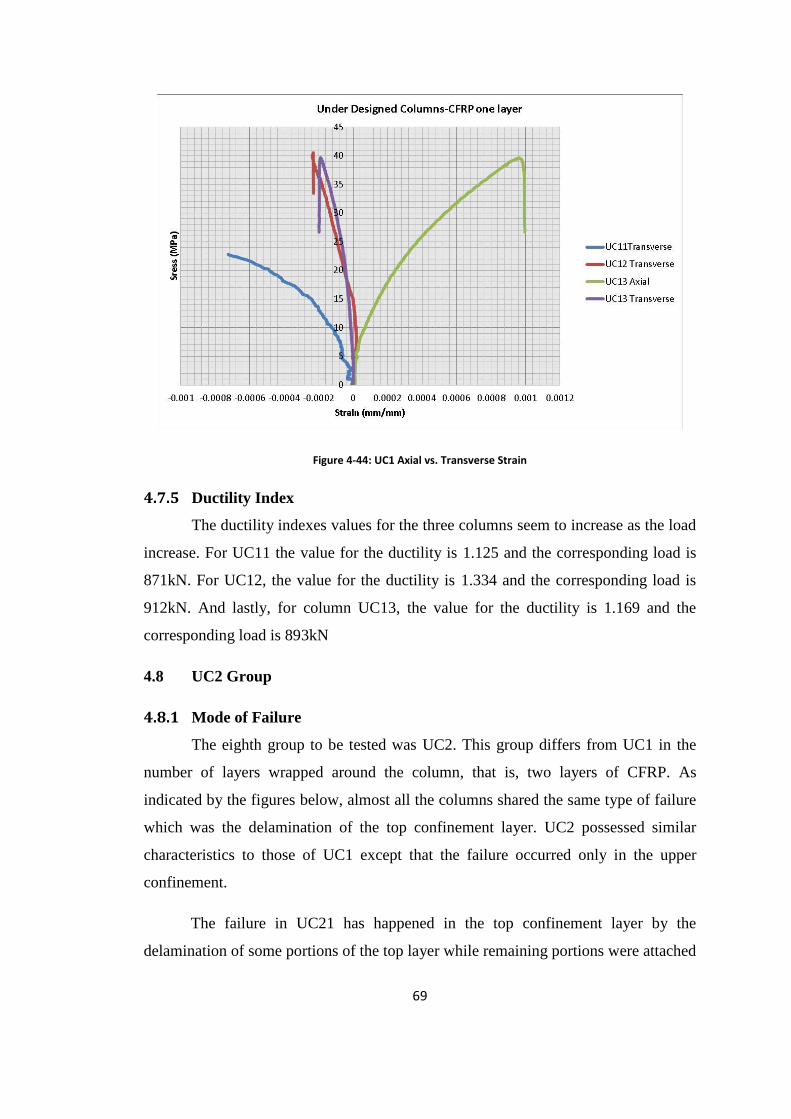
69
Figure 4-44: UC1 Axial vs. Transverse Strain
4.7.5 Ductility Index
The ductility indexes values for the three columns seem to increase as the load
increase. For UC11 the value for the ductility is 1.125 and the corresponding load is
871kN. For UC12, the value for the ductility is 1.334 and the corresponding load is
912kN. And lastly, for column UC13, the value for the ductility is 1.169 and the
corresponding load is 893kN
4.8 UC2 Group
4.8.1 Mode of Failure
The eighth group to be tested was UC2. This group differs from UC1 in the
number of layers wrapped around the column, that is, two layers of CFRP. As
indicated by the figures below, almost all the columns shared the same type of failure
which was the delamination of the top confinement layer. UC2 possessed similar
characteristics to those of UC1 except that the failure occurred only in the upper
confinement.
The failure in UC21 has happened in the top confinement layer by the
delamination of some portions of the top layer while remaining portions were attached

70
to the column. In addition, part of the transverse reinforcement also appeared due to
the partial delamination. The change in the column condition can be seen in
Figure 4-45 and Figure 4-46
Figure 4-45: UC21 Side View
Figure 4-46: UC21 Close Side View
Pertaining to Figure 4-47 and Figure 4-48, the failure in UC22 is similar to the
failure in UC21. It appeared in the top section of the column which caused part of the
top confinement to be delaminated while the remaining part remained attached. Also,
part of the transverse reinforcement also appeared due to the partial delamination.
Figure 4-47: UC22 Corner View
Figure 4-48: UC22 Top View
The failure in column UC23 also appeared in the CFRP confinement at the top
section of the column. The failure manifested as delamination of the top confinement.
Unlike the previous two columns, this column suffered delamination without the
appearance of the main or transverse reinforcement. However, it is clear in the figures
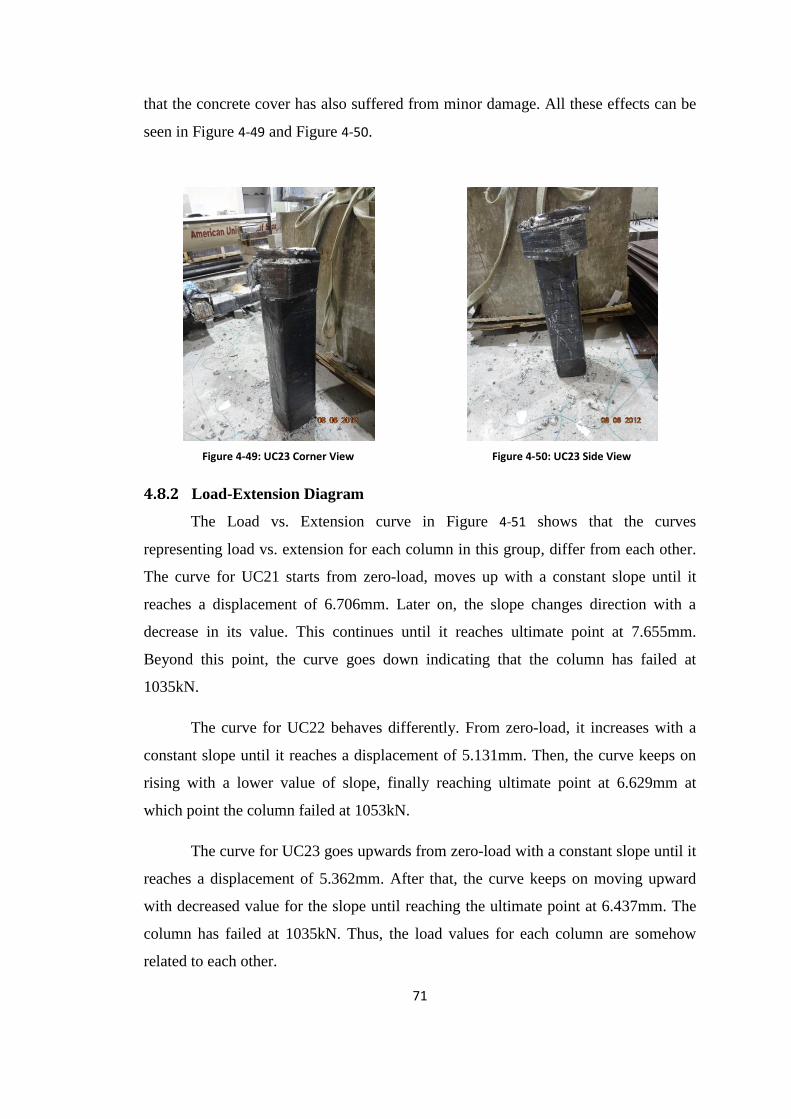
71
that the concrete cover has also suffered from minor damage. All these effects can be
seen in Figure 4-49 and Figure 4-50.
4.8.2 Load-Extension Diagram
The Load vs. Extension curve in Figure 4-51 shows that the curves
representing load vs. extension for each column in this group, differ from each other.
The curve for UC21 starts from zero-load, moves up with a constant slope until it
reaches a displacement of 6.706mm. Later on, the slope changes direction with a
decrease in its value. This continues until it reaches ultimate point at 7.655mm.
Beyond this point, the curve goes down indicating that the column has failed at
1035kN.
The curve for UC22 behaves differently. From zero-load, it increases with a
constant slope until it reaches a displacement of 5.131mm. Then, the curve keeps on
rising with a lower value of slope, finally reaching ultimate point at 6.629mm at
which point the column failed at 1053kN.
The curve for UC23 goes upwards from zero-load with a constant slope until it
reaches a displacement of 5.362mm. After that, the curve keeps on moving upward
with decreased value for the slope until reaching the ultimate point at 6.437mm. The
column has failed at 1035kN. Thus, the load values for each column are somehow
related to each other.
Figure 4-49: UC23 Corner View
Figure 4-50: UC23 Side View
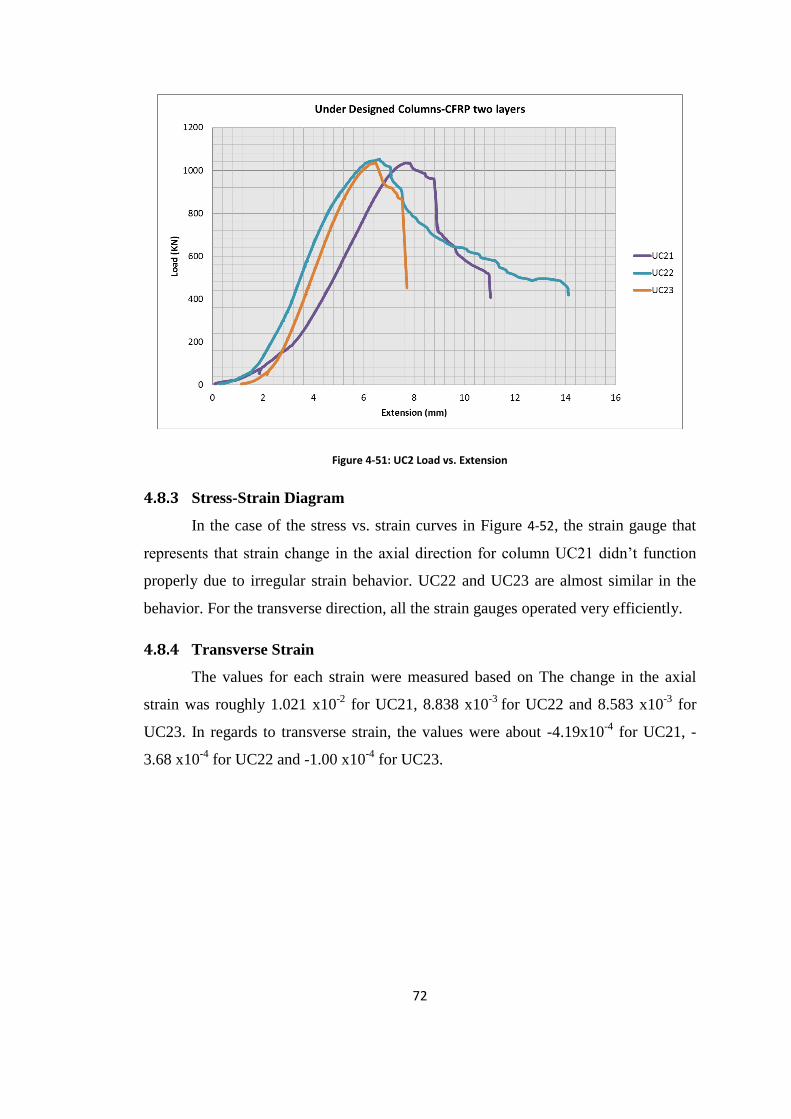
72
Figure 4-51: UC2 Load vs. Extension
4.8.3 Stress-Strain Diagram
In the case of the stress vs. strain curves in Figure 4-52, the strain gauge that
represents that strain change in the axial direction for column UC21 didn’t function
properly due to irregular strain behavior. UC22 and UC23 are almost similar in the
behavior. For the transverse direction, all the strain gauges operated very efficiently.
4.8.4 Transverse Strain
The values for each strain were measured based on The change in the axial
strain was roughly 1.021 x10⁻²
for UC21, 8.838 x10⁻³
for UC22 and 8.583 x10⁻³
for
UC23. In regards to transverse strain, the values were about -4.19x10⁻⁴
for UC21, -
3.68 x10⁻⁴
for UC22 and -1.00 x10⁻⁴
for UC23.
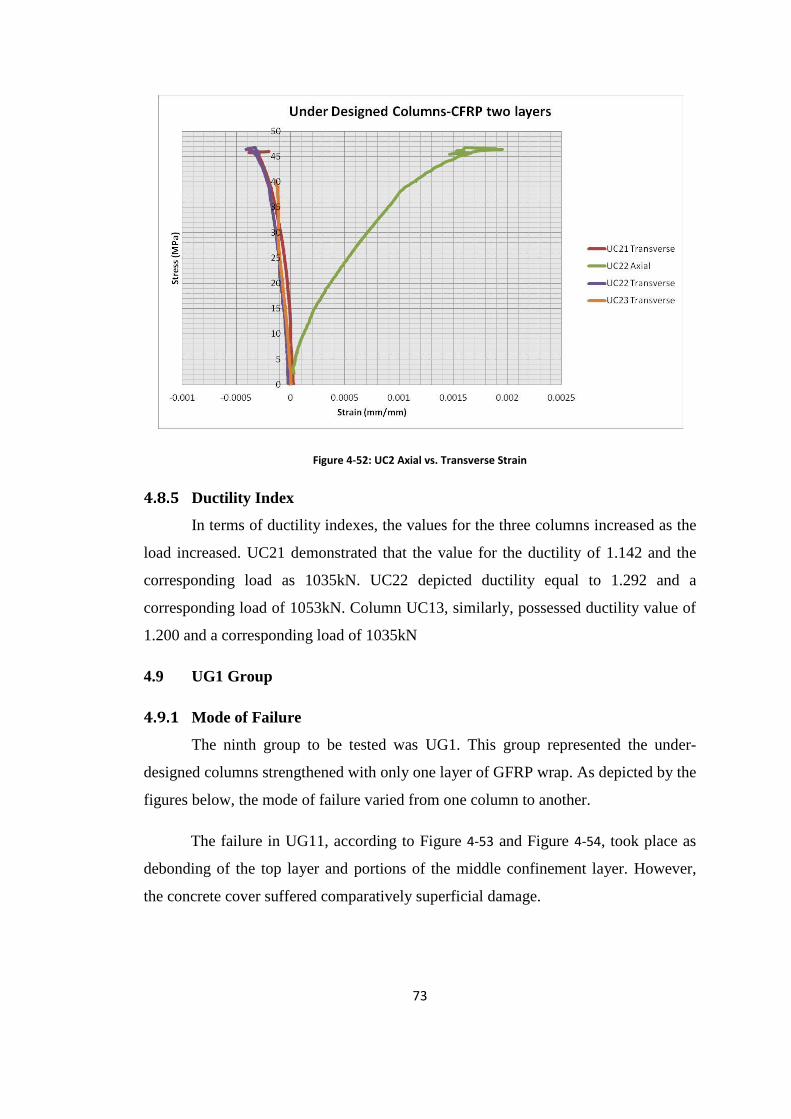
73
Figure 4-52: UC2 Axial vs. Transverse Strain
4.8.5 Ductility Index
In terms of ductility indexes, the values for the three columns increased as the
load increased. UC21 demonstrated that the value for the ductility of 1.142 and the
corresponding load as 1035kN. UC22 depicted ductility equal to 1.292 and a
corresponding load of 1053kN. Column UC13, similarly, possessed ductility value of
1.200 and a corresponding load of 1035kN
4.9 UG1 Group
4.9.1 Mode of Failure
The ninth group to be tested was UG1. This group represented the under-
designed columns strengthened with only one layer of GFRP wrap. As depicted by the
figures below, the mode of failure varied from one column to another.
The failure in UG11, according to Figure 4-53 and Figure 4-54, took place as
debonding of the top layer and portions of the middle confinement layer. However,
the concrete cover suffered comparatively superficial damage.
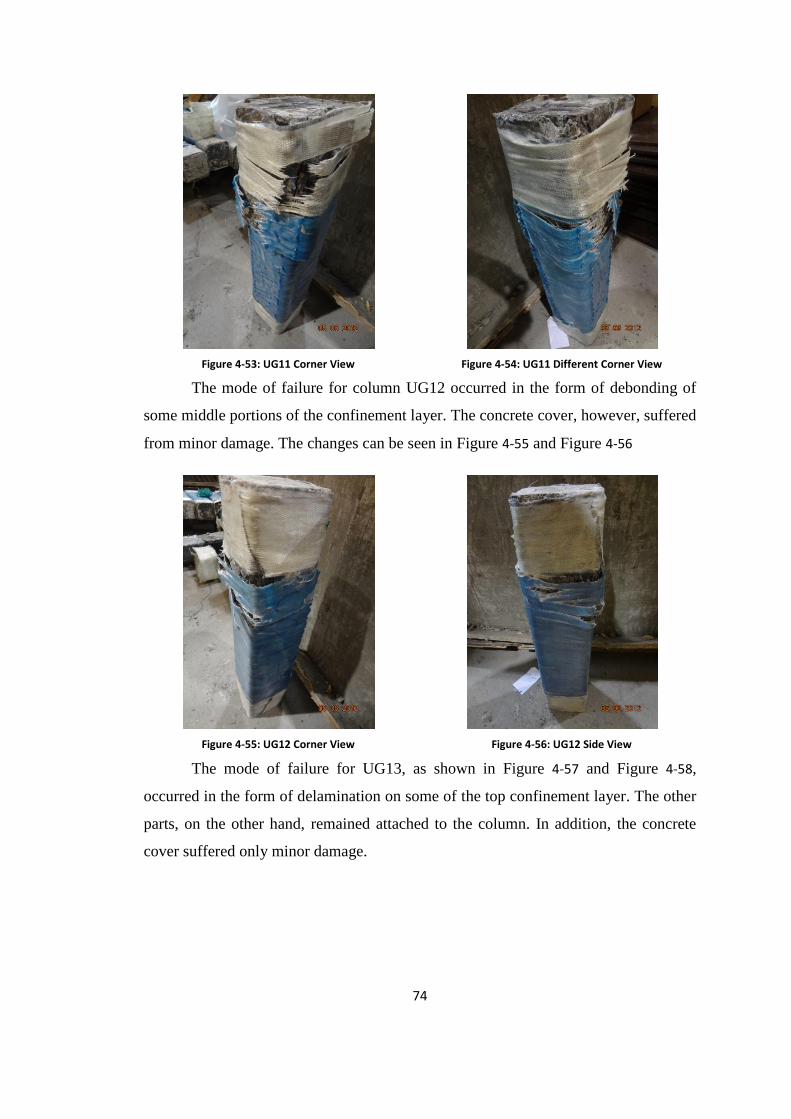
74
Figure 4-53: UG11 Corner View
Figure 4-54: UG11 Different Corner View
The mode of failure for column UG12 occurred in the form of debonding of
some middle portions of the confinement layer. The concrete cover, however, suffered
from minor damage. The changes can be seen in Figure 4-55 and Figure 4-56
Figure 4-55: UG12 Corner View
Figure 4-56: UG12 Side View
The mode of failure for UG13, as shown in Figure 4-57 and Figure 4-58,
occurred in the form of delamination on some of the top confinement layer. The other
parts, on the other hand, remained attached to the column. In addition, the concrete
cover suffered only minor damage.
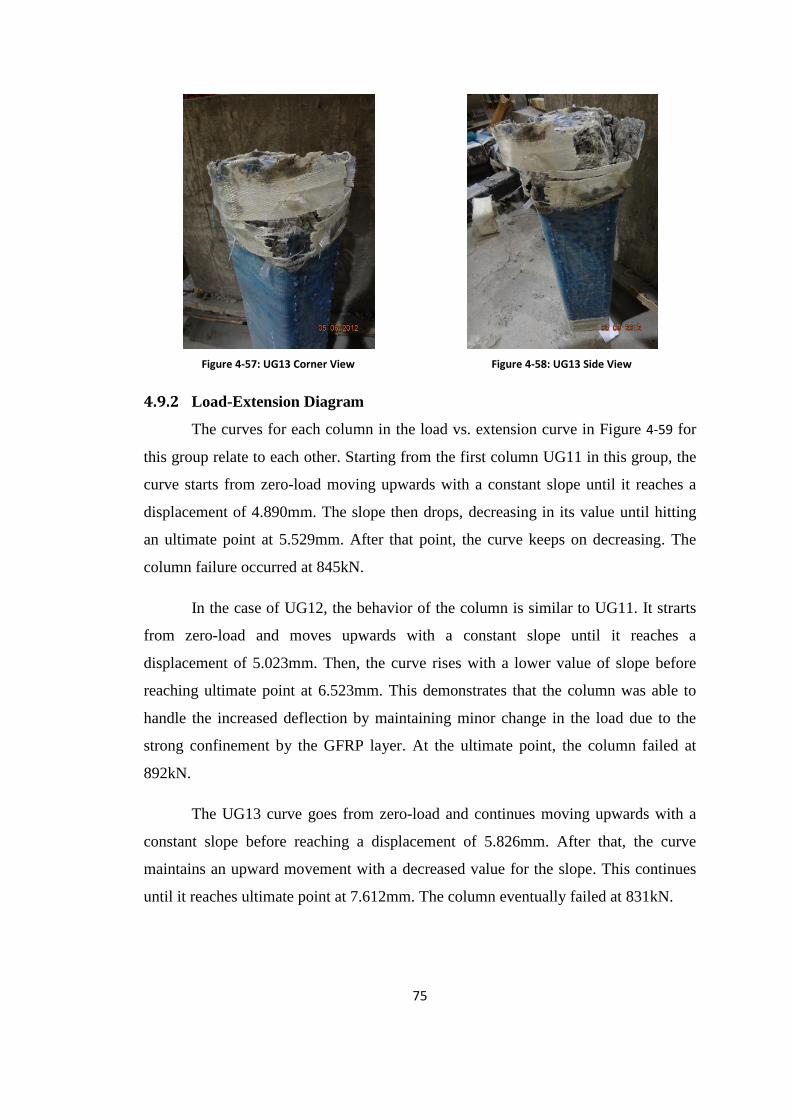
75
Figure 4-57: UG13 Corner View
Figure 4-58: UG13 Side View
4.9.2 Load-Extension Diagram
The curves for each column in the load vs. extension curve in Figure 4-59 for
this group relate to each other. Starting from the first column UG11 in this group, the
curve starts from zero-load moving upwards with a constant slope until it reaches a
displacement of 4.890mm. The slope then drops, decreasing in its value until hitting
an ultimate point at 5.529mm. After that point, the curve keeps on decreasing. The
column failure occurred at 845kN.
In the case of UG12, the behavior of the column is similar to UG11. It strarts
from zero-load and moves upwards with a constant slope until it reaches a
displacement of 5.023mm. Then, the curve rises with a lower value of slope before
reaching ultimate point at 6.523mm. This demonstrates that the column was able to
handle the increased deflection by maintaining minor change in the load due to the
strong confinement by the GFRP layer. At the ultimate point, the column failed at
892kN.
The UG13 curve goes from zero-load and continues moving upwards with a
constant slope before reaching a displacement of 5.826mm. After that, the curve
maintains an upward movement with a decreased value for the slope. This continues
until it reaches ultimate point at 7.612mm. The column eventually failed at 831kN.
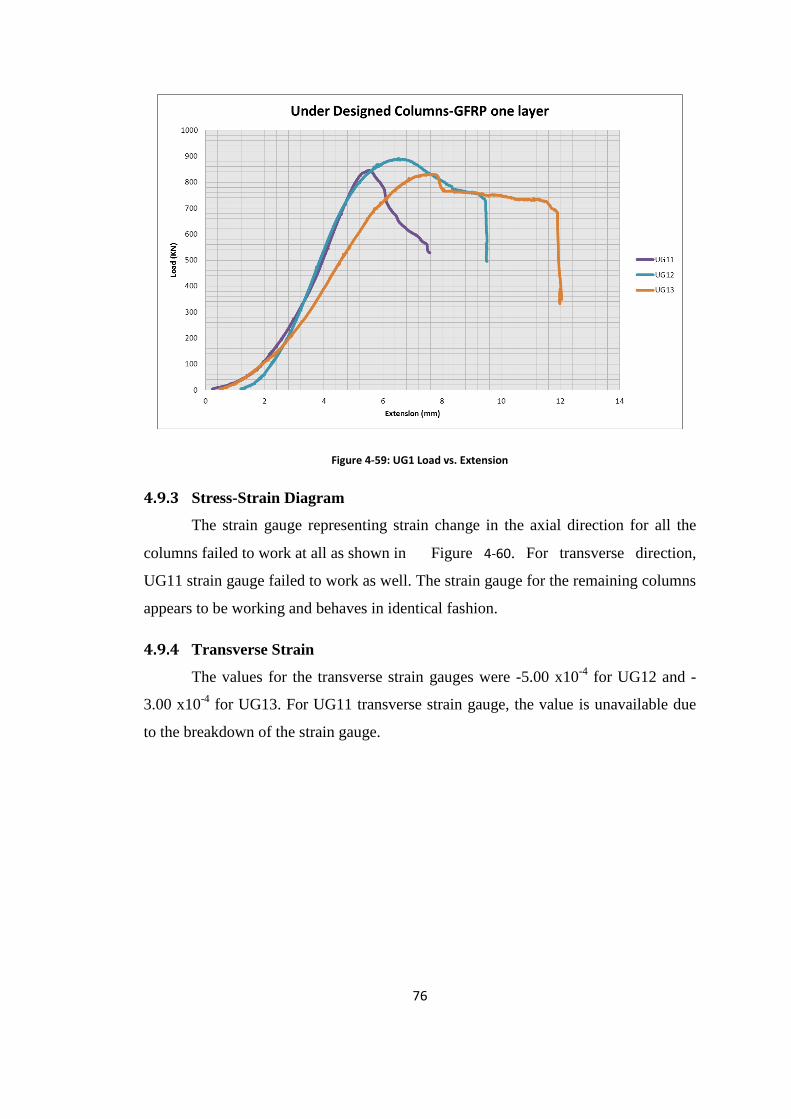
76
Figure 4-59: UG1 Load vs. Extension
4.9.3 Stress-Strain Diagram
The strain gauge representing strain change in the axial direction for all the
columns failed to work at all as shown in Figure 4-60. For transverse direction,
UG11 strain gauge failed to work as well. The strain gauge for the remaining columns
appears to be working and behaves in identical fashion.
4.9.4 Transverse Strain
The values for the transverse strain gauges were -5.00 x10⁻⁴
for UG12 and -
3.00 x10⁻⁴
for UG13. For UG11 transverse strain gauge, the value is unavailable due
to the breakdown of the strain gauge.
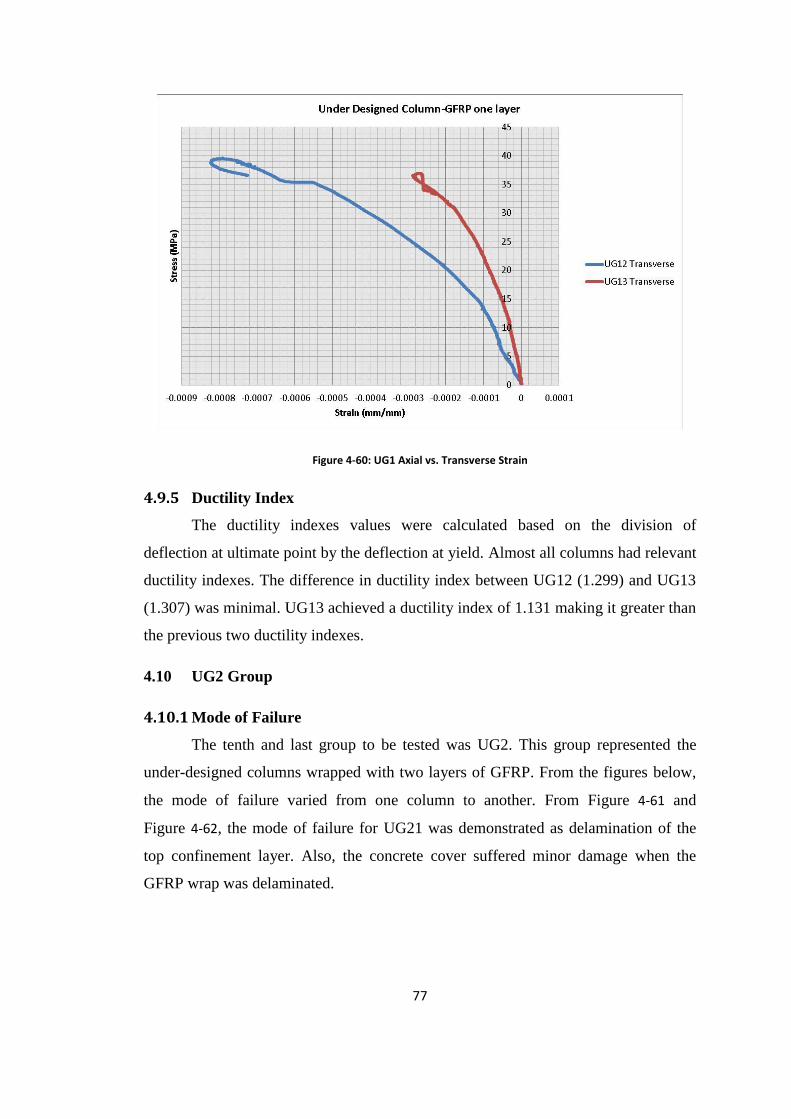
77
Figure 4-60: UG1 Axial vs. Transverse Strain
4.9.5 Ductility Index
The ductility indexes values were calculated based on the division of
deflection at ultimate point by the deflection at yield. Almost all columns had relevant
ductility indexes. The difference in ductility index between UG12 (1.299) and UG13
(1.307) was minimal. UG13 achieved a ductility index of 1.131 making it greater than
the previous two ductility indexes.
4.10 UG2 Group
4.10.1 Mode of Failure
The tenth and last group to be tested was UG2. This group represented the
under-designed columns wrapped with two layers of GFRP. From the figures below,
the mode of failure varied from one column to another. From Figure 4-61 and
Figure 4-62, the mode of failure for UG21 was demonstrated as delamination of the
top confinement layer. Also, the concrete cover suffered minor damage when the
GFRP wrap was delaminated.
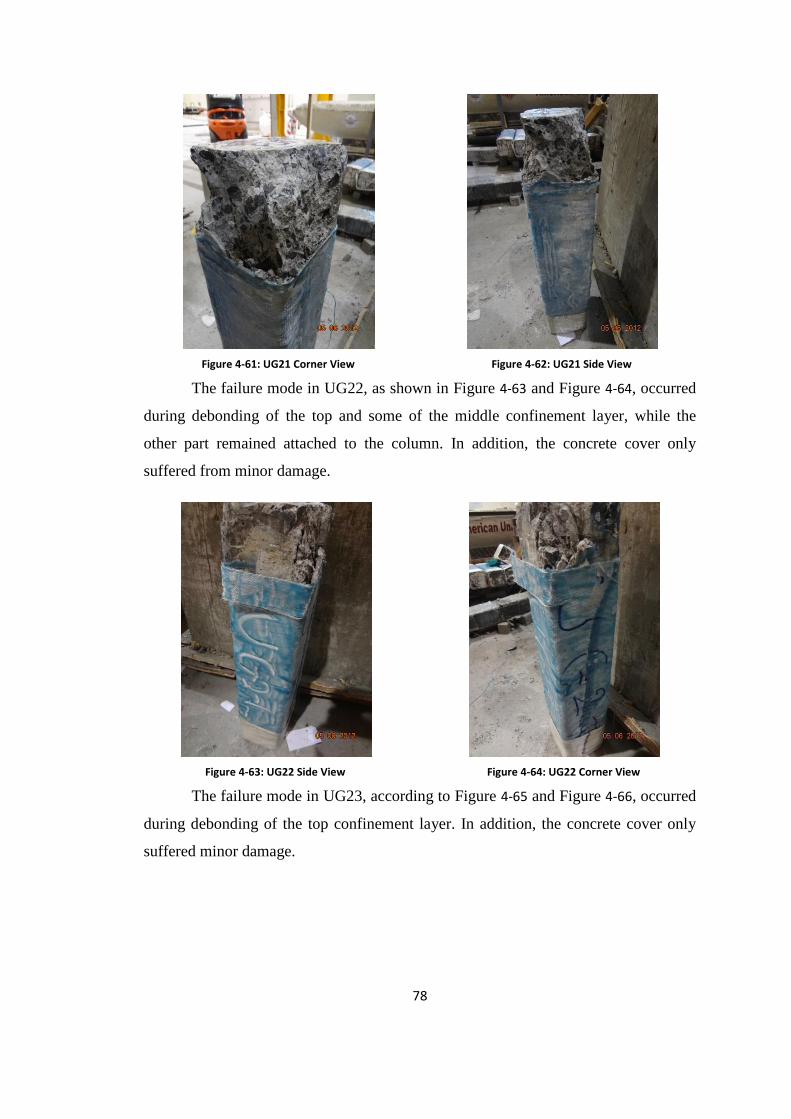
78
Figure 4-61: UG21 Corner View
Figure 4-62: UG21 Side View
The failure mode in UG22, as shown in Figure 4-63 and Figure 4-64, occurred
during debonding of the top and some of the middle confinement layer, while the
other part remained attached to the column. In addition, the concrete cover only
suffered from minor damage.
Figure 4-63: UG22 Side View
Figure 4-64: UG22 Corner View
The failure mode in UG23, according to Figure 4-65 and Figure 4-66, occurred
during debonding of the top confinement layer. In addition, the concrete cover only
suffered minor damage.
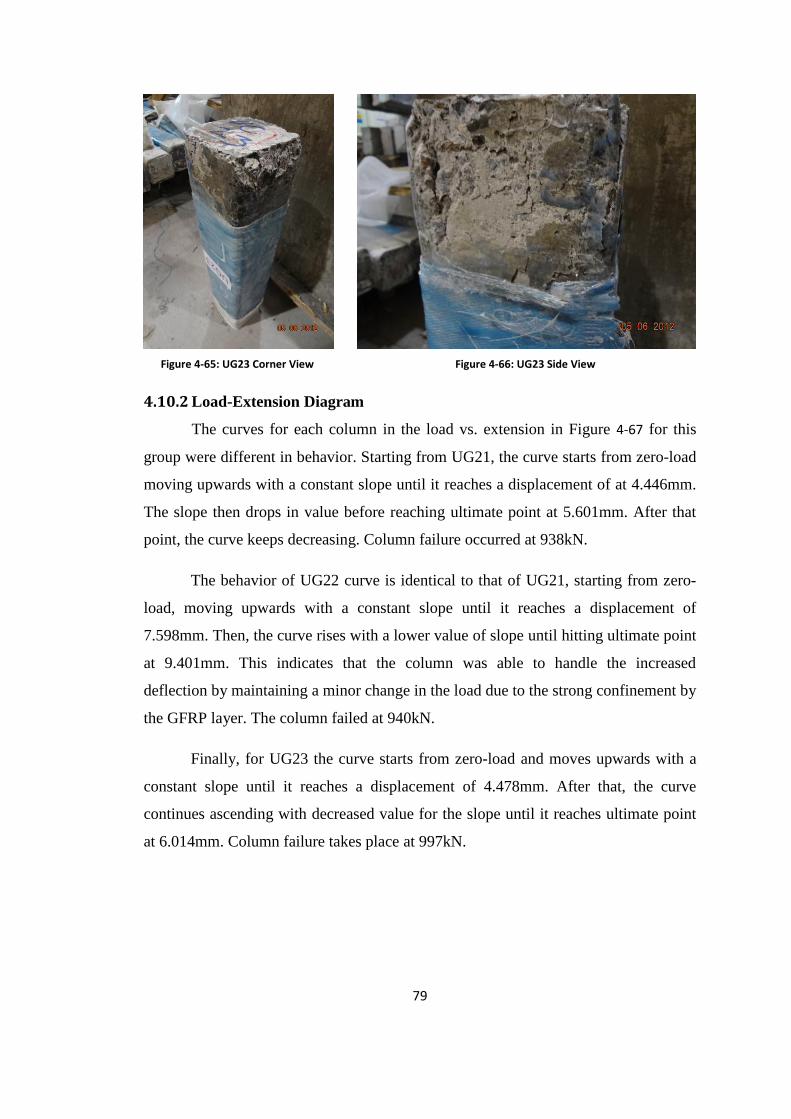
79
Figure 4-65: UG23 Corner View
Figure 4-66: UG23 Side View
4.10.2 Load-Extension Diagram
The curves for each column in the load vs. extension in Figure 4-67 for this
group were different in behavior. Starting from UG21, the curve starts from zero-load
moving upwards with a constant slope until it reaches a displacement of at 4.446mm.
The slope then drops in value before reaching ultimate point at 5.601mm. After that
point, the curve keeps decreasing. Column failure occurred at 938kN.
The behavior of UG22 curve is identical to that of UG21, starting from zero-
load, moving upwards with a constant slope until it reaches a displacement of
7.598mm. Then, the curve rises with a lower value of slope until hitting ultimate point
at 9.401mm. This indicates that the column was able to handle the increased
deflection by maintaining a minor change in the load due to the strong confinement by
the GFRP layer. The column failed at 940kN.
Finally, for UG23 the curve starts from zero-load and moves upwards with a
constant slope until it reaches a displacement of 4.478mm. After that, the curve
continues ascending with decreased value for the slope until it reaches ultimate point
at 6.014mm. Column failure takes place at 997kN.

80
Figure 4-67: UG2 Load vs. Extension
4.10.3 Stress-Strain Diagram
In terms of the stress vs. strain curves in Figure 4-68, the strain gauge
representing UG23 in the axial and transverse direction failed to work at all. As for
the other columns, the behavior of the strain in the axial direction for both columns
differed from each other. For the transverse direction, they appeared virtually
identical.
4.10.4 Transverse Strain
The values for each strain was measured based on Figure 4-68. The change in
transverse strain values were -3.19 x10⁻⁴
for UG21 and -1.66 x10⁻⁴
for UG22. For
UG23 transverse strain gauge, the value is unavailable due to the breakdown of the
strain gauge.
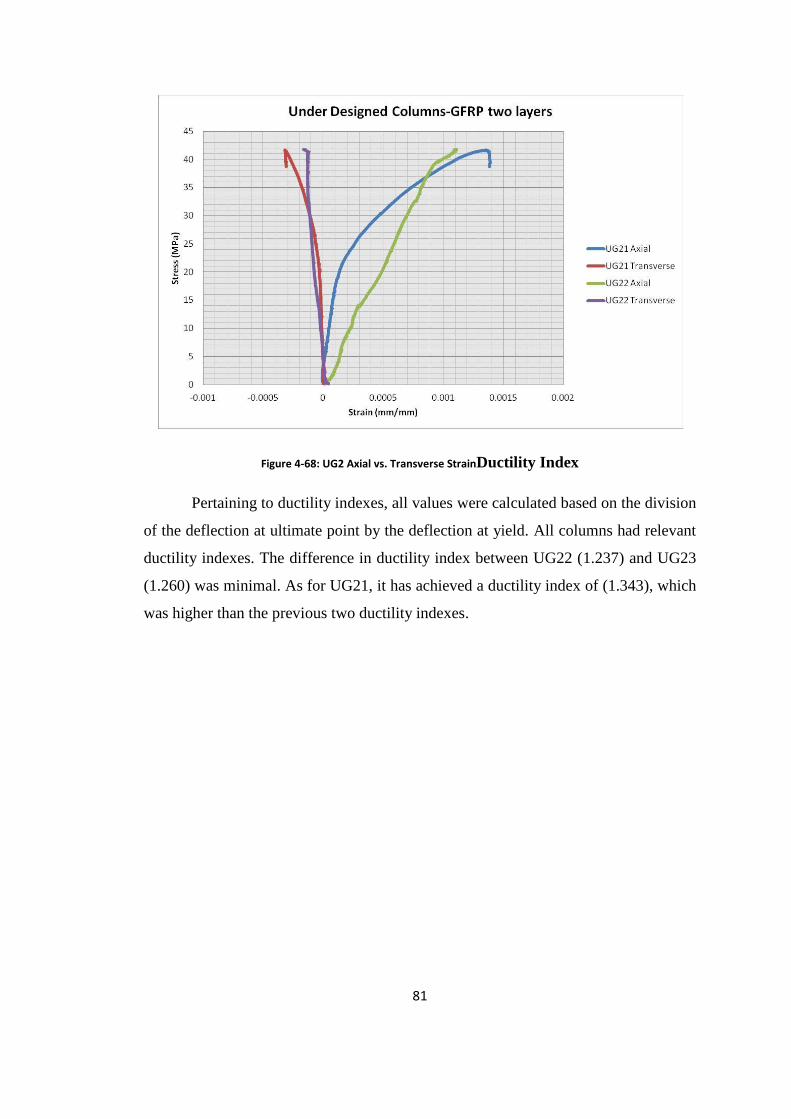
81
Figure 4-68: UG2 Axial vs. Transverse StrainDuctility Index
Pertaining to ductility indexes, all values were calculated based on the division
of the deflection at ultimate point by the deflection at yield. All columns had relevant
ductility indexes. The difference in ductility index between UG22 (1.237) and UG23
(1.260) was minimal. As for UG21, it has achieved a ductility index of (1.343), which
was higher than the previous two ductility indexes.

82
CHAPTER 5 THEORETICAL RESULTS
5.1 Introduction to ACI 440.2R
In the past few decades, several researchers have conducted experiments in
order to investigate the behavior of the FRP materials in strengthening structural
members. Such studies were necessary in understanding the behavior of these
materials so that equations (and parameters) could be designed that accurately
predicted desired characteristics. American Concrete Institute (ACI) committee
devised a design code manual containing equations that predict the load for beams
and columns externally strengthened with FRP materials. This code was referred to as
ACI 440.2R.
5.2 Design Equations
One of the cases mentioned in this code, talks about how to predict the
confined compressive strength of non-circular concrete columns when subjected to
axial load without bending moment. The theoretical compressive strength value of the
non-confined concrete column was calculated based on Equation (1). However, when
confinement is taken into consideration, Equation (1) had to be modified to include
the compressive strength of confined concrete. That is, the concrete compressive
strength ( ) was replaced with (
) to form Equation (2).
[ ( ) ]-----------------------------------------------Equation 2
In order to predict the theoretical load for confined concrete column, ACI 440
suggests the following five steps to be followed:
Step 1: Compute the design FRP material properties:
Some of the properties provided by the manufacturer, such as the ultimate
rupture strain ( ), do not represent the material subjected to environmental
condition. Therefore, an environmental reduction factor ( ) should be applied to
account for this matter. This factor has different value from one material to another.
For example, Carbon has a value of 0.95 while Glass possesses a value of 0.75. To
calculate the effective strain level ( ) and design rupture strain ( ), Equation 3 and
(4) are to be followed:
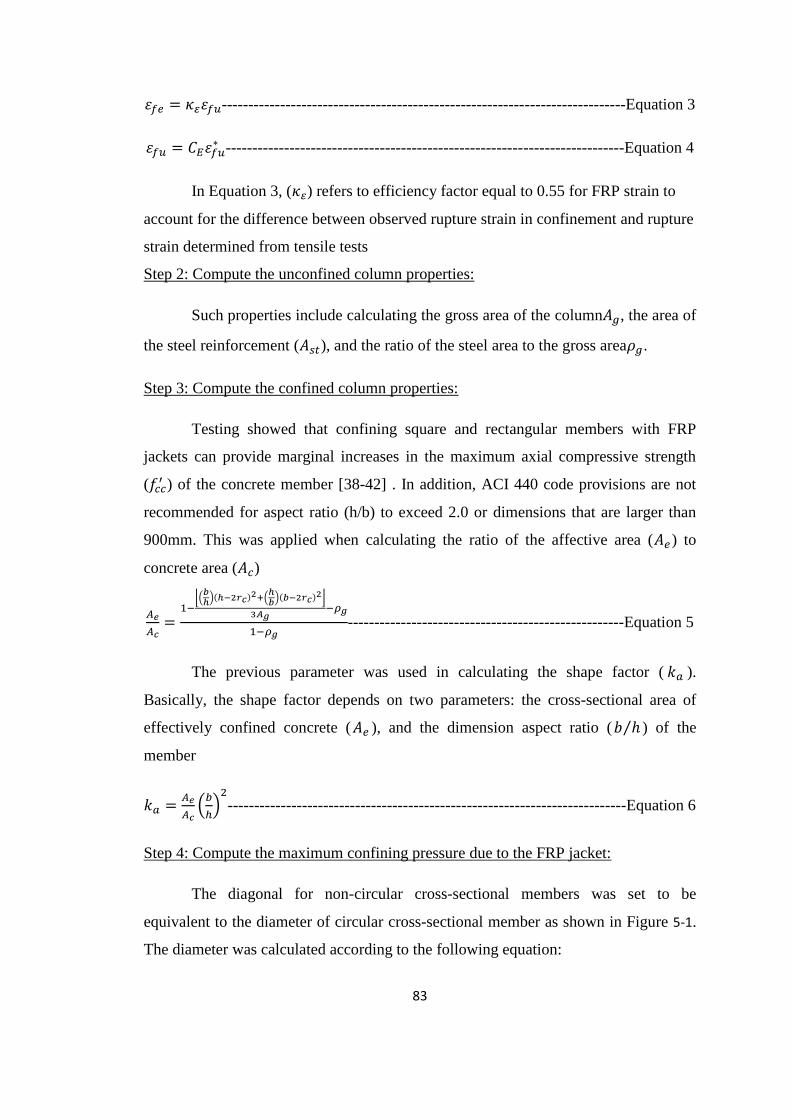
83
----------------------------------------------------------------------------Equation 3
---------------------------------------------------------------------------Equation 4
In Equation 3, ( ) refers to efficiency factor equal to 0.55 for FRP strain to
account for the difference between observed rupture strain in confinement and rupture
strain determined from tensile tests
Step 2: Compute the unconfined column properties:
Such properties include calculating the gross area of the column , the area of
the steel reinforcement ( ), and the ratio of the steel area to the gross area .
Step 3: Compute the confined column properties:
Testing showed that confining square and rectangular members with FRP
jackets can provide marginal increases in the maximum axial compressive strength
( ) of the concrete member [38-42] . In addition, ACI 440 code provisions are not
recommended for aspect ratio (h/b) to exceed 2.0 or dimensions that are larger than
900mm. This was applied when calculating the ratio of the affective area ( ) to
concrete area ( )
⌊( )( )
( )( )
⌋
----------------------------------------------------Equation 5
The previous parameter was used in calculating the shape factor ( ).
Basically, the shape factor depends on two parameters: the cross-sectional area of
effectively confined concrete ( ), and the dimension aspect ratio ( ⁄ ) of the
member
(
)
---------------------------------------------------------------------------Equation 6
Step 4: Compute the maximum confining pressure due to the FRP jacket:
The diagonal for non-circular cross-sectional members was set to be
equivalent to the diameter of circular cross-sectional member as shown in Figure 5-1.
The diameter was calculated according to the following equation:
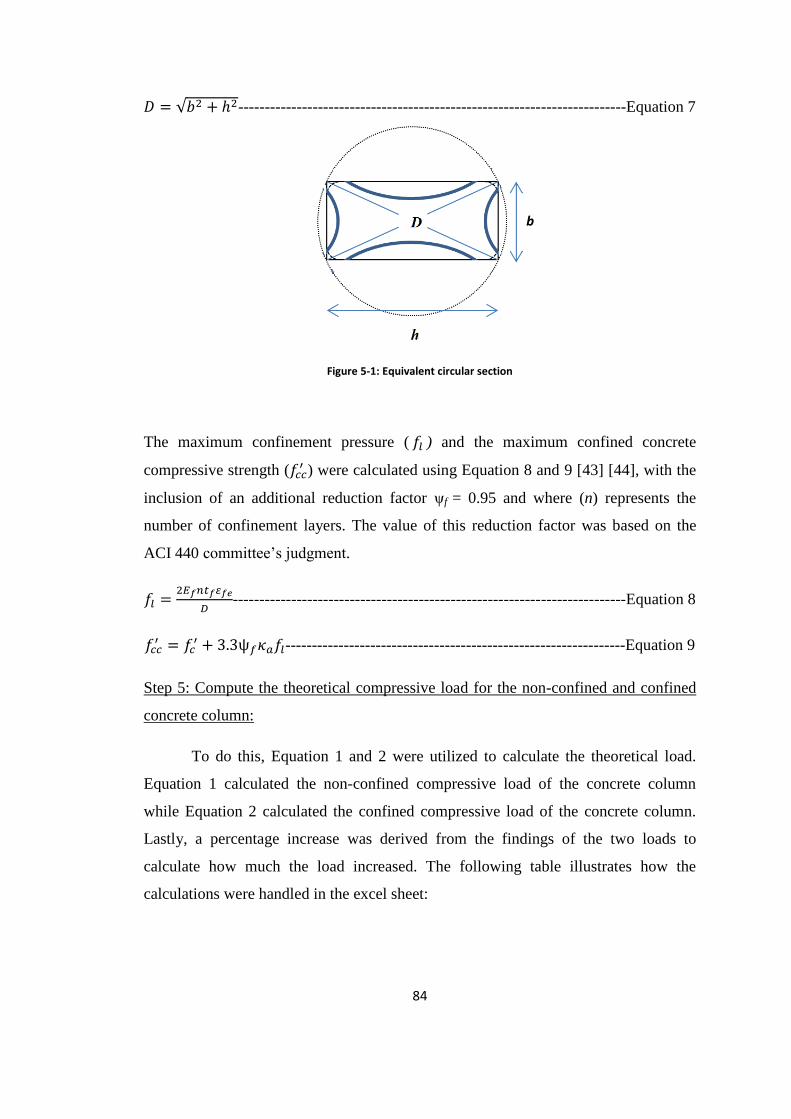
84
√ -------------------------------------------------------------------------Equation 7
Figure 5-1: Equivalent circular section
The maximum confinement pressure ( ) and the maximum confined concrete
compressive strength ( ) were calculated using Equation 8 and 9 [43] [44], with the
inclusion of an additional reduction factor ψf = 0.95 and where (n) represents the
number of confinement layers. The value of this reduction factor was based on the
ACI 440 committee’s judgment.
--------------------------------------------------------------------------Equation 8
----------------------------------------------------------------Equation 9
Step 5: Compute the theoretical compressive load for the non-confined and confined
concrete column:
To do this, Equation 1 and 2 were utilized to calculate the theoretical load.
Equation 1 calculated the non-confined compressive load of the concrete column
while Equation 2 calculated the confined compressive load of the concrete column.
Lastly, a percentage increase was derived from the findings of the two loads to
calculate how much the load increased. The following table illustrates how the
calculations were handled in the excel sheet:
b
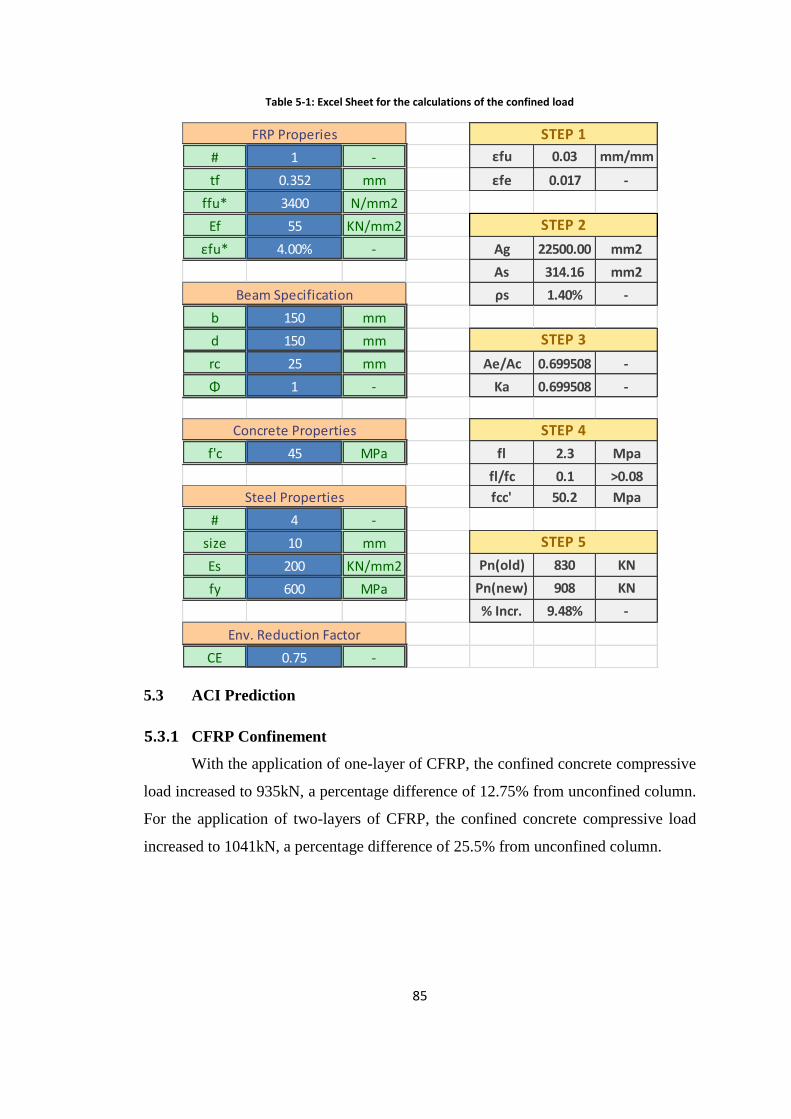
85
Table 5-1: Excel Sheet for the calculations of the confined load
5.3 ACI Prediction
5.3.1 CFRP Confinement
With the application of one-layer of CFRP, the confined concrete compressive
load increased to 935kN, a percentage difference of 12.75% from unconfined column.
For the application of two-layers of CFRP, the confined concrete compressive load
increased to 1041kN, a percentage difference of 25.5% from unconfined column.
# 1 - εfu 0.03 mm/mm
tf 0.352 mm εfe 0.017 -
ffu* 3400 N/mm2
Ef 55 KN/mm2
εfu* 4.00% - Ag 22500.00 mm2
As 314.16 mm2
ρs 1.40% -
b 150 mm
d 150 mm
rc 25 mm Ae/Ac 0.699508 -
Φ 1 - Ka 0.699508 -
f'c 45 MPa fl 2.3 Mpa
fl/fc 0.1 >0.08
fcc' 50.2 Mpa
# 4 -
size 10 mm
Es 200 KN/mm2 Pn(old) 830 KN
fy 600 MPa Pn(new) 908 KN
% Incr. 9.48% -
CE 0.75 -
FRP Properies
Concrete Properties
Env. Reduction Factor
STEP 1
STEP 4
STEP 5
Steel Properties
STEP 2
STEP 3
Beam Specification
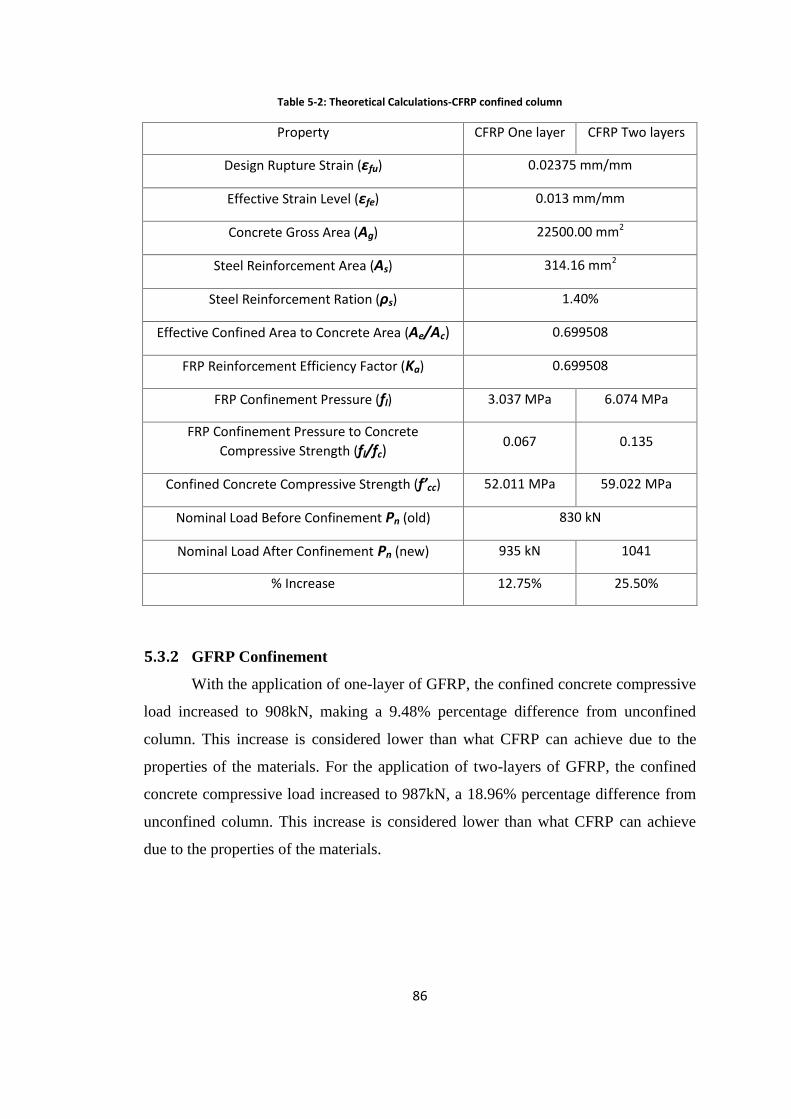
86
Table 5-2: Theoretical Calculations-CFRP confined column
Property CFRP One layer CFRP Two layers
Design Rupture Strain (εfu) 0.02375 mm/mm
Effective Strain Level (εfe) 0.013 mm/mm
Concrete Gross Area (Ag) 22500.00 mm2
Steel Reinforcement Area (As) 314.16 mm2
Steel Reinforcement Ration (ρs) 1.40%
Effective Confined Area to Concrete Area (Ae/Ac) 0.699508
FRP Reinforcement Efficiency Factor (Ka) 0.699508
FRP Confinement Pressure (fl) 3.037 MPa 6.074 MPa
FRP Confinement Pressure to Concrete
Compressive Strength (fl/fc) 0.067 0.135
Confined Concrete Compressive Strength (f’cc) 52.011 MPa 59.022 MPa
Nominal Load Before Confinement Pn (old) 830 kN
Nominal Load After Confinement Pn (new) 935 kN 1041
% Increase 12.75% 25.50%
5.3.2 GFRP Confinement
With the application of one-layer of GFRP, the confined concrete compressive
load increased to 908kN, making a 9.48% percentage difference from unconfined
column. This increase is considered lower than what CFRP can achieve due to the
properties of the materials. For the application of two-layers of GFRP, the confined
concrete compressive load increased to 987kN, a 18.96% percentage difference from
unconfined column. This increase is considered lower than what CFRP can achieve
due to the properties of the materials.
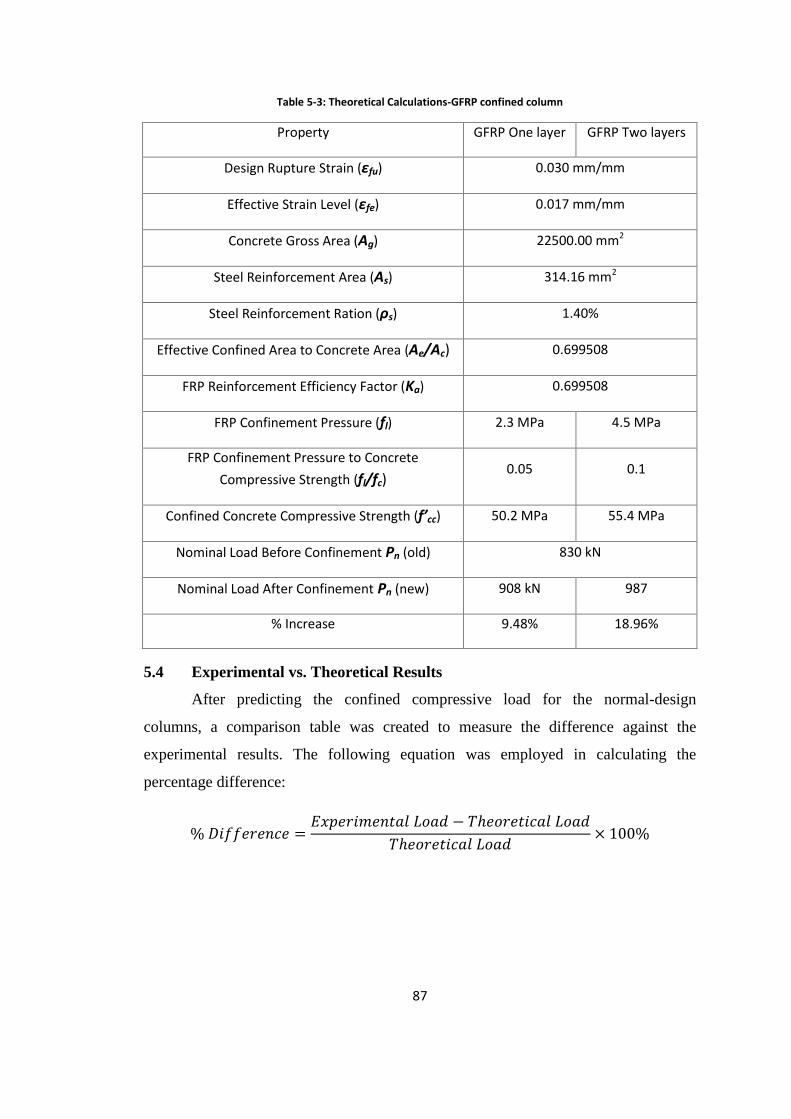
87
Table 5-3: Theoretical Calculations-GFRP confined column
Property GFRP One layer GFRP Two layers
Design Rupture Strain (εfu) 0.030 mm/mm
Effective Strain Level (εfe) 0.017 mm/mm
Concrete Gross Area (Ag) 22500.00 mm2
Steel Reinforcement Area (As) 314.16 mm2
Steel Reinforcement Ration (ρs) 1.40%
Effective Confined Area to Concrete Area (Ae/Ac) 0.699508
FRP Reinforcement Efficiency Factor (Ka) 0.699508
FRP Confinement Pressure (fl) 2.3 MPa 4.5 MPa
FRP Confinement Pressure to Concrete
Compressive Strength (fl/fc) 0.05 0.1
Confined Concrete Compressive Strength (f’cc) 50.2 MPa 55.4 MPa
Nominal Load Before Confinement Pn (old) 830 kN
Nominal Load After Confinement Pn (new) 908 kN 987
% Increase 9.48% 18.96%
5.4 Experimental vs. Theoretical Results
After predicting the confined compressive load for the normal-design
columns, a comparison table was created to measure the difference against the
experimental results. The following equation was employed in calculating the
percentage difference:
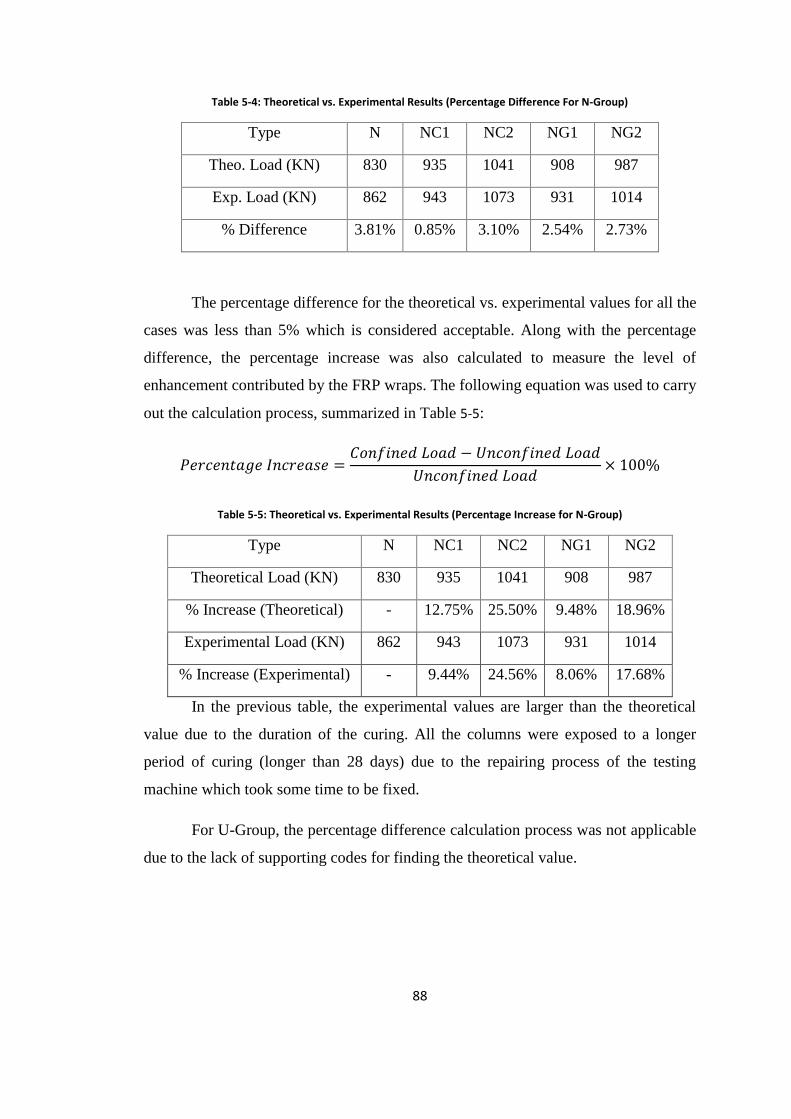
88
Table 5-4: Theoretical vs. Experimental Results (Percentage Difference For N-Group)
Type N NC1 NC2 NG1 NG2
Theo. Load (KN) 830 935 1041 908 987
Exp. Load (KN) 862 943 1073 931 1014
% Difference 3.81% 0.85% 3.10% 2.54% 2.73%
The percentage difference for the theoretical vs. experimental values for all the
cases was less than 5% which is considered acceptable. Along with the percentage
difference, the percentage increase was also calculated to measure the level of
enhancement contributed by the FRP wraps. The following equation was used to carry
out the calculation process, summarized in Table 5-5:
Table 5-5: Theoretical vs. Experimental Results (Percentage Increase for N-Group)
Type N NC1 NC2 NG1 NG2
Theoretical Load (KN) 830 935 1041 908 987
% Increase (Theoretical) - 12.75% 25.50% 9.48% 18.96%
Experimental Load (KN) 862 943 1073 931 1014
% Increase (Experimental) - 9.44% 24.56% 8.06% 17.68%
In the previous table, the experimental values are larger than the theoretical
value due to the duration of the curing. All the columns were exposed to a longer
period of curing (longer than 28 days) due to the repairing process of the testing
machine which took some time to be fixed.
For U-Group, the percentage difference calculation process was not applicable
due to the lack of supporting codes for finding the theoretical value.
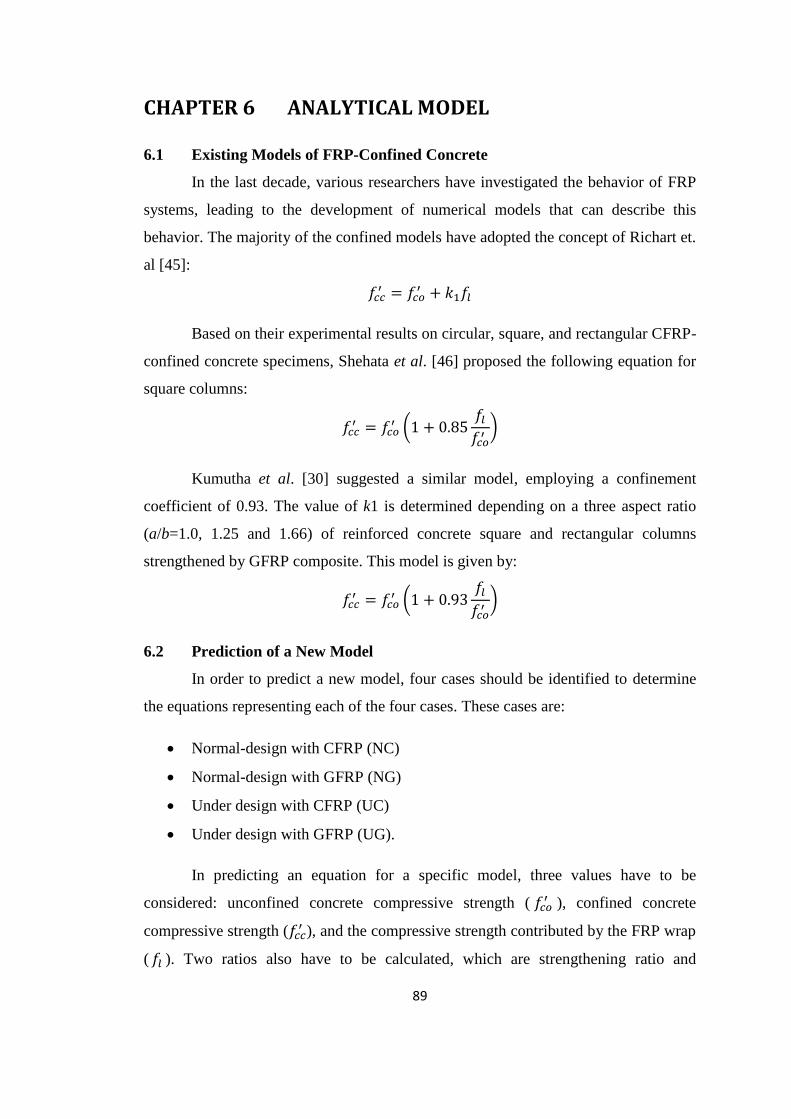
89
CHAPTER 6 ANALYTICAL MODEL
6.1 Existing Models of FRP-Confined Concrete
In the last decade, various researchers have investigated the behavior of FRP
systems, leading to the development of numerical models that can describe this
behavior. The majority of the confined models have adopted the concept of Richart et.
al [45]:
Based on their experimental results on circular, square, and rectangular CFRP-
confined concrete specimens, Shehata et al. [46] proposed the following equation for
square columns:
( )
Kumutha et al. [30] suggested a similar model, employing a confinement
coefficient of 0.93. The value of k1 is determined depending on a three aspect ratio
(a/b=1.0, 1.25 and 1.66) of reinforced concrete square and rectangular columns
strengthened by GFRP composite. This model is given by:
( )
6.2 Prediction of a New Model
In order to predict a new model, four cases should be identified to determine
the equations representing each of the four cases. These cases are:
Normal-design with CFRP (NC)
Normal-design with GFRP (NG)
Under design with CFRP (UC)
Under design with GFRP (UG).
In predicting an equation for a specific model, three values have to be
considered: unconfined concrete compressive strength ( ), confined concrete
compressive strength ( ), and the compressive strength contributed by the FRP wrap
( ). Two ratios also have to be calculated, which are strengthening ratio and
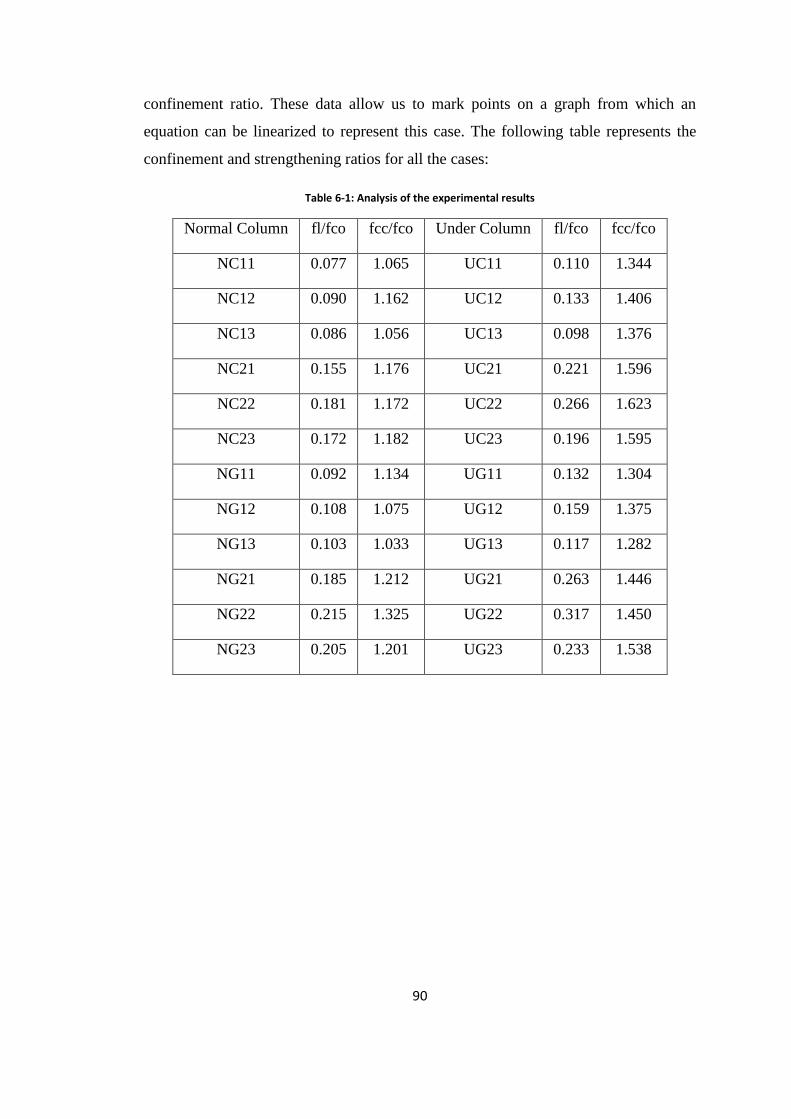
90
confinement ratio. These data allow us to mark points on a graph from which an
equation can be linearized to represent this case. The following table represents the
confinement and strengthening ratios for all the cases:
Table 6-1: Analysis of the experimental results
Normal Column fl/fco fcc/fco Under Column fl/fco fcc/fco
NC11 0.077 1.065 UC11 0.110 1.344
NC12 0.090 1.162 UC12 0.133 1.406
NC13 0.086 1.056 UC13 0.098 1.376
NC21 0.155 1.176 UC21 0.221 1.596
NC22 0.181 1.172 UC22 0.266 1.623
NC23 0.172 1.182 UC23 0.196 1.595
NG11 0.092 1.134 UG11 0.132 1.304
NG12 0.108 1.075 UG12 0.159 1.375
NG13 0.103 1.033 UG13 0.117 1.282
NG21 0.185 1.212 UG21 0.263 1.446
NG22 0.215 1.325 UG22 0.317 1.450
NG23 0.205 1.201 UG23 0.233 1.538
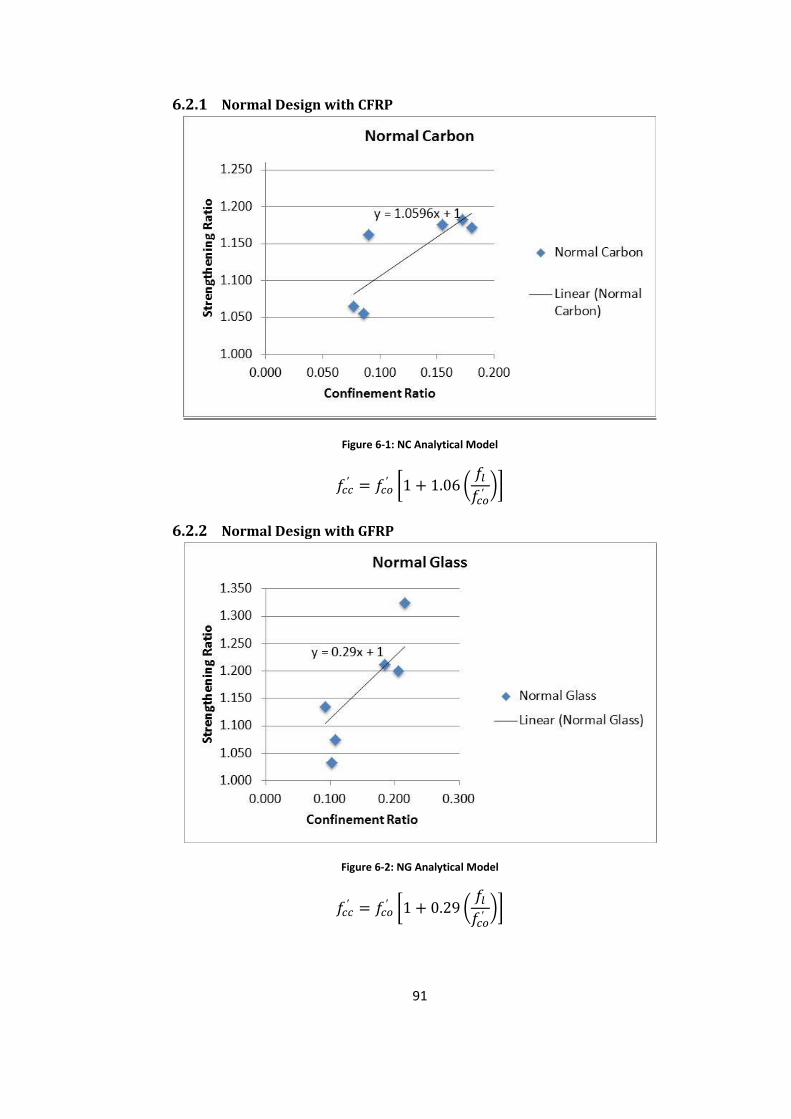
91
6.2.1 Normal Design with CFRP
Figure 6-1: NC Analytical Model
[ ( )]
6.2.2 Normal Design with GFRP
Figure 6-2: NG Analytical Model
[ ( )]
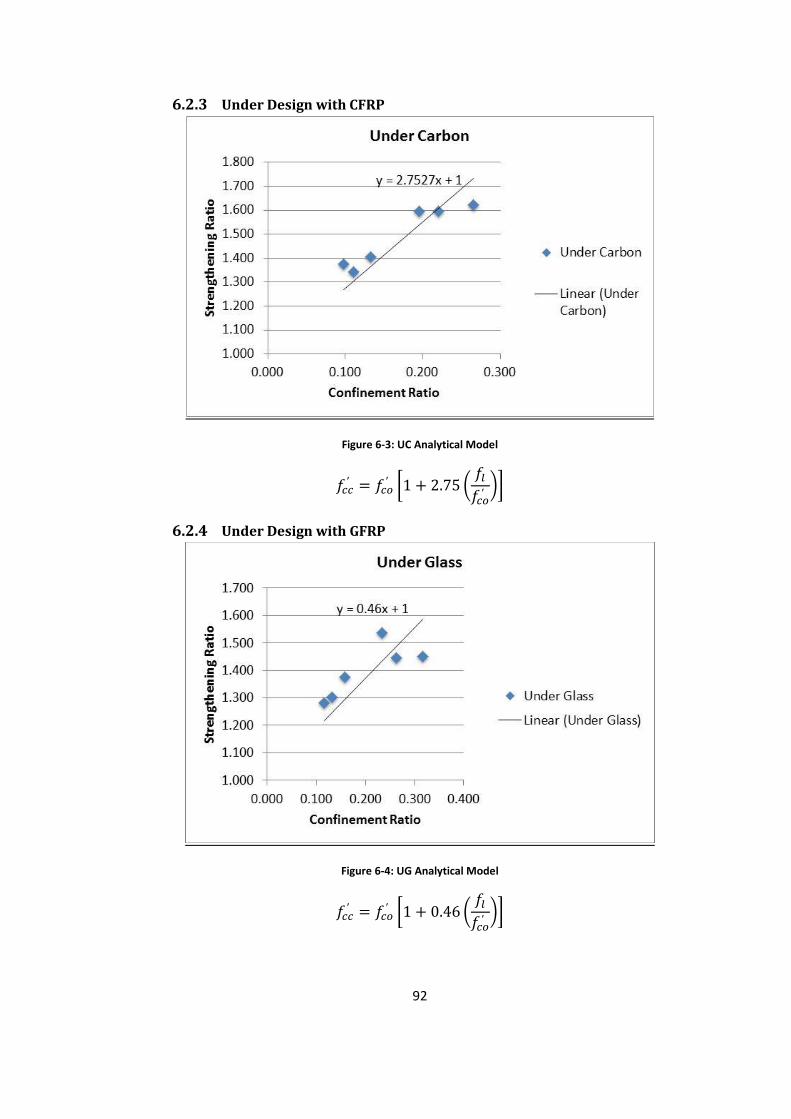
92
6.2.3 Under Design with CFRP
Figure 6-3: UC Analytical Model
[ ( )]
6.2.4 Under Design with GFRP
Figure 6-4: UG Analytical Model
[ ( )]
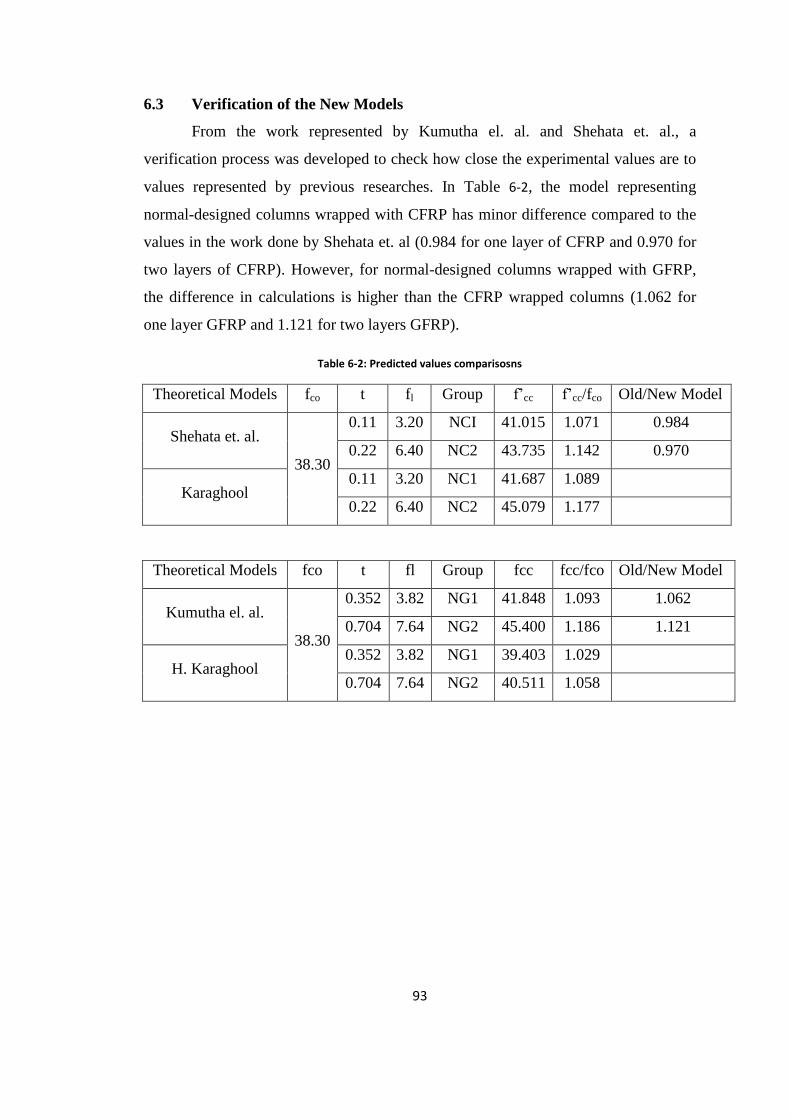
93
6.3 Verification of the New Models
From the work represented by Kumutha el. al. and Shehata et. al., a
verification process was developed to check how close the experimental values are to
values represented by previous researches. In Table 6-2, the model representing
normal-designed columns wrapped with CFRP has minor difference compared to the
values in the work done by Shehata et. al (0.984 for one layer of CFRP and 0.970 for
two layers of CFRP). However, for normal-designed columns wrapped with GFRP,
the difference in calculations is higher than the CFRP wrapped columns (1.062 for
one layer GFRP and 1.121 for two layers GFRP).
Table 6-2: Predicted values comparisosns
Theoretical Models fco t fl Group f’cc f’cc/fco Old/New Model
Shehata et. al.
38.30
0.11 3.20 NCI 41.015 1.071 0.984
0.22 6.40 NC2 43.735 1.142 0.970
Karaghool 0.11 3.20 NC1 41.687 1.089
0.22 6.40 NC2 45.079 1.177
Theoretical Models fco t fl Group fcc fcc/fco Old/New Model
Kumutha el. al.
38.30
0.352 3.82 NG1 41.848 1.093 1.062
0.704 7.64 NG2 45.400 1.186 1.121
H. Karaghool 0.352 3.82 NG1 39.403 1.029
0.704 7.64 NG2 40.511 1.058
94
CHAPTER 7 SUMMARY OF RESULTS
7.1 Summary of the Lab Work
A complete matrix of 30 reinforced concrete columns was prepared in the lab.
These columns were divided into two groups. The first group was designed to have
the minimum number of transverse reinforcement while the other group was designed
to have 50% less transverse reinforcement (less than the minimum requirement by the
ACI-318 code).
Each group was further divided into five categories: three columns were
treated as control columns, three columns were wrapped with one layer of CFRP,
three columns were wrapped with two layers of CFRP, three columns were wrapped
with one layer of GFRP, and the remaining three columns were wrapped with two
layers of GFRP.
Upon casting, all edges were rounded in order to remove the stress
concentration and make the confinement as strong as possible. Following the edge
rounding process, epoxy resins were made and, lastly, all wraps were attached to the
column to be prepared for testing.
7.2 Summary of the Mode of Failure
The previous discussions produced a summary of the mode of failure. Some
groups have one mode of failure while others have more. It was also noted that
debonding failure occurred in NG1 and NG2, while delamination failure occurred in
NC1, UC1 and UC2. The remaining groups suffered from both types of failure. The
site of failures was top of the column, middle of the column, or both. Nevertheless,
the most frequent failure occurred at the top of the column.
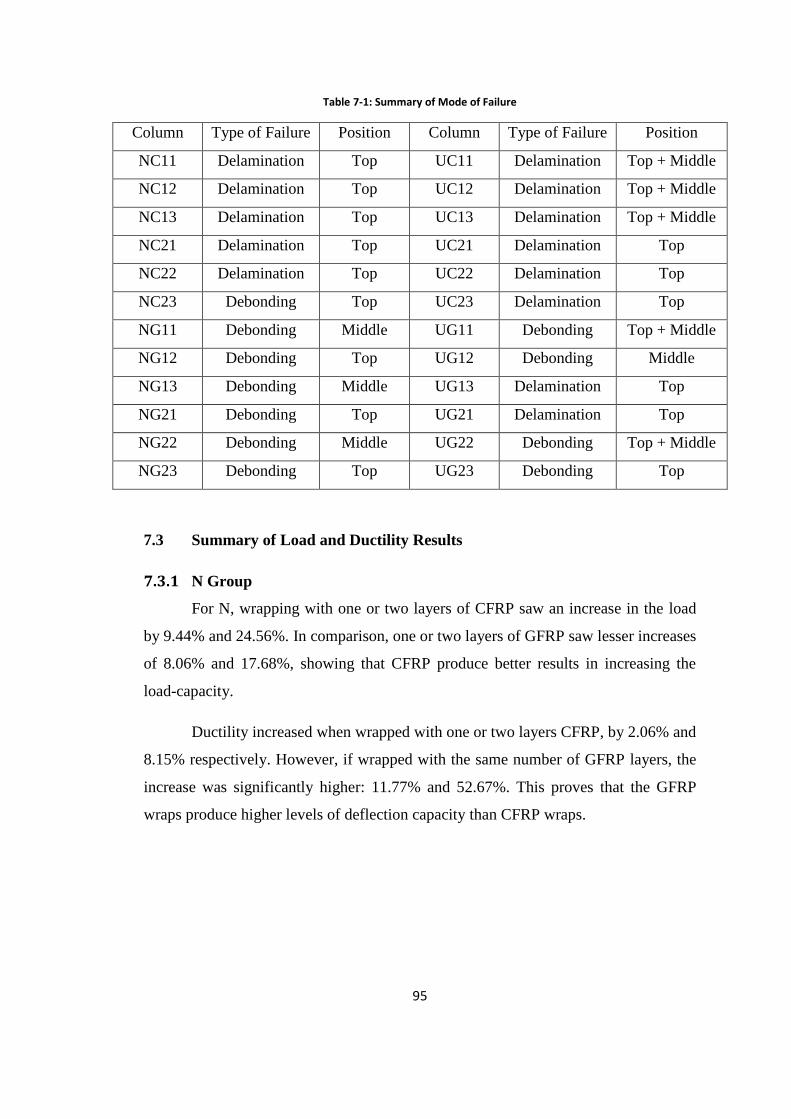
95
Table 7-1: Summary of Mode of Failure
Column Type of Failure Position Column Type of Failure Position
NC11 Delamination Top UC11 Delamination Top + Middle
NC12 Delamination Top UC12 Delamination Top + Middle
NC13 Delamination Top UC13 Delamination Top + Middle
NC21 Delamination Top UC21 Delamination Top
NC22 Delamination Top UC22 Delamination Top
NC23 Debonding Top UC23 Delamination Top
NG11 Debonding Middle UG11 Debonding Top + Middle
NG12 Debonding Top UG12 Debonding Middle
NG13 Debonding Middle UG13 Delamination Top
NG21 Debonding Top UG21 Delamination Top
NG22 Debonding Middle UG22 Debonding Top + Middle
NG23 Debonding Top UG23 Debonding Top
7.3 Summary of Load and Ductility Results
7.3.1 N Group
For N, wrapping with one or two layers of CFRP saw an increase in the load
by 9.44% and 24.56%. In comparison, one or two layers of GFRP saw lesser increases
of 8.06% and 17.68%, showing that CFRP produce better results in increasing the
load-capacity.
Ductility increased when wrapped with one or two layers CFRP, by 2.06% and
8.15% respectively. However, if wrapped with the same number of GFRP layers, the
increase was significantly higher: 11.77% and 52.67%. This proves that the GFRP
wraps produce higher levels of deflection capacity than CFRP wraps.
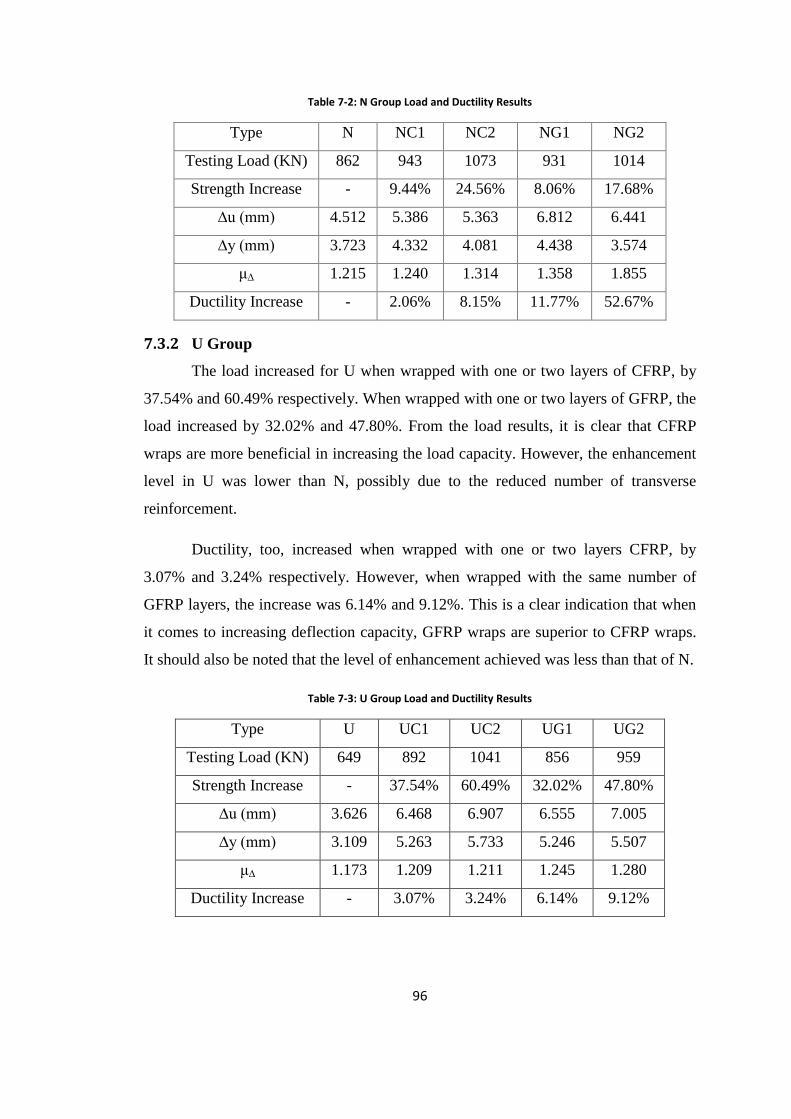
96
Table 7-2: N Group Load and Ductility Results
Type N NC1 NC2 NG1 NG2
Testing Load (KN) 862 943 1073 931 1014
Strength Increase - 9.44% 24.56% 8.06% 17.68%
∆u (mm) 4.512 5.386 5.363 6.812 6.441
∆y (mm) 3.723 4.332 4.081 4.438 3.574
μ∆ 1.215 1.240 1.314 1.358 1.855
Ductility Increase - 2.06% 8.15% 11.77% 52.67%
7.3.2 U Group
The load increased for U when wrapped with one or two layers of CFRP, by
37.54% and 60.49% respectively. When wrapped with one or two layers of GFRP, the
load increased by 32.02% and 47.80%. From the load results, it is clear that CFRP
wraps are more beneficial in increasing the load capacity. However, the enhancement
level in U was lower than N, possibly due to the reduced number of transverse
reinforcement.
Ductility, too, increased when wrapped with one or two layers CFRP, by
3.07% and 3.24% respectively. However, when wrapped with the same number of
GFRP layers, the increase was 6.14% and 9.12%. This is a clear indication that when
it comes to increasing deflection capacity, GFRP wraps are superior to CFRP wraps.
It should also be noted that the level of enhancement achieved was less than that of N.
Table 7-3: U Group Load and Ductility Results
Type U UC1 UC2 UG1 UG2
Testing Load (KN) 649 892 1041 856 959
Strength Increase - 37.54% 60.49% 32.02% 47.80%
∆u (mm) 3.626 6.468 6.907 6.555 7.005
∆y (mm) 3.109 5.263 5.733 5.246 5.507
μ∆ 1.173 1.209 1.211 1.245 1.280
Ductility Increase - 3.07% 3.24% 6.14% 9.12%
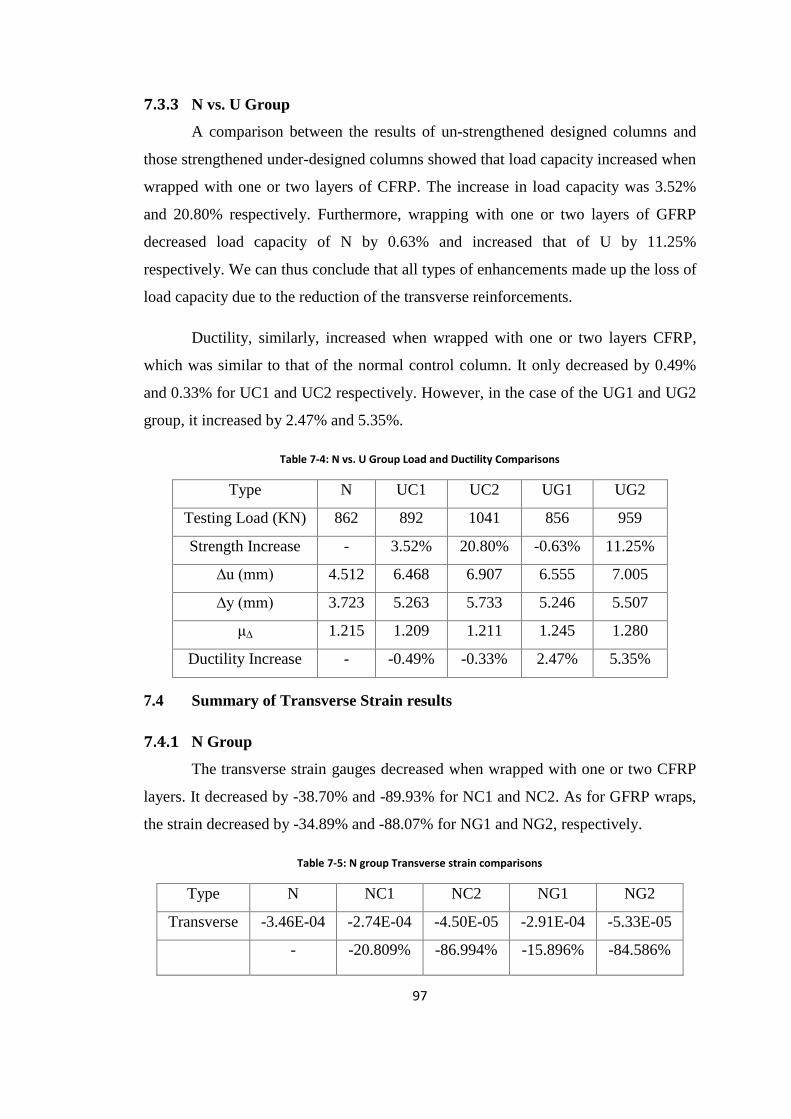
97
7.3.3 N vs. U Group
A comparison between the results of un-strengthened designed columns and
those strengthened under-designed columns showed that load capacity increased when
wrapped with one or two layers of CFRP. The increase in load capacity was 3.52%
and 20.80% respectively. Furthermore, wrapping with one or two layers of GFRP
decreased load capacity of N by 0.63% and increased that of U by 11.25%
respectively. We can thus conclude that all types of enhancements made up the loss of
load capacity due to the reduction of the transverse reinforcements.
Ductility, similarly, increased when wrapped with one or two layers CFRP,
which was similar to that of the normal control column. It only decreased by 0.49%
and 0.33% for UC1 and UC2 respectively. However, in the case of the UG1 and UG2
group, it increased by 2.47% and 5.35%.
Table 7-4: N vs. U Group Load and Ductility Comparisons
Type N UC1 UC2 UG1 UG2
Testing Load (KN) 862 892 1041 856 959
Strength Increase - 3.52% 20.80% -0.63% 11.25%
∆u (mm) 4.512 6.468 6.907 6.555 7.005
∆y (mm) 3.723 5.263 5.733 5.246 5.507
μ∆ 1.215 1.209 1.211 1.245 1.280
Ductility Increase - -0.49% -0.33% 2.47% 5.35%
7.4 Summary of Transverse Strain results
7.4.1 N Group
The transverse strain gauges decreased when wrapped with one or two CFRP
layers. It decreased by -38.70% and -89.93% for NC1 and NC2. As for GFRP wraps,
the strain decreased by -34.89% and -88.07% for NG1 and NG2, respectively.
Table 7-5: N group Transverse strain comparisons
Type N NC1 NC2 NG1 NG2
Transverse -3.46E-04 -2.74E-04 -4.50E-05 -2.91E-04 -5.33E-05
- -20.809% -86.994% -15.896% -84.586%
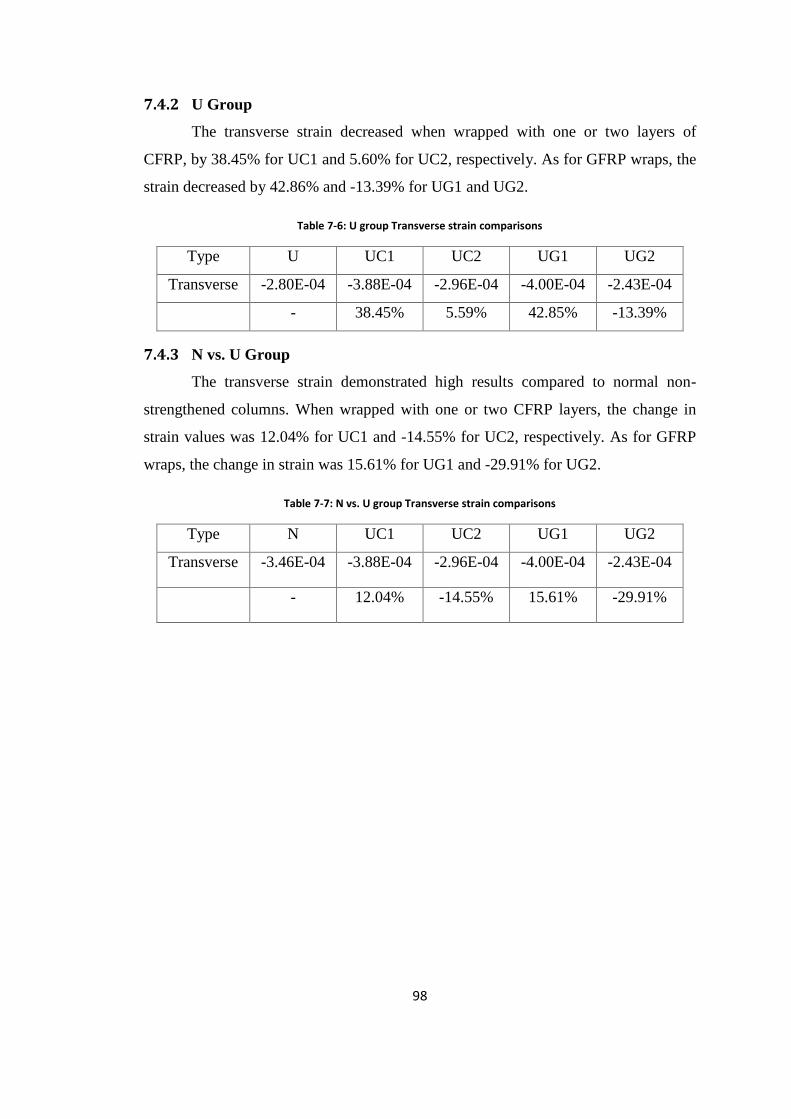
98
7.4.2 U Group
The transverse strain decreased when wrapped with one or two layers of
CFRP, by 38.45% for UC1 and 5.60% for UC2, respectively. As for GFRP wraps, the
strain decreased by 42.86% and -13.39% for UG1 and UG2.
Table 7-6: U group Transverse strain comparisons
Type U UC1 UC2 UG1 UG2
Transverse -2.80E-04 -3.88E-04 -2.96E-04 -4.00E-04 -2.43E-04
- 38.45% 5.59% 42.85% -13.39%
7.4.3 N vs. U Group
The transverse strain demonstrated high results compared to normal non-
strengthened columns. When wrapped with one or two CFRP layers, the change in
strain values was 12.04% for UC1 and -14.55% for UC2, respectively. As for GFRP
wraps, the change in strain was 15.61% for UG1 and -29.91% for UG2.
Table 7-7: N vs. U group Transverse strain comparisons
Type N UC1 UC2 UG1 UG2
Transverse -3.46E-04 -3.88E-04 -2.96E-04 -4.00E-04 -2.43E-04
- 12.04% -14.55% 15.61% -29.91%

99
Conclusion
Experimental results for short reinforced concrete column wrapped with CFRP
or GFRP materials were presented in this research where square concrete specimens
were also confined with either carbon or glass fiber wraps. This was done in order to
examine the effects of confinement on load and ductility. Upon analysis and
monitoring the results, the following conclusions were drawn:
External confinement with CFRP or GFRP materials significantly increases
the load and ductility of the normal-design specimen under axial loading.
The results of materials tested demonstrated that CFRP materials produce the
largest lateral confinement pressure to column specimens. However, GFRP
materials produce a higher enhancement in ductility.
Excessive confinement leads to sudden and destructive compressive failures,
which are to be avoided at all costs.
Externally confined concrete column can potentially undergo large
deformations without complete failure.
And finally, external confinement enhances the loss in the transverse strain.
Proposed Future Work
With the significant outcomes derived from this research, there is potential for
an even more beneficial implementation of these outcomes through an expansion of
the research area. To do so, the following suggestions ought to be taken into
consideration:
Investigating the contribution of AFRP, steel and aluminum when defined as a
wrapping material.
Replacing the transverse reinforcement with aluminum reinforcement.
Increasing the radius of the edge-curved columns in order to relate it with the
compressive strength.
100
References
[1] GangaRao, H. V. S., Taly, N., and Vijay, P. V., Reinforced Concrete Design with FRP
Composites, New York: CRC Press, 2007, pp. 85-91.
[2] [Online]. Available: http://www.fibermaxcomposites.com/shop/images/K300T2.jpg.
[3] [Online]. Available: https://carbonsales.com/images/C/%2361052-50.jpg.
[4] [Online]. Available:
http://www.rubbersealing.com/TCI/images/upload/Image/Texturized%20Glass%20Fiber
%20Cloth.jpg.
[5] American Concrete Institute, ACI 440.2R-08: Guide for the Design and Construction of
Externally Bonded FRP Systems for Strengthening Concrete Structures, Farmington Hill,
MI: ACI Committee 440, 2008.
[6] Adams, P., "Glass corrosion A record of the past? A predictor of the future?," Journal of
Non-Crystalline Solids, vol. 67, no. 1-3, pp. 193-205, September 1984.
[7] Springer, G.S., Environmental effects on composite materials, 3rd ed., Lancaster, PA:
Technomic Publishing Company, 1988.
[8] Parkyn, B., Encyclopedia of Polymer Science and Engineering, 2nd ed., London: John
Wiley & Sons, 1985.
[9] Rao, R.M.G.K.; Balasubramanian, N.; Chanda, M., "Factors Effecting Moisture Absorption
in polymer composties. Part II: Inluence of External Factors," Journal of Reinforced
Plastics and Composites, vol. 3, no. 3, pp. 246-253, July 1984.
[10
]
Allred, R.E., "The Effect of Temperature and Moisture Content on the Flexural Response
of Kevlar/Epoxy Laminates: Part II. [45/0/90] Filament Orientation," Environemental
Effects on Composite Materials, pp. 100-116, March 1984.
[11
]
Devalapura, R.K.; Greenwood, M.E.; Gauchel,, J.V.; Humphrey, T.J., "Evaluation of GFRP
performance using accelerated test methods," in Proc. CDCC 98, Québec, Canada, 1998.
[12
]
Katz, A.; Berman, N.; Bank, L.C., "Effect of cyclic loading and elevated temperature on
the bond properties of FRP rebars," in Proc. CDCC 98, Québec, Canada, 1998.
[13
]
Prichard, G.; Speake, S.D., "Effects of temperature on stress-rapture times in
glass/polyester laminates," Composites, vol. 19, no. 1, pp. 29-35, 1988.
[14 GangaRao, H.V.S.; Vijay, P.V.; Gupta, R.K.; and Barbero, E, "Mechanical-hygrotheramal

101
] responses and predictive models for FRP composites," 2001.
[15
]
Duta, P.K.; Hui, D.; Prasad, Y., "Influence of subfreezing temperatures on the flexural
behavior of thick composites," in 2nd Biennial European Joint Conf. Eng. Sys. Des. Analy.
(ESDA), London, England, 1994.
[16
]
Ballinger, C.; Maeda, T.; Hoshijima, T., "Strengthening of Reinforced Concrete chimneys,
columns and beams with carbon fiber reinforced plastics," in International Symposium
on Fiber-Reinforced-Plastic Reinforcements for Concrete Structures, 1993.
[17
]
Demers, M.; Neale, K. W., "Confinement of Reinforced concrete columns with fiber-
reinforced composites sheets-an experimental study," Canadian Journal of Civil
Engineering, vol. 26, pp. 226-241, 1999.
[18
]
Fardis, M.N.; Khalili, H., "Concrete encased in fiberglass-reinforced plastic," American
Concrete Institute (ACI), vol. 78, no. 6, pp. 440-446, 1981.
[19
]
Fardis, M.N.; Khalili, H., "FRP-encased concrete as a structural material," Magazine of
Concrete Research, vol. 34, no. 121, pp. 191-202, 1982.
[20
]
American Concrete Institute, ACI 440R-96: State-of-the-art report on fiber reinforced
plastics (FRP) reinforcement for concrete structures, Michigan, USA: Farmington Hills,
1996.
[21
]
Nanni, A; Norris, M. S, "FRP jacketed concrete under flexure and combined flexure-
compression," Construction and Building Materials, vol. 9, no. 5, pp. 273-281, 1995.
[22
]
Ohno, S.; Miyauchi, Y.; Kei, T.; Higashibata, Y., "Bond properties of CFRP plate joint," in
Non-Metallic (FRP) Reinforcement for Concrete Structures, Proceeding of the Third
International Symposium, Sapporo, Japan, 1997.
[23
]
Xiao, Y.; Ma, R., "Seismic retrofit of RC circular columns using prefabricated composite
jacketing," Journal of Structural Engineering, ASCE, vol. 123, no. 10, pp. 1357-1364,
1997.
[24
]
Teng, J. G.; Chen, J. F.; Smith, S. T.; Lam, L., FRP-Strengthened RC Structures, West
Sussex, England: Wiley, 2002.
[25
]
Mirmiran, A.; Shahawy, M.; Samaan, M.; El Echary, H., "Effect of column parameters of
FRP-confined concrete," Journal of Composites for Construction, ASCE, vol. 2, no. 4, pp.
175-185, 1998.
[26
]
Rochette, P.; Labossiere, P., "Axial testing of rectangular columns models confiend with
composites," Journal of Composites for Construction, ASCE, vol. 4, no. 3, pp. 129-136,
102
2000.
[27
]
Xiao, Y.; Wu, H., "Compressive behavior of concrete confined by carbon fiber composites
jackets," Journal of Materials in Civil Engineering, ASCE, vol. 12, no. 2, pp. 139-146, 2000.
[28
]
Wu, G.; Lu, Z.T.; Wu, Z.S., "Strength and ductility of concrete cylinders confined with FRP
composites," Journal of Construction and Building Materials, vol. 20, no. 3, pp. 134-148,
2006.
[29
]
Wei, Hua; Wu, Zhimin; Guo, Xia; Yi, Fumin, "Experimental study on partially deteriorated
strength concrete columns confined with CFRP," Engineering Structures, vol. 31, pp.
2495-2505, 2009.
[30
]
Kumutha, R.; Vaidyanathan, R.; and Palanichamy, M.S., "Behavior of reinforced concrete
rectangular columns strengthened using GFRP," Cement & Concrete Composites, vol. 29,
no. 8, pp. 609-615, Septemeber 2007.
[31
]
Hadi, M.N.S., "Comparative study of eccentrically loaded FRP wrapped columns,"
Composite Structures, vol. 74, no. 2, pp. 127-135, July 2006.
[32
]
Chaallal, Omar; shahawy, Mohsen; Hassan, Munzer, "Performance of Axially Loaded
Short Rectangular Columns Strengthened with Fiber Reinforced Polymer Wrapping,"
Journal of Composites for Construction, vol. 7, no. 3, pp. 200-208, 2003.
[33
]
Silva, Manuel A.G., "Behavior of square and circular columns strengthened with aramidic
or carbon fibers," Construction and Building Materials, vol. 25, no. 8, pp. 3222-3228,
2011.
[34
]
Toutanji, H.; and Deng, Y., "Strength and durability performance of concrete axially
loaded members confined with AFRP composites sheets," Composites Part B:
Engineering, vol. 33, no. 4, pp. 255-261, June 2002.
[35
]
Wei, H.; Wu, Z.; Guo, X.; and Yi, F., "Experimental Study in partially deteriorated strength
concrete columns confined with CFRP," Engineering Structures, vol. 21, no. 10, pp. 2495-
2505, October 2009.
[36
]
El-Hacha, R.; Green, M.F; and Wight, G. R., "Effect of Severe Environmental Exposures on
CFRP," Journal of Composites for Construction, vol. 14, no. 1, pp. 83-93,
January/February 2010.
[37
]
GRP Tubing(PTY) Ltd., [Online]. Available:
http://grptubing.com/index.php?option=com_content&view=article&id=50&Itemid=10
9. [Accessed 12 December 2011].
[38 Pessiki, S.; Harris, K. ; Kestner, J. ; Sause, R. ; and Ricles, J.M., "The Axial Behaviour of
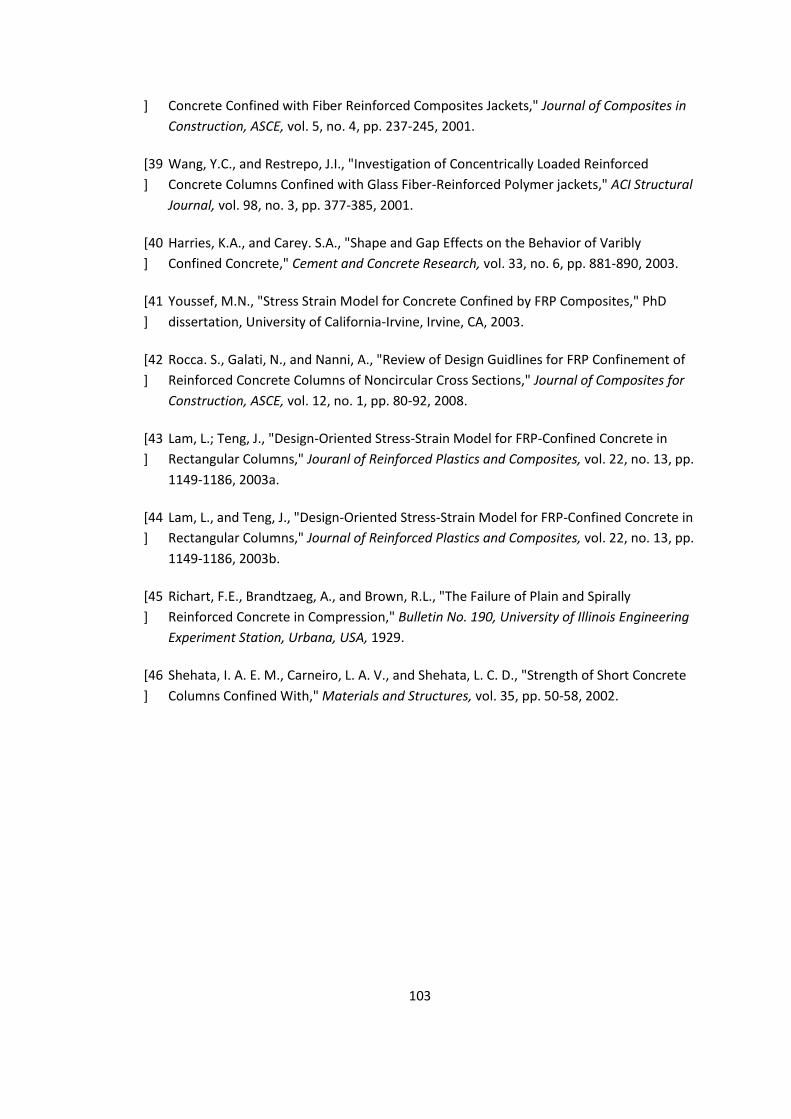
103
] Concrete Confined with Fiber Reinforced Composites Jackets," Journal of Composites in
Construction, ASCE, vol. 5, no. 4, pp. 237-245, 2001.
[39
]
Wang, Y.C., and Restrepo, J.I., "Investigation of Concentrically Loaded Reinforced
Concrete Columns Confined with Glass Fiber-Reinforced Polymer jackets," ACI Structural
Journal, vol. 98, no. 3, pp. 377-385, 2001.
[40
]
Harries, K.A., and Carey. S.A., "Shape and Gap Effects on the Behavior of Varibly
Confined Concrete," Cement and Concrete Research, vol. 33, no. 6, pp. 881-890, 2003.
[41
]
Youssef, M.N., "Stress Strain Model for Concrete Confined by FRP Composites," PhD
dissertation, University of California-Irvine, Irvine, CA, 2003.
[42
]
Rocca. S., Galati, N., and Nanni, A., "Review of Design Guidlines for FRP Confinement of
Reinforced Concrete Columns of Noncircular Cross Sections," Journal of Composites for
Construction, ASCE, vol. 12, no. 1, pp. 80-92, 2008.
[43
]
Lam, L.; Teng, J., "Design-Oriented Stress-Strain Model for FRP-Confined Concrete in
Rectangular Columns," Jouranl of Reinforced Plastics and Composites, vol. 22, no. 13, pp.
1149-1186, 2003a.
[44
]
Lam, L., and Teng, J., "Design-Oriented Stress-Strain Model for FRP-Confined Concrete in
Rectangular Columns," Journal of Reinforced Plastics and Composites, vol. 22, no. 13, pp.
1149-1186, 2003b.
[45
]
Richart, F.E., Brandtzaeg, A., and Brown, R.L., "The Failure of Plain and Spirally
Reinforced Concrete in Compression," Bulletin No. 190, University of Illinois Engineering
Experiment Station, Urbana, USA, 1929.
[46
]
Shehata, I. A. E. M., Carneiro, L. A. V., and Shehata, L. C. D., "Strength of Short Concrete
Columns Confined With," Materials and Structures, vol. 35, pp. 50-58, 2002.
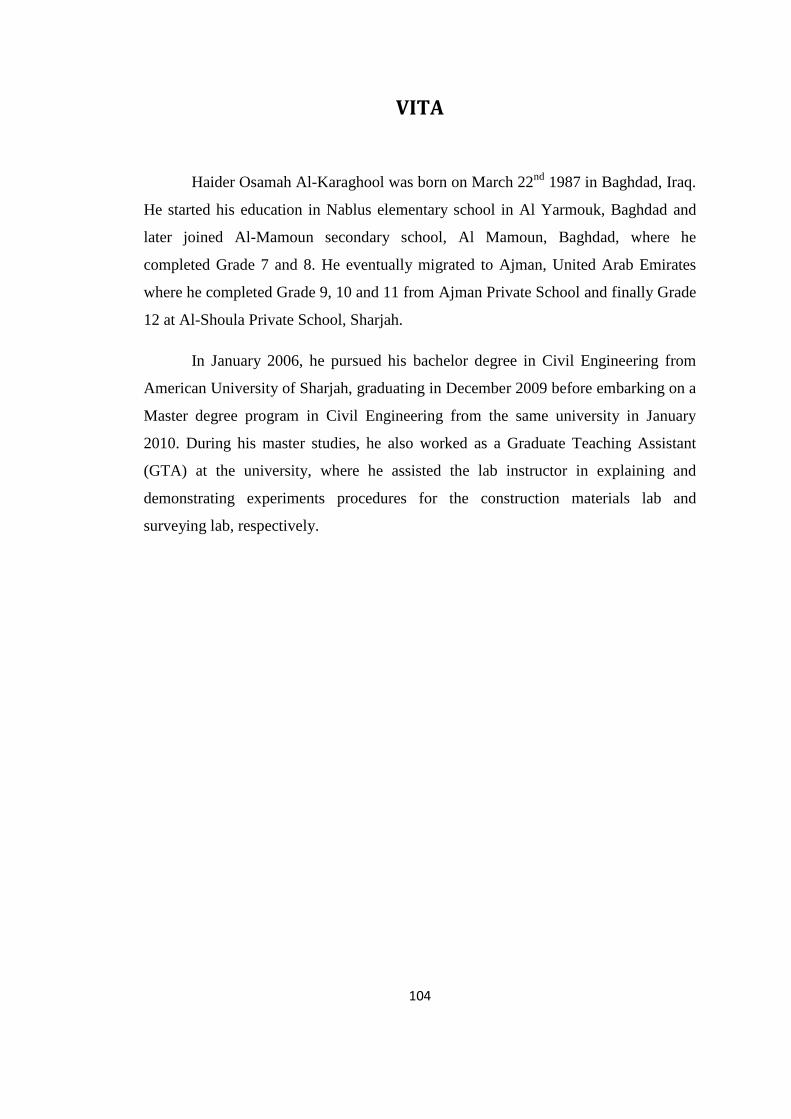
104
VITA
Haider Osamah Al-Karaghool was born on March 22nd
1987 in Baghdad, Iraq.
He started his education in Nablus elementary school in Al Yarmouk, Baghdad and
later joined Al-Mamoun secondary school, Al Mamoun, Baghdad, where he
completed Grade 7 and 8. He eventually migrated to Ajman, United Arab Emirates
where he completed Grade 9, 10 and 11 from Ajman Private School and finally Grade
12 at Al-Shoula Private School, Sharjah.
In January 2006, he pursued his bachelor degree in Civil Engineering from
American University of Sharjah, graduating in December 2009 before embarking on a
Master degree program in Civil Engineering from the same university in January
2010. During his master studies, he also worked as a Graduate Teaching Assistant
(GTA) at the university, where he assisted the lab instructor in explaining and
demonstrating experiments procedures for the construction materials lab and
surveying lab, respectively.
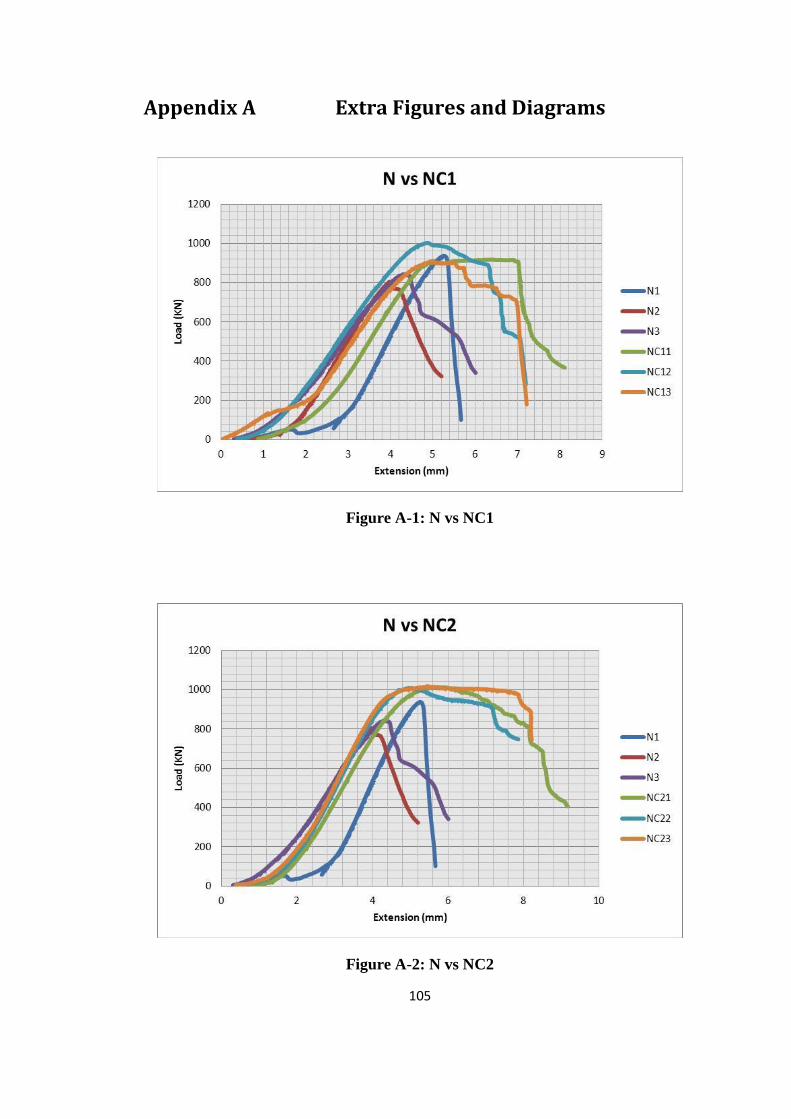
105
Appendix A Extra Figures and Diagrams
Figure A-1: N vs NC1
Figure A-2: N vs NC2
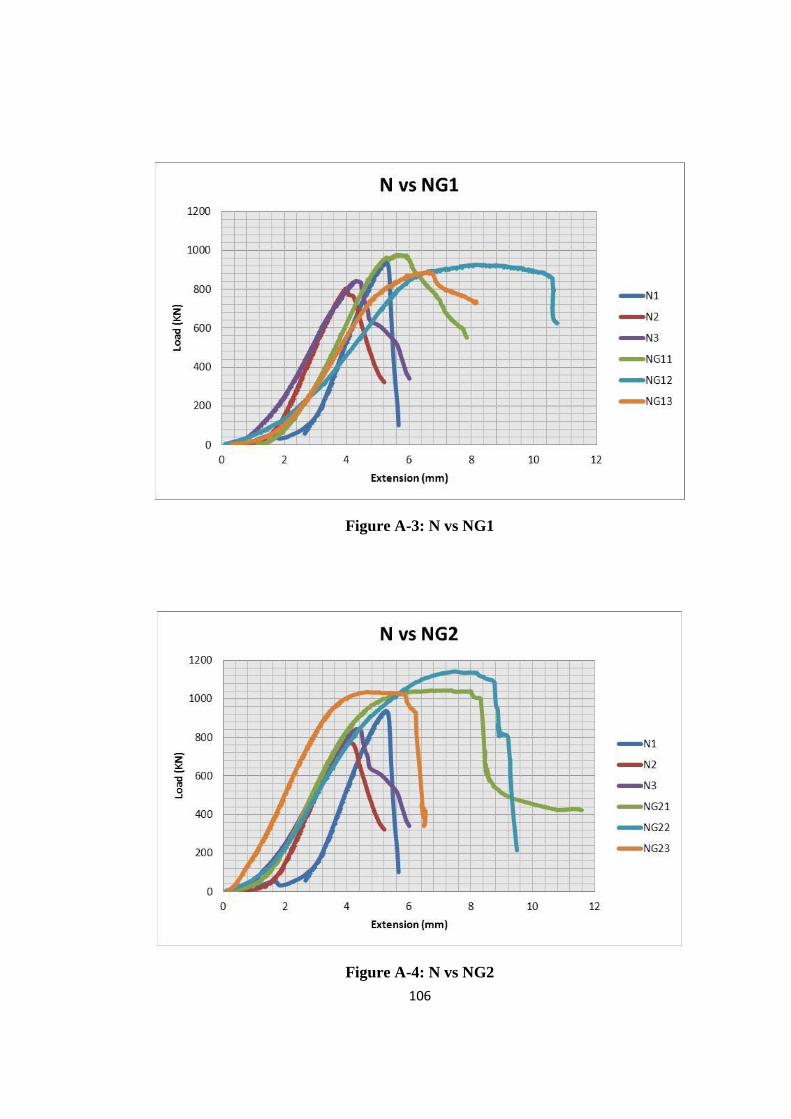
106
Figure A-3: N vs NG1
Figure A-4: N vs NG2
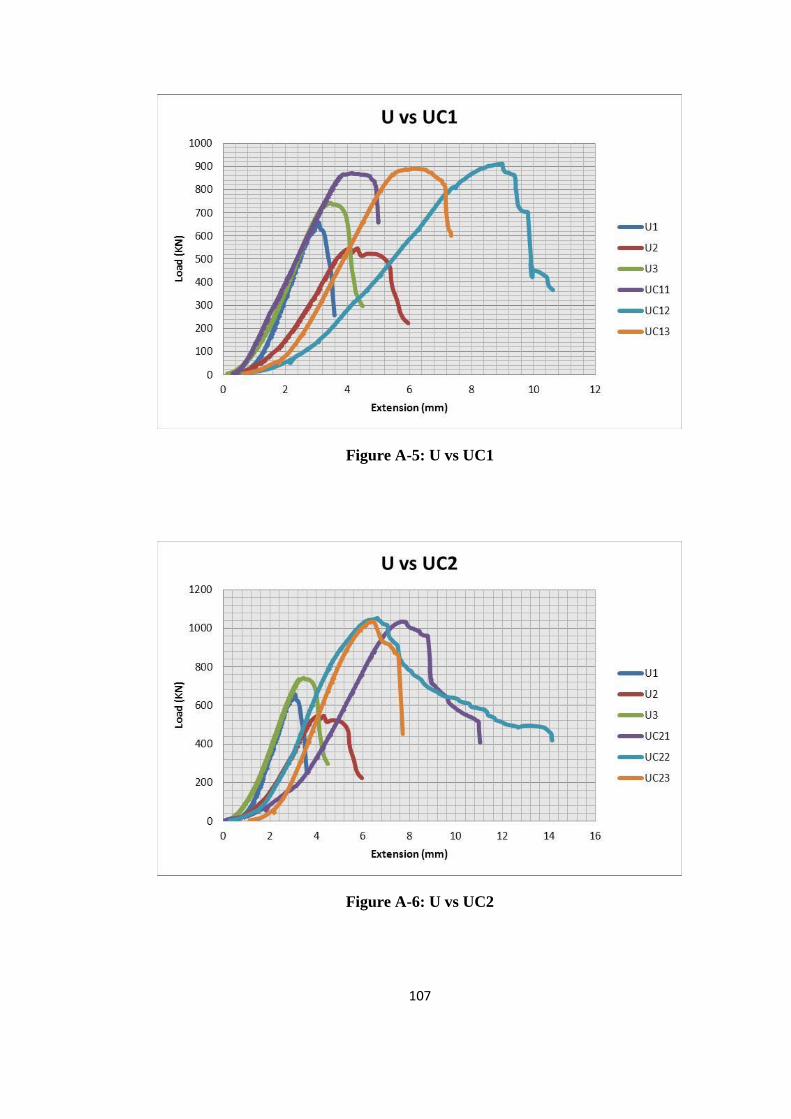
107
Figure A-5: U vs UC1
Figure A-6: U vs UC2
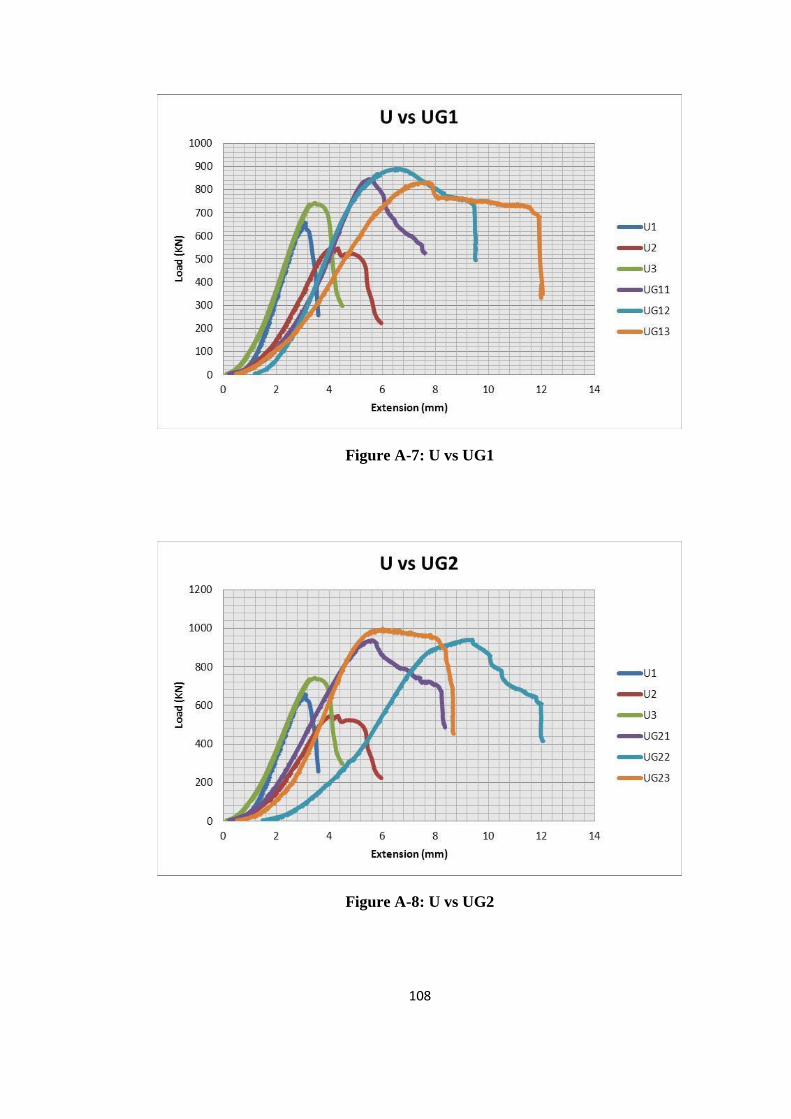
108
Figure A-7: U vs UG1
Figure A-8: U vs UG2

109
Figure A-9: NC1 vs UC1
Figure A-10: NC2 vs UC2
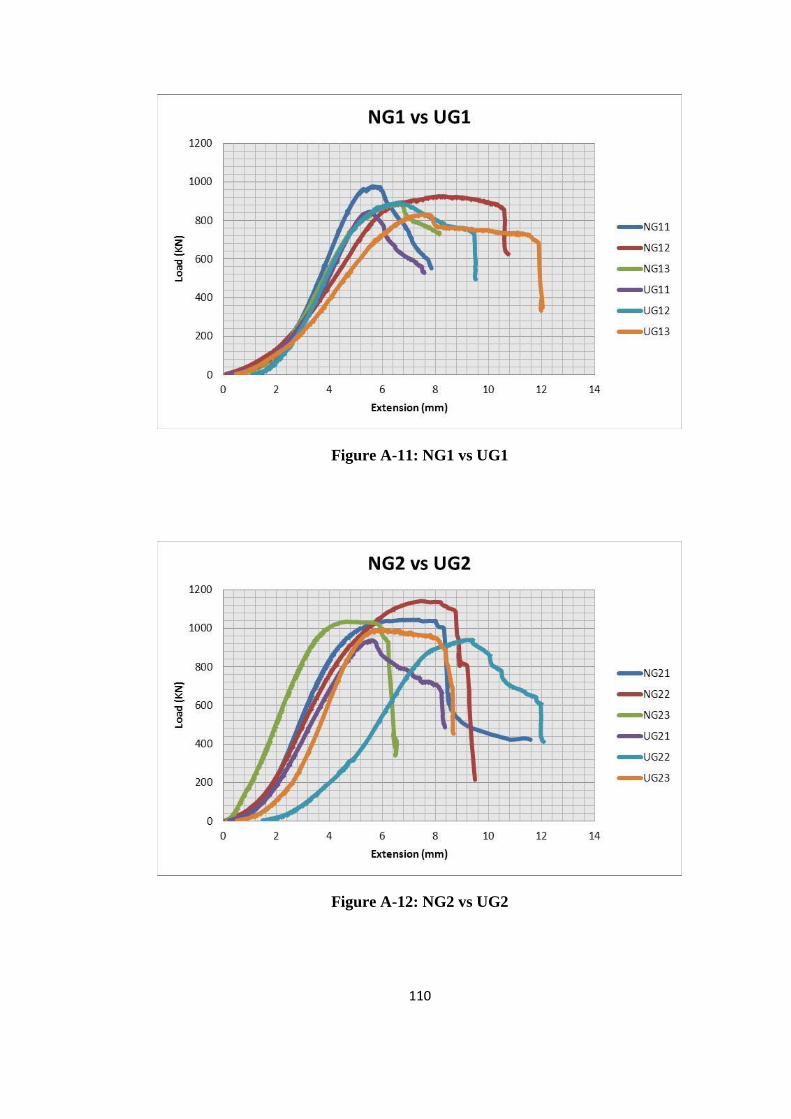
110
Figure A-11: NG1 vs UG1
Figure A-12: NG2 vs UG2
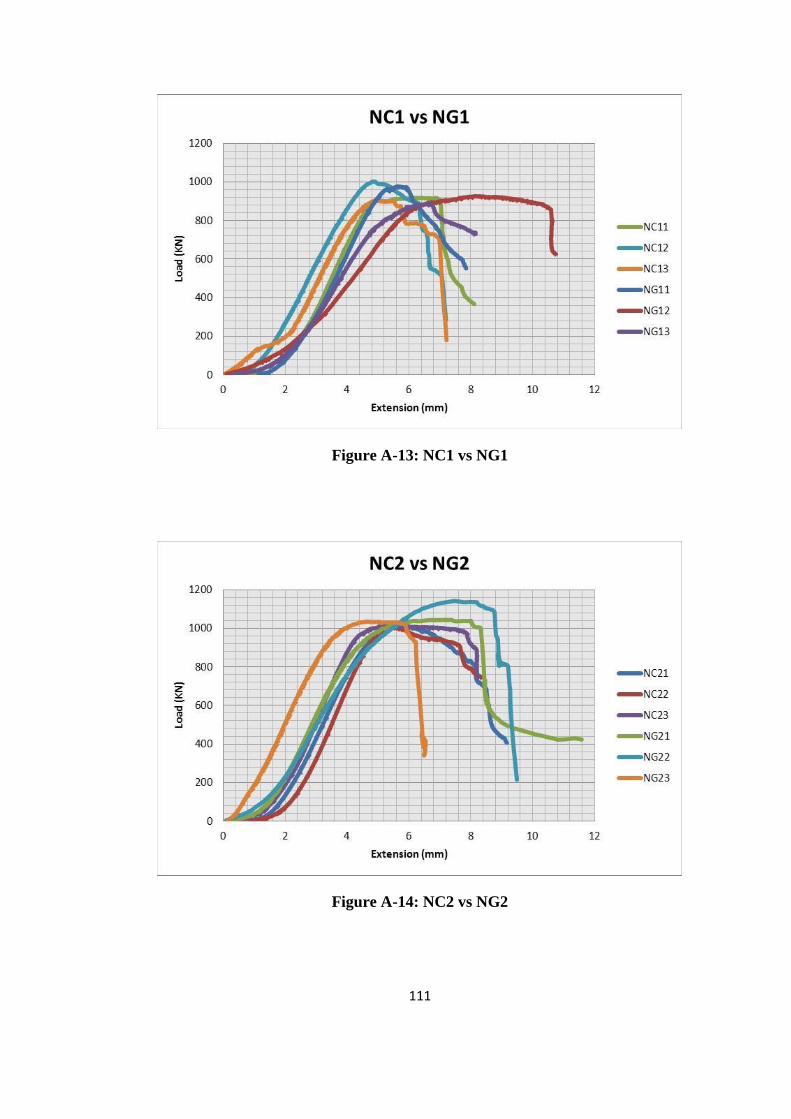
111
Figure A-13: NC1 vs NG1
Figure A-14: NC2 vs NG2

112
Figure A-15: UC1 vs UG1
Figure A-16: UC2 vs UG2

113
Figure A-17: N vs UC1
Figure A-18: N vs UC2
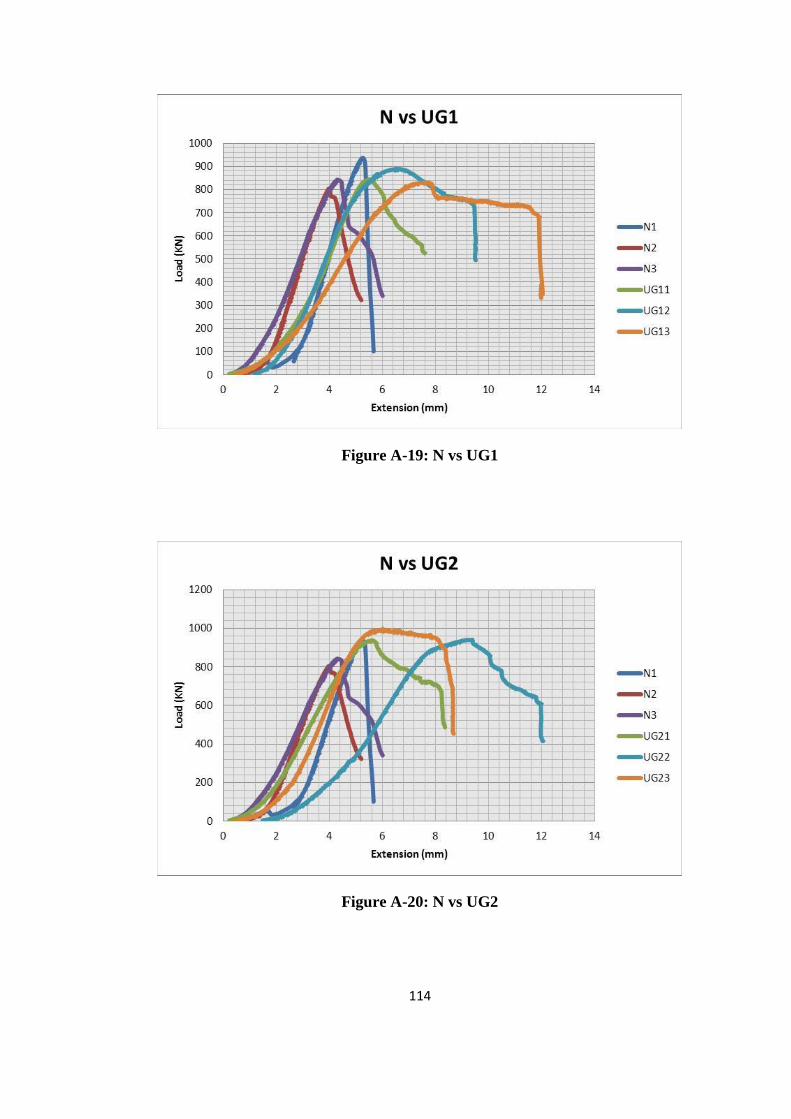
114
Figure A-19: N vs UG1
Figure A-20: N vs UG2
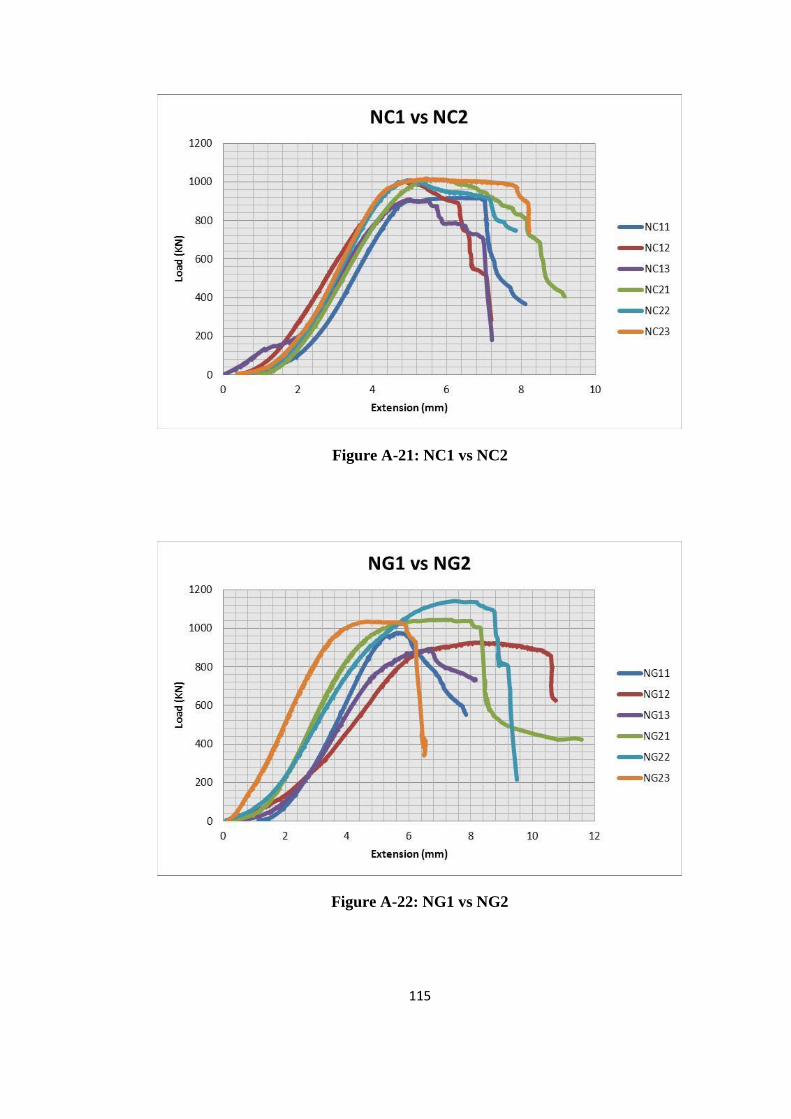
115
Figure A-21: NC1 vs NC2
Figure A-22: NG1 vs NG2
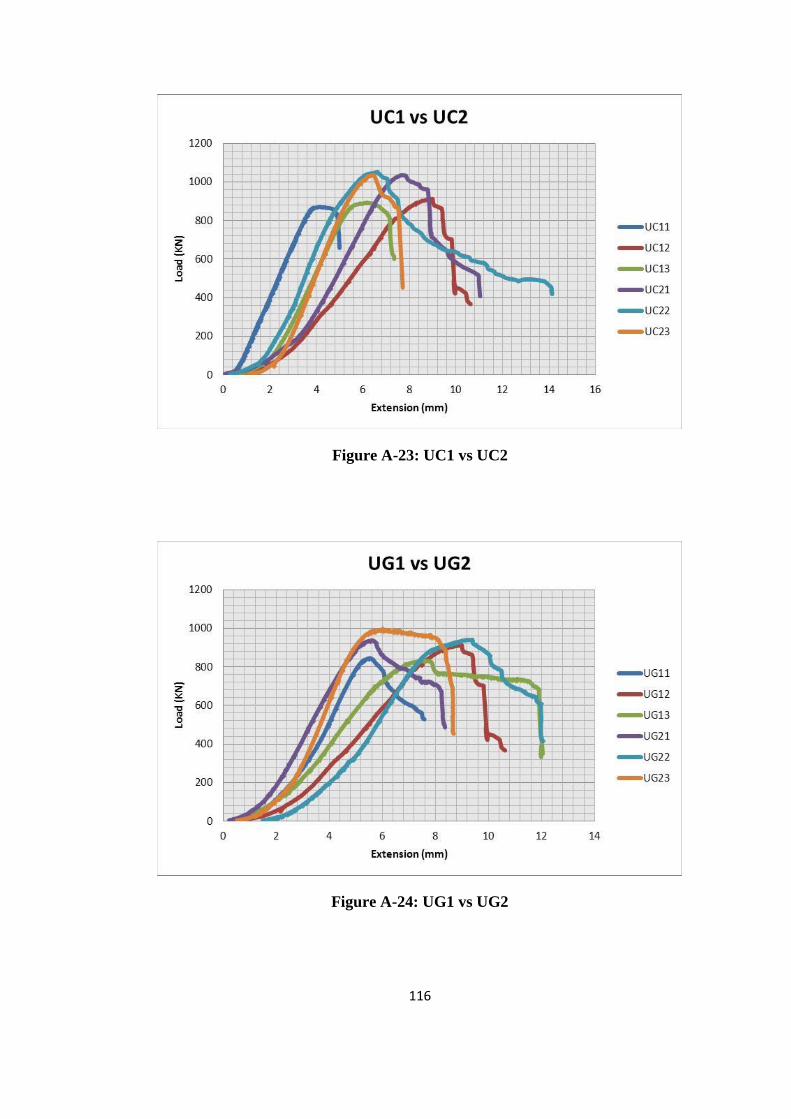
116
Figure A-23: UC1 vs UC2
Figure A-24: UG1 vs UG2
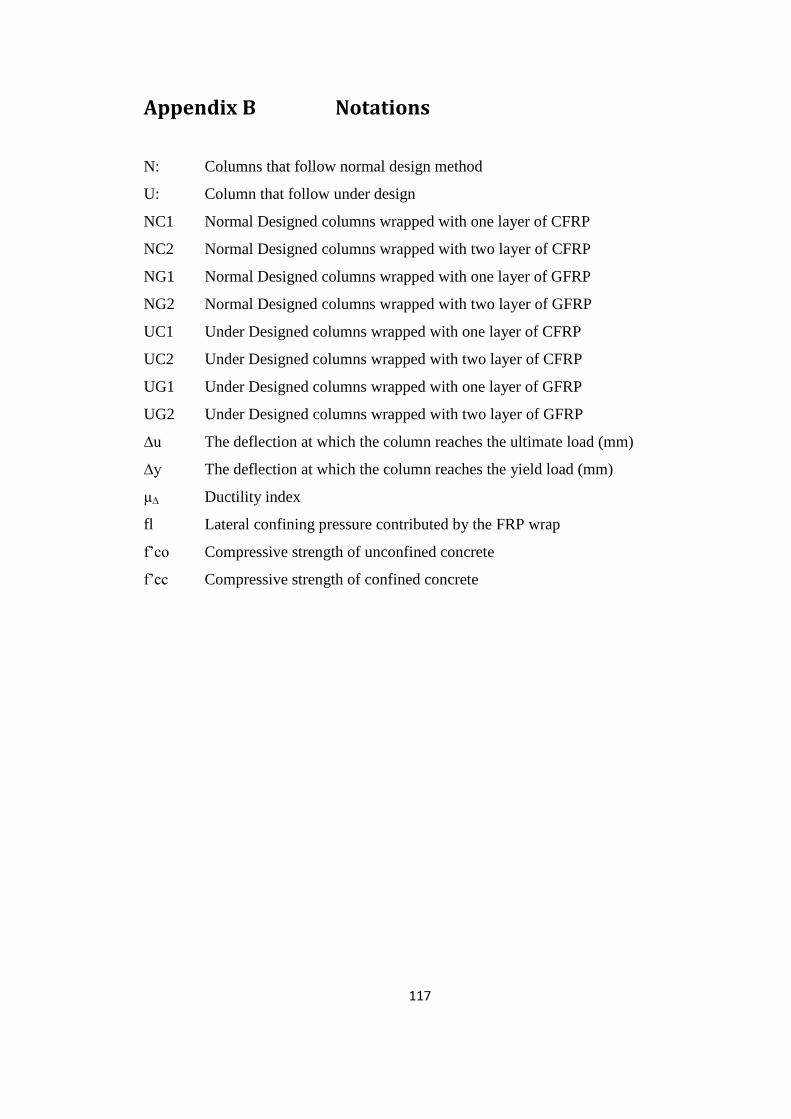
117
Appendix B Notations
N: Columns that follow normal design method
U: Column that follow under design
NC1 Normal Designed columns wrapped with one layer of CFRP
NC2 Normal Designed columns wrapped with two layer of CFRP
NG1 Normal Designed columns wrapped with one layer of GFRP
NG2 Normal Designed columns wrapped with two layer of GFRP
UC1 Under Designed columns wrapped with one layer of CFRP
UC2 Under Designed columns wrapped with two layer of CFRP
UG1 Under Designed columns wrapped with one layer of GFRP
UG2 Under Designed columns wrapped with two layer of GFRP
∆u The deflection at which the column reaches the ultimate load (mm)
∆y The deflection at which the column reaches the yield load (mm)
μ∆ Ductility index
fl Lateral confining pressure contributed by the FRP wrap
f’co Compressive strength of unconfined concrete
f’cc Compressive strength of confined concrete